BLOCK THEORY APPLICATION TO SCOUR ASSESSMENT OF UNLINED ROCK SPILLWAYS - by Michael F. George Nicholas Sitar
←
→
Page content transcription
If your browser does not render page correctly, please read the page content below
BLOCK THEORY APPLICATION TO SCOUR
ASSESSMENT OF UNLINED ROCK SPILLWAYS

                    by

             Michael F. George

               Nicholas Sitar

          Report No. UCB GT 12‐02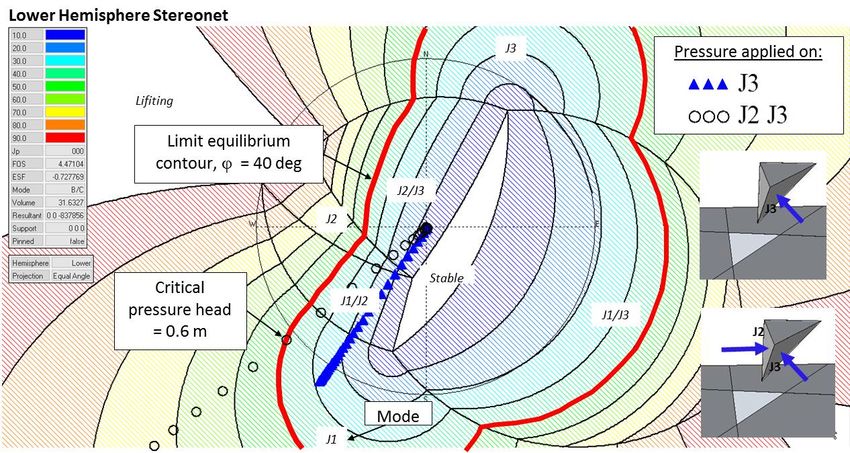
Block Theory Application to Scour
Assessment of Unlined Rock Spillways

                              by

                  Michael F. George
                   Nicholas Sitar

        Department of Civil & Environmental Engineering
                    University of California
                      Berkeley, California
                   Report No. UCB GT 12‐02

                        May 2012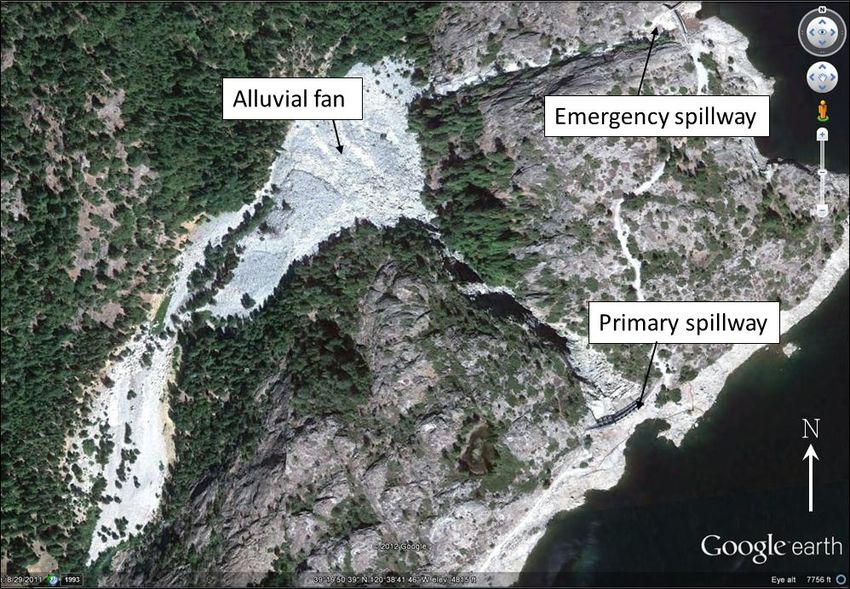
Acknowledgements
The research presented in this report was principally supported by a fellowship from the Hydro
Research Foundation, with additional financial support provided by the University of California. PG&E
generously permitted access to their field site and provided additional data which was not in public
domain. Such commitment to this research is gratefully acknowledged.

This report is based on the CE299 Report “Scour of Discontinuous Blocky Rock” by Michael F. George
(2012) submitted in partial satisfaction of the requirements for the degree of Master of Science and is
part of an ongoing rock scour research study at the University of California – Berkeley.

                                                    i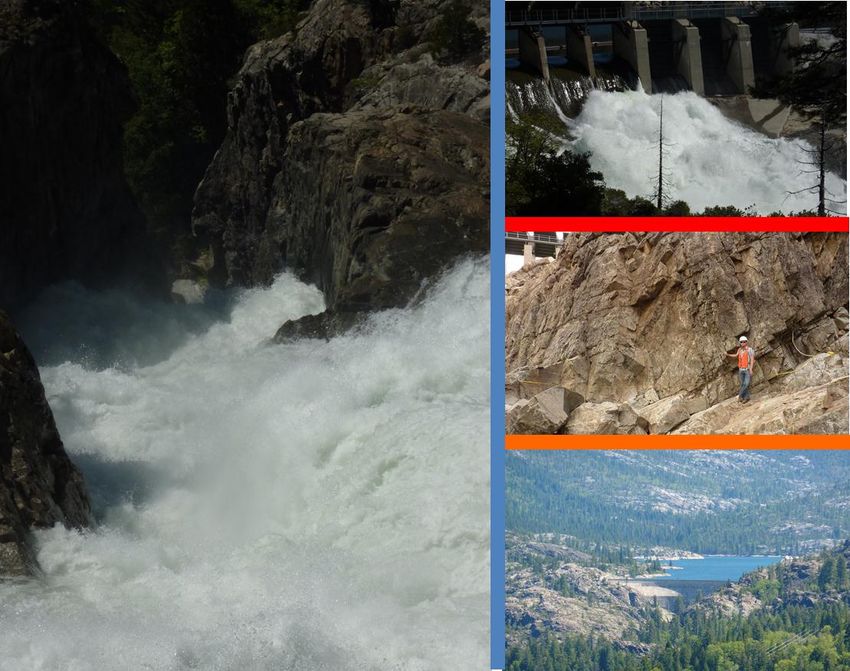
Summary
Scour of rock is a complex process and can be very problematic for dams when excessive scour
threatens dam stability. Removal of individual rock blocks is one of the principal mechanisms by which
scour can occur, particularly in unlined spillways and on dam abutments. Block removability is largely
influenced by the 3D orientation of discontinuities within the rock mass, which current scour methods
tend to ignore or simplify into 2D or cuboidal block geometries. To better represent the 3D structure
of the rock mass, block theory (Goodman & Shi 1985) has been applied to identify removable blocks,
determine potential failure modes, and assess block stability due to hydraulic loads.

Scour assessment was performed for representative size blocks (based on field investigations to
determine average orientation and spacing of rock mass discontinuities) under representative
hydraulic flow conditions. Depending on the turbulent nature of fluid motions in the vicinity of the
rock mass being analyzed, stability of a block can be assessed in a simplified dynamic manner due to a
single characteristic pressure impulse or in a more static sense though limit equilibrium methods (in
the realm that block theory has traditionally been applied). The methodologies developed herein may
be applied to any flow scenario as long as the characteristic hydrodynamic pressure is known.

Key to the analysis is the assumption of the distribution of hydrodynamic pressures on the block faces.
In situations where flow conditions are complex and turbulent (such as plunge pools, rough channel
flows with complex geometries, hydraulic jumps, etc.) it is logical to think that dynamic pressures may
be distributed around the block in many different combinations that continually change over time.
Therefore, hydrodynamic pressures can assumed to be distributed uniformly over any combination of
block faces. For tetrahedral blocks, this yields 15 load scenarios each of which is analyzed to determine
the most critical load causing block removal. For static analysis, this number may be reduced to
account for a preferential loading direction (such as flow in a channel).

Application of the methods was performed for an actively eroding unlined rock spillway at a dam site in
northern California. Ten removable tetrahedral block types were identified from the channel bottom
below the spillway gates. To assess stability, hydraulic pressures applied to the blocks were related to
flow velocity based on a hydraulic jacking study from the USBR (2007). Accordingly, the critical flow
velocity resulting in block removal could be identified, which for this analysis, ranged between 4.4 m/s
and 11.9 m/s. Three of the removable blocks were stable over the entire range of anticipated flow
velocities in the channel.

The variation of results show the influence on discontinuity orientation on block removability and the
need to incorporate the full 3D structure of the rock mass when considering erodibility. Furthermore,
determination of the critical hydraulic load was highly dependent on block shape and orientation of
the block faces. As such, the minimum hydrodynamic pressure causing removal did not usually
produce an active resultant path that was shortest in distance to the limit equilibrium contour line (in

                                                    ii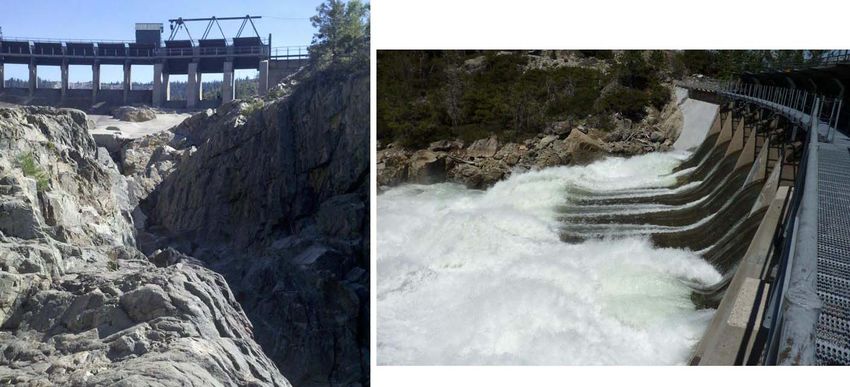
the case of static analysis). Critical resultant paths were influenced by the relative size of the block
faces, with the larger area controlling the direction of block removal.

Overall, the results show that more accurate predictions of scour are achievable as the site‐specific 3D
geologic structure is accounted for. Additionally, with detailed field mapping, blocks most susceptible
to scour can be targeted such that more efficient remediation measures can be implemented thus
potentially reducing costs. Finally, analyses may be used as a planning tool for future projects to
determine the most optimal layout of new spillways, for example, that are least susceptible to scour.

                                                     iii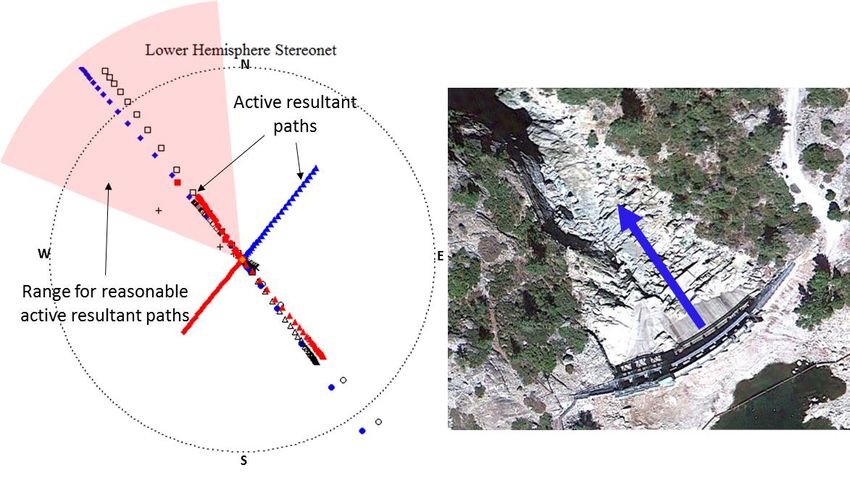
Table of Contents
Acknowledgements...................................................................................................................................... i
Summary ..................................................................................................................................................... ii
Table of Contents ........................................................................................................................................iv
List of Tables ............................................................................................................................................... v
List of Figures .............................................................................................................................................. v
1. Introduction ........................................................................................................................................... 1
2. Background ............................................................................................................................................ 3
   2.1 Scour Mechanisms ....................................................................................................................... 3
   2.2       Existing Scour Prediction Methods .............................................................................................. 5
       2.2.1        Limitations of Existing Scour Models .................................................................................. 14
3. Methodology ........................................................................................................................................ 15
   3.1 Assumptions ............................................................................................................................... 15
   3.2       Removability ............................................................................................................................... 15
   3.3       Kinematic Mode Analysis ........................................................................................................... 16
   3.4       Stability ....................................................................................................................................... 19
       3.4.1        Characteristic Hydrodynamic Pressure ............................................................................... 19
       3.4.2        Hydrodynamic Pressure Distribution on Block ................................................................... 21
       3.4.3        Pseudo‐Static Block Stability ............................................................................................... 21
       3.4.4        Dynamic Block Stability ....................................................................................................... 24
4. Results (Case Study) ............................................................................................................................. 27
   4.1 Project Background .................................................................................................................... 27
   4.2       Field Investigations..................................................................................................................... 29
   4.3       Scour Assessment using Block Theory ....................................................................................... 31
       4.3.1        Removability ....................................................................................................................... 32
       4.3.2        Stability ............................................................................................................................... 32
5. Conclusions .......................................................................................................................................... 37
   5.1 Rock Mass Geometry ................................................................................................................. 37
   5.2       Flow Conditions .......................................................................................................................... 37
   5.3       Hydrodynamic Pressure Distribution on Block .......................................................................... 37
   5.4       Block Stability ............................................................................................................................. 38
   5.5 Implications ................................................................................................................................ 39
6. Recommendations for Further Study .................................................................................................. 40
7. References ............................................................................................................................................ 42
Appendix A: Additional results and calculations ...................................................................................... 45

                                                                              iv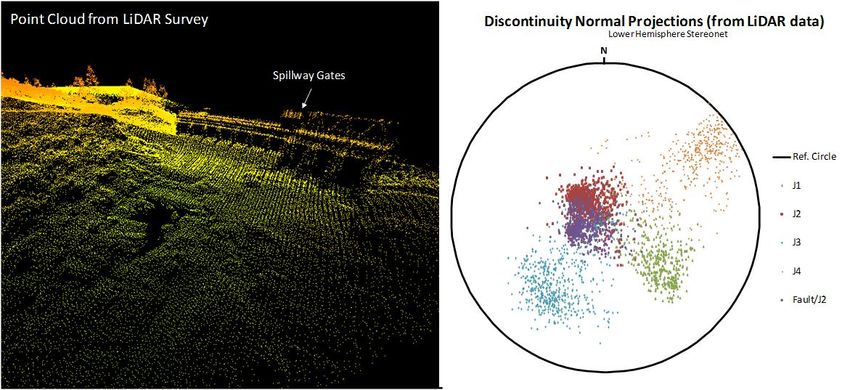
List of Tables
Table 1: Summary of joint data used for block theory analysis. ............................................................................. 30
Table 2: Block stability results summary. ................................................................................................................ 35
List of Figures
Figure 1: Scour from kinematic sliding failure of large rock blocks at Ricobayo Dam (Jan. & Mar. 1934)................ 2
Figure 2: Scour remediation at Ricobayo (note extensive excavation and concrete work in addition to flow
splitters on the spillway lip to dissipate hydraulic energy). ......................................................................... 2
Figure 3: Fracture of intact rock. ............................................................................................................................... 3
Figure 4: Block removal. ............................................................................................................................................ 4
Figure 5: Kinematic block failure modes (Goodman 1995). ...................................................................................... 5
Figure 6: Annandale Erodibility Index graph. ............................................................................................................ 6
Figure 7: Key components of the CSM (Bollaert 2002). ............................................................................................ 7
Figure 8: Bollaert block removal model. ................................................................................................................... 8
Figure 9: Non‐dimensionalized power spectral density vs. frequency curve for pressure measurements at the top
and bottom of a 3D cubic block. Note decline after approximately 10 Hz (Federspiel et al. 2009). .......... 9
Figure 10: Analysis of abutment block due to overtopping jet impact (George & Annandale 2006) ..................... 10
Figure 11: Hydraulic jacking of concrete spillway slabs (USBR, 2007) .................................................................... 11
Figure 12: Block uplift at bridge pier (Bollaert 2010). ............................................................................................. 12
Figure 13: 2D removable blocks in unlined spillway (Wibowo 2009). .................................................................... 13
Figure 14: Numerical simulation of plunge pool scour (Dasgupta et al. 2011) ....................................................... 14
Figure 15: Upper hemisphere stereonet showing JP codes and removable blocks for horizontal free face (left)
and vertical free face striking East‐West (right). ........................................................................................ 16
Figure 16: Characteristic dynamic pressure. ........................................................................................................... 19
Figure 17: Simplification of characteristic dynamic pressure for pseudo‐static (top) & dynamic (bottom) analyses.
.................................................................................................................................................................... 20
Figure 18: Example of vector solution for a removable block with hydraulic load applied to block face J3 and
when applied to faces J2‐J3. ....................................................................................................................... 23
Figure 19: Example of limit equilibrium stereonet for removable block showing resultant paths for hydraulic load
applied to block face J3 and J2‐J3 (stereonet generated with PanTechnica (2002) software). ................. 24
Figure 20: Canyon formed by scour showing spillway gates in background (left). Approximately 2,000 cfs
discharge in June 2010 (right). ................................................................................................................... 28
Figure 21: Aerial view of spillway showing alluvial fan of eroded material (note the walkway across the primary
spillway is approximately 300 ft long for scale). ........................................................................................ 28
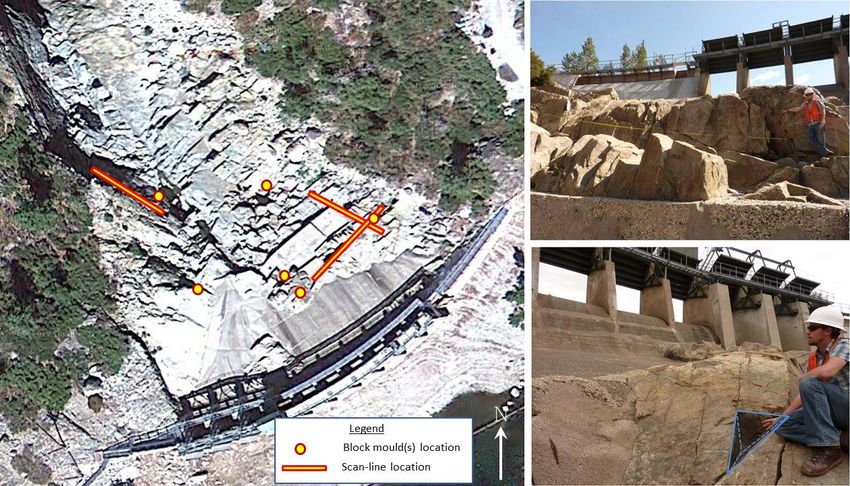
Figure 22: Scan‐line survey and block mold locations (left), NE striking scan‐line survey (upper right), block mold
below spillway gate (lower right). .............................................................................................................. 29
Figure 23: Aerial LiDAR point cloud of primary spillway (left), and stereographic projection of joint normal
orientations from LiDAR data (right). ......................................................................................................... 30
Figure 24: Stereographic projection of hand‐measured joint data (plotted in OpenStereo (Grohmann and
Campanha 2011). ....................................................................................................................................... 31
v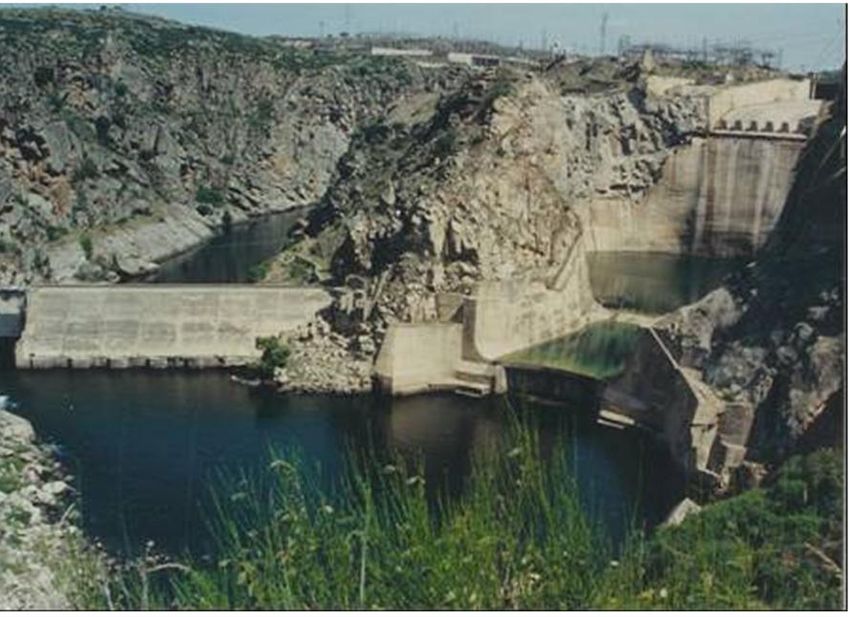
Figure 25: Simplified spillway schematic. ................................................................................................................ 31
Figure 26: Stereonet showing removable block for joint group containing J1, J2, J3, and f. .................................. 32
Figure 27: Limitation of active resultant paths for removable blocks (left) due to dominant flow direction in the
        spillway channel (right). ............................................................................................................................. 33
Figure 28: Stability of most critical removable block from spillway channel. ......................................................... 34
Figure 29: Example of block geometry dictating importance of pressure fluctuations for block removal. ............ 41

                                                                               vi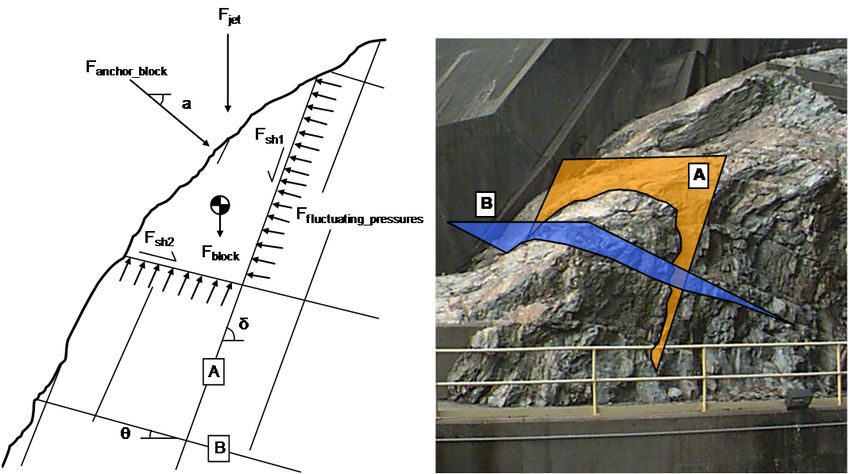
1. Introduction
Scour of rock is a critical issue facing many of the world’s dams, with increasing safety concerns arising
from the continued development of downstream communities. Excessive scour of the dam foundation
or spillway can compromise the stability of the dam leading to high remediation costs and even the
loss of life should catastrophic failure occur.

In the US, the application of more stringent requirements for managing the probable maximum flood
(PMF), coupled with improved hydrologic methods and more robust climate data sets, has generally
resulted in significantly greater estimated magnitudes of the design floods (Achterberg et al. 1998).
Accordingly, the risk of foundation or spillway erosion is increased, particularly at existing structures
that may now be inadequate to safely pass the revised design flow. Therefore, reliable prediction of
scour for retrofit and new projects alike is vitally important.

Scour of rock is a complex process where removal of individual rock blocks is one of the principal
mechanisms by which scour can occur, particularly in unlined spillways and on dam abutments. To
alleviate some of the complexity, commonly used methods for scour prediction tend to simplify the
rock mass using rectangular block geometries or incorporate empirical relationships for the rock mass
and do not actually model the physical scour process. Such simplifications can be problematic,
particularly for block analysis, where the 3D orientation of discontinuities within the rock mass largely
influence block removability.

Furthermore, very little consideration has been given to the potential for the kinematic sliding or
rotation failure of rock blocks when subject to impinging or overland flows. Failure of such blocks has
been known to occur at discharges that are a fraction of the design discharge causing significant
damage, but has still yet to be studied in‐depth. Such a case is Ricobayo Dam in Spain that had a 400 m
long unlined rock spillway with a capacity of 4,650 m3/s designed to discharge over a granite cliff.
Within two years of operation, two separate events (with discharge of approximately 100 m3/s and 400
m3/s, respectively) resulted in the sliding failure of multiple rock blocks in the spillway (Figure 1). While
the dam stability was not immediately threatened, significant cost was expended to contain and
eventually remediate the scour (Figure 2).

A more rigorous approach to 3D characterization of the structure of the rock mass can be obtained
using block theory (Goodman & Shi 1985). Block theory provides a methodology to identify removable
blocks, determine potential failure modes, and assess block stability. The scour process is inherently
dynamic while block theory is best suited for static conditions. There are, however, scenarios in which
hydraulic loads may be considered in a pseudo‐static sense or in a simplified dynamic sense such that
the full power of block theory can be realized in a manner that is approachable in practice.

                                                     1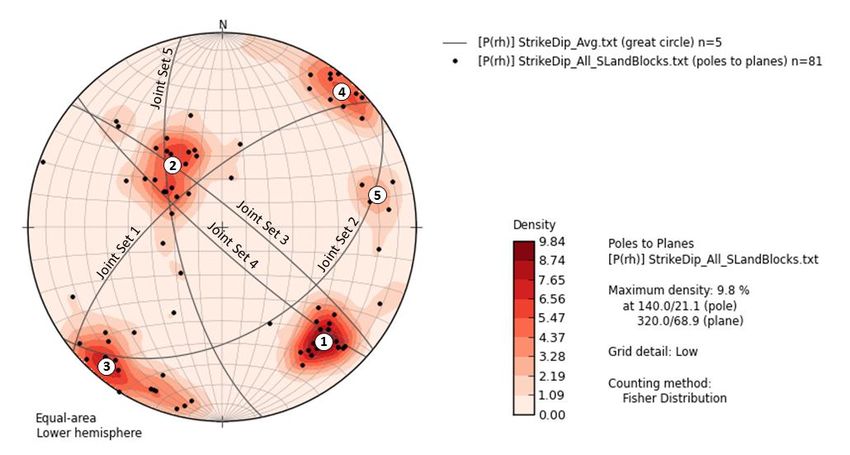
Figure 1: Scour from kinematic sliding failure of large rock blocks at Ricobayo Dam (Jan. & Mar. 1934).

Subsequently, the focus of this research has been to develop a framework within which block theory
can be applied to evaluate the scour potential of 3D rock blocks in a more realistic and site‐specific
manner. Doing so may lead to more efficient (and less costly) remediation designs, improved tools for
evaluating the optimal location and performance of future structures subject to scour, and more
reliable (safe) infrastructure.

Methodologies developed herein have been applied to a case study for an actively eroding unlined
rock spillway at a dam site in northern California.

   Figure 2: Scour remediation at Ricobayo (note extensive excavation and concrete work in addition to flow
                          splitters on the spillway lip to dissipate hydraulic energy).

                                                       2
2. Background
Numerous methods are available for prediction of scour for many types of flow conditions. This
section is not meant to provide a review of every one, but rather discuss some of those more
commonly used or those which focus on the removal of rock blocks. First, however, a discussion of the
physical mechanisms leading to the break‐up of a rock mass subject to hydraulic loads is presented.
2.1 Scour Mechanisms
The scour of rock can occur by three main mechanisms:
Abrasion (ball‐milling)
Fracture of intact rock
Removal in individual rock blocks
Abrasion, sometimes referred to as ball‐milling, refers to the gradual grinding away of a rock surface
due to repeated impacts from other particles (e.g., sand, cobbles, etc) carried by flowing water.
Typically, the timescale for significant scour to occur by abrasion is generally very long (i.e., on a
geomorphological timescale). As such, it is usually not a consideration for dam overtopping or spillway
erodibility assessments.
Fracture of intact rock refers to the propagation (growth) of close‐ended fissures when subject to
hydraulic loads (Figure 3). This mechanism has been shown to be prominent at certain depths in
plunge pools were conditions are such that resonance can lead to amplification of pressure within a
rock fissure causing fracture of intact rock at the fissure tip (Bollaert 2002). Depending on the
magnitude of the applied pressure, rock may fail nearly instantaneously by brittle fracture or over time
by fatigue.
Figure 3: Fracture of intact rock.
3Block removal refers to the “plucking” or “quarrying” of rock blocks from the surrounding rock mass
due to forces induced by flowing water and gravity (Figure 4). Discontinuities bounding the blocks
(such as joint planes, foliation, faults, contacts between geologic units or those created through brittle
fracture / fatigue) allow for the transmission of transient water pressures to the underside of the block
resulting in removal. Block removal is generally predominant when resonance conditions within rock
joints / fissures cannot be achieved such that brittle fracture or fatigue failure does not significantly
occur. Such scenarios may include direct flow impact onto a rock face (such as an overtopping jet
plunging onto an abutment) or in unlined spillway channels.
Figure 4: Block removal.
The removal of individual blocks from a rock mass is highly dependent on the 3D orientation of the
discontinuities bounding the block, and subsequently, a number of kinematic failure modes exist
(Figure 5).
Of these failure modes, lifting and sliding (1‐plane or 2‐plane) are pure translations meaning the
resultant vector of all the forces applied to the rock block passes through the block centroid causing a
zero moment about the centroid. Rotations about an edge or corner of the block are pure rotations
where the resultant vector only acts along the axis of rotation. Combinations of translation and
rotation can occur resulting in the slumping or torsional sliding of a block. Finally, flutter (not shown)
may also occur when a block is subjected to a dynamic load such that small plastic displacements are
realized over time and the block “walks” or “flutters” out of its mold. Note that a block mold refers to
the space in the rock mass from which a block was removed.
It should be noted that for the above failure modes, blocks are assumed to be rigid. Block
compressibility is more important for situations of combined rotation and translation where a
significant moment about the block centroid exists (Tonon 2007, Asadollahi 2009).
4Figure 5: Kinematic block failure modes (Goodman 1995).
Due to the variety of flow conditions typically encountered in unlined channels, on dam abutments or
in plunge pools, and the transient nature of pressure distributions on the various block faces, the
potential for block removal in any of the above manners is likely high. Subsequently, methodologies
for analyzing scour of rock blocks should consider these failure modes.
2.2 Existing Scour Prediction Methods
One of the most prominent methodologies for predicting rock scour is the Erodibility Index Method
(EIM) from Annandale (1995, 2006). The EIM is a semi‐empirical, geo‐mechanical index that can be
used to calculate the erosion resistance of any earth material (e.g., clay, sand, rock and even
vegetation). The Erodibility Index, K (dimensionless), for rock is defined by:
∙ ∙ ∙ (1)
where: Ms = mass strength number (based on rock unconfined compressive strength (UCS)), Kb = block
size number (based on rock quality designation (RQD) and number of discontinuity sets), Kd =
discontinuity shear strength number (based on joint roughness and alteration), and Js = relative ground
structure number (based on strike and dip of discontinuities relative the flow direction).
5Rock erodibility is based on a rippability index developed by Kirsten (1982, 1988) to evaluate the
machine power required to excavate various earth materials. The index was modified from Barton’s Q‐
system used to classify rock masses for tunnel support (Barton et al. 1974, and Barton 1988).
To determine scour potential, rock erodibility is compared to the erosive capacity of water quantified
using unit stream power, Psp (expressed in W/m2). In general form, this may be expressed as:
∙ ∙Δ
(2)
Where: γ = unit weight of water (N/m3), Q = the flow rate (m3/s), A = flow area (m2), and ΔE = energy
dissipated over the flow area, expressed in terms of hydraulic head (m).
Annandale (1995, 2006) provides modifications of the above equation to determine the erosive
capacity for a variety of flow conditions including open channels, knick‐points, hydraulic jumps, head‐
cuts and plunge pools. Based on 137 case studies and near‐prototype hydraulic testing, Annandale
developed a threshold relationship between flow erosive capacity and earth material erodibility (Figure
6). When the unit stream power of the water and the rock erodibility index plot above the threshold
line, scour is likely to occur.
Figure 6: Annandale Erodibility Index graph.
6The simplicity and wide applicability to various flow conditions makes the EIM particularly attractive
for use in practice. The method, however, is not without limitation. As its name implies, the method
incorporates an empirical index to characterize the rock. Subsequently, the EIM does not delineate
between different scour mechanisms (i.e., brittle fracture, fatigue failure, or block removal). This
results in a more generalized assessment of scour. Although weaker rock units or weathered zones can
be identified and their erosion resistance quantified, the identification of individual key rock blocks is
not possible. Also rock geometry is simplified into 2D and although some account for the discontinuity
structure with respect to the flow direction is given, the complete 3D nature of the joint orientations is
not addressed.
The other prominent model for rock scour prediction is the Comprehensive Scour Model (CSM) by
Bollaert (2002). Based on several near‐prototype scale laboratory tests Bollaert examined the
behavior of turbulent hydrodynamic pressures on plunge pool floors and in simplified rock joint
geometries subject to an impinging water jet. The CSM is significant in that it attempts to represent
the physics of the scour process and analyze the various scour mechanisms (brittle fracture, fatigue
failure and block removal). The key components of Bollaert’s CSM are outlined in Figure 7.
Figure 7: Key components of the CSM (Bollaert 2002).
7Using fracture mechanics theory from Atkinson (1987) and testing results from Paris (1961) on metals,
Bollaert (2002) developed relationships to evaluate the potential for intact rock to fail by brittle
fracture or fatigue, respectively. He also examined the potential for lifting of individual block when
subjected to dynamic pressure impulses from a jet impinging into a plunge pool. He found that
transient pressures can develop beneath individual blocks via open joints surrounding the block,
resulting in uplift (dynamic impulsion).
Block geometry, however, is simplified to rectangular blocks and no account is made for other joint
orientations (Figure 8), such that lifting is the only mode of failure considered. Based on case study
data, Bollaert & Schleiss (2005) calculated the block may be considered removed from the matrix when
the uplift caused by a single pressure pulse (Δz) is greater than about 20% of the vertical block
dimension (zb) (i.e., Δz/zb> 0.20).
Figure 8: Bollaert block removal model.
Hydrodynamic pressures within the plunge pool are highly dependent on a number of factors including
jet air entrainment, jet thickness, plunge pool depth, plunge pool geometry and air concentration in
rock fissures and has been studied by many researchers (e.g., Erivine & Falvey 1987, Ervine et al. 1997,
Castillo et al. 2007, Bollaert 2002, Manso 2006). The resulting dynamic pressure associated with the
impinging jet can be quantified using the general equation below (from Bollaert 2002):
∙ Γ∙ ′ ∙ ∙
2
(3)
where γ = unit weight of water (N/m3), Cp = average dynamic pressure coefficient, C’p = fluctuating
dynamic pressure coefficient, Γ = amplification factor to account for resonance in close‐ended rock
8fissures (not applicable for block removal), φ = energy coefficient (usually assumed = 1), vj = impact
velocity of the jet (m/s), and g = acceleration of gravity (m/s2).
Evaluating the potential for intact rock fracture and block removal as a function of plunge pool depth
provides the maximum scour depth achievable under a certain set of flow conditions as well as gives
insight into the dominant scour mechanism occurring at various elevations in the plunge pool.
Federspiel et al. have extended the work of Bollaert to analyze the response of 3D cubic block due to
vertical water jet impact in a plunge pool (previous measurements by Bollaert were for 2D block
geometry). Early analysis of power spectral density curves indicated block response was solely limited
to pressure fluctuations with low frequencies below approximately 10 Hz corresponding to larger‐scale
structures (eddies) within the plunge pool (2009) (Figure 9). More recent analysis has shown two
additional peaks in the power spectral density curves at frequencies between approximately 20 Hz –
100 Hz and 100 Hz – 300 Hz, which the researchers suggest could be related to the fundamental
resonant frequency of the pressure waves around the rock block or the eigen‐frequencies of the block
itself due to inertia (2011). In all scenarios, however, the amount of uplift of the block appears to be
relatively small (approximately 1% of the vertical block dimension) and potentially shows the limitation
of using a cubic block geometry where lifting is the only block failure mechanism.
Figure 9: Non‐dimensionalized power spectral density vs. frequency curve for pressure measurements at the top
and bottom of a 3D cubic block. Note decline after approximately 10 Hz (Federspiel et al. 2009).
Asadollahi (2009) used the numerical Block Stability in 3D (BS3D) code (originally developed by Tonon
2007 and later modified by Asadollahi) to determine the dynamic uplift of the cubic block tested by
Federspiel et al. (2009, 2011). BS3D considers all general failure modes of rock blocks subject to
9generic forces. Using BS3D, Asadollahi found reasonable agreement between modeled and observed
uplift when using actual pressure measurements around the block as input model parameters.
Additionally, using data from Martins (1973) of physical model tests on cubic blocks in a riverbed and
two case studies at the Picote Dam in Portugal and the Kondopoga Dam in Russia, Asadollahi used
BS3D to slightly refine Bollaert’s criteria, indicating a value of Δz/zb> 0.25 might be more representative
of block removal.
George & Annandale (2006) modified Bollaert’s CSM to evaluate the stability of abutment rock blocks
subject to hydrodynamic forces from overtopping jet impact (Figure 10). Joint structure in 2D was
analyzed and a relationship for the required rock bolt force to prevent dynamic impulsion was
developed.
Figure 10: Analysis of abutment block due to overtopping jet impact (George & Annandale 2006)
Goodman and Hatzor (1991), in what may be the first 3D block scour analysis, performed an extensive
examination of abutment stability using block theory for the Kendrick Dam Project in Wyoming. Large
key blocks were identified based on joint orientations and a 3D block stability analysis was conducted.
Only the static water pressure on the joint planes was considered for the overtopping jet and the role
of the hydrodynamic pressures was unexamined. Similar analyses were presented by Goodman &
Powell (2003) for other dam sites.
Reinus (1986) evaluated the removability of rectangular rock blocks subject to horizontal channel
flows. He related the initial amount of protrusion of the block above the channel bottom to a critical
flow velocity resulting in ejection. The United State Bureau of Reclamation (USBR) (2007) performed a
10similar study looking at the hydraulic jacking of concrete slabs in lined spillway channels. They related
the average stagnation pressure that develops underneath a slab (a function of the flow velocity) to
the shape, offset and discontinuity aperture (gap) between two adjacent slabs (Figure 11).
Independently, both Bollaert (2010) extending the work of Reinus, and George (2010) using the work
of the USBR, incorporated the influence of turbulent pressure fluctuations on the hydraulic jacking of
rectangular blocks in channel bottoms. Based on research by Emmerling (1973) and Hinze (1975)
(summarized in Annandale 2006), the magnitude of the pressure fluctuations, P’ (N/m2), were
quantified using:
3 18 ∙ (4)
where τt is the turbulent boundary layer shear stress (N/m2).
Figure 11: Hydraulic jacking of concrete spillway slabs (USBR, 2007)
Accordingly, the total lift applied to a protruding block is a function of the block buoyancy, quasi‐steady
(or pseudo‐static) uplift resulting from build‐up of stagnation pressure beneath the block, and the
turbulent uplift resulting from pressure fluctuations (Figure 12) (Bollaert 2010). As implied, buoyancy
and stagnation pressure are considered in a static manner, while the pressure fluctuations are
analyzed in a dynamic sense. For a protruding block, and depending on the flow conditions, stagnation
pressure or turbulent pressure fluctuations may be more dominant in causing uplift. However, for
smaller block protrusions the stagnation pressure diminishes such that a block that is flush with the
ground surface may only be removed by turbulent pressure fluctuations.
11Figure 12: Block uplift at bridge pier (Bollaert 2010).
When considering turbulent uplift, Bollaert concluded that the critical flow velocity causing removal
can be significantly decreased. For the flow scenarios analyzed by George, however, the influence of
pressure fluctuations on uplift was found to be negligible. This suggests that some scenarios may be
adequately analyzed in a pseudo‐static manner, while for others a more dynamic representation is
needed.
The majority of the above methods examine a single representative block subject to a characteristic
hydraulic load dependent on the flow conditions and geometry. In the case of plunge pools, for
example, if the representative block is removable at a certain elevation in the pool, scour will occur.
The block is then analyzed again in a similar fashion at lower and lower elevations in the pool
(corresponding to different hydraulic conditions) until the block is stable at which point scour is
thought to cease. A few researchers, however, have begun analyzing multi‐block systems through
numerical analysis.
Multi‐block analyses are significant in that the spatial estimates of scour may be obtained (opposed to
simply determining scour initiation or maximum scour depth). Additionally, multiple block shapes and
geometries may be considered. Wibowo (2009) applied key block theory from Goodman & Shi (1985)
to find removable blocks exposed by an excavation for unlined rock spillways (Figure 13). Stability
analyses were conducted for key blocks under flow conditions, however, it appears only 2D blocks
were considered.
12Figure 13: 2D removable blocks in unlined spillway (Wibowo 2009).
A similar attempt by Li and Liu (2010) was made, but for impinging jets into plunge pools. Removable
2D blocks were identified based on joint structure and corresponding plunge pool geometry was
determined. Block stability was determined using empirical relationships for pressure distribution
within the rock mass. Their simulated results yielded reasonable agreement with observed scour at
the Xi Luo Du hydro‐electric power plant in China.
More recently, Dasgupta et al. (2011) performed numerical simulations to estimate plunge pool scour
formation at Kariba Dam in Zimbabwe. They used 3D computational fluid dynamics software (ANSYS
FLUENT) to determine erosive capacities along with the 2D universal distinct element code (UDEC) to
model the rock mass. Dynamic pressures at the bottom of the plunge pool were determined over a
time interval and then input into UDEC to evaluate block removal and brittle fracture independently.
Results from the block analysis and fracture analysis were superimposed to get an idea of the final
scour hole shape, which showed reasonable agreement with that observed at Kariba Dam (Figure 14).
Interestingly, they found that blocks first to fail were just outside of the impingement region, which
shows the importance of analyzing multiple block systems instead of a single representative block.
Although the rock mass was modeled in 2D, their approach gives promise to the use of numerical
methods to incorporate the 3D geometry of a rock mass along with complex flow conditions.
13Figure 14: Numerical simulation of plunge pool scour (Dasgupta et al. 2011)
2.2.1 Limitations of Existing Scour Models
Empirical methods, such as Annandale’s EIM, are limiting due to their inability to represent the physics
of the scour process in that the mechanisms causing scour (block removal, fracture of intact rock) are
not modeled. Additionally, these methods can be unreliable when used outside of their tested range.
Block models that incorporate simplified 2D rectangular or cubic block geometries, such as Bollaert’s
CSM, are limiting when orientations of the discontinuities are not orthogonal, such is commonly the
case for igneous and metamorphic rock types. Furthermore, for such simplified geometries, block
failure is limited to uplift and the potential for the kinematic sliding or rotation failure of rock blocks is
not considered. 2D blocks that are not rectangular (such as those witnessed in the multi‐block
simulations above) are still restrictive in their ability to represent a rock mass and a process that is
inherently 3D.
These limitations ultimately take away from the site‐specific nature of the analysis being performed
and accordingly may potentially yield unreliable results from which decisions concerning dam safety
are made. An ideal scour model would represent an entire 3D rock mass comprised of multiple blocks
while also evaluating 3D flow conditions that responded to changes in geometry due to scour
progression over time. The effort required to develop such a model in any meaningful manner is great
and demands complex numerical codes. As such, the focus of this research is to develop
methodologies to analyze scour potential of single 3D rock blocks as well as to gain understanding that
may be applied later to more complex 3D multi‐block systems.
143. Methodology
To consider the 3D nature of rock blocks and their corresponding failure modes, block theory by
Goodman & Shi (1985) has been applied. Block theory provides a rigorous methodology to identify
removable blocks, determine potential failure modes, and assess block stability. Blocks that are most
readily removable are termed key‐blocks and are the locations were scour is likely to commence.
Analysis may be performed graphically through stereographic projection or by vector solution, both of
which are incorporated here. This section covers the basics of block theory analysis and its application
to the scour problem.
3.1 Assumptions
The basic assumptions in block theory are: 1) all joint surfaces are planar, 2) joints extend completely
through the volume of interest, and 3) blocks are assumed to be rigid. Some additional assumptions
pertaining to assessment of scour for this paper are: 4) only tetrahedral blocks (defined by three joint
planes and one free planar face) are considered; and 5) only the pure translation and pure rotation
kinematic failure modes are considered. Initially these may appear to be limiting, however, a study
performed by Hatzor (1992) examining block molds for a number of case histories indicated the
majority of blocks removed were tetrahedral.
3.2 Removability
For a given set of three non‐repeating joints (J1, J2, and J3) and one free face (f), eight possible block
shapes exist, one of which will be removable from the rock mass. Each block is termed a “joint
pyramid (JP)” and is identified by a three number code relating to which side of the joint plane the
block resides in space. A “0” indicates the block is above the joint plane while a “1” indicates the block
is below the joint plane. For example, the JP code 001 indicates the block in question is above joint 1
(J1), above joint 2 (J2), and below joint 3 (J3). Using stereographic projection (Goodman 1976), the
great circle corresponding to each joint set can be plotted thus subdividing the stereonet into regions
corresponding to each JP (Figure 15). For an upper hemisphere stereonet, anything plotting inside the
great circle for a particular joint is considered above that joint plane, while anything plotting outside is
considered below.
To be removable, the JP region for a particular block must plot completely within the “space pyramid
(SP)” as defined by the free face. The free face is essentially the rock/water or rock/air interface
(assumed to be planar over the region of interest) that divides the SP (the region into which a
removable block moves) from the “excavation pyramid (EP)” (the region where the block resides). For
the example shown in Figure 15, JP 001 is a removable block from a horizontal free face, while JP 100 is
a removable block from a vertical face striking East‐West.
15For rock masses with more than three joint sets, multiple combinations of three joint sets should be
analyzed to find removable blocks in all cases. For example, if the total number of joint sets is four, the
following sets should be analyzed with the free face: (J1, J2, J3), (J1, J2, J4), (J1, J3, J4) and (J2, J3, J4).
Figure 15: Upper hemisphere stereonet showing JP codes and removable blocks for horizontal free face (left)
and vertical free face striking East‐West (right).
3.3 Kinematic Mode Analysis
Once a block has been identified as removable, it is necessary to determine what kinematic modes of
failure (Figure 5) are possible based on 1) block geometry and 2) orientation of the active resultant
force being applied to the block. The active resultant is comprised of all the forces applied to the block
which, for scour assessment, are namely the hydraulic forces and the self‐weight of the block. For this
section it is assumed the active resultant is arbitrary with some already known value. Suggestions for
methods to determine the resultant for application of block theory to scour are discussed later on.
Criteria were developed by Goodman & Shi (1985) for assessing plausible kinematic failure modes for
pure block translations and later by Mauldon & Goodman (1996) for pure block rotations. Criteria are
provided below in vector form for simplicity, but may also be checked stereographically. Note bold
font implies quantity is a vector.
For the pure translations, lifting of a block is kinematically feasible when:
16∙ 0 (5)
where s = direction of block movement (equal to the direction of the active resultant, r, for lifting), and
vi = block‐side normal vector for ith joint plane. This condition indicates the direction of lifting is not
parallel to any of the joint planes defining the block. The block‐side normal may be calculated by:
sin ∙ sin
sin ∙ cos
(6)
cos
,
where ni = upward normal for the ith joint plane and αi, βi = the dip and dip direction, respectively, of
the ith joint plane. For block sliding on plane i only, the sliding direction is given by:
| |
(7)
This is the orthographic projection of the active resultant onto the sliding plane. Kinematic feasibility
of 1‐plane sliding is subject to the following constraints:
∙ 0,
(8)
∙ 0
where j represents the remaining two joint planes. The first condition ensures a component of the
resultant is projected onto the plane of sliding, while the second guarantees the block is being lifted
from the remaining joint planes. For block sliding on planes i and j simultaneously, the sliding direction
is given by:
∙ ∙
(9)
where sign(x) is a function that returns 1 if “x” is positive and ‐1 if “x” is negative. The sliding direction
is along the line of intersection between the two planes. The sign function determines which direction
sliding occurs along this line considering the orientation of active resultant. Kinematic feasibility of 2‐
plane sliding on planes i and j is subject to the following constraints:
∙ 0,
∙ 0, (10)
∙ 0
17where k represents the remaining joint plane from which the block is lifted.
For the pure translations, a block is kinematically rotatable about corner Aa for any applied resultant
when (Tonon, 1997):
∙ 0,
∙ 0,
(11)
∙ 0, ,
∙ 0,
where i and j are the joint planes containing the block corner in question (excluding the free face)
while k corresponds to the remaining joint plane, aG = acceleration of the centroid (G), = angular
acceleration about the rotation axis, GAa = vector from the centroid to the corner of rotation Aa, and
GAb / GAc = the vectors from the centroid to the other corners (Ab and Ac) on the block on the free
face, The first two criteria are purely geometrical and ensure that at least one of the angles between
either joint plane i or j and k is obtuse, thus allowing rotation. The remaining two ensure the corner of
rotation moves against the block mold while the remaining two corners move into the space pyramid.
The centroid acceleration may be calculated by:
(12)
where m = mass of the block. Additionally, the angular acceleration about the rotation axis is:
(13)
where MG = induced moment about the centroid and EG = inertial operator. See Tonon (1998) for
additional details on determining EG. Note that the latter two conditions in (11) simplify to those
provided by Mauldon & Goodman (1996) when no moment about the block centroid is considered
(i.e., MG = 0). Finally, for the case of rotation about a block edge contained in the ith joint plane with
corners Aa and Ab, the following must be true:
∙ 0 ,
∙ 0 ,
(14)
∙ 0, ,
∙ 0
where f = the free face, and GAc = vector from the centroid to the remaining corner, Ac, on the free
face. Since edge rotation is essentially an extension of corner rotation (i.e., rotation about two corners
18simultaneously), the criteria above ensure both angles between the joint plane containing the free
edge and the other two joint planes are obtuse as well as that block corner movements occur into the
SP.
3.4 Stability
Once the feasible kinematic modes of block movement have been identified for removable blocks,
block stability can be assessed. To assess stability, it is necessary to quantify the hydrodynamic forces
applied to the block, their distribution on the block face and within the joints bounding the block. In
doing so, it is important to consider the nature of the flow conditions, namely is flow turbulent with a
large degree of variability causing significant pressure fluctuations such that a dynamic analysis is
required or are the fluctuations small such that analyzing an average pressure in a pseudo‐static sense
may suffice. In either case, principles in block theory can be applied to give an estimate of block
stability.
3.4.1 Characteristic Hydrodynamic Pressure
For a given set of flow conditions, consider a corresponding characteristic dynamic pressure defined by
an average dynamic pressure, Pm (or the dimensionless average dynamic pressure coefficient Cp), a
fluctuating dynamic pressure, P’ (or the dimensionless fluctuating dynamic pressure coefficient C’p) and
a frequency, ε (Figure 16).
Figure 16: Characteristic dynamic pressure.
The characteristic dynamic pressure attempts to represent the main features of a flow field (as defined
by the geometry, location, flow type, etc.) in a simplified manner. This characteristic pressure may be
expressed as:
′ ∙ sin 2 (15)
19As indicated in Figure 16 the characteristic dynamic pressure is comprised of two regions. The first is the fluctuating pressure region which represents the influence of the turbulent nature of the flow field. The second is the pseudo‐static region where, for all practical purposes, the pressure is relatively constant and may be treated as such. When the pressure fluctuations are relatively small (i.e., P’
3.4.2     Hydrodynamic Pressure Distribution on Block
Probably the biggest unknown for scour assessment of rock blocks is the hydrodynamic pressure
distribution on the block faces. Little, if any, data exists regarding how hydrodynamic pressures change
spatially and temporally around a 3D block, let alone a tetrahedral block. As such, assumptions must
be made.

In situations where flow conditions are complex and turbulent (such as plunge pools, rough channel
flows with complex geometries, hydraulic jumps, etc.) it is logical to think that dynamic pressures may
be distributed around the block in many different combinations that continually change over time.
Therefore, for dynamic analysis, hydrodynamic pressures are applied to all the different combinations
of block faces assuming a uniform pressure distribution across the block face. For tetrahedral blocks
there are 15 combinations of block faces (J1, J2, J3, or f) to which pressure may be applied: J1, J2, J3, f,
J1‐J2, J1‐J3, J1‐f, J2‐J3, J2‐f, J3‐f, J1‐J2‐J3, J1‐J2‐f, J1‐J3‐f, J2‐J3‐f, and J1‐J2‐J3‐f. These are referred to as
“hydraulic load scenarios.”

This is a reasonable assumption as observations on the removal of rock blocks in laboratory studies by
Yuditskii (1967) and later by Melo et al. (2006) have indicated that a single pressure fluctuation
typically opens up one or two of the bounding joints (while subsequently closing the others) such that
a large low frequency pressure fluctuation can cause significant pressure build‐up in the open joints to
eject the block. The assumption of uniform pressure distribution on block faces is likely valid only for
blocks smaller than the characteristic length scale of large‐scale eddies within the flow. For larger
blocks, this may be too conservative. A similar approach is adopted by Asadollahi (2009) using BS3D
code by Tonon (2007).

For pseudo‐static analysis, a similar approach is adapted except that some of the hydraulic load
scenarios may be excluded to account for a preferential flow direction (such as in a channel) where it
may not make sense to have block movements upstream. This is discussed in more detail later on.

3.4.3     Pseudo‐Static Block Stability
For scenarios when pressure fluctuations are small (i.e., P’
1
                ∙    ∙           ∙                           ∙       ∙ tan             ∙           ∙ tan

                                                  ,      2
                                                                                                           (20)

where F = ficticious, required stabilizing force applied in the direction of movement to maintain
equilibrium (N), φi and φj = friction angles (deg) on joints i and j, respectively, and r = active resultant
force (N). When F is negative the block is considered stable, and when F is positive the block is
unstable. When F is zero, the block is in equilibrium such that any further increase in the pressure will
result in removal of the block.

The resultant, r, can be calculated as follows:

                                                      ∙ ′ ∙      ∙

                                                                                                           (21)

where P = pseudo‐static pressure which is varied until limit equilibrium is reach (N/m2), A’I = area of ith
joint plane (m2), g = acceleration due to gravity (m/s2), and x = number of block faces being analyzed.

As it is assumed that any of the pressure combinations being analyzed are plausible, the one yielding
the lowest hydraulic force to result in block failure is considered to be the most critical.

Note that only expressions for the translations are provided. Because the orientation of the active
resultant is assumed to potentially vary in all directions, the most critical mode will almost always be
one of the translations unless the friction angle of the rock joint is very high. Furthermore, the
probability that a block is removable and rotatable is fairly low (~16%) (Mauldon 1990). As such, only
1‐plane sliding, 2‐plane sliding and lifting need be considered here.

To illustrate this procedure, consider a removable tetrahedral block bounded by joints J1, J2, J3 and a
free face, f, with known surface areas. For the case that pseudo‐static pressure is only applied to J3,
for example, using the criteria in Equations (5), (8) and (10) the only kinematically feasible mode is 2‐
plane sliding (i.e., sliding on J1 and J2). Subsequently, using Equation (19) the value of F is plotted as a
function of the pseudo‐static pressure head (Figure 18). As indicated, F is negative for all values of
pressure head indicating the block will remain stable under this hydraulic load configuration. For the
case when pressure is applied to block faces J2 and J3, F is negative initially, but at a pressure head of
approximately 0.6 m, F becomes positive indicating the block will fail by sliding on J1.

                                                       22
Figure 18: Example of vector solution for a removable block with hydraulic load applied to block face J3 and
when applied to faces J2‐J3.
This procedure can also be shown graphically on the stereonet. Figure 19 presents a limit equilibrium
net for the same removable block used in the example above, constructed using methodologies from
Goodman & Shi (1985). The stereonet is divided into regions that represent all the potential modes of
translational failure for a given removable block. The region in which the active resultant plots
corresponds to the mode of translation that will occur provided joint friction (represented by the
colored contours) is not adequate to keep the block in place. For this particular plot, a friction angle of
40 degrees (solid red contour line) has been chosen to represent the strength of the rock joints. This
contour represents a state of limit equilibrium for the block (corresponding to F = 0 in the vector
solution). Should the active resultant plot outside of this region, movement in the corresponding mode
will occur.
Also shown in Figure 19 is the active resultant path for the hydraulic load scenario when pseudo‐static
pressure is applied to block face J3 and for the case when pressure is applied to J2 and J3. For both
cases, the resultant path begins at the center of the stereonet as initially the only force applied to the
block is its weight which acts straight down. As pressure on J3 increases, the resultant orientation
changes, but never crosses the contour corresponding to a joint friction angle of 40 deg., indicating the
block is always stable. This is because the block‐side normal vector for J3 plots inside of the limit
equilibrium contour. This is not the case when pressure is applied on J2 and J3. Increasing pressure on
23J2 and J3 results in the active resultant path crossing the limit equilibrium contour indicating the block
will become unstable and sliding on J1 will occur.
Figure 19: Example of limit equilibrium stereonet for removable block showing resultant paths for hydraulic
load applied to block face J3 and J2‐J3 (stereonet generated with PanTechnica (2002) software).
3.4.4 Dynamic Block Stability
When the magnitude of the pressure fluctuations comprise a significant portion of the characteristic
dynamic pressure (i.e., P’ ≅ Pm), the dynamic nature of the flow field cannot be neglected. For this
analysis, the characteristic dynamic pressure is converted to a single dynamic impulse which is then
applied to a rock block to access stability (Figure 17 – bottom).
As described above, observations by Yuditskii (1967) and later by Melo et al. (2006) have indicated that
a single pressure fluctuation typically opens up one or two of the bounding joints (while subsequently
closing the others) such that a large low frequency pressure fluctuation can cause significant pressure
build‐up in the open joints to eject the block. As such, it seems appropriate for dynamic analysis to
consider the response of a rock block to a single characteristic dynamic impulse.
For dynamic flow conditions, it is hypothesized that the resultant hydraulic force will change in
magnitude and orientation over time. As such, it is assumed that all 15 hydraulic load scenarios are
plausible for a tetrahedral block. The removal of a rock block, therefore, will likely occur in a mode
that requires the least applied hydraulic force.
24You can also read