Oshawa Community Needs Assessment - Prepared in Support of the Smart Cities Challenge Applications - Durham Workforce ...
←
→
Page content transcription
If your browser does not render page correctly, please read the page content below
Oshawa Community Needs Assessment
  Prepared in Support of the Smart Cities Challenge Applications

                                                        April 2018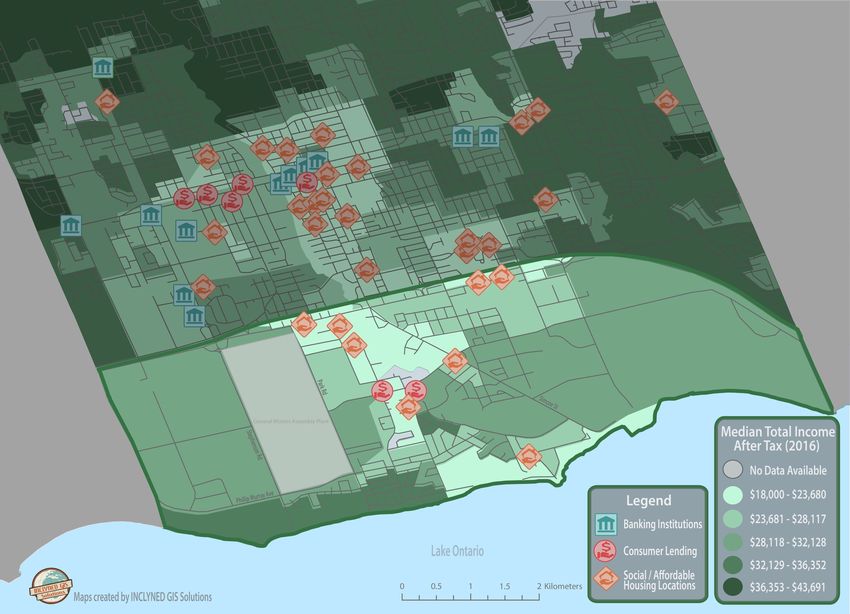
Table of Contents
INTRODUCTION ....................................................................................................................................... 3
  INFRASTRUCTURE CANADA’S SMART CITIES CHALLENGE ................................................................................... 3
  COMMUNITY NEEDS ASSESSMENT APPROACH AND METHODOLOGY ................................................................... 4
     Data Trends Analysis ....................................................................................................................... 5
     Development of Key Themes............................................................................................................ 6
  LIMITATIONS........................................................................................................................................... 8
COMMUNITY NEEDS AND TRENDS ASSESSMENT FINDINGS.................................................................... 9
  OVERVIEW ............................................................................................................................................. 9
     Growth and Development................................................................................................................ 9
     Social and Economic Inequality ...................................................................................................... 10
  SUMMARY OF COMMUNITY NEEDS............................................................................................................ 10
  PRIMARY TREND: SOCIAL AND ECONOMIC INEQUALITY .................................................................................. 11
  SECONDARY TRENDS .............................................................................................................................. 16
     Population Change ........................................................................................................................ 16
     Transit and Transportation ............................................................................................................ 22
     Housing ......................................................................................................................................... 24
     Economic Change and Development .............................................................................................. 27
  TERTIARY TRENDS .................................................................................................................................. 31
     Health and Safety .......................................................................................................................... 31
     Community Engagement, Service Planning and Access .................................................................. 35
  CONCLUSION AND SUMMARY OF IDENTIFIED NEEDS ...................................................................................... 36
     Need to understand and address the causes and impacts of neighbourhood inequality.................. 36
     Need to plan for and address the impacts of an aging population.................................................. 36
     Need to plan for and address the impacts of growing diversity ...................................................... 37
     Need to address the impacts of gaps in public transit access.......................................................... 37
     Need to address concerns with housing affordability and access.................................................... 37
     Need to support continued and equitable economic growth across the city.................................... 38
     Need to improve access to community services.............................................................................. 38
     Need to develop innovative and Improved modes for Community Engagement ............................. 39
APPENDICES .......................................................................................................................................... 40
  APPENDIX A: LIST OF DOCUMENTS REVIEWED.............................................................................................. 40
  APPENDIX B: CURRENT ACTIVITIES UNDERWAY IN PRIORITY NEIGHBOURHOODS.................................................. 43
  APPENDIX C: LAKEVIEW SERVICE ACCESS MAPS............................................................................................ 46

                                                                                                                                                        2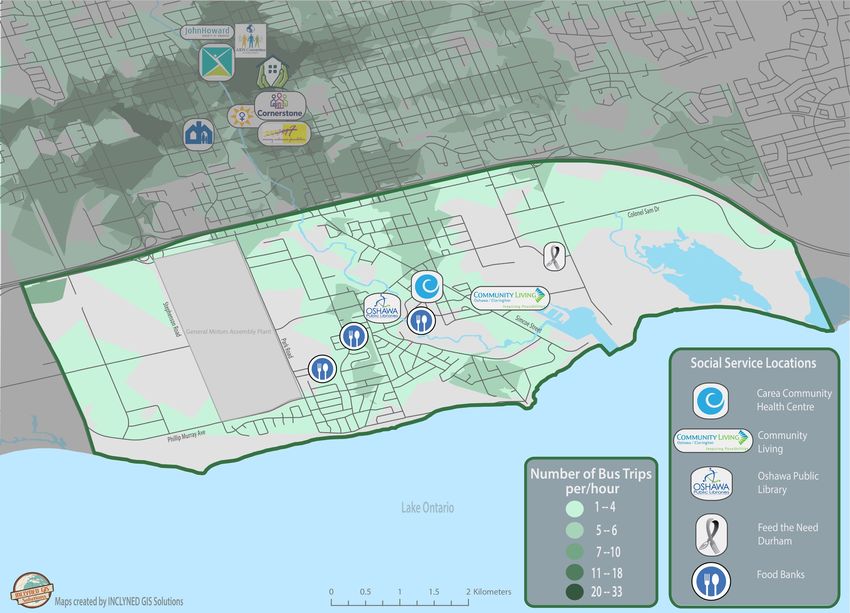
Introduction
In late 2017, Infrastructure Canada initiated a national Smart Cities Challenge1 requesting that Canadian
cities engage and collaborate with residents, businesses, academic institutions, and civic organizations
to develop and implement innovative solutions to significant community problems and issued. These
projects are to be guided by a smart cities approach2, and thus data and technology driven, applying a
Smart Cities Approach to collective problem solving.
To support the development of a proposal from the City of Oshawa, the Durham Workforce Authority
and Ben Earle Consultant were engaged to complete a Community Needs Assessment to identify the
most significant issues and trends currently affecting the City of Oshawa, its residents, businesses and
institutions. A focus was placed on those issues and trends that may be best addressed through a smart
cities approach to planning and development.
Recognizing that significant work has been completed in recent years to assess local issues, needs, and
trends, the needs assessment set out to evaluate existing documents and data sets relevant to the
community in Oshawa, and consisted of, (1) a Data Trends Analysis, and (2) a Qualitative Document
Review.
The outcome of this project is this Community Needs Assessment Report that identifies the primary
social and economic issues affecting the city and discusses some of the ways in which technology may
be deployed to address these problems. This work will inform the development of Oshawa’s proposes
Challenge Statement3. that will be the foundation of the City of Oshawa’s application in the Smart Cities
Challenge.
Infrastructure Canada’s Smart Cities Challenge
The Smart Cities Challenge is a competition open to all municipalities, local or regional governments,
and Indigenous communities (First Nations, Inuit, and Métis) across Canada4. This Challenge will
empower communities across the country to address local issues their residents face through new
partnerships, using a smart cities approach.
A smart cities approach means achieving meaningful outcomes for residents through the use of data and
connected technology.
The competition will result in the awarding of three prizes, including:
     •     One prize of up to $50 million open to all communities, regardless of population;
     •     Two prizes of up to $10 million open to all communities with populations under 500,000 people;
     •     One prize of up to $5 million open to all communities with populations under 30,000 people.
In keeping with the challenges principles and guidelines, the City of Oshawa has taken a community
driven and engaged approach to the development of its Smart Cities Challenge proposal. The process
has included: the formation of community stakeholder committee, the completion of a community
needs assessment process, a review of findings with the stakeholder committee, the hosting of two
community stakeholder meetings, and the delivery of a community survey to gather broad local input.
This report presents findings from the community needs assessment.

1
  http://www.infrastructure.gc.ca/plan/cities-villes-eng.html
2
  https://impact.canada.ca/en/challenges/smart-cities/the-challenge
3
  Per Infrastructure Canada’s Smart City Challenge guidelines, the Challenge Statement “is a single sentence that defines the outcome or
outcomes a community aims to achieve by implementing its smart cities proposal.”
4
  https://impact.canada.ca/en/challenges/smart-cities

                                                                                                                                           3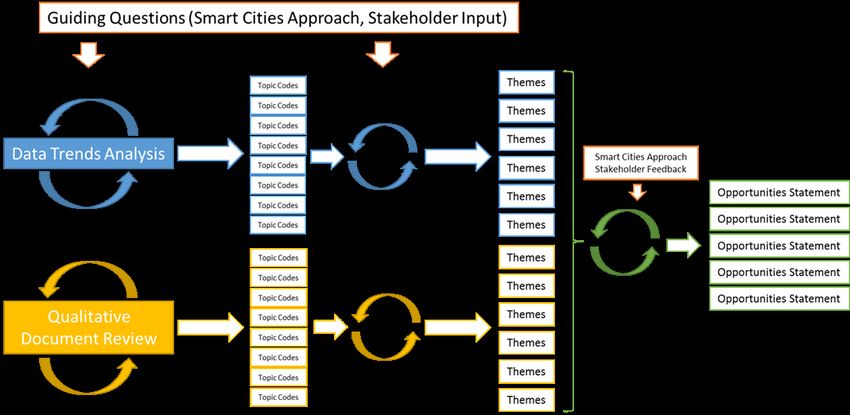
Community Needs Assessment Approach and Methodology
The general approach to the Community Needs Assessment was premised on a grounded research
process. This approach to research and analysis allows for findings to emerge from the data through an
iterative process that integrates new information as it is identified and analyzed. This process is
repeated until key themes emerge from the data sources and are repeated even as new data is
introduced.
Informed by the above approach, the methodology was divided into three parts (described in Figure 1),
with each stage of the analysis informed by a set of guiding questions (Figure 2), that were developed
with input from key project stakeholders, including the City of Oshawa, the Durham Workforce
Authority, and the stakeholder roundtable.
 Methodology                Description
 Data Trends Analysis       The collection, review, and analysis of relevant social, economic, and labour market
                            data pertaining to the City of Oshawa.
 Qualitative Document       The collection, review, and analysis of recent documents and reports pertaining the
 Review                     social, economic, and labour market environment in Oshawa, with a focus on
                            findings and recommendations for action.
 Development of Key         Identification of key themes emerging from data and document analysis, and the
 Themes & Opportunities     development of Opportunities Statements to support the Smart Cities Challenge
 Statements                 Application.

                           Figure 1: Community Needs Assessment Guiding Questions

 Data Trends Analysis                                      Qualitative Document Review
 Sources:                                                  Sources:
   • Primary data sets (e.g. Statistics Canada)              • Research and evaluation reports
   • Data/trends analysis reports                            • Community strategic and planning documents
 Guiding Questions:                                        Guiding Questions:
   1.   What are the primary demographic, social, and         1.   What are the current needs and challenges
        economic trends in Oshawa?                                 identified by various stakeholders in the
   2.   How have these trends been assessed and                    community?
        prioritized by various stakeholders in the            2.   What are the current responses to these
        community?                                                 identified needs and challenges?
   3.   What have some of the current responses to            3.   What are the current goals and priorities of
        these trends been in Oshawa?                               various stakeholders in the community?
                                                              4.   What are the current strategies for achieving
                                                                   identified goals and priorities?
   1.   Where do local data trends overlap with identified needs, challenges, goals and priorities?
   2.   Of the identified needs, challenges, goals and priorities, which lend themselves best to a smart cities
        approach?
   3.   What current examples and best practices in smart city development from other jurisdictions may be
        useful?

                           Figure 2: Community Needs Assessment Guiding Questions

                                                                                                                   4
Data Trends Analysis
An iterative multi stage Data Trends Analysis was completed, assessing primary and secondary data and
trends reports pertaining to the city of Oshawa. Sources reviewed are listed in Appendix A, and specific
citations are provided where appropriate in the findings section of this report.
The specific stages of the Data Trends Analysis are detailed in Figure 3.
Stage 1 Development of a data collection and analysis matrix to help identify relevant data sources to
be assessed.
Stage 2 Initial review of identified data sources to identify key trends and themes.
Stage 3 Integration and analysis of emerging data sources, identified through Stage 1 (repeated as
required).
Stage 4 Iterative analysis (as required) to refine data trends and themes and allow for key findings to be
identified.
Stage 5 Refinement and presentation of key data trends and themes.
Figure 3: Data Trends Analysis Stages
Qualitative Document Review
Similar to the Data Trends Analysis, an iterative multi stage Qualitative Document Review was
completed, assessing research, strategy, and planning documents and reports pertaining to the city of
Oshawa. Sources reviewed are listed in Appendix A, and specific references are provided where
appropriate in the findings section of this report.
The specific stages of the Qualitative Document Review are detailed in Figure 4.
Stage 1 Development of a document collection and analysis matrix to help identify relevant
documents to be assessed.
Stage 2 Initial review of identified data sources to identify key findings and recommendations. Will
include a methodology review to help assess the strength of reported findings.
Stage 3 Integration and analysis of additional documents, identified through analysis in Stage 2
(repeated as required).
Stage 4 Analysis to merge findings and recommendations identified in Stages 2 and 3, to form a set of
key themes.
Stage 5 Iterative analysis (as required) to refine key themes.
Stage 6 Presentation of key themes.
Figure 4: Qualitative Document Review Stages
5Development of Key Themes
The final stage of the analysis involved the merging of outcomes from the Data Trends Analysis and the
Qualitative Document Review, repeating the iterative process until saturation5 of information occurred
and key themes emerged.
In both the Data Trends Analysis and the Qualitative Document Review, a priority assessment matrix
was applied to assess the relevance and importance of data sources and documents under review. This
matrix is presented in Figure 5.
Data Research Strategy/Planning
Source/Method Method Source
Geography Geography Geography
Timeliness Timeliness Timeframe
Subject Matter Subject Matter Scope/Area of Focus
Smart Cities Smart Cities Smart Cities
Cross referenced to identify overlap
Figure 5: Priority Assessment and Review Matrix
Key themes and opportunities were identified in two stages. In the first stage, the overlap between
findings from each of the three areas of analysis (i.e. Data, Research, and Strategy/Planning) was
assessed to determine primary and secondary themes (Figure 6). In the second stage, a smart cities lens
was applied (Figure 6) to help narrow the themes to those that lent themselves best to a Smart Cities
Approach or solution (see Figure 7).
Research
Research
2
Smart
2 2 2 1 2 Strategy
Cities
1 2
Data 2 Strategy
Data
Stage 1 Comparison Stage 2 Comparison
Figure 6: Data and Information Comparison Model
5
Saturation occurs when key themes emerging from the data are repeated with no new themes being identified as new data is added to the
analysis.
6In the second stage, a smart cities lens was applied (Figure 7) to help narrow the themes to those that
lent themselves best to a Smart Cities Approach or solution.
A smart cities approach aims to achieve meaningful outcomes for residents by leveraging the fundamental
benefits that data and connected technology have to offer:
• Openness
When communities make their data truly accessible, usable, and barrier-free, their decision-making
processes become transparent, empowering citizens and strengthening the relationship between
residents and public organizations.
• Integration
Data and connected technology empower communities to break down silos that exist within local
governments and public organizations.
• Transferability
When tools and technological approaches are open-source, transparent, and standardized, they can be
used by communities across the country, no matter their size or capacity.
• Collaboration
Connected technology enables communities to bring traditional and non-traditional partners together
to collaborate.
Figure 7: The Smart Cities Approach, as defined by Infrastructure Canada [REF]
The overall methodology for the Community Needs Assessment is summarized in Figure 8.
Figure 8: Community Needs Assessment Grounded Methodology
7Limitations
This study was based on existing data sets and existing reports and documents. As a result, the findings
are limited by:
(1) The parameters of existing data sets, including variables present and the level of geography for
which data exists;
(2) The parameters and timeliness of existing research reports; and,
(3) The veracity and quality of secondary data sources.
These limitations have primarily impacted the breadth of data available at relevant, consistent, and
comparable geographic boundaries across the study. This has restricted detailed analysis in some areas,
thus limiting the assessment of some trends and issues.
8Community Needs and Trends Assessment Findings
The findings of the Community Needs Assessment process described above are presented in this section
of the report.
Overview
In general, the data presents an image of a dynamic, but divided city. On one hand, Oshawa is a city in
renaissance, experiencing significant shifts in development and growth. This has led to many positive
economic and social trends, placing the city at the forefront of prosperity in Durham. At the same time,
Oshawa faces complex challenges relating to a divide that has emerged as the positive outcomes of
growth and development have not been shared across the city. The contrast created by this dynamic is,
at times, stark and pronounced, to the point where it often appears as though there is a “tale of two
cities” emerging from the social and economic data.
Growth and Development
The positive growth in Oshawa is exemplified by the growth of key industries in the local knowledge
sector, specifically in education and health care. These developments have been accelerated by
investment and growth at the four academic institutions that have a presence in the city, the University
of Ontario Institute of Technology (UOIT), Durham College, Trent University Durham, and Queen’s
University.
The growth of UOIT, in particular, has produced a visible impact on the community, as the institution has
established and continues to develop a downtown presence6. Further, along with Durham College, the
institutions continue to grow and developed the shared north campus, supporting positive economic
and social shifts in the northern parts of the city. This has significantly impacted the landscape of many
neighbourhoods in the city, leading to business development and the revitalization of several properties.
Significant growth in the local health care and biosciences sector has also occurred in the city. This has
been centred around the development of Lakeridge Health, the leading hospital and health care facility
in Durham, with an increasing capacity for research and education7.
Along with economic development, the city has planned and experienced significant investment in new
housing development. Since 2014, Oshawa has set new records each year for total construction value
across the city8, signifying the rapid growth of the community’s housing and other built infrastructure.
This growth is not all in sub-urban residential development, as there are plans for several high density
urban residential and commercial developments at several locations across the city.
Despite overall population growth in the city remaining relatively modest, these developments have
provided a foundation for positive shifts in the nature of the local population. For example, much of the
growth over the past decade has been driven by the growth in immigrant communities in the city.
Further, this growth in the local immigrant population has been accompanied by a shift from immigrants
who arrived in Canada more than 25 years ago, to those who have arrived in the past 15 years.
6
Urban Strategies Inc.,2009, Into the Future: A framework and action plan to grow UOIT and Downtown Oshawa.
7
Oshawa, 2017, Community Profile, p. 26. www.oshawa.ca/business-and-investment/resources/2017_Community_Profile_Complete-2.pdf
8
City of Oshawa, 2017, Community Profile, www.oshawa.ca/business-and-investment/resources/2017_Community_Profile_Complete-2.pdfSocial and Economic Inequality
At the same time that strong growth and economic development have occurred, social and economic
inequality has created a divide among those who are benefiting from, and participating in the positive
growth, and those who are increasingly being left behind. This is apparent in multiple economic
indicators assessed at the city and neighbourhood levels. For example:
• Despite increased economic opportunity and new job growth, Oshawa consistently has an
unemployment rate that is higher than that of Durham region as a whole, and the city’s
neighbouring municipalities.
• The city has a median household income that is approximately $15,000 less than that of Durham
region as a whole.
• The low-income rate for Oshawa is 4% higher than that of Durham as a whole, and consistently
higher than in neighbouring municipalities. Further, the rate of children under the age of 6 years
living in low income households in 7% higher in Oshawa that in Durham as a whole.
These negative trends hold across an assessment of multiple indicators of social, health, and economic
well-being and generally occurs between defined geographic boundaries. That is, there is a distinct
geographic pattern (defined by neighbourhoods) to the social and economic divide across the city. This
analysis has been supported by the Region of Durham Health Departments Health Neighbourhoods
Project, which has allowed for a strong division of data at the neighbourhood level across the city.
Summary of Community Needs
Identified needs and trends were ranked to help identify primary, secondary, and tertiary concerns that
may be addressed using a smart cities approach. The outcome of this ranking process is presented in
Figure 9.
Primary
Social & Economic Inequality
There is stark inequality across multiple social, health, and economic dimensions in Oshawa that are often
bound and defined by geography.
Population Transit & Housing Economic Change
Secondary
Change Transportation Access to affordable The City’s economy
The population in Mobility and public housing for both has shifted and
Oshawa is growing, transit access are a owners and renters become more diverse,
ageing and increasingly challenge in some limited. creating opportunities
diverse. areas of the City. and challenges.
Health & Safety Service Planning & Access Community Engagement
Tertiary
There are health and safety Access to community programs There are challenges in engaging
concerns in the City that are and services is limited by residents in the planning
generally associated with geography, information access, process, this is especially true in
inequality and poverty. and mobility across the City. Priority Neighbourhoods.
Considered
Environment Community Planning
Figure 9: Summary of Findings
10The hierarchy used to distinguish findings is premised on two assumptions:
1. Prominence: The prominence of a theme, as it appears and is supported by the data and
information reviewed. Prominence was assessed by volume (i.e. number of times the theme
appears in the analysis), and by importance (i.e. the impact of the theme on the community).
2. Qualification: The qualification of a theme is based on its quality as a social issue that may be
considered under the Smart Cities Challenge guidelines from Infrastructure Canada.
Primary Trend: Social and Economic Inequality
Social and economic inequality has been identified as the primary challenge affecting the city. Inequality
is an important determinant of community health and well-being, and, as is evident in this analysis, can
have wide-reaching impacts across the city.
Research over several decades has consistently demonstrated that, within advanced economies, income
inequality has a greater impact on health, social, and economic well-being than absolute levels of wealth
and poverty. In fact, across multiple indicators of well-being, there appears to be a direct correlation
between positive social and economic outcomes and inequality9.
These trends are evident in Oshawa. An assessment of life expectancy at birth for both males and
females, indicates a correlation between lower median income at the neighbourhood level in Oshawa
and lower overall life expectancy (Figure 10).
Median Income
Highest Lowest
Figure 10: Life Expectancy at Birth and Neighbourhood Median Income in Oshawa10
9
Wilkinson, R. and Pickett, K, 2011, The Spirit Level: Why Equality is Better for Everyone, Penguin UK.
10
Region of Durham Health Neighbourhood Profiles, online at https://www.durham.ca/en/health-and-wellness/health-neighbourhoods.aspx.
11The data in Figure 10 also point to the primary parameter of inequality in the city; geography. That is,
there is a distinct pattern in Oshawa of neighbourhood inequity, where, in general, some communities
are doing well across multiple indicators of health and well-being, while others, in stark contrast, are
doing poorly.
Priority Neighbourhoods
Prepared and released by the Durham Region Health Department the Health Neighbourhoods Project
provides a comprehensive overview of 50 identified neighbourhoods across Durham’s eight
municipalities11. As of December 2017, the release now includes 89 indicators 12 of community health
and well-being13. The stated goal of the project is “to support strong, safe and equitable
neighbourhoods that improve the health and well-being of all residents” 14.
Of the 50-identified health neighbourhoods, seven were identified as Priority Neighbourhoods15,
including:
Priority Health Neighbourhood Municipality
• Downtown Ajax Ajax
• Downtown Whitby Whitby
• Lakeview Oshawa
• Gibb West Oshawa
• Downtown Oshawa Oshawa
• Central Park Oshawa
• Beatrice North Oshawa
Collectively, these seven neighbourhoods account for 15% of Durham’s total population but are
overrepresented in key health indicator areas of concern, such as child poverty rates, low school
readiness, poor oral and physical health, and average visits to emergency rooms16. In addition, these
neighbourhoods have lower than average scores on key social and economic indicators, such as median
income levels and levels of education attainment17.
In Oshawa, the five Priority Neighbourhoods are home to 61,770 residents, representing 41% of the
city’s population. Therefore, a significant proportion of Oshawa’s population live in communities that
are characterized by multiple indicators of precariousness. This is in contrast to other neighbourhoods in
the city, where the benefits of growth, opportunity, and economic development are apparent. It is this
social and economic inequality, defined in many ways by geography across the city, that has emerged as
the defining need and challenge for the city. It is an issue that stands on its own, while also exacerbating
the challenges posed by other community needs and concerns. There are three reasons for this
assessment:
1. Overrepresentation: Oshawa is disproportionately impacted by social and economic inequality,
and Priority Neighbourhoods, as five of the seven neighbourhoods are located in the city, and
they account for five of the twelve overall neighbourhoods identified in the city.
11
Region of Durham Health Department, 2016, The Health Neighbourhoods Project: Overview Report, https://www.durham.ca/en/health-and-
wellness/resources/Documents/HealthInformationServices/HealthNeighbourhoods/overview_Report.pdf
12
To access all available Health Neighbourhoods Data, including detailed profiles on all Neighbourhoods and interactive mapping tools, see:
https://www.durham.ca/en/health-and-wellness/health-neighbourhoods.aspx.
13
Region of Durham Health Department, 2017, A Guide to Health Neighbourhoods, https://www.durham.ca/en/health-and-
wellness/resources/Documents/HealthInformationServices/HealthNeighbourhoods/guide.pdf
14
Ibid, p.2.
15
Region of Durham Health Department, 2015, Building on Health in Priority Neighbourhoods, https://www.durham.ca/en/health-and-
wellness/resources/Documents/HealthInformationServices/HealthNeighbourhoods/buildingOnHealth.pdf
16
Ibid.
17
Ibid.
122. Relative Impact: The overrepresentation of Priority Neighbourhoods in Oshawa has a net-
negative impact on the health and social outcomes of the city overall.
3. Multiple and Complex Issues: Priority neighbourhoods present multiple and complex heath,
social, and economic issues that are often in contrast to relatively positive outcomes generally
affecting the city.
Income and Inequality
The primary root of the issues affecting priority neighbourhoods is economic (Figure 11).
The average Median After-Tax Household Income for the five Priority Neighbourhoods in Oshawa is
$44,000, which is 56% lower than the average Median After-Tax Household Income for the other seven
neighbourhoods in the city, and 59% lower than the Median After-Tax Household Income for Durham. In
comparison, the seven non-priority neighbourhoods in Oshawa have an average Median After-Tax
Household Income that is only 2% lower than that of Durham.
Median After-Tax Average Median After- Percent Difference to
Household Income (2011) Tax Household Income Durham
Durham $70,100
Oshawa $56,000 -25%
Lakeview $44,600
Gibb West $46,600
Priority
Downtown $32,500 $44,000 -59%
Central Park $52,700
Beatrice North $43,600
Grandview South $65,800
Stevenson North $62,500
Non-Priority
Hillsdale $60,500
Beatrice South $59,100 $68,814 -2%
Grandview North $84,000
Oshawa Northwest $69,900
Oshawa Northeast $79,900
Figure 11: 2011 Median Income by Health Neighbourhood in Oshawa18
The disparities in median income are born out in additional economic disparities in Oshawa:
• In the five Priority Neighbourhoods, the average low-income rate is 7% higher than the overall
rate for the City, and 12% higher than the average for the City’s seven non-Priority
Neighbourhoods (Figure 12).
• In the five Priority Neighbourhoods, the average rate of children living in low-income
households is 21% higher than the average in the City’s seven non-Priority Neighbourhoods
(Figure 13).
18
Region of Durham Health Neighbourhood Profiles, online at https://www.durham.ca/en/health-and-wellness/health-neighbourhoods.aspx.
13Figure 12: Low – Income Rate by Health Neighbourhood in Oshawa19
Figure 13: Children < 6 years in Low – Income Rate by Health Neighbourhood in Oshawa20
19
Source: Region of Durham Health Neighbourhood Profiles, online at https://www.durham.ca/en/health-and-wellness/health-
neighbourhoods.aspx.
20
Source: Region of Durham Health Neighbourhood Profiles, online at https://www.durham.ca/en/health-and-wellness/health-
neighbourhoods.aspx.
14As noted with the example of life expectancy above (Figure 10), the economic inequality across
Oshawa’s neighbourhoods has also had an impact on health and social outcomes. For example:
• The five Priority Neighbourhoods in Oshawa have a significantly higher rate of households that
are led by a lone female parent than the non-Priority Neighbourhoods (Figure 14).
• The five Priority Neighbourhoods in Oshawa have a significantly higher rate of the population
who did not complete high-school than the non-Priority Neighbourhoods (Figure 14).
• The five Priority Neighbourhoods in Oshawa have a higher unemployment rate than the non-
Priority Neighbourhoods (Figure 14).
Oshawa Northwest
Oshawa Northeast
Grandview South
Grandview North
Stevenson North
Beatrice North
Beatrice South
Central Park
Downtown
Gibb West
Lakeview
Hillsdale
Durham
Oshawa
Female Lone-Parent
14% 18% 26% 23% 26% 19% 27% 13% 15% 16% 15% 10% 12% 11%
Families
Did not complete
9% 14% 22% 20% 23% 17% 20% 12% 12% 10% 11% 7% 7% 7%
high school
Unemployment
9% 11% 14% 12% 16% 12% 14% 11% 10% 8% 8% 7% 11% 8%
Rate
Figure 14: Demographic Indicators by Health Neighbourhood in Oshawa 21
Red – Indicates a relative negative score at the neighbourhood level as compared the City average
Green - Indicates a relative positive score at the neighbourhood level as compared the City average
Response
As these Priority Neighbourhoods have entrenched and long-standing issues and concerns, there has
been some long-standing responses the needs and issues in these communities. This work has been
recently reviewed and summarized in a project by the Health Department, along with an advisory group
of community stakeholders. A report from the consulting group, Public Interest, presents an overview of
the current activities that are underway across Durham, and in specific Priority Neighbourhoods
(Appendix B), aimed at addressing the complex needs and issues of these communities.
21
Source: Region of Durham Health Neighbourhood Profiles, online at https://www.durham.ca/en/health-and-wellness/health-
neighbourhoods.aspx.
15Secondary Trends
The secondary trends identified are specific social and economic trends that have an impact on the
City’s current planning and development but have been determined to be subordinate to the primary
issue of social inequality. These trends are important to note and understand, and in many ways,
interact with the conditions of inequality described previously.
Population Change
Population change as occurred in the city of Oshawa. However, unlike in other municipalities in Durham,
this change has not been significantly driven by population growth over recent years, rather changes to
the make-up of the community have led to shifts in the population. This being said, Oshawa remains the
most populous municipality in the region (Figure 14) and is a primary urban centre with an increasingly
dynamic and diverse population. Some general notes on the population in the City:
• Over the last 25 years, the population in Oshawa has increased by 30,000 individuals (Figure 15).
• This represents a 20-year rate of growth (1996 – 2016) of 19%. This is 50% lower than Durham’s
overall growth rate for the same period and is significantly lower than the rate of growth in
several surrounding municipalities (Figure 17).
Oshawa 25%
Whitby 20%
Ajax 19%
Clarington 14%
Pickering 14%
North Durham 8%
Figure 15: Percent Share of Regional Population by Municipality in Durham (2016)22
159458
149607
138051 141580
129344 134364
1991 1996 2001 2006 2011 2016
23
Figure 16: Population Change in Oshawa, 1991 – 2016
22
Statistics Canada. 2017. Census Profile. 2016 Census. Statistics Canada Catalogue no. 98-316-X2016001. Ottawa. Released November 29
2017. http://www12.statcan.gc.ca/census-recensement/2016/dp-pd/prof/index.cfm?Lang=E.
23
Ibid.
1686%
74%
52%
41%
33%
16% 19% 18%
15% 15% 13%
6% 9% 7% 9%
3% 5% 5%
Durham Pickering Ajax Whitby Oshawa Clarington
5 year growth (2011-2016) 10 year growth (2006-2016) 20 year growth (1996-2016)
Figure 17: Population Growth in Durham by Municipality24
Aging Population
The population in Oshawa is aging (Figure 18). This is a common factor across Ontario and Canadian
communities as the Baby Boom generation approaches retirement and demographic and lifestyle
changes affect natural population growth.
80 to 84 years
70 to 74 years
60 to 64 years
50 to 54 years
40 to 44 years
30 to 34 years
20 to 24 years
10 to 14 years
0 to 4 years
6 4 2 0 2 4 6
Percent of Population
2011 Female 2011 Male 2016 Female 2016 Male
Figure 18: Population Pyramid for Oshawa, 2011 and 2016 Comparison25
24
Sources: (1) Statistics Canada. 2012. Census Profile. 2011 Census. Statistics Canada Catalogue no. 98-316-XWE. Ottawa. Released June 27
2012. http://www12.statcan.gc.ca/census-recensement/2011/dp-pd/prof/index.cfm?Lang=E and (2) Statistics Canada. 2017. Census Profile. 2016
Census. Statistics Canada Catalogue no. 98-316-X2016001. Ottawa. Released November 29 2017. http://www12.statcan.gc.ca/census-
recensement/2016/dp-pd/prof/index.cfm?Lang=E.
25
Ibid.
17The population pyramid shown in Figure 18 demonstrates an aging population profile, with lower and
decreasing population at younger age groups and a bulging population in the 40 to 65 years age groups.
Further, a general comparison of pyramids from 2011 and 2016 indicates reductions in the percent of
the population in some younger age groups (most notably 15 to 19 years) and growth in the populations
at older age groups (most notably age 55 to 59 years and 65 to 69 years).
The aging population will have a significant impact on the community’s social, health, and physical
infrastructure26, and will require investment and strategy to address. Work is already underway with the
Region of Durham preparing and releasing the Age Friendly Durham Strategy and Action Plan in April
201727. In addition, the Region of Durham has also established the Task Force on Affordable and Seniors’
Housing, who have a specific mandate to examine housing needs for seniors and other vulnerable
groups in the community. This group release a summary report with recommendations for action in
October 201728.
Although the impacts of an aging community are going to impact all neighbourhoods in Oshawa, there
does appear to be a differential impact in those neighbourhoods with both a higher proportion of the
senior residents, and those that have been identified as Priority Neighbourhoods. Figure 19 details some
of these discrepancies in health neighbourhood indicators. For example, Priority Neighbourhoods are
more likely than non-Priority Neighbourhoods to:
• Have increased rates of seniors living alone;
• Have increased rates of seniors visiting Emergency Departments due to falls, and;
• Have increased rates of ambulance calls for seniors.
Oshawa Northwest
Oshawa Northeast
Grandview South
Grandview North
Stevenson North
Beatrice North
Beatrice South
Central Park
Downtown
Gibb West
Lakeview
Hillsdale
Durham
Oshawa
Population age 65 + 12% 15% 10% 14% 19% 19% 13% 15% 19% 19% 22% 8% 11% 8%
Seniors living alone 21% 26% 25% 27% 54% 28% 33% 20% 22% 25% 28% 11% 14% 12%
Falls ED visit rate 57% 56% 49% 63% 74% 61% 50% 50% 51% 68% 53% 42% 41% 65%
65+
Ambulance call rate 16% 20% 25% 22% 38% 23% 22% 17% 18% 15% 17% 14% 14% 15%
65+
Figure 19: Seniors Well-Being Indicators by Health Neighbourhood in Oshawa29
Red – Indicates a relative negative score at the neighbourhood level as compared the City average
Green - Indicates a relative positive score at the neighbourhood level as compared the City average
26
Region of Durham Age Friendly Durham, Age-Friendly Durham Strategy and Action Plan, https://www.durham.ca/en/living-
here/resources/Documents/Age-FriendlyDurhamStategyandActionPlan.pdf
27
Ibid.
28
Region of Durham Affordable and Senior’s Housing Task Force, 2017, Task Force Recommendations Report,
https://www.durham.ca/en/doing-business/resources/Documents/HousingDevelopment/Accessible-Task-Force-Report_FINAL.pdf
29
Region of Durham Health Neighbourhood Profiles, online at https://www.durham.ca/en/health-and-wellness/health-neighbourhoods.aspx.
18Diversity
Ethno-cultural diversity is both a historic and current trend affecting Oshawa. Although Oshawa’s
population has primarily European and North American origins (Figure 20), this belies the historic
diversity of the community. There are also some there are some notable factors that are important:
• The North American Aboriginal (First Nations, Inuit, and Metis) population in Oshawa is larger
than in the surrounding municipalities.
• There are several well established ethno-cultural communities in the city, including long
established groups from Ukraine, Poland, Portugal, and the Caribbean.
• There is a growing population with Asian origins (including Middle Eastern, South Asian, and
East Asian communities).
71%
65%
35%
29%
18%
10%
8%
5% 5%
3% 2% 3% 2% 3%
North American Other North European Caribbean Central & South African Asian
Aboriginal American American
Oshawa Durham
Figure 20: Percent Population by Ethnic Origin (multiple responses) in Oshawa and Durham30
Shifts in the ethnic make-up of the community have been driven by two important factors: the growth
of the population who identify as visible minorities, and the growth of the new immigrant population in
the City.
Looking at Figure 21, we note the significant overall growth between 2006 and 2016 of the total
population who identify as visible minorities (increase of 122%) in Oshawa. This growth is not driven
solely by a single ethnic population, rather several groups show significant growth over this period, such
as those who identify as Arab (282% growth), South Asian (216% growth), and Filipino (178% growth). In
comparison, the population who do not identify as visible minorities in Oshawa only increased by 2.7%
over the same period.
30
Statistics Canada. 2017. Census Profile. 2016 Census. Statistics Canada Catalogue no. 98-316-X2016001. Ottawa. Released November 29
2017. http://www12.statcan.gc.ca/census-recensement/2016/dp-pd/prof/index.cfm?Lang=E.
192006 2016 Growth 2006 – 2016
Total population who identify as a visible minority 8.1% 16.0% 122.0%
Chinese 0.9% 1.4% 64.3%
South Asian 1.4% 3.8% 216.8%
Black 3.0% 5.5% 104.6%
Filipino 0.5% 1.3% 178.8%
Latin American 0.5% 0.8% 77.5%
Southeast Asian 0.2% 0.3% 76.8%
Arab 0.2% 0.6% 282.4%
West Asian 0.4% 0.4% 18.8%
Korean 0.2% 0.1% -30.2%
Japanese 0.1% 0.2% 26.8%
Visible minority; not identified 0.3% 0.8% 194.1%
Multiple visible minority 0.4% 0.8% 132.7%
Not a visible minority 91.9% 84.0% 2.7%
Figure 21: Visible Minority Population in Oshawa, 2006 – 201631
The distribution of visible minority populations across Oshawa’s neighbourhoods is relatively even
between Priority and Non-Priority neighbourhoods (Figure 22). This high numbers in the cities northern
neighbourhoods may reflect diverse populations moving into new development communities from
outside the City.
21%
20%
Priority Neighbourhood Average: 8.4% Non-Priority Neighbourhood Average: 10%
13%
11% 11%
10% 10%
9%
8%
7% 7%
5% 5% 5%
Beatrice North
Oshawa Northwest
Grandview South
Downtown
Lakeview
Durham
Hillsdale
Oshawa
Central Park
Gibb West
Beatrice South
Oshawa Northeast
Stevenson North
Grandview North
Figure 22: Visible Minority Population in Oshawa by Health Neighbourhood32
31
Statistics Canada. 2007. Oshawa, Ontario (Code3518013) (table). 2006 Community Profiles. 2006 Census. Statistics Canada Catalogue no. 92-
591-XWE. Ottawa. Released March 13, 2007.
http://www12.statcan.ca/census-recensement/2006/dp-pd/prof/92-591/index.cfm?Lang=E; Statistics Canada. 2017. Oshawa, CY [Census
subdivision], Ontario and Durham, RM [Census division], Ontario (table). Census Profile. 2016 Census. Statistics Canada Catalogue no. 98-316-
X2016001. Ottawa. Released November 29, 2017.
http://www12.statcan.gc.ca/census-recensement/2016/dp-pd/prof/index.cfm?Lang=E.
32
Region of Durham Health Neighbourhood Profiles, online at https://www.durham.ca/en/health-and-wellness/health-neighbourhoods.aspx.
20The second primary shift in the population that is impacting the City’s diversity is changes to the make-
up of the immigrant population.
In general, Oshawa’s immigrant population is older and well-established (Figure 23). However, the
population of more recent immigrants (measure by time of arrival in Canada) is increasing significantly in
the city, while the population of earlier arriving immigrants is decreasing (Figure 23).
17365
15690
Percent Change by Period:
Before 1991: - 10%
1991 to 2000: 42%
2001 to 2006: 72%
4290
3030 2620 2420
1525 1950
Before 1991 1991 to 2000 2001 to 2005 2006 to 2010 2011 to 2016
2006 Census Data 2016 Census Data
Figure 23: Immigrant Population in Oshawa by Time of Arrival, Total Population & Percent Change33
In addition, between 2006 and 2016, the immigrant population in Oshawa grew at a rate that was more
than double that of the non-immigrant population in Oshawa (Figure 24).
23%
10%
Non-Immigrants Immigrants
Figure 24: Growth in Oshawa’s Non-Immigrant and Immigrant Population, 2006 - 201634
33
Statistics Canada. 2007. 2006 Community Profiles. 2006 Census. Statistics Canada Catalogue no. 92-591-XWE. Ottawa. Released March 13
2007. http://www12.statcan.ca/census-recensement/2006/dp-pd/prof/92-591/index.cfm?Lang=E, and (2) Statistics Canada. 2017. Census Profile.
2016 Census. Statistics Canada Catalogue no. 98-316-X2016001. Ottawa. Released November 29 2017. http://www12.statcan.gc.ca/census-
recensement/2016/dp-pd/prof/index.cfm?Lang=E.
34
Ibid.
21Transit and Transportation
The challenge of transit and transportation may be viewed from two perspectives:
Transportation Planning • Pertaining to the assessment, management, and future development of local transportation
infrastructure and policy.
• Considers population growth, employment development, and future planning.
• Impacted by jurisdiction responsibilities and thus affected by multiple planning and policy
parameters.
Transportation Access • Pertaining to community and resident access to existing and future transportation networks
and infrastructure.
• Considers physical, social, health, economic, and geographic factors which may impact upon
resident access to transportation options available in the city.
From the planning perspective, the approach is multi-layered with multiple levels of government
involved in the complex task of planning an integrated transit and transportation approach that meets
the need of the City of Oshawa as well as its neighboring communities. This planning and policy
approach is reflected in four key documents pertaining to Oshawa:
• City of Oshawa Integrated Transportation Master Plan (2015)35
• Durham Region Transit, 2018 Service Priorities (May 2017)36
• Metrolinx, Draft 2041 Regional Transportation Plan for the GTHA (September 2017)37
• Durham Transportation Master Plan (November 2017)38
Given the complexities of transit planning, and the fact that they remain a multijurisdictional issue
covered in multiple, detailed analyses, a detailed analysis of transit needs was deemed to be beyond the
scope of this report. However, some key points on transit behaviour are pertinent and are outlined
below.
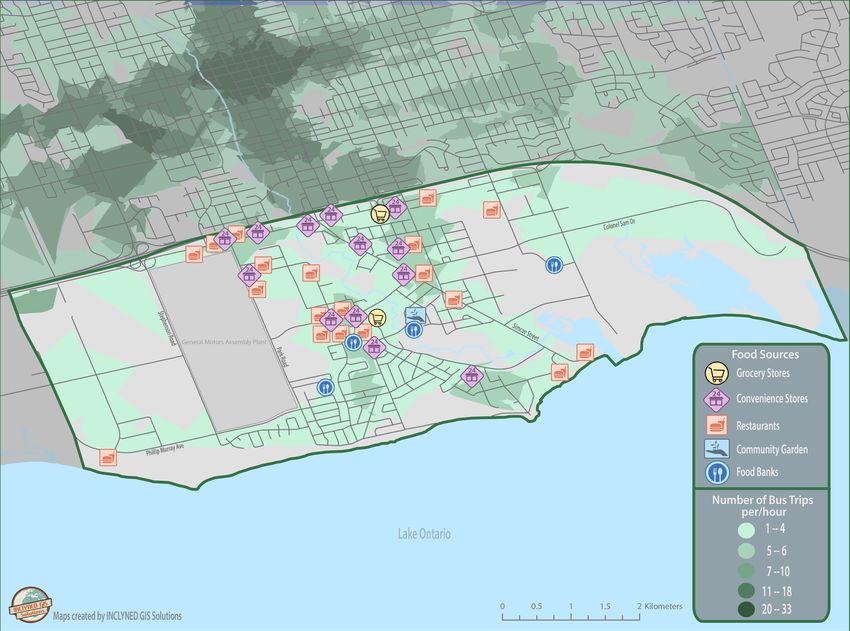
Looking at daily commuting patterns it is noted that nearly 58% of all daily commuters remain in the City
when they travel to work (Figure 25). The next largest group remains in Durham, with 19% travelling to
the west of the city (Whitby, Ajax, and Pickering) and 11% travelling to the east (Clarington).
Peel 0.63%
York 1.83%
Toronto 4.72% 7%
Pickering 2.21%
Ajax 3.10%
Whitby 14.07% 19%
Oshawa 57.77%
Clarington 10.86%
North Durham 2.8%
Northumberland 0.04%
Peterborough 0.52%
Kawartha Lakes 1.45%
Figure 25: Location of Daily Commute by Percentage of Commuters from Oshawa39
35
https://www.oshawa.ca/city-hall/resources/ES_-ITMP-March-3-2015.pdf
36
https://www.durhamregiontransit.com/RiderInfo/Documents/DRT_2018%20Service%20Plan%202017-05-19.pdf
37
https://www.metrolinxengage.com/sites/default/files/draft_rtp.pdf
38
https://durhamtmp.ca
39
The Corporation of the City of Oshawa Integrated Transportation Master Plan, 2015, https://www.oshawa.ca/city-hall/resources/ES_-ITMP-
March-3-2015.pdf, p. 8.
22As a starting point, it is useful to note that 73% of commuters in Oshawa drive a personal car to and
from work each day40. An additional 18% travel as passengers in a personal car each day41. Only 6%
report using public transit to get to work each day42.
This pattern is reflected in the neighbourhood level data. When looking at primary transit to work across
the City’s 12 neighbourhoods, use ranges from 62% of commuters (Downtown) to 82% of commuters in
Hillsdale, Beatrice South, and Oshawa Northeast (Figure 26).
This data also indicates that residents in Priority Neighbourhoods are less likely to use a care to
community and are more likely to use public transit (Figure 26). This is important in the assessment of
transportation access.
81% 81% 82% 82% 80% 79% 82%
78%
74% 72% 70%
62%
16% 13%
9% 7% 9% 8% 7% 6% 9% 8% 8%
ND
Central Park
Beatrice North
Oshawa Northwest
Grandview South
Grandview North
Downtown
Lakeview
Hillsdale
Gibb West
Beatrice South
Oshawa Northeast
Stevenson North
Averages:
Car PT
PN 72% 11% Car Public Transit
NPN 81% 8%
Figure 26: Percentage of Neighbourhood Residents by Mode of Transportation to Work
Looking to transit access, the primary concerns identified across multiple community research and
planning reports43 are:
• Limited options for transportation beyond a car for convenient transit and transportation
• Affordability of car alternatives – including public transit, ride sharing, and taxies
• Frequency and timing of current public transit routes
• Low levels of walkability in some neighbourhoods
40
The Corporation of the City of Oshawa Integrated Transportation Master Plan, 2015, https://www.oshawa.ca/city-hall/resources/ES_-ITMP-
March-3-2015.pdf, p. 9.
41
Ibid.
42
Ibid.
43
Including: Earle, B. & Alvi, S., 2011, Giving Voice to Poverty in Durham Region, Community Development Council Durham; Durham
Workforce Authority, 2015, Social Assistance in Durham Region, Unpublished; YPCC, 2016, My Life, My Voice: The experience of young
parents in Durham Region; Community Development Council Durham, 2017, Living Wage in Durham Region; Earle, B., 2018, Community
Service Planning in South Oshawa, Durham Workforce Authority.
23Housing
Housing development in Oshawa is broadly characterized by a disparity between strong new housing
development figures on one hand, and an increasing need for repair and investment in affordable
housing opportunities for residents on the other.
Indicative of the positive trend is the city achieving multiple housing development records over the past
several years, including:
• Seven building permit records in 2016, including achieving the highest residential construction
value issued in the city in a single month ($126 million) and $332 million in total residential
contraction value in the year.
• Complimented by positive housing developments to support students and seniors and plans to
diversify the Downtown neighbourhood with new high-density residential development.
These positive trends bely some concerning shifts in the local housing market that have placed
increasing pressure on existing housing stock and created barriers to entry for those at the lower end of
the income scale.
The vacancy rate across the City is at its lowest point since 2001 and has generally shown a downward
trend since 1992 (Figure 27). This trend has had an impact on those with low-income securing and
maintaining appropriate housing44.
6
5
4
Percent Housing Stock
3
2
1.7
1
0
1992 1994 1996 1998 2000 2002 2004 2006 2008 2010 2012 2014 2016
Figure 27: Vacancy Rate for Oshawa CMA, 1992 - 201645
A similar trend is noted in seniors rental housing in Oshawa, with vacancy rates dropping significantly
since 2010 (Figure 28).
44
Earle, B. & Alvi, S., 2011, Giving Voice to Poverty in Durham Region, Community Development Council Durham; Durham Workforce
Authority, 2015, Social Assistance in Durham Region, Unpublished
45
Canadian Mortgage and Housing Corporation, 2016, Canadian Housing Observer: Rental Vacancy Rate, Canada, Provinces and Metropolitan
Areas (1992-2016).
2420
18
16
14
12
11.3
10
8
6
4
2
0
2010 2011 2012 2013 2014 2015 2016
Figure 28: Seniors’ Rental Housing Vacancy Rate for Oshawa CMA, 2010 - 201646
Low vacancy rates tend to correlate to higher rental costs47, making housing affordability a concern for
those segments of the population with lower incomes. In Oshawa, we see this trend, as rental rates have
increased for both the primary rental market (Figure 29) and seniors rental market (Figure 30) in the City
over the same period that vacancy rates have dropped.
$1,200
$1,100
$1,000
$900
$800
$700
$600
$500
1992 1994 1996 1998 2000 2002 2004 2006 2008 2010 2012 2014 2016
Figure 29: Average Rental Cost of A Two-Bedroom Apartment in Oshawa CMA, 1992 - 201648
46
Canadian Mortgage and Housing Corporation, 2016, Canadian Housing Observer: Seniors’ Rental Housing, Canada, Provinces and
Metropolitan Areas (1992-2016).
47
Canadian Mortgage and Housing Corporation, 2017, Rental Market Reports – Canada and Provincial Highlights, https://www.cmhc-
schl.gc.ca/en/hoficlincl/observer/observer_212.cfm
48
Canadian Mortgage and Housing Corporation, 2016, Canadian Housing Observer: Rental Vacancy Rate, Canada, Provinces and Metropolitan
Areas (1992-2016).
25$3,300
$3,200
$3,100
$3,000
$2,900
$2,800
$2,700
$2,600
$2,500
2010 2011 2012 2013 2014 2015 2016
Figure 30: Seniors’ Rental Housing Average Rent for Oshawa CMA, 2010 - 201649
These trends have impacted the percent of income that Oshawa residents are paying for housing, with
28% of the population who pay for shelter paying 30% or more of their income for shelter (Figure 31).
This may lead to precarious housing, especially for those with unstable or low-incomes. This is
concerning in regard to the City’s Priority Neighbourhoods. As Figure 31 indicates residents in these
neighbourhoods are more likely to rent rather than own and are more likely to pay more of their income
toward shelter. Further, the housing in these neighbourhoods is more likely to be in disrepair.
Oshawa Northwest
Oshawa Northeast
Grandview South
Grandview North
Stevenson North
Beatrice North
Beatrice South
Central Park
Downtown
Gibb West
Lakeview
Hillsdale
Durham
Oshawa
Moved residence in
10% 13% 12% 14% 18% 13% 18% 9% 12% 10% 11% 10% 12% 16%
last year
Households that
17% 30% 39% 42% 61% 25% 58% 12% 24% 23% 31% 3% 15% 4%
rent
Shelter costs >30% 25% 28% 33% 32% 39% 26% 33% 19% 24% 25% 25% 21% 28% 25%
of income
Not Suitable
5% 6% 9% 7% 8% 5% 9% 4% 5% 6% 4% 2% 4% 3%
Housing
Major dwelling
5% 7% 10% 8% 13% 9% 6% 7% 5% 10% 5% 2% 5% 1%
repairs needed
Figure 31: Housing Indicators by Health Neighbourhood in Oshawa 50
Red – Indicates a relative negative score at the neighbourhood level as compared the City average
Green - Indicates a relative positive score at the neighbourhood level as compared the City average
49
Canadian Mortgage and Housing Corporation, 2016, Canadian Housing Observer: Seniors’ Rental Housing, Canada, Provinces and
Metropolitan Areas (1992-2016).
50
Ibid.
26Economic Change and Development
The economic landscape in Oshawa has undergone significant shifts over the past decade as the City
makes the transition from manufacturing hub to knowledge-economy centre. This shift is generally
characterised by, (1) a reduction in the traditional manufacturing base with new investments in
advanced manufacturing, (2) growth in knowledge-based, technology-driven sectors, and (3 ) growth in
retail trade and service industries. The primary specified industries in Oshawa are:
10%
Manufacturing
28%
Retail
14%
Education
Health
Public Administration
Accomodation/Food Service
10%
4%
Construction
5% Professional Services
Other
6%
16%
7%
Figure 32: Key Industries in Oshawa by Share of the Labour Market (2016)51
Over the past decade there has been a marked change in the size of the workforce in key industries
(Figure 33). This shift is indicative of the movement described at the outset, where the labour market is
moving from one anchored by manufacturing, to one driven by knowledge-based sectors. At the same
time, the wholesale and retail trade sector has remained a consistent and significant part of the local
economy and labour force (Figure 33).
19800
17879
14515 14670
12745 12375 12135 13000
10680
2001 2006 2016
Manufacturing Health and Education Wholesale and Retail Trade
Figure 33: Change in Key Industries in Oshawa, 2001 to 200652
51
City of Oshawa, 2017, Community Profile.
52
Statistics Canada. 2017. Census Profile. 2016 Census. Statistics Canada Catalogue no. 98-316-X2016001. Ottawa. Released November 29
2017. http://www12.statcan.gc.ca/census-recensement/2016/dp-pd/prof/index.cfm?Lang=E
27Within the context of this change, the City has experienced positive economic growth for many years,
and this is projected to continue as job growth is projected to increase by 12% by 2021, and by an
additional 8% by 2031(Figure 34).
12%
10%
86,835 90,790
84,660
75,305
68,270 5%
3%
2011 2016 2021 2026 2031
Total Jobs Job Growth From Previous Period
Figure 34: Job Growth in Oshawa, 2011 to 203153
In relation to its neighbouring municipalities, Oshawa has the highest share of local jobs in the Region
(Figure 35). This is expected to continue through to 2031, even as other municipal economies grow.
8% 7% 7% 7% 7%
10% 10% 10% 11% 11%
30% 28% 27% 26% 26%
18% 18% 20% 20%
18%
15% 15% 15% 14%
15%
18% 21% 22% 22% 22%
2011 2016 2021 2026 2031
Pickering Ajax Whitby Oshawa Clarington North Durham
Figure 35: Share of Jobs by Durham Municipality, 2011 to 203154
53
Statistics Canada. 2017. Census Profile. 2016 Census. Statistics Canada Catalogue no. 98-316-X2016001. Ottawa. Released November 29
2017. http://www12.statcan.gc.ca/census-recensement/2016/dp-pd/prof/index.cfm?Lang=E
54
Ibid.
28You can also read