Pre-Election Report PALMERSTON NORTH CITY COUNCIL - Local Government Elections 2019
←
→
Page content transcription
If your browser does not render page correctly, please read the page content below
PALMERSTON NORTH CITY COUNCIL

Pre-Election Report
Local Government Elections 2019

                                                             pncc.govt.nz

He iti rā, he iti pounamu                    Te Kaunihera o Papaioea
Small city benefits, big city ambition   Palmerston North City Council
About this report

                   Message from the Chief Executive

                   Who lives in Palmerston North City?

                   Vision and Goals

                   Issues facing the Council

                   Major projects the Council is planning
                   for next three years

                   Council’s Finances

                   Key Election dates

    Let’s be #PalmyProud
    The next local government elections take place on Saturday 12 October. So make
    sure you vote.
    Elections mean you vote for the Mayor and Councillors who best represent you and
    what you want for our city. It’s important because these people will make decisions
    about Palmerston North City – on your behalf.
    Elections give you a chance to determine who represents your voice so we can
    continue to be #PalmyProud.

2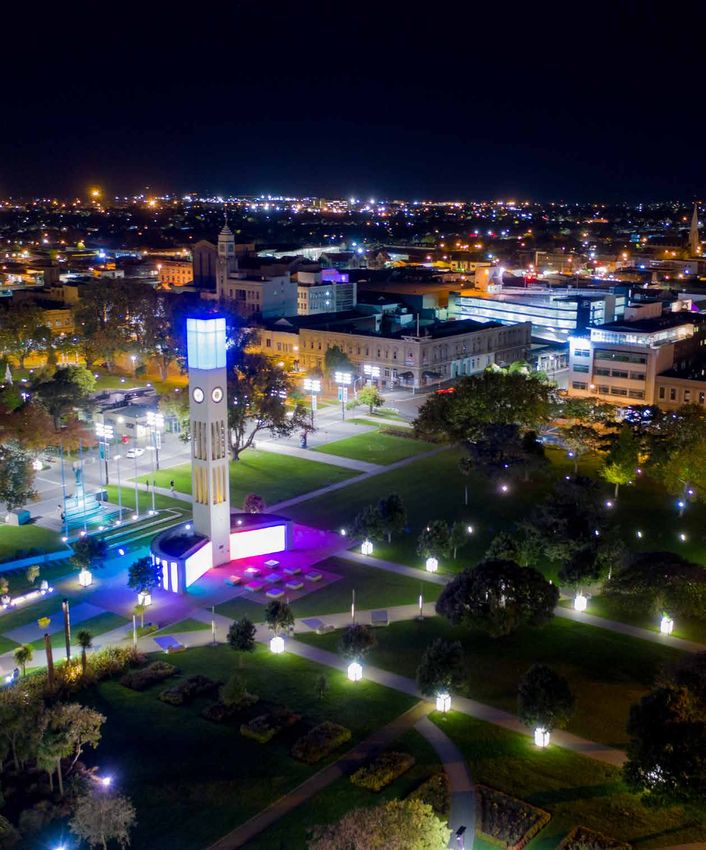
The purpose of this report
This Pre-Election Report (PER) provides voters and candidates with information about the key issues facing our
Council and City. Its purpose is to promote public discussion and informed debate in the lead-up to the local
body elections to be held on Saturday 12 October 2019.
It includes key issues facing the city, a close look at our financial position and how we fund our projects,
services and facilities.
Whether you’re looking to stand for Council or are voting, this report is important as it provides key facts you need to
know before standing or voting.

Why it’s been prepared
We want to ensure you know and understand what’s planned for our city and the challenges we face. We hope it will
help with everyone making better decisions and understand the current position of our city.
It’s prepared by Chief Executive, Heather Shotter independently from the Mayor and Councillors and is a legislative
requirement of the Local Government Act 2002.

Audit information
This report is not required to be audited and includes information from audited reports and unaudited information.
All full reports Can be obtained from our website: pncc.govt.nz and include:
•   Financial Strategy
•   Annual Plan
•   Annual Report
•   10-Year Plan

                                                                                                                           3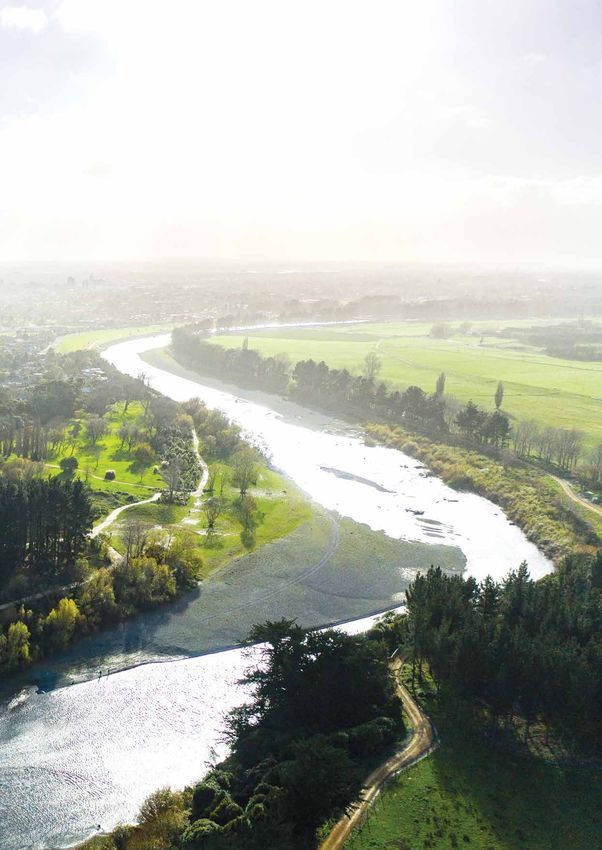
Message from the Chief Executive
Palmerston North is entering a period of transformational change. There is a new energy about the city, and it is an exciting
place to be. Our city’s elected and executive leaders are about to navigate a decade of extraordinary growth, challenge and
opportunity. Changes in technology, demographics and ways of working have radically shifted prospects for regional cities
like Palmerston North. Each is wrestling for capital, talent, visitation and reputation in a global contest.
Our 10 Year Plan vision for Palmerston North is ‘Small city benefits,    partnerships. Relationships with Iwi partners have strengthened
big city ambition.’ We want to make Palmerston North a city with         with the imminent signing of a Kawenata agreement establishing
all the best that small and big cities can offer. We have strategic      a co-management committee for Te Motu O Poutoa (ANZAC Park)
goals for an innovative and growing city, a creative and exciting        and signing a partnership funding agreement with Rangitane o
city, a connected and safe community, an eco-city, and a driven          Manawatū.
and enabling council to catalyse achieving the city’s goals.             At the organisational level, we are prioritising a high-performance
Palmerston North can become the most desirable regional city             culture, customer-centric services, actively-engaged communities
in New Zealand. Our strategic goals are ambitious because the            and operational excellence.
future wellbeing of our communities depends on us achieving              Being a Councillor is a big responsibility. If you are standing for
them. Strong leadership is needed to manage the city’s steep             Council, I encourage you to read this report carefully, understand
growth and investment curve. Difficult choices and trade-offs            the complexities, and have a clear and informed position on
must be made. To realise opportunities cost-effectively for              the key issues so voters know what you stand for. Your voice
ratepayers, we must get priorities, resourcing, and financing right.     will help shape Palmerston North’s vibrant future. Your qualities
Council decisions must be made with clarity, creativity, velocity        of leadership – including ambition, decisiveness, integrity and
and sound judgment.                                                      creativity – will decide it.
We have good fundamentals for our ambitions. The success                 For our residents, I encourage you to understand the issues our
platform is built on our central location, a well-established,           city faces and exercise your democratic right to vote for the
innovative economic and business base, and an educated,                  Mayor and Councillors you think will best lead the Council for
youthful population. Council must lead a growth narrative.               the next three years. A great city has a great Council, one that
Over the next 25 years, the city population will increase by             represents and involves you.
around 20 per cent. The city’s population, salaries and wages,
visitor spending and house prices are all on the rise. Investment is
the big story, and much of the city’s prosperity will be built
on infrastructure.
More than $3 billion in public and private investment in the
Manawatū region, with the majority in Palmerston North, is
expected over the next 10 years. This is the game-changer for
                                                                         Heather Shotter
our city and the region. The scale of the capital investment in the
                                                                         Chief Executive
works is transformative, a power-driver of economic activity and
employment. Palmerston North is entering the most significant
period of sustained construction and development for 40 years,
with infrastructure projects spanning transport, energy, defence,
health, wind, wastewater and liveability.
In our 10 Year Plan, we’ve allocated more than half a billion
dollars towards future-proofing Palmerston North’s core public
infrastructure – the roads, water supply, wastewater, stormwater,
sports facilities, parks and reserves that all make our city tick. Our
largest infrastructure project is the upgrade to our Wastewater
Treatment Plant. Wastewater is perhaps a slightly unusual thing
to get excited about - but it’s essential. It’s not so much about
what it does, as what it enables – in this case, a city with capacity
to grow, and in an environmentally-sustainable way. Managing
costs of this project is critical.
When a new Council is elected in October, the Mayor and
Councillors are challenged to guide city development that
achieves our ambitions. The leadership challenges across
Council include strengthening decision-making, transparency,
cost-effectiveness and, critically – community engagement and

4
PALMERSTON NORTH CITY
                                      Ninth largest city in
                                      New Zealand with

                                      1.8%
                                      of the
POPULATION, 88,700                    national
     as at 30 June 2018               population.

PALMERSTON NORTH                                Average house price
HOUSEHOLDS

33,000
                                              (NATIONAL AVERAGE IS $689,000)
                                                                   (as at June 2019)

                                    The median age of
                                    PA L M ERS T O N N O RT H' S
                                    population in
                                    (second youngest city in NZ)

   TOTAL VISITOR SPENDING
  HAS INCREASED IN THE PAST
         12 MONTHS

                                        MEDIAN ANNUAL
 $365M             $68M
    Domestic        International
 visitors spend    visitors spend       are increasing faster than the rest of
    (up 1.3%)         (up 7.1%)                     New Zealand

                                                                                       5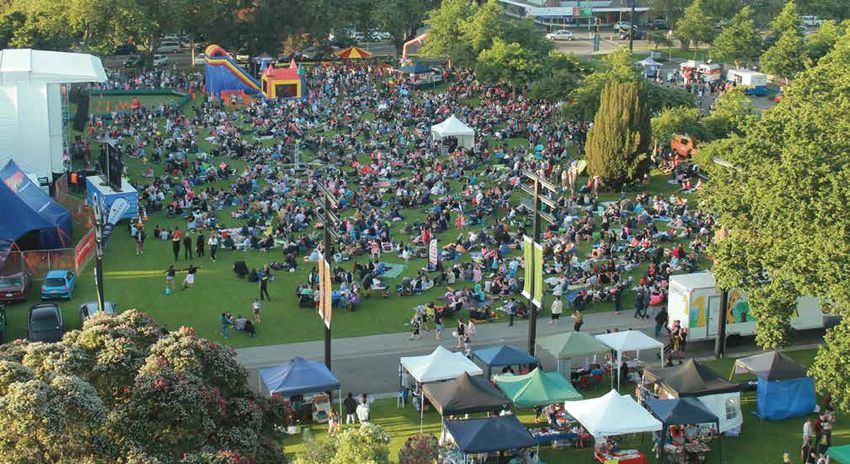
Infrastructure is the framework
                                                          on which we’re building our
                                                          future prosperity
                                                          The Regional Freight Ring Road project is designed to
                                                          divert heavy traffic around the city centre and connect
                                                          with two major new industrial zones we’ve created – one
                                                          to the west at Longburn, and one in the North East of the
                                                          city next to the airport.
                                                          We are KiwiRail’s key staging point in the lower North
                                                          Island, with about 2.4 million tonnes of rail freight
                                                          moving through the current facility in the past year. That
                                                          number is expected to grow by 60 per cent over the
                                                          next 20 years. Our MoU with KiwiRail and NZTA sees us
                                                          working towards the establishment of the freight hub in
                                                          the new North East Industrial Zone.
                                                          Co-locating the Regional Freight Ring Road, the airport
                                                          and the new rail facility will deliver a world-class
                                                          multi-modal transport opportunity, which we believe
                                                          will enable us to build the fastest and lowest-cost
                                                          distribution hub in New Zealand, reducing freight
                                                          emissions, taking the pressure off city roads and building
                                                          the local logistics industry.
                                                          Other large-scale capital investments are planned
                                                          alongside the transport infrastructure. The New Zealand
                                                          Defence Force in the vicinity of $400 million in upgrades
    Billions of dollars of                                and developments planned for Linton Army Base and
    investment are happening                              RNZAF Base Ohakea. Massey University is spending $184
                                                          million on new facilities and upgrades on buildings over
    in the next decade                                    the next 10 years. Mercury’s $256 million wind farm starts
                                                          construction this year and this Council has earmarked
    More than $3 billion in public and private
                                                          just under $130 million for our largest single capital
    investment will be made in the Manawatū
                                                          investment: the upgrade to our Wastewater Treatment
    region over the next ten years, primarily in
                                                          Plant. Te Ahu a Turanga: Manawatū-Tararua Highway
    Palmerston North.
                                                          has an estimated cost of $620 million with construction
    These are major projects which have been              expected to be underway in 2020.
    announced and are either in planning, have been
                                                          This will be the most significant period of sustained
    consented or are already underway.
                                                          construction and development in the city for 40 years.
    These projects are transformative and underpin        All these projects will not only be immediate drivers
    a tremendous growth spurt for the city,               of economic activity over the next decade as they
    providing a massive boost in jobs. This creates       are constructed, they’re also part of the framework
    new opportunities for a range of New Zealand          upon which Palmerston North will build its long-term
    businesses who are looking to expand or diversify.    prosperity.
    Three billion dollars over ten years is huge for a    We’re also investing in the key areas of liveability, like
    regional city – and that’s just what we already       affordable housing and accessible leisure – things that
    know about.                                           we might call our “wellbeing infrastructure”.
    It’s certainly a gamechanger. But it’s not a fluke.
    This incoming investment is building on solid
    economic foundations and taking advantage of
    external drivers which are working in our favour.

6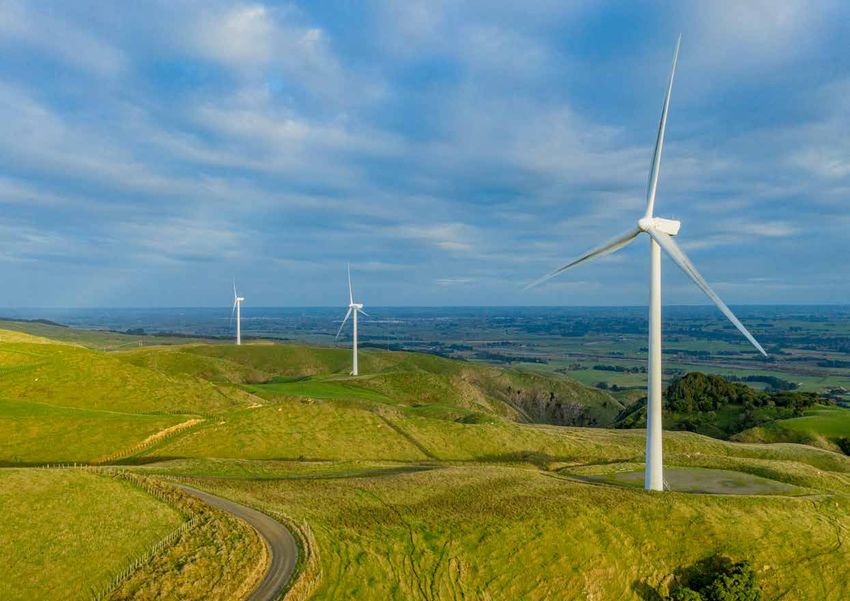
We’re a great place to live – that’s getting even better
Education:                                                      Communities plan that is focussed on our community
We’ve great schools, multiple tertiary education options,       working together in multiple aspects to ensure anyone
including Massey University with strengths in scientific        moving to our city feels welcomed, connected and can
research and product development.                               quickly become an actively involved in city’s lifestyle and
                                                                activities.
Our natural environment:
The city is built on the beautiful Manawatū river, banked       City Centre Streetscape:
with magnificent parks. The river area has a masterplan         We’re creatively redesigning our city centre streetscape
of catalyst projects in our 10 Year Plan, including             to make it even more attractive as a place to gather, shop,
enhancements to both natural biodiversity and our               eat and drink – as well as a more appealing location for
curated green spaces. We extended riverside walking and         office business.
cycling pathway network, with the recent opening of the
                                                                Arena Masterplan:
He Ara Kotahi shared pathway.
                                                                The delivery of the Arena Masterplan is gaining
We’re home to one of the largest mountain biking parks          momentum. Designs are now being finalised for the pits
in New Zealand.                                                 relocation and entry plaza projects and remain in-line
                                                                with our Long-Term Plan. The development will result in
The recently opened Central Energy Trust Wildbase
                                                                Central Energy Trust Arena offering a redesigned front
Recovery centre for native wildlife is also a popular visitor
                                                                entry to the venue and an attractive wide multi-use
attraction and education facility.
                                                                landscaped grassed edge to Cuba Street that can also be
Cultural attractions:                                           used as recreational space for the public, .
We have quality museums, New Zealand’s only
                                                                Design is also progressing on the embankment and
professional theatre outside of the main centres, an
                                                                south grandstand projects and a high-profile commercial
award-winning public art programme and a vibrant
                                                                building is being investigated to form part of the
music scene. Our events calendar is busy, and locals
                                                                Masterplan. This is intended to house multiple tenancies
love to turn out for celebrations, festivals and other
                                                                including sporting groups and other commercial and
community events.
                                                                community groups and would provide a sense of
Diversity welcomed:                                             entrance on the plaza to visitors.
Palmerston North is one of New Zealand’s recognised
                                                                The artificial turf is soon to open for public use. This
refugee centres and prides itself on being a welcoming,
                                                                valuable asset offers the City multiple-use for all-weather
diverse, inclusive and safe place for all its residents
                                                                conditions and extended hours. We received external
with over 130 different ethnic communities calling
                                                                funding amounting to $520k to assist with the cost
the city home. We’re taking part in a pilot Welcoming
                                                                of this turf.

                                                                                                                          7
Our advantages are many
and conditions favourable
Palmerston North has a natural advantage with its
location. We’re at the crossroads of the central North
Island and a key distribution hub for business.

We’re the centre of a productive Manawatū with one
of the most diverse land use in New Zealand. Our city’s
intersection with rural New Zealand not only creates
commercial opportunities, it offers lifestyle advantages
and ensures that we have ample land resources available
for future growth.
This provides the city with opportunities to act as
a national hub in our key sectors such as defence,
education, agri-business, research, health and logistics.
We’re home to well-established large employers,
including the head offices of New Zealand companies,
major educational institutions such as Massey University,
the New Zealand Defence Force’s Linton Army Camp, and
the local headquarters of multinationals companies.
As a university town with a youthful population, we have
a strong talent pool and a vibrant night-time economy,
plus an entrenched focus on research-based innovation
for critical sectors of the economy. For example, FoodHQ,
a world-leading cluster of technical expertise connecting
the science and the business of food.                       We’re changing ourselves to
                                                            enable the transformation of
                                                            our city
                                                            We have a range of internal systems and solutions
                                                            that we’re rolling out to accelerate our service
                                                            delivery. Processing of key administrative
                                                            documentation has been sped up. We’ve
                                                            improved Land Information Memorandum (or
                                                            LIM) report turnaround times to five days from
                                                            eight to ten. Last year we processed a record
                                                            number of building consents – nearly $300m.
                                                            We also established an Infrastructure Project
                                                            Management Office and a multi-disciplinary Asset
                                                            & Planning division to optimise infrastructure
                                                            investment through better coordination.
                                                            We’re building an organisational culture that looks
                                                            for opportunities to innovate and create these
                                                            gains in performance.
                                                            Our internal transformation will also set a
                                                            benchmark for enhancing capability in local
                                                            government. Our fresh approach to Ten Year
                                                            Plan development won the Local Government
                                                            New Zealand Excellence Award for Governance,
                                                            Leadership and Strategy last year.

8
Vision and Goals

He iti rā, he iti pounamu, Small city benefits, big city ambition
This vision reflects the value we all place on the great quality of life, community spirit, and affordable access to
services that comes with being a small city, while having the lifestyle, education and business opportunities some big
cities offer.
Our vision is about having the best of both worlds. Let’s make this happen.

We have five strategies that show how we’ll achieve this vision, each relating to one of our five goals for the city.
Our goals capture our desire for Palmerston North to be recognised for its great quality of life while at the same time
offering the lifestyle, education and business opportunities available in much larger cities.
Each strategy is underpinned by plans, made up of actions funded through the 10 Year Plan. You can read about these
actions in our strategies, and their associated plans. You can also explore them through an interactive map, which links
to the catalyst projects that are shaping our city.
These documents are all available on our website. pncc.govt.nz

                                                     Friendly and caring                 Lack diversity in employment
                                                            Safer                       Few educational opportunities
                                                   Easy to move around                            Less nightlife
                                             Closer to nature and green spaces                Young people leave
                                                      Quiet and relaxed                    Fewer ratepayers to meet
                                                       Healthy lifestyle                      infrastructural costs
          Small Cities                                 Family-friendly                      Limited public transport

       What we’re aiming for

       What we’re working to avoid

                                                  Traffic congestion and                    Wider variety of health,
                                                   long daily commutes                 social and educational services
                                            Housing tends to be more expensive              Good choices of shops,
                                                   Pollution and a large                restaurants, cafés and events
                                                 environmental footprint              More of these services and facilities
                                                        Impersonal                    within walking or cycling distance
            Big Cities                          Sprawl onto valuable land                  Wide range of good jobs
                                                     Noisy and rushed                    Lots of sporting and cultural
                                                                                         interest groups and facilities
                                                                                          More diverse communities
                                                                                               More innovation

                                                                                                                              9
Small City Benefits,

           Innovative & growing city                          Creative & exciting city

     City Development Strategy                          Creative & Liveable Strategy

     Economic Development Strategy                      Key projects:
                                                        •   Central Energy Trust Wildbase Recovery
     Key projects:
     •   City Centre Transformation                     •   Victoria Esplanade Masterplan

     •   Regional Freight Ring Road                     •   He Ara Kotahi bridge and shared
                                                            pathway
     •   Infrastructure for residential growth (City
         West, Aokautere, Ashhurst and urban            •   Te Apiti (Manawatū Gorge) biodiversity
         intensification)                                   and recreation
                                                        •   Manawatū River shared pathway
                                                            (Ashhurst to city)
                                                        •   Ahimate (Waitoetoe) Park and
                                                            Te Motu-o-Poutoa (Anzac Park)
                                                        •   Te Manawa 2025 redevelopments

10
Big City Ambition
Connected & Driven &
Eco city
safe community enabling council
Connected Eco City Strategy Driven & Enabling
Community Strategy Council Strategy
Key projects:
Key projects: • Wastewater treatment – A variety of actions will
• Social housing Nature Calls contribute to achieving this
development strategy, including a focus
• Te Apiti (Manawatū Gorge)
on digital transformation,
• Library biodiversity
strengthening partnerships, and
being more customer focused.
11Here’s a summary of our five goals
>65
+12,000 ON
JOBS BY CREATIVE
2028 CITIES INDEX
BY 2028
GOAL 1: INNOVATIVE GOAL 2: A CREATIVE
AND GROWING CITY AND EXCITING CITY
Our aspiration is to be a city that is clever about the way Our aspiration is to be a city that draws inspiration from
it uses its natural advantages to encourage and support the diversity within its culture and creates a vibrant
innovation, entrepreneurship and new industries, and urban environment that attracts creative and clever
positions itself to take advantage of change to fuel people, and nurtures creative talent.
sustainable growth, prosperity and well being.
Creative and Liveable Strategy
City Development Strategy &
We will build Palmerston North’s national and
Economic Development Strategy
international reputation as a creative and exciting place
We will drive entrepreneurship and innovation by to live, work and study. A creative city renowned for
providing the support, infrastructure, opportunities and its visual and performing arts, events, food, festivals,
conditions to enable traditional sectors to diversify and sporting events and great cultural institutions. A city
expand, and new industries and new economies to grow that has great places for people, and the attractions,
to create the employment opportunities that sustain and recreation options and experiences of a big city without
expand our city’s future. the hassle and cost. We will promote our city’s strength in
sport development, capability and participation.
Palmerston North will stand out by transforming its
economy to be low carbon. We will achieve this through delivery the following.
Nine plans:
We will achieve this through delivery the following.
Eight plans: 1. Active and public transport
2. Active community
1. Economic Development 3. Arts
2. Growth Infrastructure 4. City centre
3. Heritage Management 5. Culture and heritage
4. Housing and Future Development 6. Events and festivals
5. International Relations 7. Manawatū River
6. Strategic Partners Development 8. Palmy Unleashed
7. Strategic Transport 9. Placemaking
8. Urban Design
1290% SATISFIED -25% IN CO₂
WITH THEIR
STANDARD OF EMISSIONS
LIVING BY 2028 BY 2028
GOAL 3: A CONNECTED GOAL 4: AN ECO CITY
AND SAFE COMMUNITY Our aspiration is to have a future-focused city that plans
Our aspiration is to be a city that includes, supports, for and cares about the future, enhancing its natural
connects and uses the talents and advantages of the and built environment. Our city will realise the benefits
whole community in the pursuit of prosperity and to society from creating clean energy, lowering carbon
wellbeing. A city that has an international reputation emissions, and reducing our ecological footprint.
as a safe city in which to live, study, work and play. A
city that embraces its iwi heritage and partnership, and Eco City Strategy
where people connect with the city’s past, celebrating its
Palmerston North will have a sustainable future and a
history and heritage.
reduced ecological footprint through effective planning
of infrastructure and the protection, maintenance and
Connected Community Strategy
enhancement of our natural and built environment.
We will work to make it easy for Palmerston North We are working towards our city becoming a low
citizens to connect with each other and to the services, carbon economy.
infrastructure, facilities and opportunities that support We will achieve this through delivery the following.
individual development, health, prosperity and Five plans:
wellbeing, for the greater good of our community
1. Biodiversity
as a whole.
2. Energy
We will achieve this through delivery the following. 3. Sustainable practises
Six plans: 4. Three waters
1. Active citizenship 5. Waste
2. Community services and facilities
3. Community support
4. Healthy community
5. Safe community
6. Social housing
13LGNZ AN
'A RATED'
COUNCIL
GOAL 5: A DRIVEN AND
ENABLING COUNCIL
Our aspiration is to govern well, and build the leadership,
culture, capability and capacity required to efficiently
and effectively deliver, together with our community, the
change required to achieve the outcomes in council’s
new city vision.
We want to regularly receive high levels of
endorsement from customers, residents, partners,
stakeholders and peers.
We want to meet, beyond expectations, our
responsibility to manage and renew the
infrastructure upon which our community relies for its
health and wellbeing.
Driven and Enabling Council Strategy
We will work as one team with our community to be a
catalyst and enabler of change in the city. Our goal is
to do things in a simpler, faster, and better way for the
overall benefit of our community.
14Issues facing the Council
Palmerston North is a vibrant, growing regional City that’s well-positioned for the future.
However, there are some significant issues Council needs to address to maintain its path to a sustainable future.
Some of these are particular to Palmerston North, but many are a result of increased expectations from the
public and Central Government.
Council’s approach to its master planning has been to learn from other cities experiences and apply learnings to what
we develop and how we go about it. We encourage good urban design city-wide by demonstrating this ourselves.
We’re planning for multi-modal transport options to move people and goods within the city. We seek to collaborate
with partners and Councils in the region to address major issues such as transportation and the future management of
the ‘three waters’ (water, wastewater and stormwater) activities.
We’re also building more effective relationships with local iwi, addressing the challenges of housing supply and
working out how best to embrace new smart city digital technology.
Some of the key issues the Council will be addressing over the next three years are outlined in the following pages.
15Earthquake-prone buildings
Buildings classified as earthquake-prone and how to
manage them is a topical subject throughout New
Zealand.
Owners of classified buildings must consider options to
bring their building up to the required standard within
set time-frames under central government legislation.
Palmerston North is not immune from this issue and
faces the tightest time-frames due to our location
which is in a high seismic risk area. As building owners
obtain more detailed information about the scale of the
investment they may need, there will be challenging
decisions for them and potentially, the wider community.
Wastewater treatment and Many earthquake-prone buildings are also protected
discharge (Nature Calls) heritage buildings. This creates a strong tension because
alterations need to be sympathetic to the building and
Annually Council processes close to 13 billion demolition is discouraged within our District Plan.
litres of liquid waste from toilets, showers, This Council owns buildings classified as earthquake-
baths, dishwashers, washing machines, sinks prone and these are progressively being attended
and commercial and industrial processes. to. Council’s Central Library building is classified as
Our wastewater treatment plant removes earthquake-prone. We are now faced with reviewing
contaminants from the water before passing it how library services are delivered considering this
through a wetland pond for further treatment classification. Our 10 Year Plan does not provide for the
before discharging it to the Manawatū River. significant capital investment expected to address the
The discharge requires a resource consent and issue. This will be addressed during the development of
ours expires in 2028. our next 10 Year Plan.
We’re identifying ways to improve the treatment
of the water, especially when river levels are low
and we need to do this by 2021, a year before we
apply for a new consent.
We’re working with the community to
help identify preferred options to treat and
distribute wastewater.
The Council’s 10 Year Plan has assumed an
acceptable option (based on continuing discharge
to the river) will be achievable with a capital
outlay of $110 million (plus inflation), and that the
expenditure will happen between 2023 and 2028.
However, options involving wastewater disposal
to land or the ocean could cost significantly more.
All options have a significant impact on Council’s
debt levels and rates requirements. Finding
an option that strikes an acceptable balance
between regulatory requirements, public
expectations and an investment the City can
afford is a significant challenge for Council.
Palmerston North City is not unique in this regard
to paying for the increasing cost of infrastructure,
caused by growth, new environmental standards
and higher public expectations and is a challenge
for all Councils throughout New Zealand.
16Climate change
The Ministry for the Environment (MfE) advises
that climate change is the biggest
environmental challenge of our time.
There is growing expectation at all levels
that government agencies, including local
government, will act now to address the threats
posed by climate change.
The Government is in the process of progressing
the Climate Change Response (Zero Carbon)
Amendment Bill which will impose new legal
requirements on local government. For example,
when emissions targets and subsequent budgets
are set, local government will play a key role in
ensuring New Zealand achieves them.
There will be a requirement to prepare a new
policy and targets to ensure they match up with
Government requirements.
Our current target is a 25 per cent reduction
in CO2 emissions in Palmerston North by 2028.
The task of lowering the carbon footprint forces
Council to identify its inefficiencies and improve
Planning for city growth
the way it delivers infrastructure to improve
A Housing and Business Needs Assessment recently
energy efficiency, make better use of trees and
completed identifies a strong demand for further
natural systems, and take advantage of new
housing and business development. Our District Plan
technology opportunities. To achieve this target,
has provided for land to be developed for housing at
Council needs to provide the infrastructure that
Whakarongo and is in the process of providing for further
enables all the city to make low-carbon choices,
residential land development at Aokautere, Kakatangiata
particularly for transport.
(formerly City West) and Ashhurst, as well as new
The MfE predicts that over the longer term, the development sites within the existing urban area.
Manawatū-Wanganui region will become warmer
Our District Plan also promotes further infill, medium
and be subject to more extreme weather events,
density and city centre housing options and the use of
with the region experiencing more frequent
Council-owned land. Land is available for new lifestyle
heavy rainfall events as well as more frequent
blocks on the foothills of the Tararua ranges, away from
droughts. This has significant implications for
the City’s most productive land.
infrastructure, with many assets having life cycles
of more than 100 years, and in some cases longer. Further land has been provided for within the Plan for
Council needs to take account of expected industrial development at Railway Road and Longburn.
long-term future changes when they’re built. The We will soon start investigating options for further land
largest impact is on stormwater infrastructure. for small-to-medium scale industrial development.
New office and retail development will continue to be
directed to existing land in the city centre.
KiwiRail has announced it will develop a new freight hub
to grow Palmerston North’s nationally strategic freight
and distribution location. This is a significant opportunity
to build on the City’s existing strengths and establish
a modern, multi-modal freight hub with links to the
airport and the proposed regional freight ring road being
investigated by the New Zealand Transport Agency
(NZTA). A preferred location for the new freight hub
will be identified in early 2020. KiwiRail, NZTA and this
Council have committed to work collaboratively on these
projects to ensure an optimal outcome is achieved.
17Financing provision of services
Our 10 Year Plan incorporates a 30-year
infrastructure strategy and a financial strategy
that guide decisions about what we can do and
how it’s funded. These strategies rely heavily
on having quality information about our
infrastructure (especially underground assets, key
buildings and plant). We’re currently focusing on
improving our asset management planning, so we
have reliable forecasts of the investments needed
to make maintain and renew core infrastructure.
The level of investment required through to 2028
and the consequential increases in our debt and
Central government
required rates increases is outlined in our 10 Year ‘three waters’ review
Plan. The forecasts in the Plan were based on
assumptions made at the time. Central government has conducted a detailed review
of the provision of three waters (water, wastewater
As highlighted above, it’s likely the forecasts and stormwater) services. This follows investigations
underestimate what will be required to fund into examples of contaminated drinking water
the wastewater treatment and disposal project, supplies in some communities. We have undertaken
and earthquake-prone buildings (such as the detailed reviews of the security of our systems and are
Central Library). implementing improvements to lower any health and
Some of these issues will need to be considered safety risks.
during the preparation of the 2020/21 Annual The direction from central government is unknown.
Budget and a major review will form part of the Changes could include increased regulatory
development of the 2021-31, 10 Year Plan. requirements or more fundamental structural change to
More information about the Council’s financial the way water services are owned and managed.
position is provided in this report. We’re collaborating with other Councils in our region to
investigate possible service delivery options that might
meet central government’s needs but suit our respective
communities.
Council’s 10 Year Plan and budgets currently assume a
continuation of the status quo.
18Major Projects
Our 10 Year Plan incorporates projects grouped as catalysts for shaping our city of the future.
Sustainable Growth catalyst projects
NATURE CALLS
The focus over the next three years is evaluating options and deciding on a preferred option to enable Council to seek
a renewed consent for wastewater discharge.
Six shortlisted options involve discharging treated wastewater to a range of environments.
Five options involve applying most of the treated wastewater to land, with the remainder being discharged to either
the Manawatū River, groundwater, or the ocean. These options involve shifting where part or all of the city’s treated
wastewater is discharged.
One option is to discharge all treated wastewater to the Manawatū River, with the wastewater being treated to a
higher standard than it is currently. To recognise Māori cultural values, all discharges to the Manawatū River will first
pass through a wetland or land passage system. This reinforces the importance of the earth in cleansing the treated
wastewater before it enters the river.
An application for a discharge consent must be lodged with Horizons Regional Council by June 2022. The actual plant
upgrade work is currently scheduled for the period from 2023 to 2028.
19REGIONAL FREIGHT RING ROAD AND STRATEGIC ROUTES
We’ve been working with Horizons Regional Council and New Zealand Transport Agency (NZTA) to develop a regional
ring road around the City. This also includes an additional road bridge across the Manawatū River.
The regional freight ring road will:
• Reduce heavy traffic in residential areas
• Divert traffic out of the city centre and reduce congestion around the east of the city
• Improve the safety, efficiency and effectiveness of the transportation network
• Service parts of the city we intend to develop for housing
• Free-up capacity and link with alternate transport modes including rail, air, walking and cycling
• Connect to the new Manawatū -Tararua highway.
• Support existing activity and economic development opportunities at the airport, Food HQ and
Linton Military Camp
• Promote regional economic development.
Some of these projects are scheduled for the next three years but actual progress will be dependent on obtaining
financial support from NZTA.
URBAN GROWTH INFRASTRUCTURE
In addition to transport infrastructure we’ve programmed works for water, wastewater and stormwater reticulation in
the main growth areas of Whakarongo, Kakatangiata and the North East Industrial Zone at Railway Road.
We’re also working with landowners to make land available for development opportunities.
WATER NETWORK ENHANCEMENTS
Enhancements are planned by way of a duplicate pipeline, water treatment plant upgrades and additional reservoirs
over the next three years.
RENEWAL OF WATER, WASTEWATER, STORMWATER, ROADING
AND FOOTPATH ASSETS
We have a significant programme of renewals projects planned for water pipes and bores, wastewater pipes, road and
bridge renewals and an enhanced footpath renewal programme.
20City Centre catalyst projects
CENTRAL ENERGY TRUST ARENA MASTERPLAN
The masterplan seeks to modernise the Arena as the City’s premier hub for sports, events and a range of other
activities by:
• Creating a main entrance plaza and ticket facility at the corner of Cuba and Waldegrave Streets
to connect with the city centre
• Developing the speedway pits to build a purpose-built facility that’s attractive and safe for users
and visitors on the western side of the arena
• Constructing a new grandstand with covered seating for 3000 people on the south side
of the arena
• Developing Arena 5 into a multi-sport and community facility.
Progress with some of these projects over the next three years is partially dependent on attracting external funding.
STREETS FOR PEOPLE - CITY CENTRE STREETSCAPE
Streets around The Square, Broadway Ave and Main St East are being developed over several years to:
• Create more pedestrian-friendly public spaces
• Cultivate a vibrant city centre after 5pm
• Attract more private investment into the heart of our city.
The focus over the next three years is on the Square East (from the Plaza to ANZ), Main St East (including the bus
terminal) and Broadway Ave.
SEISMIC STRENGTHENING OF BUILDINGS
Provisions have been made for the progressive upgrade of Council-owned buildings identified as being earthquake-
prone. As outlined earlier there’s no budgetary provision to address upgrades to the Central Library building.
MANAWATŪ RIVER NETWORK CATALYST PROJECTS
Central Energy Trust Wildbase Recovery and the He Ara Kotahi bridge and shared pathway have provided great impetus
to the continued development of the river network as the city’s waterfront location.
The next three years focus is completing the riverside pathway to Ashhurst that will connect with the new shared path to
be provided alongside the new Manawatū-Tararua highway. We’re also developing a plan for the co-management of
Te Motu o Poutoa and the development of the Te Apiti Masterplan on behalf of the Manawatū Gorge Governance Group.
21Others SOCIAL HOUSING We’ve 296 self-contained units in 15 locations around the city and Ashhurst at subsidised rents. We also have 96, one, two and three-bedroom homes for families or single people on low incomes who experience barriers to renting in the private market. All properties are in high demand, with a waiting list of potential tenants. A redevelopment of Papaioea Place saw the first construction phase of a $7.3 million project completed this year with the opening of 30 new social housing units. We’ve brought forward funding for stage 2. Twenty units are under construction, with a further 28 units to be built next year. This will bring our total housing portfolio to 440 units. DIGITAL TRANSFORMATION We’re embracing the latest digital developments to improve customer service and effectively manage our organisation. Significant investments are required over the next three years to upgrade core systems and processes. 22
Our Finances
An overview
•   Our asset’s replacement value is over $1.7 billion. They’re in good condition and can accommodate
    significant city growth.
•   Our current debt levels are moderate for a regional city (especially given the range and quality of
    services provided).
•   Rates levels are comparable with other cities our size.
•   We’re planning for high population and household growth over the 10 years from 2018.
•   We’ve zoned land to cope with the next 10 years growth.
•   We need to invest in new and better catalyst projects to meet our Vision and goals for the City.
•   The upgrade to the City’s wastewater treatment and disposal system is the greatest single challenge to our long-
    term financial sustainability. We’ve assumed an acceptable option can be obtained for $133m ($110m without
    inflation), but there’s a high level of risk it could be substantially more.
•   To fund our existing services and key projects as outlined in the 10 Year Plan, including new capital expenditure of
    $530m, rates and debt levels will need to increase. With debt increasing to a forecast level of $367m.
•   To manage the additional debt, and to remain within our prudential borrowing ratios, the 10 Year Plan assumes
    rates will increase from 2021/22 onward to fund additional debt repayment.
•   Throughout the 10 years of the Plan it’s been assumed total rates will need to increase annually by
    between 4.6% and 5.7%.

                                                                                                                      23
The 10 Year Plan and Financial Strategy
Our 2018-28 10 Year Plan contains key information. It also outlines our financial strategy which guides the decisions
about what can be done and how it should be funded.
Key elements of the Strategy are:
• Ensuring our long-term financial position is sustainable.
• Recognising inter-generational funding requirements.
• Managing debt within defined levels.
• Maintaining our infrastructure for current and future generations.
• Ensuring financial capacity for future generations so they can fund high priority programmes.
• Providing for new infrastructure that builds capacity and enables the City to support new development
opportunities while avoiding financial risks associated with over provision.
In developing this Strategy, we focused on:
• Ensuring the City’s infrastructure can continue to provide desired levels of service and meet growth.
• The level of rates required to meet infrastructure needs.
• Creating a borrowing capacity to cope with future high-priority programmes.
As a result, the approach has been to:
• Encourage staff to provide innovative and efficient delivery of services.
• Commit to funding capital renewals at levels required to maintain assets.
• Challenge expenditure proposals to ensure they’re aligned to key Council strategies, that proposed timings are
realistic and able to be delivered.
• Peer-review capital expenditure budgets to ensure they’re adequate in the current challenging
contracting market.
• Ensure the expenditure required for growth is committed to, to enable the City to support development
opportunities, but not too early from when the infrastructure is required.
We need to borrow to fund major new capital developments in the same way as individuals do when they need a new
home or car. To help decide what is the maximum level of borrowing, which is sustainable, we’ve adopted prudent
limits (based on our core financial statements).
Due to uncertainty about some of the significant forecasting assumptions used for the development of the 10 Year
Plan (especially in relation to wastewater treatment and disposal and earthquake-prone buildings), we may need to
review some of our priorities to ensure long-term financial sustainability. Attention will be given to this when preparing
the next 10 Year Plan.
24The 2019/20 Annual Budget (Plan)
We adopted the Annual Budget for 2019/20 in June. We considered changed circumstances since the adoption of
the 10 Year Plan in June 2018. This means the forecasts contained in the 10 Year Plan may no longer be appropriate,
particularly given the financial and capital performance in 2018/19 and the effect that has on levels of debt and
assumptions.
Debt levels
This graph shows our actual debt for each of the three years to 30 June 2019 and the forecast for each of the years to 30
June 2023. The forecast figures are based on the 10 Year Plan 2018-28 but updated to include the assumptions made in
the 2019/20 Annual Budget.
250 GROSS & NET DEBT FORECAST
Gross
Gross
200
Net d
$ MILLION
150 Net d
100
50
2016/17 2017/18 2018/19 2019/20 2020/21
Gross debt (2020 AB 2021/22
forecast) 2022/23
Gross debt (actual)
Gross debt (2020 AB forecast) Net debt (gross debt less investment fund) (2020 AB forecast)
Gross debt (actual) Net debt (gross debt less investment fund) (actual)
Net debt (gross debt less investment fund) (2020 AB forecast)
To help guide decisionsNet
about whatdebt
debt (gross is the
lessmaximum level(actual)
investment fund) of sustainable borrowing we’ve adopted (as part of our
financial strategy within the 10 Year Plan) prudent limits.
2017/18 2018/19 2019/20 2020/21 2021/22 2022/23 25The following four graphs show these limits (expressed as ratios) compared with the actual figures for 2016/17 and
2017/18, the unaudited forecast figures for 2018/19, the Annual Budget figures for 2019/20 and the revised forecast
figures for 2020/21 to 2022/23, based on the assumptions in the 2019/20 Annual Budget.
250 NET DEBT TO REVENUE 25 NET INTEREST TO RATES
Policy max Policy m
200 2019/20 Annual budget forecast Net inter
20
Actual Net inter
150
% %15
100
10
50
5
2016/17 2017/18 2018/19 2019/20 2020/21 2021/22 2022/23
0
2016/17 2017/18 2018/19 2019/20 2020/21 2021/22 2022/23
NET INTEREST TO REVENUE 25 NET DEBT TO TOTAL ASSETS
16 Policy m
Policy max
14
20 Net deb
Net interest to revenue (2020 AB forecast)
12
Net interest to revenue (actual) Net deb
10 15
% 8 %
10
6
4
5
2
250
0 0 Policy max
2016/17 2017/18 2018/19 2019/20 2020/21 2021/22 2022/23 2016/17 2017/18 2018/19 2019/20 2020/21 2021/22 2022/23
250
200 Policy max 2019/20 Annual budget forecast
200 Policy max 2019/20 Annual budget forecast Actual
150
2019/20 Annual budget forecast
Actual
150
100
Actual
The 10 Year Plan forecasts net debt to increase to $367m by 2028 and 17% of assets (compared to a policy maximum of
100
20%). Against annual revenue, net debt50 is forecast to peak at 200%, which equates the policy maximum.
The 2019/20 Annual Budget includes revised assumptions about the nature and timing (mostly deferrals) of some
50
0
capital programmes. These are reflected2016/17 in the2017/18
graphs above.
2018/19 2019/20 However,
2020/21 2021/22the forecasts currently do not make provision
2022/23
for
0 the more expensive wastewater options or addressing the earthquake-prone library building. Future years
2016/17 2017/18 2018/19 2019/20 2020/21 2021/22 2022/23
spending will require careful balancing of the Council’s capital programme to ensure prudent debt management and
2017/18 2018/19 affordable
2019/20 levels
2020/21 2021/22 of rates.
2022/23
Palmerston North City Council has been assigned an AA long term credit rating by the international agency,
S&P Global Ratings.
26Rates
To fund all activities in the 10 Year Plan rate increases are needed. Conscious of the economic climate we’ve tried
to keep these increases to a reasonable level and challenge staff to continually use innovative and efficient ways of
delivering services.
We aim is to keep rates increases low while providing services the community expects and to balance the funding
needs for maintenance and renewal of our infrastructure. This is necessary to maintain the capability of our resources,
and the need to plan for a higher level of debt repayment to create enough capacity to service debt associated with
any unforeseen high-priority capital programmes.
We aim to limit rates and rates increases within limits specified in the financial strategy in our 10 Year Plan.
The two graphs below show the actual figures for 2016/17 and 2017/18, the unaudited forecast figures for 2018/19, the
Annual Budget figures for 2019/20 and the revised forecast figures for 2020/21 to 2022/23, based on the assumptions
in the 2019/20 Annual Budget.
7 PROPOSED RATES INCREASES
Gr
6
Ra
5
Ra
4
Ra
%
3
2
1
7
Gross debt (2020 AB forecast)
6 0
2016/17 2017/18 2018/19
Gross debt2019/20 2020/21
(2020 AB forecast) 2021/22 2022/23
Rates policy max
5
Gross debt (2020 AB forecast) Rates policy max Rates increase (2019/20 Annual Budget)
4
Rates policy max Rates increase (2019/20 Annual Budget) Rates increase (actual)
3
Rates increase (2019/20 Annual Rates
Budget)
increase (actual)
2
Rates increase (actual)TOTAL RATES TO LAND VALUE
1 2.5
Po
0
2016/17 2017/18 2018/19 2019/20 2020/21 2021/22 2022/23
2.0 Ra
2019/20 2020/21 2021/22 2022/23
2021/22 2022/23 1.5
%
1.0
0.5
0.0
2016/17 2017/18 2018/19 2019/20 2020/21 2021/22 2022/23
Policy max
Policy max Rates to land value (actual)
The actual rates increases compare the totalRates
actual ratesvalue
to land from(actual)
year-to-year whereas the forecast rates increases
compare the budgeted rates revenue from year-to-year.
The rates policy maximum is revised annually when the latest inflation adjusters are available. When developing
the 2020/21 Annual Budget we will consider the updated inflation forecasts and other updated information before
determining whether a rates increase will need to exceed the policy maximum.
27
017/18 2018/19 2019/20 2020/21 2021/22 2022/23Returns on investments
The following table shows our returns on investments compared to the quantified returns on investments specified in
the financial strategy in the relevant 10 Year Plan.
Palmerston North Airport Ltd
2016/17 2017/18 2018/19
Target Actual Target Actual Target Actual
Net surplus before
interest/tax/revaluations to 3.2% 3.1%* 3.0% 3.2% 3.9% 3.6%
total assets
Net surplus after interest/tax/
to consolidated shareholders’ 2.5% 2.2%* 2.1% 2.7% 3.1% 4.3%
funds
Interest cover
(net surplus before interest >=2.5 13.1 >=2.5 14.6 >=2.5 9.7
and tax to interest)
Net tangible worth >$35m $59.6m >$35m $60.7m >$50m $67.8m
Maintain high level of
customer satisfaction
>=90% 96% >=90% 90% 60% 40%
From 2018/19 measured as a
Net Provider score
Passenger throughput p.a. 631,000 629,411 639,000 657,515 656,310 687,142
* Note: that the 2016/17 statement of intent was set prior to the revaluation of assets. The resulting increase in asset
value has impacted on these performance measures being meet.
28Our Financial Position
Statement of Financial Position as at 30 June
Annual
Annual Report1 Estimate*2 2018-28 10 Year Plan1
budget2
2016/17 2017/18 2018/19 2019/20 2020/21 2021/22 2022/23
$000 $000 $000 $000 $000 $000 $000
ASSETS
Current assets
Financial assets 7,268 8,291 10,190 6,682 6,353 6,492 6,642
Other current assets 4,190 4,916 7,468 3,323 2,255 2,305 2,359
Total current assets 11,458 13,207 17,657 10,005 8,608 8,798 9,001
Non-current assets
Property, plant and
1,536,515 1,558,773 1,669,822 1,679,185 1,727,799 1,770,266 1,834,593
equipment
Intangible assets 1,498 1,410 1,337 1,410 1,498 1,498 1,498
Investment property and
6,907 7,177 5,920 6,458 6,505 6,505 6,505
forestry assets
Investments in CCOs and
13,053 13,178 13,591 13,052 13,052 13,052 13,052
industry companies
Investment fund 710 - - - - - -
Other financial assets - - - - - - -
Total non-current assets 1,558,683 1,580,537 1,690,670 1,700,105 1,748,854 1,791,321 1,855,648
Total assets 1,570,141 1,593,744 1,708,327 1,710,110 1,757,461 1,800,119 1,864,649
LIABILITIES
Current liabilities
* Estimate based on year to date 30 June 2019 forecast - 1 Audited - 2 Unaudited
Trade and other payables 22,676 28,818 30,357 33,793 27,568 27,728 27,899
Borrowings 27,000 25,000 10,000 - - - -
Total current liabilities 49,676 53,818 40,357 33,793 27,568 27,728 27,899
Non-current liabilities
Provisions and other
10,463 10,108 11,500 3,524 3,613 3,644 3,676
payables
Borrowings 70,000 74,875 111,200 166,833 222,628 241,218 260,851
Total non-current liabilities 80,463 84,983 122,700 170,357 226,241 244,862 264,527
Total liabilities 130,139 138,801 163,057 204,150 253,809 272,589 292,425
EQUITY
Total equity 1,440,001 1,454,944 1,545,271 1,505,960 1,503,652 1,527,529 1,572,223
The Statement of Financial Position reflects what Council owns and what it owes to other people.
The
imagemain changes reflect the planned investments in plant, property and equipment to maintain capability and
caption
provide for City growth and the increase in borrowings required to fund this.
29How spending is funded
Funding Impact Statement for the year ending 30 June
Annual
Annual Report1 Estimate*2 2018-28 10 Year Plan1
Budget2
2016/17 2017/18 2018/19 2019/20 2020/21 2021/22 2022/23
$000 $000 $000 $000 $000 $000 $000
SOURCES OF OPERATING FUNDING
General rates, UAGC and
65,259 67,606 71,768 75,203 80,093 83,281 88,127
rates penalties
Targeted rates (incl water by meter) 22,461 23,024 23,541 23,652 24,755 26,939 27,882
Subsidies and grants for operating
2,780 2,869 3,740 3,322 3,576 3,186 3,264
purposes
Fees and charges 4,798 5,509 6,864 5,353 5,525 5,564 5,724
Interest and dividends from
567 804 930 567 617 667 717
investments
Local authorities fuel tax, fines,
19,528 20,118 21,727 23,748 20,296 25,210 21,534
infringement fees, and other receipts
Total operating funding 115,392 119,930 128,570 131,844 134,862 144,848 147,249
APPLICATIONS OF OPERATING FUNDING
Payments to staff and suppliers 82,497 89,790 101,591 96,907 98,509 97,230 100,573
Finance costs 6,271 5,891 6,019 7,616 11,637 13,271 14,335
Other operating funding applications - - - - - - -
Total applications of
88,768 95,681 107,610 104,523 110,146 110,501 114,908
operating funding
Surplus/(deficit) of operating funding 26,624 24,249 20,961 27,322 24,716 34,347 32,341
SOURCES OF CAPITAL FUNDING
Subsidies and grants for capital
5,200 13,551 11,007 7,822 8,407 13,540 7,465
expenditure
Development and financial
1,260 2,151 1,776 1,476 1,891 2,090 2,465
contributions
Increase/(decrease) in debt (4,275) 2,875 21,325 44,792 39,686 18,590 19,633
* Estimate based on year to date 30 June 2019 forecast - 1 Audited - 2 Unaudited
Gross proceeds from sale of assets 901 456 153 402
Lump sum contributions - - - - - - -
Other dedicated capital funding - - - - - - -
Total sources of capital funding 3,086 19,033 34,261 54,492 49,984 34,220 29,563
APPLICATIONS OF CAPITAL FUNDING
Capital expenditure:-
- to meet additional demand 322 3,984 3,220 5,369 9,935 5,294 7,049
- to improve the level of service 12,892 21,899 31,794 46,565 40,310 37,125 29,500
- to replace existing assets 19,897 22,906 23,309 29,880 24,456 26,148 25,355
Increase/(decrease) in reserves - - - - - - -
Increase/(decrease) of investments (3,401) (5,507) (3,101) - - - -
Total applications of capital funding 29,710 43,282 55,222 81,813 74,700 68,567 61,904
Surplus/(deficit) of capital funding (26,624) (24,249) (20,961) (27,322) (24,716) (34,347) (32,341)
Funding balance - - - - - - -
The Funding Impact Statement shows the amounts we receive and pay out each year.
It shows what’s received, how it’s used to provide services, what is spent on assets to provide future services and how
these assets are funded. We plan to have a yearly cash operating surplus and to use this to fund the renewal of assets
(to maintain capability) and to repay debt in a structured way.VOTE
for who you
YOU
want to represent
Key dates: 2019 elections
15 July Candidate information presentation
17 July Elections advertised, and nominations called
19 July Nominations open
16 August Nominations close at 12 noon
20 September Voter packs mailed to electors. Voting opens
12 October Voting closes 12 noon. Progress results about 5pm
13 October Preliminary result about 5pm
17 October Official result released
For more information about the elections, contact our electoral officer
Warwick Lampp. Phone 0800 300 126 or pnccc@electionz.com
31Te Kaunihera o Papaioea | Palmerston North City Council
pncc.govt.nz | info@pncc.govt.nz | 06 356 8199
Private Bag 11034, The Square, Palmerston North, 4442You can also read