Capacity increase in Spain leading into further growth - encavis
←
→
Page content transcription
If your browser does not render page correctly, please read the page content below
Capacity increase in Spain
leading into further growth
Conference Call Q2/6M 2021 Interim Report, August 13th, 2021, Encavis AG
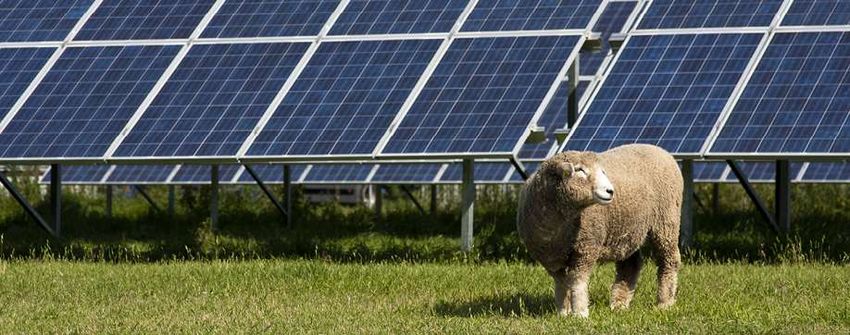
Solar park „Talayuela“
*) Photo: Solarcentury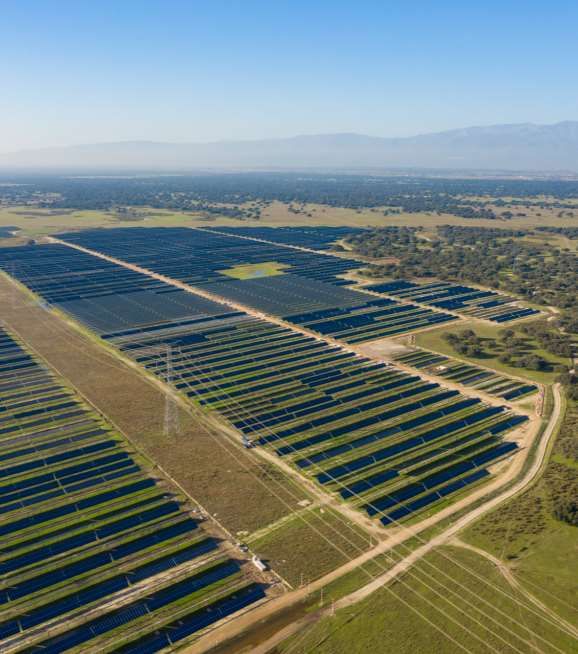
Improving efficiency and cost reduction
through Economies of Scale and Scope

ENERGY                                                     Encavis Asset
                                                           Management
Energy forms the basis of our
collective activity and work                                     Encavis
                                                     Technical Services /
CAPITAL                                                     Stern Energy
We invest capital to acquire wind farms and
solar parks to generate attractive returns                    Encavis AG

VISION
We are working towards a future with decentralised
power generation from wind power and solar energy

                                                                            2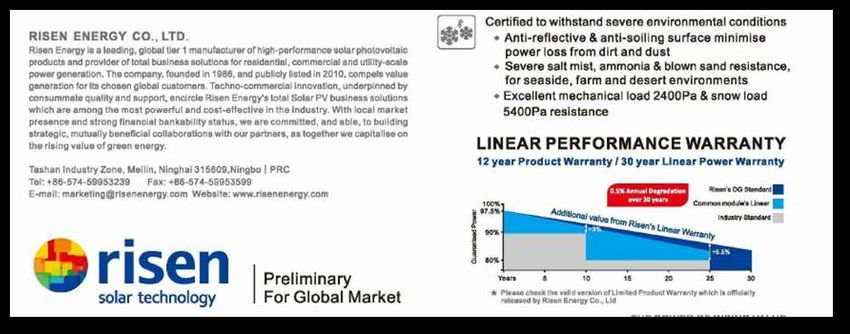
Agenda

1. Encavis at a glance with results above previous year          04
2. Strategic Development Partnerships                            16
3. Strategic outlook: >> Fast Forward 2025                       20
4. The future of energy is now: Sustainability at Encavis 2020   28
5. USP of Encavis business model                                 35
6. Bright future for Renewable Energies                          51
7. New era: PPA – The growing market                             59
8. Supportive meteorological effects                             70
9. NO impact of CoVid-19 on the business model                   74

Appendix:
I.   Storage technologies                                        78
II. The Management                                               83
III. The Encavis Share                                           86   Solar park „La Cabrera“

*) Photo: Solarcentury
                                                                                     3
Encavis at a glance
Revenue above previous half-year due to positive growth effect
of major Spanish PV parks “La Cabrera” & “Talayuela”
despite significant weather deficiencies in Q1/2021

                                                                 4
01   Encavis at a glance

Highlights in 2021: The Encavis Share (I)

▪ ENCAVIS started into 2021 with its new Stock Exchange Initial / Ticker Symbol "ECV"
▪ Increase of S&P Clean Energy Index from 30 to 90 shares resulted in a replacement of around                                 Wind farms &
                                                                                                              Share
  ~300 mill. USD resp. ~250 mill. EUR in Encavis shares since February 2021                                                   Solar parks
▪ Hauck & Aufhäuser Investment Banking updated their initiated active coverage of Encavis AG
  on March 1st, 2021 from “HOLD” to “BUY” recommendation with a target price of EUR 23.00
▪ Encavis AG being promoted via Fast Entry from SDAX to MDAX on March 22nd, 2021                          Encavis Asset
▪ Institutional investors like Morgan Stanley, Goldman Sachs and UBS build-up shareholdings               Management            Finance
  in the total amount of ~13% besides BlackRock, Invesco and DWS of ~12.5% in total
▪ Barclays initiated active coverage of Encavis AG as part of a sector study regarding European utilities on May 12th, 2021
  with an “OVERWEIGHT” recommendation and a target price of EUR 18.00
▪ Warburg Research updated their coverage on May 17th, 2021 from “HOLD” to “BUY” recommendation with a target price of EUR 18.80
  and renewed their “BUY” recommendation on July 8th, and on July 27th, 2021 with a target price of EUR 18.90
▪ RBI Raiffeisen Bank International initiated full research coverage of Encavis on June 17th, 2021 with a “BUY” recommendation and
  a target price of EUR 20.00
▪ Pareto Securities initiated active research coverage of Encavis on July 2nd, 2021 with a “BUY” recommendation and a target price of EUR 19.00

                                                                                                                                             5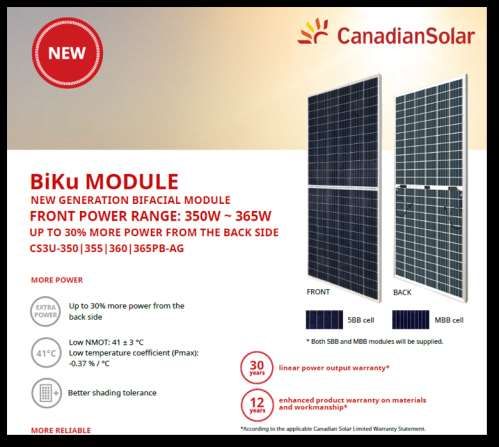
01   Encavis at a glance

Highlights in 2021: The Encavis Share (II)

▪ Large part of Encavis’ shareholders (42.9%) preferred new Encavis shares to cash dividend.
  A total of 814,031 new shares was therefore issued and a cash dividend of around                                  Wind farms &
  26.9 million euros had been distributed to shareholders.
                                                                                                      Share
                                                                                                                    Solar parks
▪ Conversion of EUR 800,000 nominal of the Hybrid Convertible Bond of EUR 150.3 Million nominal
  resulted in an issue of 112,936 new shares: Actual number of shares outstanding: 139,364,201
  (Outstanding amount of EUR 149.5 million nominal of the Hybrid Convertible (ISIN: DE000A19NPE8)
   as of August 5th, 2021)                                                                          Encavis Asset
                                                                                                    Management        Finance

                                                                                                                                   6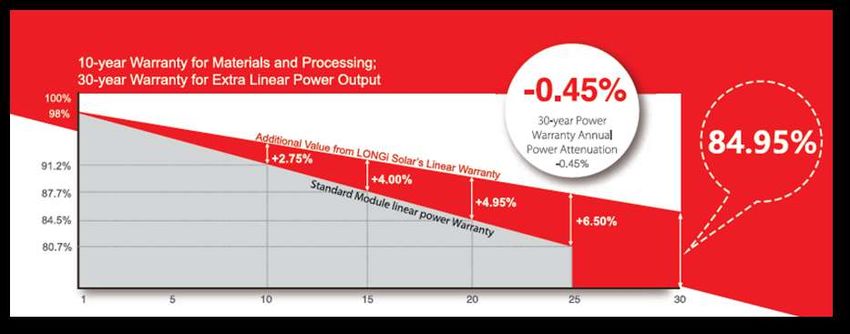
01   Encavis at a glance

Highlights in 2021: Acquisitions in own portfolio and asset management

▪ Spanish solar park Talayuela (300 MWp capacity) connected to the grid on schedule and injected
  first kilowatt hours (kwh) into the grid on Jan 4th, 2021 – Ramp-Up phase until mid of March 2021                             Wind farms &
                                                                                                               Share
▪ Encavis AG grew its wind segment in Northern Europe in acquiring the wind farm Paltusmäki (FIN),                              Solar parks
  already connected to the grid, with a generation capacity of 21.5 megawatts (MW)
▪ Encavis supports Sopowerful in a long-term cooperation in non-profit solar projects to significantly
  improve living conditions for people in the rural communities of Malawi and at the same time also
  provides new jobs and long-term perspectives.                                                             Encavis Asset
                                                                                                            Management             Finance

▪ Encavis Infrastructure Fund III (EIF III) of EAM received another 150 mill. euros in equity and acquired the largest solar plant, “Vlagtwedde”
  (110 MWp), currently in operation in The Netherlands and lifts the total output of the portfolio managed by EAM to 1.0 gigawatts (GW)
▪ EAM acquired wind farm Warnsdorf in the district of Prignitz/Brandenburg. The 12 turbines with a total capacity of 43.2 MW are part of
  the Encavis Infrastructure Fund II (EIF II) and were connected to the grid in spring 2021 and lifts the total output of the portfolio managed
  by EAM to above 1.0 gigawatts (GW)
▪ Encavis Infrastructure Fund II (EIF II) of EAM and energy and environmental services provider badenova acquire and operate five photovoltaic
  plants in Brandenburg and Mecklenburg-Western Pomerania. The solar plants, with a total generation capacity of 45.5 megawatts (MW)
  have been connected to the power grid until mid of June 2021
                                                                                                                                                  7
01   Encavis at a glance

Highlights in 2021: Finance and Ratings

▪ ISS ESG improved its rating from “B-” to “B” and ranked ECV among the top 20% in the industry
  cluster “Renewable Energy Operations”                                                                              Wind farms &
                                                                                                       Share
▪ MSCI ESG also improved its rating from “A” to “AA” and MSCI particularly refers to the very good                   Solar parks
  corporate governance, the transparent ownership structure and the 100% focus on capacity growth
  through the production of electricity from wind and solar power
▪ Encavis published its very first Sustainability Report 2020 on March 24th, 2021
                                                                                                     Encavis Asset
▪ Encavis‘ data protection and information security management system certified for the group-wide                     Finance
                                                                                                     Management
  data protection management system in accordance with VdS 10010 and for the group-wide
  information security management system in accordance with VdS 10000 to strengthen defense
  systems and independent back-up solutions at all IT levels

                                                                                                                                    8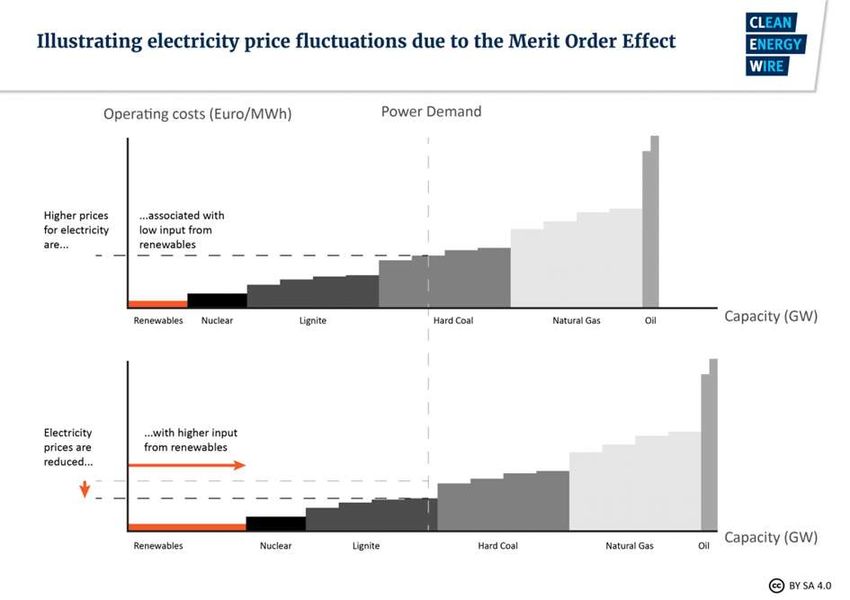
01     Encavis at a glance

Significant earnings growth of 20% stand alone in Q2/2021
fully reflecting the growth from latest acquisitions of PV parks in Spain

        Operating figures                                                        Change Q2           Change Q2
                                  Q2/2019         Q2/2020         Q2/2021
         (in EUR million)                                                        2021/2020         2021/2020 (%)

    Energy production (GWh)          503             563             875                 + 312              + 55 %

    (w/o new acquisitions)           503             515             483                   -- 32              -- 6 %

    Revenue                          84.5            89.6           103.3               + 13.7              + 15 %

    Operating EBITDA                 76.1            69.0           83.0                + 14.0              + 20 %

    Operating EBIT                   54.8            46.4           55.7                  + 9.3             + 20 %

    Operating EPS (in EUR)           0.25            0.19           0.23                + 0.04              + 21 %

    Operating Cash Flow              60.5            64.4           69.5                  + 5.1              +8%

▪     PV parks La Cabrera and Talayuela, connected to the grid in September 2020 and January 2021,
      fully reflecting their growth in revenue and earnings figures despite lower solar irradiation compared to
      the long-term average in Q2

                                                                                                                       9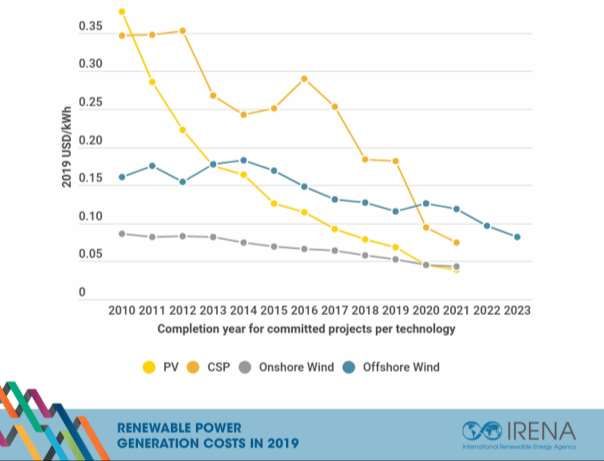
01     Encavis at a glance

Growth in energy production of major Spanish PV parks mostly compensated
weather deficiencies in Q1 & Q2/2021 in revenue and EBITDA – but could not
compensate for higher costs and depreciations of these latest acquisitions
        Operating figures                                                      Change 6M            Change 6M
                                 6M/2019        6M/2020        6M/2021
         (in EUR million)                                                      2021/2020          2021/2020 (%)

    Energy production (GWh)         939           1,120          1,411                + 291              + 26 %

    (w/o new acquisitions)          939            987            855                 -- 132             -- 13 %

    Revenue                        143.9          154.8          162.2                 + 7.4              +5%

    Operating EBITDA               120.8          119.6          122.3                 + 2.7              +2%

    Operating EBIT                  78.2           74.5           68.7                 -- 5.8             -- 8 %

    Operating EPS (in EUR)          0.30           0.27           0.18               -- 0.09             -- 33 %

    Operating Cash Flow             76.4          115.2          109.4                 -- 5.8             -- 5 %

▪     Very positive meteorological effects in Q2/2019 and even more in Q2/2020 compared to less favourable
      meteorological conditions also in Q2/2021 after significant weather deficiencies in Q1/2021
▪     Positive cash effect of reimbursement of capital gain taxes (EUR +9.0 million) in Q1/2020

                                                                                                                   10
01 Encavis at a glance
ENCAVIS Analysts’ Consensus on the five corporate KPIs
for Q2/HY 2021e and FY 2021e as of August 09, 2021
Analysts‘ Analysts‘ Analysts‘ Analysts‘ Consensus
Consensus Consensus Consensus
as of Aug 09,
2021 Reported Average Guidance
Reported Average Average Extrema Extrema
Q2 6M/HY 6M/HY 6M/HY FY
Q2 2021 Q2 2021e FY 2021e Top Bottom
Operating KPIs 2020 2020 2021e 2021e 2021e
(in EUR `000)
Revenue 89,564 103,250 97,155 154,775 162,182 156,079 > 320,000 324,732 330,700 321,636
Oper. EBITDA 69,006 82,994 77,341 119,615 122,309 116,648 > 240,000 244,620 250,484 238,600
Oper. EBIT 46,473 55,780 50,698 74,535 68,742 63,771 > 138,000 141,589 145,900 137,610
Oper. Cash Flow 64,342 69,459 68,355 115,183 109,388 111,024 > 210,000 226,924 242,301 215,213
Oper. EPS (EUR) 0.19 0.23 0.20 0.27 0.18 0.18 0.46 0.46 0.52 0.44
Average Analysts’ Consensus for FY 2021e in line with ENCAVIS’ Guidance.
1101 Encavis at a glance
Slightly lower EBIT margins due to lower wind and solar irradiation in first half 2021
whereas cost situation is as planned and under control
Solar parks Wind farms Technical Services Asset Management HQ/Consolidation
Operating P&L
(in EUR million)
6M/2020 6M/2021 6M/2020 6M/2021 6M/2020 6M/2021 6M/2020 6M/2021 6M/2020 6M/2021
Revenue 105.9 118.5 43.6 35.9 2.5 2.2 5.0 6.8 - 0.9
Oper. EBITDA 87.1 96.1 33.0 27.9 2.7 0.6 1.8 1.9 -- 5.0 -- 4.2
EBITDA margin 82% 81% 76% 78% 111% 28% 36% 28% - -
Oper. EBIT 55.7 57.3 20.0 13.8 2.7 0.6 1.5 1.7 -- 5.4 -- 4.7
EBIT margin 53% 48% 46% 39% 111% 28% 30% 24% - -
Operating expenses distributed among Business Segments
1201 Encavis at a glance
Continuously growing operating business
backed by solid equity ratios
Balance sheet total Equity Equity ratio
2021 / 3,055.0
Q2 791.5 25.9%
2,823.8
2020
751,6 26.6%
2,747.0
2019
722.7 26.3%
2,537.1
2018
687.1 27.1%
2,519.7
2017
698.6 27.7%
1301 Encavis at a glance
Moderate growth combined with high margins are expected for FY 2021e
Change
Operating figures Guidance Guidance
FY 2019 FY 2020
(in EUR million) FY 2021e FY 2021e NO weather adjustments (wa)
/ FY 2020
in future reporting and guidance
Revenue 273.8 292.3 > 320 + 9.5 %
due to an increasing portion of
Operating EBITDA 217.6 224.8 > 240 + 6.8 %
market related revenue streams
Operating EBIT 132.2 132.2 > 138 + 4.4 % besides long-term fixed FiT and
PPA energy supply contracts.
Operating Cash Flow 189.3 212.9 > 210 +/– 0 %
Operating EPS in EUR 0.43 0.43 0.46 + 7.0 %
Large Spanish projects „Talayuela“ and „La Cabrera“ distribute significant FY revenue
and operating cash flow to the Group in 2021
1401 Encavis at a glance
Guidance FY 2021e by Business Segments
Solar Parks Technical Services Wind Parks Asset Management HQ/Consolidation
Operating P & L
(in EUR million)
Guidance Guidance Guidance Guidance Guidance
FY 2020 FY 2020 FY 2020 FY 2020 FY 2020
2021e 2021e 2021e 2021e 2021e
Revenue 198.5 > 220 4.6 >4 77.5 > 80 16.5 > 17 - -
Operating EBITDA 161.0 > 176 4.2 >1 62.3 > 65.5 6.7 >7 – 9.4 < – 9.5
Operating EBIT 95.9 > 100 4.2 >1 36.0 > 41 6.1 > 6.5 – 10.1 < – 10.5
Guidance based on the already secured wind farm and solar park portfolio
15Strategic Development Partnerships
02 Strategic Development Partnerships
Strategic Development Partnerships secure future growth
with a pipeline volume of > 3.0 GW over the following years
Target markets of the
developing partnerships
Projects
▪ Strategic partnerships with several project developers: realised
Greengo, Greifensolar, LTService,
Psaier.Energies, Sunovis, …
▪ Pipeline of > 3.0 GW in total with projects in Europe Partnership
▪ Projects realised in Spain and The Netherlands Participate
▪ More than 580 MW of pipeline volume realised
& accelerate
in less than one year
▪ Standardisation of processes reduces
transaction costs
PV park in
.....
Encavis Developer
Finance Develop
& operate & build
1702 Strategic Development Partnerships
Strategic Development Partnerships – Status Quo and Outlook
Mid Stage
> 3.0 GW of ▪ Encavis has Strategic Development
Partners across Europe, further
New Projects ones are being onboarded
6-18 months
from
Development ▪ The Development Partners
Partners develop the projects for Encavis
at a pre-agreed return
Late Stage
are being ▪ Projects failing to reach RTB within
onboarded at a defined time frame are replaced
different stages by the Development Partners
following 6-24 months
Due Diligence
PPA origination, financing, and construction
RTB1
timing according to Encavis’ requirements
1) Ready to build
1802 Strategic Development Partnerships
Currently 12 Strategic Development Partnerships / SDPs
focus on 10 Western European Countries currently
Ready to Build (RTB) RTB
(first projects are about to start in Q4/2021)
Late Stage Late Stage 30–50%
(~ 0.5 GW+ / 60–90% probability / of the iceberg
to be realised in 2022/23) are expected
to melt (these
Mid Stage Mid Stage projects may fail)
(~ 0.9 GW+ / 40–60% probability /
to be realised in 2023 to 25)
The three
Mid & Late Stage across are already
top regions
~ 20 projects onboarded
DK/GER/IT
representing
Early Stage Early Stage 2/3 of all projects
(~ 2.0 GW+ / 20–40% probability / volume-
to be realised wise
in 2024/25)
19Strategic outlook >>Fast Forward 2025
03   Strategic outlook >>Fast Forward 2025

Earnings increase with almost constant margins
                                                                                                    Revenue                              CAGR
                                                                                                    + 26.3 %
                                                                   Oper. EBITDA
                                                                    + 26.3 %

                                    Oper. EBIT                                                                                         292.3
                                                                                                                      273.8
                                    + 25.1 %
                                                                                                     248.8
                                                                                  222.4

                                                           141.8                                                      217.6   /79.5%   224.8   /76.7%
                                        112.8                                                        186.9   /75.1%
                                                                                  166.8   /75.0%

                72.1                                       106.1    /74.8%
                                         86.8    /76.9%
                55.4     /76.8%                                                                      113.7   /45.7%   132.2   /48.3%   132.2   /45.2%
                                                                                  100.4   /45.1%
                                         55.4    /49.1%     61.6    /43.3%
                34.6     /48.0%
                2014                     2015               2016                  2017                2018            2019             2020
                                                          Operating EBIT     Operating EBITDA      Revenue

                                                                                                                                                  21
03 Strategic outlook >>Fast Forward 2025
Encavis Growth Programme: >>Fast Forward 2025
Growth Initiative Economies of Scale and Scope
▪ Investment in RTB and securing early-stage
projects primarily focused on PPA markets
▪ Ongoing opportunistic acquisitions in FiT markets Optimisation of Optimisation of
O&M cost SPV-financing
▪ European focus for the time being
▪ Disposal of minority participations in projects
(mainly wind farms) to diversify local wind risk
and to recycle cash
Cash pooling
2203 Strategic outlook >>Fast Forward 2025
Encavis Growth Strategy: >>Fast Forward 2025
Increasing operating EPS
from EUR 0.40 to 0.70 and
CAGR of 10%
Increasing operating
EBITDA from EUR 210
to 330 million and
CAGR of 8%
Doubling of signed Solid equity ratio
own capacity of of 24% or more
Operating
1.7 GW (2019) to
EBITDA margin
3.4 GW and CAGR
of 75%
of 12%
Increasing revenue
from EUR 260 to
EUR 440 million
and CAGR of 9%
2303 Strategic outlook >>Fast Forward 2025
Selected measures to fulfill: >> Fast Forward 2025
Pipeline Capacity Growth
▪ Currently strategic partnerships signed ▪ 1.7 GW (end of 2019) of signed own capacity
> developers
with several03 Strategic outlook >>Fast Forward 2025
Sustainable business model – Outlook 2025 of Encavis Asset Management
+ 1.5 to
+ 200 to 300 2.5 bn EUR
+ 15 to 20 new Megawatt p.a. Investment
Power Plants p.a.
+ 150 to 200 million
EUR Equity p.a.
+ 3 to 5 new
Infrastructure
Funds
2503 Strategic outlook >>Fast Forward 2025
Growth strategy based on 2019 fundamentals only
Profitable growth outside Europe
Profitable business models in storage technology
Potential reserves in equity capital market transactions
and dividend policy post 2021
Further opportunities in
Mergers & Acquisitions
Base case scenario:
>> Fast Forward 2025
2603 Strategic outlook >>Fast Forward 2025
Together we strive to improve each and every day
27The future of energy is now Sustainability at Encavis 2020
04   Sustainability at Encavis 2020

"May the sun be with you"

                                      29
04 Sustainability at Encavis 2020
Our values and corporate culture are actively shaped by our employees
3004 Sustainability at Encavis 2020
Good sustainability work is measured by its goals:
Encavis has identified a total of 12 SDGs on which it wants to focus
https://www.encavis.com/de/nachhaltigkeit/ (DE); https://www.encavis.com/en/sustainability/ (EN)
3104 Sustainability at Encavis 2020
Good sustainability work is measured by its goals:
Encavis aims for concrete change in every field of action (selection)
Strategy & Governance Economy
Strategy & Governance Economy
Material topic: Sustainably integrated corporate strategy Material Topic: Electricity marketing (PPA business)
Goal: Encavis will improve its MSCI ESG rating from "AA" to "AAA" Goal: Significant increase in non-subsidised electricity production
by 2025 by the end of 2025
Social Environment
Social Environment
Material topic: Social acceptance and positive contribution of the Material topic: Help in the fight against climate change through
Encavis Group carbon reduction
Goal: Conclusion of a long-term partnership with a non-profit Goal: Increase share of green electricity purchases to 100%
organisation in 2021 by the end of 2022
3204 Sustainability at Encavis 2020
Our four key sustainability topics
Strategy & Governance Economy
▪ Further development of the energy ▪ Acquisition of new wind & solar parks
system, especially energy storage
▪ Operational excellence
▪ Sustainably integrated corporate Strategy & ▪ Win new asset management clients
strategy Economy
Governance ▪ Electricity marketing (PPA business)
Social Environment
▪ Employee satisfaction Social Environment ▪ Help in the fight against climate
▪ Employee expertise change through carbon reduction
▪ Social acceptance and positive ▪ Sustainable increase in the efficien-
contribution of the Encavis Group cy of existing wind & solar parks
3334
Unique Selling
Proposition
USP of Encavis business model
05    USP of Encavis business model

The four pillars of our business

     Segments                 Business activities

                         Acquisition and operation of ground mounted PV parks

                         Acquisition and operation of onshore wind parks

                         Customised portfolios or fund solutions with an all-round service for institutional investors
                         in Renewable Energies (Encavis Asset Management)

                         Technical operation and maintenance of PV parks by our technical service unit
                         (Encavis Technical Services / Stern Energy)

                                                                                                                         36
05 USP of Encavis business model
Conservative acquisition strategy
for markets with FiT (Feed-in-Tariffs) will be pursued as in the past
Post tax equity IRR for FiT
>7%
PV projects/higher for wind
Market presence for FiT
▪ We acquire ready-to-build, turnkey-projects or existing parks Market entry planned for FiT
with Feed-in-Tariffs and operate them over their technical
and commercial life time
>7%
▪ > 10 years of experience in these markets still allow for >7%
numerous acquisition opportunities in established markets
with satisfying IRRs >6%
▪ Falling interest rates create an increasing competition for
>5%
FiT projects
▪ However, Encavis reiterates its commitment to stated IRR
expectations
>6%
3705 USP of Encavis business model
Conservative acquisition strategy
for markets with PPA projects with increasing importance
Post tax equity IRR for PPA
>7%
PV projects/higher for wind
Market presence for PPA
▪ We acquire ready-to-build, turnkey-projects or existing parks Market entry planned for PPA
and negotiate Power Purchase Agreements with companies
with very good ratings and operate them over their technical
and commercial life time
▪ Our experience from PPA negotiations in Spain (500 MW PV)
and the UK (40 MW PV) enables Encavis to move to emerging >7%
PPA markets like Italy and – in time to come – Germany and
France
▪ IRR minimum requirement depends more on risk distribution
and rating of the off-taker, and to a lesser extent on regulatory
risk
>8%
3805 USP of Encavis business model
Business model: risk structure of an investment over time (wind/solar)
Risk Project life cycle
high
Project Developer Investor & Operator
Completion
risk
Technical
risk
Production
risk Dismantling
RTB1
risk
low
Planning Construction Operation Dismantling
Selected risks COD Connection to the grid
1) Ready to build
3905 USP of Encavis business model
Recent acquisition of minorities lead to
ownership in solar parks of > 95 per cent on average
190 solar parks and 95 wind parks in 10 European countries: total capacity > 2.8 GW
Wind parks Own Assets (net/gross) Asset Management
Germany 181 / 229 MW 0 / 447 MW
France 36 / 36 MW 0 / 126 MW
Austria 19 / 36 MW 0 / 17 MW
Finland 21 / 21 MW 0 / 49 MW
United Kingdom - 0 / 18 MW
Sweden - 0 / 10 MW
Italy 5 / 6 MW -
Denmark 118 / 120 MW -
Total 380 / 448 MW 0 / 667 MW
Solar parks Own Assets (net/gross) Asset Management
Germany 258 / 262 MW 0 / 103 MW
Italy 154 / 154 MW 0 / 7 MW
France 194 / 194 MW 0 / 70 MW
United Kingdom 127 / 127 MW -
The Netherlands 104 / 106 MW 0 / 197 MW
Spain 440 / 500 MW -
Total 1,278 / 1,343 MW 0 / 377 MW Market presence
Market entry initiated
Group total Own Assets 1,658/1,791 MW Group total 2,835 MW
4005 USP of Encavis business model
Encavis Portfolio: PV accounts for > 75% of the Encavis Portfolio
Encavis Portfolio by technology Asset Management Portfolio by technology
Capacity Wind 25% PV 36% Installed base
~ 1.8 GW > 1.0 GW
Average PV*) park Average PV park
5.1 MW 15.7 MW
*) excl. Spain
Average wind farm Average wind farm
10.4 MW 12.8 MW
PV 75% Wind 64%
Most of the Renewable Energy Portfolio of Encavis is based on a FIT: ~ 13 years remaining FIT maturity
4105 USP of Encavis business model
Segment Technical Services / Stern Energy –
Operational and Technical Management of our parks
Parks managed by ETS / Stern Energy
1000
In MW
Broad technology experience: 899
Specialised in technical 900
operation of PV parks Crystalline/thin-film modules
800
since 2008 Central and string inverters
Different monitoring systems 700
600
Company
profile 500
400
Services are
283
provided locally 300 247
Company is accepted
by project-experienced by financing banks 200
engineers, technicians 136
and mechanics 100 47 69
0
2010 2011 2017 2018 2019 2020
4205 USP of Encavis business model
Encavis focused on growth to skim Economies of Scale
Portfolio is actively managed by international and experienced team (examples)
Measures implemented Status
Negotiations with local authorities by Encavis workforce comprising native speakers from all countries Encavis is active Ongoing
Q4 2018–
Releasing reserve accounts due to high performance of parks and trust in Encavis and replacement by bank facilities
Q2 2020
Reducing financing costs via inhouse structured refinancing of existing loans placed in the financing market Q3 2019–
after competitive tender process Ongoing
Q1 2021–
Generating additional cash due to re-leverage of projects via such refinancing transactions
Ongoing
Optimisation of insurance by auctioning all insurance contracts of Encavis parks in a European-wide process. 2018 and
Leading to an improved coverage and terms, reduction of premiums and risk diversification within the portfolio. 2020 again
Optimisation of low level operation contracts by clustering parks and auctioning service with local suppliers 2018
Digitalisation of the business – improving technical availability by remote control of the parks,
Ongoing
implementing a digital backbone for data flow from the parks via accounting into IFRS statement
4305 USP of Encavis business model
Encavis is focused on growth to skim Economies of Scope
Constant Constant
monitoring Onsite visits improvement Maintenance
of parks of parks
▪ Integration of all parks into our ▪ Failure analysis and repair ▪ Regular screening of solar ▪ Solar park maintenance by
centralised 24h control room works directly on site parks with GPS-navigated own experienced employees
are conducted by experienced drones with thermo cameras or supervision of trained
▪ Calculation of yield reports and
and trained teams to detect hotspots subcontractors
simulations based on actual
irradiation levels ▪ Our service vehicles ▪ Re-energisation of PV parks ▪ Wind park maintenance
hold comprehensive stock to stop degradation of modules usually done by turbine
▪ Handling of failure reports
of spare parts manufacturers / regular
365 days a year ▪ Investment into winglets
▪ For major repairs teams of the maintenance service
to improve rotation of
▪ Management of fast response supervised by onsite
component manufacturers wind blades in our wind farms
fault clearance actions accompaniment
are requested to improve energy production
(for instance defective power of our own experienced
sections) employees
4405 USP of Encavis business model
The „golden end“ of Encavis‘ power plants
Illustration of the different cash flows of a solar park (PV)
As the loan is paid-off during the price-fixing-period, parks are very profitable in the “golden end”
“golden end“ Assumptions
In EUR
000’ Closing of Solar-park connected
Financial Obligation debt to the grid in 2010 with
(loan) reserve FIT for 20 years (t20)
accounts
Park was bought in Q2
2011, 2012 first full-
year of operation (t2)
Interest
End of FIT
EBT Non-recourse
project financing
will be serviced and
CF to Equity paid-off by the park
t2 t3 t4 t5 t6 t7 t8 t9 t10 t11 t12 t13 t14 t15 t16 t17 t18 t19 t20 Time (t)
4505 USP of Encavis business model
„golden end“-PV parks are still with high efficiencies and lowest marginal costs
“NREL now finds, 25 years later, that the long-term degradation of the studied modules was 0.5% a year, with an efficiency,
today, of around 88% of the original panel performance.*)”
Module
Performance of PV-modules after 25 years Example: Cash flow for one solar park
performance Costs do not exist in golden end
in % 100 or are under Encavis’ discretion
Performance of solar modules
17,779
95
Do not incur
in golden end
90
16,096
58,082
85
40,303 5,579
1,826
Observed Expected future performance
80
performance of our PV parks according to 16,802
at our parks observations
75
0 10 20 years in service Revenues OPEX Operating Loan Interest Tax Cash Flow
(EUR) Cash Flow repayment
*) First Solar’s PV module tech completes 25 years of testing at NREL – National Renewable Energy Laboratory (U.S.A.)
46
from pv magazine USA / December 14, 2020 / Eric Wesoff05 USP of Encavis business model
Lifetime assumptions of PV parks differ nowadays substantially
from IFRS accounting standards
Historical accounting rules Todays business reality
As the technology has proven to be mature, investors are increasingly extending their
According to all GAAP/IFRS valuation period (up to 50 years) and land lease agreements are currently being renegotiated
or extended to allow a longer operation of the plants.
it is mandatory to indicate
a useful life for an asset 30 years can be taken for granted:
that is capitalised. Due to Performance warranties of 30 years for new modules is currently a “de facto” industry standard
the lack of historical data as confirmed by the extracts from official data sheets on the following pages
(utility-scale plants have
been built from 2005 30 years ++ can be assumed due to following reasons: *)
onwards) Consistently dropping technology costs will allow operators to either . . .
+ Ongoing optimisations of the portfolio at very low replacement costs or
accountants and investors + Increase the power of the plants once the subsidy schemes are faded out
have focused on the
duration of the subsidy There is also an increasing portion of already acquired land as well as strategic ambitions
schemes (usually 20 years) to acquire the land on which solar plants are operating or are being developed.
and/or
Encavis’ land leases/acquisitions allow long useful life / Extension . . .
of the land leases
(usually 25 to 30 years) . . . to 30 years in 45% of Portfolio (PF) in NL
to estimate the useful life. . . . to 30 years or longer in > 60% of PF in FRA / in 50% of PF in IT / in 30% of PF in UK
. . . up to 2050 plus unlimited number of extensions of 5-year-periods in ES / an evergreen contract
*) https://www.pv-magazine.com/2018/12/17/revamping-and-repowering-the-size-of-the-opportunity/
4705 USP of Encavis business model
PV module warranties of 30 years are current standard (I)
Longi
4805 USP of Encavis business model
PV module warranties of 30 years are current standard (II)
RISEN ENERGY
Jinko Solar
4905 USP of Encavis business model
State-of-the-art infrastructure and technology result in stability, reliability
and very low risk business model: Sustainable valuation of all assets
Minimal developing risks result in investment grade rating BBB–/stable outlook
Long-term (10Y) dividend policy reflects increasing cash flows from operations
Revenue and earnings increase (6Y/CAGR >25%) with constant margins
NO impact of CoVid-19 on the operating business
Secured liquidity for the whole cash planning-period
NO interest rate risk (100% fit of financing to FiT/PPA)
Almost NO FX risk (GBP hedged until end of 2023)
Almost NO energy price risk (Bright future for Renewable Energies
06   Bright Future for Renewable Energies

Demand for power from renewables from two strong players:
public & private sector

                                        Public Sector: Goal to limit global warming
                                        ▪   COP 21 Paris: 196 countries united to limit global warming below 2°C
                                        ▪   Europe 20-20-20 targets
                                        ▪   China: largest installed renewables fleets
                                        ▪   Denuclearization in Germany and Japan
                                        ▪   Creation of low-carb economies
                                        Demand via FIT-schemes and competitive auctions

                                        Private sector: Sustainability goals and long-term supply security
                                        ▪   Private companies create global initiatives in order to take action on climate change.
                                        ▪   Multinational companies such as Google, Facebook and Microsoft go ahead with ambitious targets
                                        ▪   100% renewable targets help to create a positive brand awareness
                                        ▪   Furthermore, direct Power Purchase Agreements between companies and power producers
                                            from renewable energy resources offer long-term supply at fixed rates
                                        Demand via PPAs and purchase of green certificates
                                                                                                                                             52
06 Bright Future for Renewable Energies
Development of Renewable Energy proportion in power generation (2006 – 2019)
Canada UK Germany
21.5% 39.1% 37.2%
1.4% 4.7% 9.8% China
12.6%
0.4%
Japan
13.2%
Spain
USA 2.5%
33.2% Italy
13.8%
11.2% 23.6%
2.9%
6.2%
India
Highest 10.5%
2.3%
Mid / High Australia
Mid 19.0%
Mid / Low 2.3%
Brazil
Lowest
50.2% South Africa
Note: Excludes large hydro; 26.3% 5.2%
Source: Bloomberg New Energy Finance 0.0%
5306 Bright Future for Renewable Energies
Worldwide growth in generating capacity of renewables by technology
Capacity growth
in GW 81% 77% Percentage of
PV/Wind of total
1600
54
67%
1400
261
1200
41 Others
1000
39% 137 Hydropower
800 763
38
600
Solar PV
180 527
32
400 Wind
245 201
200 37 434
231 282
141
0
2006-2010 2011-2015 2016-2020 2021-2025
Source: Bloomberg New Energy Finance
5406 Bright Future for Renewable Energies
Entering the Century of Renewable Power Generation
Gross capacity additions by technology group Global utility PV and onshore wind capacity
Share in annual capacity additions In GW
100% 5.500
5.090
90% 5.000
80% 4.500
4.000
70% 3.485
3.500
60% CAGR +8%
3.000
50%
2.500
2.119
40%
2.000
1.503
30% 1.500 1.134
20% 1.000
566
10% 500 211
0% 0
2015 2020 2025 2030 2035 2040 2010 2015 2020 2025 2030 2035 2040
Renewables Nuclear Fossil Fuels Large-scale PV Onshore Wind
5506 Bright Future for Renewable Energies
The world is changing: Significant decline in coal-driven electricity production and
increasing share of photovoltaic electricity generation
Coal-driven electricity generation vs. Utility-Scale PV
(in TWh)
(in GWh)
12.000.000
12.000 Coal-driven electricity generation Electricity generation of Utility-Scale PV
10.000.000
10.000
8.000.000
8.000
6.000
6.000.000
4.000
4.000.000
2.000
2.000.000
0
2012 2017 2022E 2027E 2032E 2037E 2042E 2047E
Source: BNEF, 2021
5606 Bright Future for Renewable Energies
National shutdown plans of nuclear and coal driven
generating capacities in Europe until 2040
Free of nuclear Free of nuclear Free of nuclear
driven powerplants: driven powerplants: driven powerplants:
▪ Germany (2022) ▪ Spain (2035) ▪ Sweden (2040)
▪ Belgium (2025)
-- 14.0 GW -- 7.1 GW -- 7.6 GW
2021 until 2025 until 2030 until 2035 until 2040
-- 31.9 GW -- 45.5 GW -- 52.6 GW -- 112.8 GW
Current Situation -- 17.9 GW -- 13.6 GW -- 52.6 GW
Free of coal driven Free of coal driven Free of coal driven Free of coal driven
powerplants: powerplants: powerplants: powerplants:
▪ Austria ▪ France (2022) ▪ Finland (2029) ▪ Germany (2038)
▪ Belgium ▪ UK (2024) ▪ The NL (2029)
▪ Sweden ▪ Czech Rep. (2040)
▪ Italy (2025) ▪ Denmark (2030)
▪ Spain (2030)
5706 Bright Future for Renewable Energies
National shutdown plans for nuclear and coal driven generating capacities
Country Coal driven Power Plants Nuclear Power Plants
Germany Until 2038 47.0 GW Until 2022 8.1 GW
Poland ---- 29.5 GW ---- 0.0 GW
Czech Republic Until 2040*) 8.4 GW ---- 3.9 GW
Austria Today already 0.0 GW Today already 0.0 GW
Italy Until 2025 8.5 GW ---- 0.0 GW
Spain Until 2030 5.1 GW Until 2035 7.1 GW
France Until 2022 3.1 GW ---- 63.1 GW No plan
United Kingdom Until 2024 6.3 GW ---- 8.9 GW currently
Belgium Today already 0.0 GW Until 2025 5.9 GW
The Netherlands Until 2029 4.5 GW ---- 0.5 GW
Denmark Until 2030 2.2 GW ---- 0.0 GW
Sweden Today already 0.0 GW Until 2040 7.6 GW
Finland Until 2029 1.8 GW ---- 2.8 GW
Fixed plan
Total 116.6 GW 107.9 GW
Plans in progress
58New era: PPA
Encavis as a European first mover
5907 New era: PPA
Strong growing PPA markets – Encavis is a European first mover in solar
Pillars of the Encavis
Growth Strategy >> Fast Forward 2025
Encavis has secured Leveraging knowledge and Strong Balance Sheet Access to early stage
preferred access to know- network as experienced with equity ratio > 24% projects without taking
how for PPA by establishing investor based on recently giving corporates direct development risk
a dedicated in-house signed PPAs with adequate comfort by signing numerous
competence team and a leading European Utility to handle risks from partnership agreements
by investing in market and Amazon for in total of long-term PPA contracts with exclusive rights in
leading competence platform 500 MW of Spanish solar Italy, France, Spain,
Pexapark (CH) parks The Netherlands,
Denmark and Germany
6007 New era: PPA
Strong growing PPA markets – Encavis is a European first mover in solar
Annual capacity additions through PPAs in EMEA (MW) Three pillars of the Encavis PPA strategy
PV 1 Encavis has secured preferred access to dedicated
Wind IP for PPA related risks by investing in
market leading competence platform
4819
2 Founding investor in a newly created fund,
targeting to satisfy the demand of leading global
corporates for green energy through customised
771
262 Wind- and PV-projects and attractive PPAs
193 84
2000 2259
140 1834
48 45 1020 1045
3 Leveraging our knowledge and network
9 558
117 236 as experienced investor with various
2012 2013 2014 2015 2016 2017 2018 2019 2020 potential offtakers
Source: BNEF; signing date estimated by Bloomberg
6107 New era: PPA
Steadily growing volume of globally signed corporate PPAs
Global corporate PPA volumes PPA capacity by offtaker type
Annual volume in GW Annual volume in GW
25 23.7 30
20.1 2,9 24.3
25
20 1.2
2.6 19.3 6,4
7,2 20
15 13.6
7,1 3,4
2.3 15 12.7
3,0
10 2.3 3.4 1,8 2,6
10
6.2 16.3 1,8 1,2
13,6 5.6 1.2 1,2
4.7 4.1 4.9 2.1
5
1.3 3.9
1.1 9.1 5 1.0
2.3 1,4 6,9 7,7
1.1 4.3
3.4 3.9 2.7 2.0 2.1
1.8 2.3 0
0
2015 2016 2017 2018 2019 2020
2014 2015 2016 2017 2018 2019 2020
Technology Government & University
AMER EMEA APAC
Manufacturing Consumer Staples
Source: BNEF, 2021 Materials Others 6207 New era: PPA
The need for green energy supply is driving PPA markets
Top global corporate offtakers 2020
Amazon 3490 4556 8046 MW
Google LLC 4089 2294 6383 MW
Facebook 2148 4077 6225 MW Market developments
Total Group 4384 4384 MW ▪ North American market with pioneering role
▪ US companies search partners for PPAs in Europe
AT&T Inc 1680 1173 2853 MW
▪ ENCAVIS registers increasing demand for PPAs
Microsoft Corp 1099 1634 2733 MW
also in Europe (Nordics, Spain, Italy, Ireland,
Verizon 290 1566 1856 MW Germany)
Wal-Mart 1306 279 1585 MW ▪ Major PPA deal in Europe in March 2021:
Wind Adger Energi signed 15-year PPA for 900 MW
Norsk Hydro ASA 1411 1411 MW wind power portfolio across Sweden and Finland
Solar
McDonald's… 547 841 1388 MW ▪ PPAs are contracted for time periods
from 6 – 20 years
Source: BNEF Corporate PPA Deal Tracker, April 2021
6307 New era: PPA
Solar utility scale with comparably low
Levelised Costs Of Energy (LCOE) Production
The cost of energy production
from conventional sources
is set to increase, as prices for
CO2 emissions in the EU rise
with the application of taxes
and certificates
Encavis‘ (2nd phase of the EU CO2 certificate
focus trading scheme and additional
national legislations)
Securing the
cost advantage for
renewable energy
in the long term.
Source: CM-CIC Research on „Renewable Energies“ covering Albioma, Encavis and Voltalia, June 5th, 2020 6407 New era: PPA
LCOE/Levelised Costs Of Energy Production
continue to fall for PV/solar and wind power technologies
Today, plant construction costs (including components and materials)
in utility scale (10 MW and above) in Europe vary between EUR 0.4m/
MWp and EUR 0.475 m/MWp, including 30 years warranty on key
components such as modules. Common expectations are further
decreases in the near, mid and long term.
Current O&M prices are at around 3.5 to 7 EUR/KW p.a. according to
the age and size of the plant. The termination of old contracts and
renegotiation of the terms will lead to a substantial reduction in the
average O&M expenditures.
We expect additional reduction in O&M costs due to consolidation in
the O&M market and increase of professionalisation in the market.
Encavis’ strategic move: Participation in Stern Energy
(O&M company with 1+GW under management) and
standardisation of all O&M activities.
Source: IRENA, International Renewable Energy Agency, Renewable Power Generation Costs in 2019 6507 New era: PPA
Strong decline in LCOE/Levelised Costs Of Energy Production
for PV/solar is mainly driven by PV module prices
Price development for PV modules (USD real 2,000/Wp)
This cost decrease applies to park maintenance,
lease payments and interest rates as well.
Source: BNEF, Warburg Research on SDAX, Renewables, Encavis, 07.09.2020 6607 New era: PPA
Electricity price fluctuations due to the
Merit Order Effect
In the very conservative assumption of an energy only
market, thus a market in which only the produced
power is compensated, without any compensation for
the mere readiness for power production (capacity
market), the power price would be determined by the
“merit order” – the sequence in which power stations
contribute power to the market, with the cheapest offer
made by the power station with the smallest operating
costs setting the starting point – and not by the LCOE.
While it is true that renewables lower the entrance price
due to their low operating costs and push more
expensive conventional producers down the merit order
(see chart to the left), it is also true that the price for
the energy is set by the plant with the highest operating
cost that is still necessary to be activated in order to
meet the demand.
Source: https://www.cleanenergywire.org/factsheets/setting-power-price-merit-order-effect 6707 New era: PPA
Encavis manages uncertainties in power demand,
power supply and corresponding pricing risks
Sophisticated Energy risk management as key value leaver short to mid term:
▪ Traded products in liquid markets (1-5 years ahead)
▪ PPAs for non-liquid markets (5 years ++)
▪ Matching inherent energy risks by portfolio optimisation
European goal for CO2 free power production will either lead to . . .
▪ a CO2 price regime as part of power prices in order to stimulate investments in Renewable Energy
▪ the introduction of capacity markets for Renewable Energy (REE) in order to allow for new build
▪ a self-regulated energy only market where power prices incentivise enough new build capacities in REE
Long-term price curves*) observation as well as introduction of proprietary energy pricing model
▪ Captured prices for wind and solar (accounting for the expected cannibalisation effect)
▪ Introduction of storage as appropriate
*) from various reknowed 3rd party providers
6807 New era: PPA 69
Positive development of PPA power prices are seen
by all leading energy price forecasters
▪ All major forecasters of
energy prices do see positive
development of energy prices
Liquid Market Horizon Illiquid Market Horizon in the future.
▪ Main drivers for energy prices
Long-term PPAs are: CO2 certificate prices,
capacity additions of
Standard products
renewables acompanied with
cut down of capacities of
conventional power plants.
Baseload Power Price
▪ Even the most conservative
forecaster (#3) sees energy
LCOE for Solar PV as of June 2020… market prices which are fairly
above current (and, obviously,
future) LCOEs enabeling
...are expected to decrease further
additional investments into
renewables.
2021 2026 2031 2036
Forecast 1 Forecast 2 Forecast 3
69Supportive meteorological effects
08       Supportive meteorological effects

          Diversification by technology (wind/PV) with complementary
          income streams over the year

          Exemplary Seasonal Power Output of one Wind Park                                                    Exemplary Seasonal Power Output of one Solar Park
In MWh

                                                                                                     In MWh
         1.800                                                                                                1.800

         1.600                                                                                                1.600

         1.400                                                                                                1.400

         1.200                                                                                                1.200

         1.000                                                                                                1.000

          800                                                                                                  800

          600                                                                                                  600

          400                                                                                                  400

          200                                                                                                  200

               0                                                                                                 0
                    Jan      Feb    Mrz     Apr     Mai    Jun   Jul   Aug   Sep   Okt   Nov   Dez                    Jan      Feb     Mrz    Apr      Mai     Jun    Jul      Aug   Sep   Okt   Nov   Dez
                    Year 1         Year 2         Year 3     Year 4    Year 5                                         Year 1         Year 2   Year 3         Year 4   Year 5

                                                                                                                                                                                                 71
08 Supportive meteorological effects
Increase in length of sunshine from 1951 to 2019 by 11.2 hours per month
Deviation in length of sunshine in per cent from the long-term average (128.7 hours/month) from 1961 to 1990
30%
20%
Linear Trend
+ 11.2 hours
10% per month
0%
-10%
Source: Deutscher Wetterdienst (DWD), 2021
72
Exemplarily showing the case of Germany08 Supportive meteorological effects
Average temperature in Germany increases significantly
Positive and negative deviations in air temperature from long-term average (8.2°C) from 1961 to 1990
2°C
Average temperature
in Germany in 2020:
1°C
10.4°C
0°C ▪ Since 1970 every decade
was warmer than the
previous one.
-1°C ▪ 2010 – 2020 was 2.0 °C
warmer than 1881 - 1910
Source: Deutscher Wetterdienst (DWD), 2021
Exemplarily showing the case of Germany 73CoVid-19: NO impact NO impact of CoVid-19 on the business model
09      No impact of CoVid-19 on the business model

NO impact of CoVid-19 on the operating business
of generating energy from Renewable Resources

                                                      Encavis is well prepared for turbulent markets

       Remote controlled                 Secured revenue based        Secured liquidity      Macro hedges in all     Technical maintenance
      operation of ground                   on Feed-in-Tariffs         for the whole         parks limit currency       of PV parks by our
        mounted PV and                        for remaining            cash planning          exposure down to        technical service unit
      onshore wind parks                  13 years (on average)        (covering the         dividend payments.        (ETS / Stern Energy)
                                                    and               next 18 months)       Currency exposure is     was affected to a minor
     NO risk at business as                  Power Purchase            and IT-based       limited to Danish Crown     extend of a few weeks
      usual / The sun is                       Agreements             payment system          (DKK) and British          delayed services
     shining – The wind is                 (PPAs) for 10 years           TIS in use             Pound (GBP).
            blowing                                                                           While DKK is very
                                                                                          stable, the volatile GBP
                                                                                           is hedged already until
                                                                                                 end of 2023

                                                                                            → NO currency risk

Sustainable valuation of all assets and NO doubt on the Growth Strategy >>Fast Forward 2025
                                                                                                                                        75
09 No impact of CoVid-19 on the business model
200 MW PV park „La Cabrera“ connected to the grid
▪ The High Voltage section (substation and transmission line)
is grid connected and energised since August 2020.
▪ The power plant is fully built and achieved to start
partial operations on September 3rd, while all sections
are in operations since October 1st, 2020.
▪ Predominant energy production for AWS amazon web service
in Spain (in line with the agreed PPA).
▪ The agreed extra costs due to CoVid-19 are equal to
TEUR 240.
7609 No impact of CoVid-19 on the business model
300 MW PV park „Talayuela“ connected to the grid
▪ The High Voltage section (substation and transmission line)
is grid connected and energised since December 2020.
▪ The power plant is fully built and started to inject
the first kilowatt hours (kwh) into the Spanish grid on
January 4th, 2021.
▪ The agreed extra costs due to CoVid-19 are equal to
TEUR 250.
77Appendix I. Storage technologies II. The Management III. The Encavis share
I.     Appendix: Storage technologies

  Increasing share of renewables in power sector creates new challenges

Electricity demand and historic supply mix                                               Conceptual supply mix in the future
MW                                                                                  MW

                                                                                                             Battery
                                                                                                            charging                   Solar-PV
                                                    Peak Load                                   Battery
                                                                                              discharging                                              Hydro
                                              Intermediate Load
                                                                                                                                                       Natural Gas

                                                        Baseload                                                                                       Wind

                                                                                                                                       Biomass

     0    2      4      6       8     10      12    14     16   18   20   22   24        0    2     4       6    8     10   12    14      16      18   20   22   24
                                          Hour of Day                                                                   Hour of Day
   ▪     Supply based on coal, nuclear and gas                                       ▪       Supply based on Renewables and flexible gas power plants
   ▪     Large, centralised power plants                                             ▪       Electricity storage with increasing importance
   ▪     National markets are not interconnected                                     ▪       Decentralised power generation with prosumers
                                                                                                                                                                 79
I. Appendix: Storage technologies
New Business Cases for Electricity Storage and Hydrogen
Application
> Separates sale of Green H2
Price-arbitrage for
electricity from its
electricity trading
generation
> Optimises utilisation of
Congestion
existing electricity Industry Mobility
Required Capacity
management
infrastructure
Green H2 is an indispensable Green H2 functions as an
input for decarbonising core easy-to-use fuel for transport
> Reduces costly peak-loads industrial processes, industries,
Peak Shaving
of large consumers e.g. steel making esp. aviation and cargo
Energy
> Stabilises network Green H2 enables decarbonisation
Voltage stability (SDL*) of the heating sector and adds
operations
flexibility to variable RES generation
> Participates in the control
Supply of control energy … but the hydrogen industry is still in its early stage and
energy market (RES power
(SDL*) competes with electrification for many use cases
plants not qualified yet)
* System services
80I. Appendix: Storage technologies
Electricity storage market is already growing strongly – rapidly falling costs help
In MW Annually commissioned utility-scale storage In USD Forecast of LCOE mid range
3000
Global annual battery 150
2621
storage capacity USD/MWh,
$/MWh, 2019
2019 real real
2500 additions 120
125 114
104
2000 95
100 87
1675 1488 83
79
1500 75 72
75 69 66
64
988 59 57
55 54 53 52
1000 51 50 49
801
604
50
473
500
246 25
148
0
2013 2014 2015 2016 2017 2018 2019 2020 2021 0
2020 2025 2030 2035 2040
▪ Strong increase in annual commissions over the last years ▪ Forecasted decrease in costs mainly caused by economies of
▪ Growth distributed globally with Korea and China leading scale and improved use of input materials
▪ Lithium-ion technology currently state-of-the art ▪ Decreasing costs drive capacity additions in a virtuous cycle
Source: BNEF
81I. Appendix: Storage technologies
Battery Storage: Possible market entrance for Encavis
Business model with minimised risks… … and great opportunities
▪ Encavis is owner and operator
▪ Diversification of Portfolio
of utility-scale batteries
▪ Encavis transfers usage
Established ▪ Complementary to
of batteries via long-term
technologies RES power generation
(Wind & PV) contracts
▪ Projects are bankable ▪ Early bird advantages
Established Established
markets business ▪ Partner is responsible for the
(Germany, UK, …) models
▪ Increase revenues of parks
marketing of the battery-
after end of FIT (“golden end”)
services
82Appendix I. Storage technologies II. The Management III. The Encavis share
II.   Appendix: The Management

Management team with great industry expertise
and strong passion for renewables

                                 Dr Dierk Paskert                                         Dr Christoph Husmann
                                 Chief Executive Officer                                  Chief Financial Officer

                                 CEO since Sep 2017                                       CFO since Oct 2014
                                 Reappointed until Aug 2025                               Reappointed until Sep 2025

CEO Rohstoffallianz GmbH                                      Member (CFO) and later CEO of the Management Board of
Member of the Management Board of E.ON-Energie AG             HOCHTIEF Projekt Entwicklung GmbH
SVP Corporate Development of E.ON AG                          Head of Corporate Controlling and M&A of STINNES AG and HOCHTIEF AG
Member of the Management Board of Schenker AG                 Controlling of VEBA AG

                                                                                                                         84
II. Appendix: The Management
Supervisory Board
Dr Manfred Krüper (Chairman) Alexander Stuhlmann (Dep. Ch.) Albert Büll (dependent)
Member of the Board of Directors CEO at HSH Nordbank (until Dec 2006) Entrepreneur and co-owner of the B&L Group
at E.ON AG (until Nov 2006) and thereafter CEO at WestLB AG Advisory Council (a.o.):
(until April 2008) BRUSS Sealing Systems GmbH,
Supervisory Board (a.o.):
Power Plus Communication AG, Supervisory Board (a.o.): Euro-Aviation noventic GmbH
EQT Partners Beteiligungsberatung GmbH; Versicherungs-AG, Ernst Russ AG, GEV Gesell-
EEW Energy from Waste GmbH schaft für Entwicklung und Vermarktung AG,
M.M. Warburg & CO Hypothekenbank AG
Dr Henning Kreke (dependent) Dr Cornelius Liedtke (dependent) Christine Scheel
Previously CEO at Douglas Holding AG Entrepreneur and co-owner of the B&L Member of the Supervisory Board at CHORUS
for 15 years Group Clean Energy AG (until Oct 2016) Former
Member of the German Parliament
Supervisory Board (a.o.): Supervisory Board (a.o.):
Deutsche EuroShop AG; Douglas GmbH, BRUSS Sealing Systems GmbH,
Supervisory Board (a.o.):
Thalia Bücher GmbH SUMTEQ GmbH
NATURSTROM AG
Dr Marcus Schenck Dr Rolf Martin Schmitz Prof Fritz Vahrenholt
Partner of Perella Weinberg Partners Previously CEO at RWE AG Chairman of the Supervisory Board
(until May 2021) (until January 2014) at RWE Innogy GmbH
Independent Advisory Council (a.o.): (previously CEO)
EQT Infrastructure Supervisory Board (a.o.):
E.ON SE, TÜV Rheinland AG, Supervisory Board (a.o.):
KELAG-Kärntner Elektrizitäts-AG Aurubis AG
85Appendix I. Storage technologies II. The Management III. The Encavis share
III.   Appendix: The Encavis share

Dividend of EUR 0.28 per share for FY 2020
fully in line with dividend target 2021                                                  Nominal dividend to increase by 50%
                                                                                         (base-year 2016) to 30 EUR cent in 2021   0.30
                                                                                                                           0.28
42.9% of shareholders preferred new Encavis shares to cash dividend for FY 2020
after the significant majority (61.5%) of shareholders the year before                                          0.26

Dividend policy reflects increasing cashflows from wind and solar parks                             0.24
over time to serve their corresponding financing obligations                             0.22
„Dividend strategy 2021“ of 50% increase of                                       0.20
nominal dividend until 2021 (compared to 2016)                            0.18
is based on the existing wind and solar park
portfolio as of March 31, 2017                                0.15
Further acquisitions of wind
and solar parks will positively
contribute to the dividend                         0.10
potential of Encavis AG                     0.08

                                     0.05

                                     2011   2012   2013       2014        2015    2016   2017       2018       2019        2020    2021e
Dividend in EUR cent/share
                                                                                                                                      87
III. Appendix: The Encavis share
Entrepreneurial shareholder structure –
strong and long-term anchor investors
Market Cap: # shares: 139,364,201
> 2.2 billion EUR (as of August 5th, 2021)
Major investors within the free float:
4.9% Morgan Stanley
Pool of
4.3% The Goldman Sachs Group, Inc. 27.4% AMCO Service GmbH with
4.1% UBS Group AG Dr. Liedtke Vermögensverwaltung GmbH
4.0% Versicherungskammer Bayern
3.7% BlackRock, Inc.
3.6% Lobelia Beteiligungsgesellschaft/
Free float
Kreke Immobilien KG
3.1% Invesco Ltd. (incl. Invesco ETF Trust II) 72.6%
3.1% DWS Investment GmbH, Frankfurt/Main
2.3% PELABA Vermögensverwaltungs GmbH & Co. KG
1.7% iShares Trust
0.9% iShares II plc
0.5% Management of Encavis AG
88III. Appendix: The Encavis share
13 „Buy/OW or Hold“ recommendations out of 14 active coverages
Coverage institution Updated Ratings Date Target Price (EUR)
Reduce Aug 06, 2021 13.00
Buy Jul 28, 2021 19.00
Buy Jul 27, 2021 18.90
Buy Jun 17, 2021 20.00
Buy May 18, 2021 18.30
Overweight May 14, 2021 18.00
Neutral May 14, 2021 18.00
Hold May 14, 2021 21.80
Hold May 14, 2021 15.50
Hold May 14, 2021 15.50
Buy Apr 07, 2021 23.00
Buy Mar 24, 2021 20.50
Neutral Mar 24, 2021 21.60
Buy Nov 16, 2020 21.00
Consensus 18.86
89III. Appendix: The Encavis share
Encavis share with fast recovery and strong upward trend in 2020
190
ENCAVIS DAX 30 MDAX SDAX
180
170
160
150
140
130
120
110
100
90
10.08.20 10.09.20 10.10.20 10.11.20 10.12.20 10.01.21 10.02.21 10.03.21 10.04.21 10.05.21 10.06.21 10.07.21 10.08.21
90III. Appendix: The Encavis share
Encavis AG – one of the largest independent and listed European Renewable IPPs
Benchmarking by market capitalisation as of 2021, August 10th (EUR million)
3,277
3,072
2,981
European listed renewable companies
2,234
Listed yield companies
1,765
1,330
1,086
744 706
476
248
91III. Appendix: The Encavis share
Financial Calendar
Date 2021 Event Date 2021 Event
Aug 13 Interim report Q2/6M 2021 Nov 15 Interim statement Q3/9M 2021
Aug 16 Jefferies Virtual Road Show (EU) Raiffeisen Capital Management
Nov 18
Sustainability Symposium, Vienna (AT)
Aug 24 Jefferies Virtual Road Show (GER)
Nov 22-24 German Equity Capital Market Forum,
Aug 25 montega HIT Hamburger Investoren Tage, Deutsche Börse, FFM (GER)
Hamburg (GER) Nov 30 Crédit Mutuel-CIC Renewable Conference –
Sep 1 Commerzbank ODDO BHF Sector Conference, by ESN, London (UK)
Frankfurt/Main (GER)
Nov 30 DZ Bank Equity Conference, FFM (GER)
Sep 9 Raiffeisen Bank International ESG Conf.
Berenberg European Conference 2021 /
Dec 6-8
Sep 12 Interest payment PNL 2018 “Green SSD” Pennyhill Park, Surrey (UK)
Sep 13 Interest payment Hybrid Convertible Dec 11 Interest payment PNL 2015
Sep 20 10th Baader Investment Conference, Date 2022 Event
Munich (GER)
Sep 22-23 Berenberg & Goldman Sachs 10th German Jan 6-7 25th ODDO BHF Forum, 100% virtual
Corporate Conference, Virtual (GER) Berenberg German Corporate Conference
Jan 10-12
Sep 22-23 Alliance Bernstein‘s 18th Annual Strategic USA 2022 / Manhattan, New York (USA)
Decisions Conference for CEOs, USA virtual UniCredit Kepler Cheuvreux 21st German
Jan 17
Oct 5 1st Virtual Stifel Renewables Conference Corporate Conference (GCC)
Sep 7-8 Stifel Cross Sector Insight Conference,
London (UK)
92Thank you.
IR / PR Contact
Jörg Peters
Head of Corporate Communications & IR
T +49 (0)40 / 37 85 62 242
M +49 (0)160 / 429 65 40
E joerg.peters@encavis.com
The information provided in this document has been derived from sources that we believe to be reliable. However, we cannot guarantee the accuracy or completeness of this information and we do
not assume any responsibility for it. Encavis AG assumes no liability for any errors or omissions or for any resulting financial losses. Investments in capital markets, in particular in stock markets and
futures markets, are fundamentally associated with risks and a complete loss of the invested capital cannot be ruled out. Recommendations provided herein do not represent an offer to buy or sell
and are not intended to replace comprehensive and thorough advice before making a decision to buy or sell. Copies of the content of this presentation, in particular prints and copies or publications
in electronic media, will only be authorized by written consent from Encavis AG.
Encavis AG| Große Elbstraße 59 | D – 22767 Hamburg | Germany | www.encavis.comYou can also read