Transport Energy Infrastructure Roadmap to 2050 - METHANE ROADMAP JUNE 2015 Prepared for the LowCVP by Element Energy Ltd Celine Cluzel & Alastair ...
←
→
Page content transcription
If your browser does not render page correctly, please read the page content below
Transport Energy Infrastructure
Roadmap to 2050
METHANE ROADMAP
Prepared for the LowCVP by Element Energy Ltd
Celine Cluzel & Alastair Hope–Morley

JUNE 2015

Transport Energy Infrastructure
Roadmap to 2050

METHANE ROADMAP

JUNE 2015

LowCVP Project Manager Project Steering Group
Jonathan Murray, Autogas Limited
Policy and Operations Director BOC Limited
 BEAMA
Contractor Calor Gas Ltd
Prepared by Element Energy Ltd EDF Energy
 Electricity Networks Association
Authors National Grid
Celine Cluzel Office for Low Emission Vehicles
Alastair Hope-Morley Renewable Energy Association
 Transport for London
Reviewer Transport Scotland
 UK Petroleum Association
Ian Walker

Disclaimer
While the authors consider that the data and opinions contained in this report are sound, all parties
must rely upon their own skill and judgement when using it. The authors do not make any
representation or warranty, expressed or implied, as to the accuracy or completeness of the report.
Acknowledgements The LowCVP, established in 2003, is a public-private partnership that exists to accelerate a sustainable shift to lower carbon vehicles and fuels and create opportunities for UK business. The LowCVP aims to: Develop initiatives to promote the sale and supply of low carbon vehicles and fuels Provide input and advice on Government policy Provide a forum for stakeholders to share knowledge and information Ensure that UK motor, fuel and related businesses are best placed to capitalise on the opportunities in the low carbon markets of the future Contribute to the achievement of UK Government targets for road transport carbon reduction GTC Project Steering Committee Workshop attendees Intelligent Energy Nissan Autogas Limited Aberdeen City Council Openenergi BOC Limited Air Products Riversimple BEAMA BRC Scania Calor Gas Ltd BYD SGN EDF Energy Calor gas SMMT Electricity Networks Association CNG Fuels TfL National Grid CNG Services Thriev Office for Low Emission Vehicles Dearman Engine Company Ltd Tower Transit Renewable Energy Association Downstream Fuel Association UKLPG Transport for London Drivelectric Ltd. UKPN Transport Scotland ENN Group Europe ULEMCo UK Petroleum Association Gas Bus Alliance UPS Gasrec Wales & West Utilities 3
Contents

 − Introduction and context

 − Background and status quo

 − Future refueling infrastructure requirements and
 barriers to deployment

 − Summary roadmap and recommendations

 − Appendix

 4
Background - a ‘Transport Infrastructure roadmap’ is needed to complement existing vehicle and fuel roadmaps In the context of the expected transition to lower carbon powertrains Vehicle roadmaps and fuels, the Auto Council vehicle roadmaps have proven to be a useful tool to focus research, funding and policy, bringing into one place the industry’s views on future technology options, deployment steps and corresponding policy drivers. To complement these powertrain technologies roadmaps, the LowCVP commissioned a Road Transport Fuels Roadmap in 2013-14, which also proved successful in bringing clarity to the fuel options available and mapping the enabling milestones. This Infrastructure roadmap is the ‘missing piece’ that will support new powertrains and new fuels. This roadmap is all the more Source: Auto Council and LowCVP necessary as the needs and barriers for deployment of electric, hydrogen and gas refuelling stations differ significantly and Transport fuel roadmaps refuelling/recharging infrastructure is a key enabler for low emission vehicles. The objectives of the Infrastructure Roadmap are to: − Assess the infrastructure needs and barriers for deployment of electric, hydrogen and gas refuelling stations to 2050, including impact on upstream distribution, as well as to consider ‘conventional’ liquid fuels − Make recommendations for delivery of infrastructure deployment, both at national and local government level. Source: Auto Council and Element Energy for the LowCVP Source: Element Energy 5
The Infrastructure Roadmap covers private and public infrastructure, for all main road vehicles and both current and future fuels Fuels / energy vectors considered Vehicle types Zero tailpipe emission fuels: electricity and hydrogen ‘Conventional’ liquid fuels: gasoline (E5 to E20, in line with the Transport Fuels Roadmap), diesel, LPG/bio-propane Methane: Compressed Natural Gas (CNG), Liquefied NG (LNG) and biomethane Niche/future fuels: methanol, liquid air and a high bioethanol blend (E85) Refuelling infrastructure types Depot based refuelling for fleet operators and return to base operators Home recharging for private and (some) commercial vehicles Public forecourt refuelling/recharging Drivers for change in the transport energy system The UK’s legally binding target to reduce total GHG emissions by at least 80% (relative to 1990 levels) by 2050, and transport contributes to c. 25% of UK total GHG emissions; EU level regulations (gCO2/km, Air Quality targets and EURO spec), Directives (Renewable Energy, Fuel Quality, Clean Power for Transport) and Transport White Paper Source: Element Energy 6
The development of the Infrastructure Roadmap benefitted from input from a wide range of stakeholders, many consulted through workshops Develop uptake scenarios ICE vehicles: diesel, petrol, LPG, gas vehicles for % sales of electric and Electric vehicles: Battery (BEV), Plug-in Hybrid (PHEV), ICE vehicles Range-Extended (RE-EV) and hydrogen fuel cell (FCEV) Niche/future fuels considered: E85, methanol, liquid air Input into Element Energy Scrappage rate, stock and mileage inputs based on DfT data/projections: c. 40% increase in stock and fleet model vkt by 2050 (39 million vehicles, 740 billion vkt); Vehicle efficiency based on Committee on Climate Change modelling Output numbers of See full reports for Review existing literature vehicles in the fleet and further details of fuel on refuelling and MJ used per energy vector uptake scenarios upstream infrastructure Industry consultation Prepare Infrastructure Four dedicated fuel workshops were conducted with LowCVP Fuels Roadmap Workshop themes: electricity, liquid fuels, methane, hydrogen working group 38 attendees included: Infrastructure manufacturers, installers, operators, DNOs, energy companies, fuel suppliers, OEM / vehicle Host stakeholder suppliers, end users, local government / regulator workshops Review by Steering Prepare draft report Committee Report preparation Complete final report External input Source: Element Energy vkt: vehicle km travelled 7
Four separate reports have been developed – this report is dedicated
to the case of methane as a transport fuel

 Four separate reports were produced to capture the differences
 between the energy vectors / fuels under consideration

 This
 report
 Final report
 summarising
 findings from each
 energy vectors

 8
Structure of the report Background and status quo − Summary of current transmission & distribution system and energy vector usage − Energy vector current supply pathways − Current dispensing technologies, geographical spread and key stakeholders Future infrastructure requirements and barriers to deployment − Quantification of gas refuelling station needs, per location and/or vehicle segments - based on projected demand, derived from validated uptake scenarios − Barriers to deployment of infrastructure - barriers to deployment of corresponding powertrains are not discussed– uptake of new powertrains/fuels is the starting assumption − Impact on distribution / transmission systems Summary: infrastructure roadmap and recommendations − Roadmap schematic that summarises the above findings − Recommendations for delivery (national, local, RD&D needs, funding shortfall) 9
Contents

 − Introduction and context

 − Background and status quo

 − Future refueling infrastructure requirements and
 barriers to deployment

 − Summary roadmap and recommendations

 − Appendix

 10
The extensive natural gas supply chain in the UK can support
 the development of natural gas refuelling infrastructure
 Unprocessed
 Natural gas LNG
 Upstream

 natural gas

 Gas processing Coastal import
 (Gaseous) natural gas flow
 terminal
 / terminals
 /
 LNG flow

 LNG is distributed via
 Midstream

 See schematic of trucks or vaporised
 natural gas grid in at import terminals
 upcoming section Natural gas grid
 and injected into the
 gas grid
 Extensive coverage: c. 270,000 km of pipeline
 Multiple pressure points: 30 mbar – 85 bar

 >>99% of UK total natural
Methane (CH4) as a transport fuel is commonly dispensed to end users
in two forms; as Compressed Natural Gas or Liquefied Natural Gas
Liquefied Natural Gas (LNG) ( ) Compressed Natural Gas (CNG) ( )
Key characteristics Key characteristics

a. In the UK today, only trucks compatible with LNG have a. In the UK today, the main CNG compatible vehicles
 been deployed, both with dual fuel and dedicated ICE deployed are trucks (250 bar), buses & vans (200 bar)
 engines both with dual fuel and dedicated ICE engines
b. LNG is dispensed at -120°C to -162°C and 2 to 11 bar b. CNG is dispensed at ambient temperature and 200-250
 from on-site cryogenic tank storage bar from on-site high pressure tank storage
c. LNG is distributed to refuelling stations via road c. CNG is distributed via pipeline by the gas grid network,
 delivery therefore station sites are not restricted to an restricting station distribution to grid geography for
 existing pipeline network economic and practical reasons
d. Some LNG stations are capable of dispensing both LNG d. Stations are restricted to dispensing CNG only
 and CNG (L-CNG stations)

Volumetric energy density relative to diesel: Key technical issues:
 100%
 Methane Incomplete combustion of all methane delivered to
 60% slip ICE engine resulting in methane exhaust emissions
 25%
 Methane Partial escape of methane into the atmosphere due
 venting to boil-off from LNG storage containers
 Diesel LNG CNG

 The EU requires CNG and LNG infrastructure deployment and this roadmap aims to illustrate the requirements
Note, current policy focus and end user demand indicates that natural gas powered vans will not play a major role in
decarbonising the UK transport system and are therefore not explicitly mentioned in this infrastructure roadmap
 12
The UK currently imports two thirds of its total natural gas supply via eleven operational natural gas import terminals Natural gas terminals Annual UK natural gas supply Natural gas terminals 1,500 TWh/year Natural gas: LNG: 1,000 11 coastal terminals 500 Ineos plan to deploy new LNG import 0 facilities to benefit from 2007 2009 2011 2013 US shale gas by 2016 LNG imports LNG import capacity (Gaseous) natural gas net imports* (Gaseous) natural gas import capacity Gasrec operate UK natural gas supply source UK’s only liquid biomethane plant In 2013, import capacity for natural gas / LNG was 65% / 20% Avonmouth in Surrey LNG peak utilised shaving facility Avonmouth peak shaving plant (natural gas to LNG) is expected to end operations by 2016 due to increasing costs and reliability issues Isle of Grain’s road loading facilities are expected to be Isle of Grain road loading completed by September 2015, thereby ensuring a secure facilities are expected to be able to fill c.35 trucks per day supply for LNG stations for the majority of the UK Teeside and Dragon (Milford Haven) LNG It may be more economical to supply areas of northern UK by import terminals are currently inactive shipping LNG trucks from Europe to northern UK ports SOURCE: DUKES Chapter 4 (2014), BP Statistical Energy Review (2014), Entsog European Natural Gas Network (2014), GLE 13 LNG Investment Database (2014). *Natural gas net imports = total domestic production + total imports – total exports
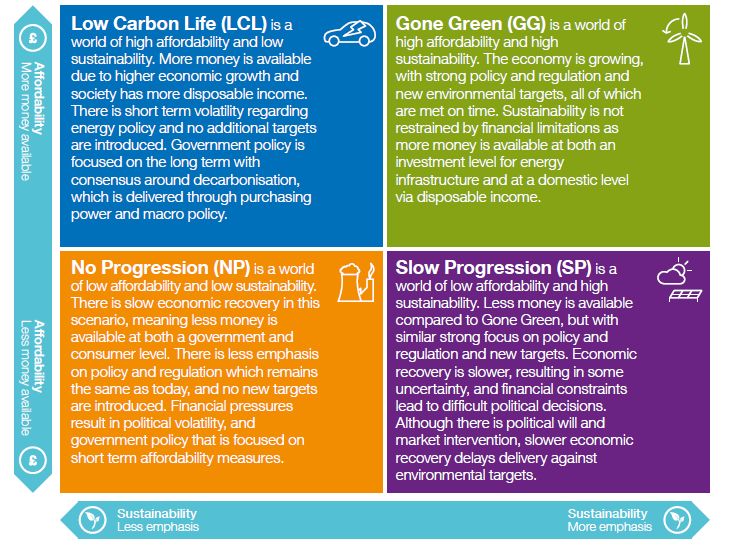
Existing natural gas production and import activities are expected to continue beyond 2030 The UK has been a net natural gas importer since 2004 UK natural gas actual supply composition (2013) UK production from North Sea gas fields has declined and has been 12% supplemented by pipeline-ready CNG Domestic production 41% from continental Europe CNG imports (Norway, Belgium, Netherlands) LNG imports (Qatar, Algeria, Norway) A number of LNG terminals contribute 48% to UK supply by vaporising LNG imported by tanker ship National Grid has multiple natural gas supply scenarios UK natural gas predicted supply composition (2035) Continued imports and potential 819 TWh 668 TWh 640 TWh 810 TWh domestic production of shale gas and 15% 16% 13% 8% Domestic production coal bed methane will be key future 14% (Continental shelf) sources of natural gas supply to the UK 26% 3% 42% Domestic production National Grid predicts up to c. 35 TWh 5% 91% (Shale, coal bed methane) 3% of domestic biomethane production in 70% Domestic production 53% (Biomethane) the UK1, maximum 5% of total supply 40% Imported CNG and LNG Existing natural gas supply strategy is expected to support UK demand Low Gone Green Slow No carbon life progression progression beyond 2050 SOURCE: National Grid “UK Future Energy Scenarios” (2014) 1 – This is the ‘Gone Green’ case. Under current incentive 14 the ‘No progression’ case is most likely in terms of biomethane production in the UK
The majority of the gaseous natural gas supply in the UK is distributed via the gas grid network consisting of varying pressure outlets CNG distribution and station siting Gas distribution network – most extensive high pressure system The majority of CNG is delivered to National transmission System customers via pipeline with limited system (NTS) length − Greater compression required to reach dispensing pressure1 truck based deliveries eliminating Demand at 70-80 bar 7,600 km the need for end users to bunker Local fuel at private depots transmission The Local Transmission System (LTS) system (LTS) provides the best economic solution Demand at 7-70 bar − Increased likelihood of methane venting to access gas for transport applications, therefore public CNG Considering major trucking 7,000 km forecourt siting should consider LTS routes and depot distribution, the UK’s LTS connection whenever possible − Cheaper grid connection cost network should supply c. 30-60 CNG stations2 Intermediate If LTS access (see next slide for map) is not available, Intermediate or pressure Medium pressure networks should Demand at 2-7 bar 5,000 km be considered for existing commercial depots Medium pressure Northern Ireland’s gas grid 30,000 km Demand at 75mbar - 2 bar infrastructure is significantly less mature than Great Britain Low pressure Demand at 30-75 mbar 217,000 km 1- Cost advantage depends on length of pipeline between network and filling station, c. £200-500k per km 2 - Based on work done by CNG Services for National Grid) 15
CNG station siting should balance the benefits of higher pressure grid access and geographic compatibility with the major demand Local Transmission System (7-70 bar) CNG station grid access Intermediate pressure (2-7 bar) The Local Transmission System (LTS) provides the most cost effective grid access point on an opex basis since the least compression is required for dispensing at 200-250 bar Manchester LTS accessibility is varied; pipelines pass Sheffield through and interconnect major urban areas but do not consistently follow major trunk Nottingham roads and motorways Existing depots fortunate enough to have LTS access in their proximity should exploit the benefits or consider Intermediate Pressure Birmingham (IP) network connection if LTS is unavailable Northampton Intermediate Pressure (IP) access requires greater compression but capital costs for equipment and grid connection are likely to Oxford be lower (e.g. connection to LTS has higher London costs (c.£200k) than connection to IP) Bristol Source: National Grid 16
LNG is delivered inland by trucks; UK based truck loading is available at Avonmouth terminal and soon Isle of Grain terminal (from late 2015) LNG distribution and station siting implications LNG is delivered via trucks with cryogenic storage tanks In the UK, currently only one active LNG facility has road loading facilities (Exxon Mobil’s Avonmouth Terminal, due to close in 2016) Road distribution allows refuelling station siting to be more flexible and does not have the geographic restrictions of pipeline delivery of gaseous natural gas L-CNG stations receive LNG from road truck delivery and store some LNG in cryogenic tanks as well as vaporising on-site and compressing to 200/250 bar, allowing both liquid or gaseous fuel to be dispensed Avonmouth truck loading facilities Evolving LNG supply in the UK Following a series of upgrades, in 2010 Isle of Grain became Europe’s Largest LNG terminal with 1 million m3 of static storage and 15 million tonnes/year capacity for gasification and injection into the gas grid In 2012, National Grid indicated plans to install road loading facilities with a capacity to fill 32-36 LNG tankers (40 m3/tanker) per day, expandable across four bays The new service is expected to become available late 2015 Design plan for Isle of Grain truck loading facilities Source: National Grid 17
Refuelling infrastructure technology is mature but public coverage in the UK is low, the majority being located at dedicated private depots Natural gas refuelling geography UK refuelling network – existing infrastructure Natural gas refuelling points Disclaimer: Up-to-date information detailing active natural gas Private Public stations was not readily available at the time of writing and a CNG: LNG: number of inaccuracies were identified in public databases L-CNG Based on industry consultation, existing infrastructure includes Confirmed active stations: 25 private depot stations, with c.60% offering LNG and 17 public LNG = 10 public, 14 private CNG = 5 public, 10 private forecourts with a similar LNG/CNG mix L-CNG = 2 public, 1 private A further 7 refuelling stations (mainly LNG) have received grant [March 2015] funding through the UK’s Low Carbon Truck trial and are due to be built over the next 2-3 years (note, funding availability ends in 2015) UK refuelling network – innovative solutions A number of fleet operators have deployed semi-private refuelling facilities under cooperative contractual arrangements allowing pre-agreed operators to share each others facilities Advantages of this approach include maximising station throughput and reducing dependency on public infrastructure rollout Sources: Gasrec, ENN, Calor, Gas Bus Alliance, BOC, Low Carbon Truck Trial, Element Energy 18
Trials of gas HGVs are currently being supported by the UK government to monitor performance and inform its gas-for-freight strategy LCT trial will engage commercial vehicle operators 13 projects for Low Emission Trucks selected for OLEV-TSB funding in 2012, total funding of £11.3 million Vehicle deployment (as of Oct 2014) 354 trucks (all gas except for 10 Used Cooking Oil dual fuel 10 tractors) to be trialled from 2013/14 to December 2015, UCO dual fuel almost doubling the current UK stock 119 LNG duel fuel 149 CNG duel fuel Funding will significantly improve the UK infrastructure 17 new gas stations will be opened (mostly LCNG) and 8 LCT trial status: 278 in operation, further 76 to be deployed existing stations will be upgraded (methane vent capture) Station deployment (planned) By September 2014, 10 (new or upgraded) stations had been 1 LNG made available through the trial – the remainder are awaiting 4 CNG planning consent 2 10 LCNG As of Oct 2014, LNG and CNG dual fuel trucks make up c.50% UCO and c. 40% respectively of vehicles deployed under the trial LCT trial status: 10 in operation, further 7 to be completed Truck performance is being monitored with an operational target of 15% TTW CO2 relative to incumbent diesel vehicles Truck users in trial Results from trial will provide the evidence for future 2 Food supplier government plans for gas freight support Large retailer 7 3 The trial should also advance station knowledge e.g. Logistic and haulage planning/design length, barriers to rollout, performance Sources: DfT presentation at NGV day June 2014, Low Carbon Truck and Refuelling Infrastructure Demonstration Trial 19 Evaluation (Sept 2014), direct communication with Atkins TTW = Tank to Wheel
Analysis quantifying CO2 emissions associated with natural gas used for WTT = Well to Tank transport is inconsistent and contains many uncertainties TTW = Tank to Wheel WTW = Well to Wheel Joint Research Council report for EC (2014) Independent report for DfT (2014) WTW benefits over diesel WTW benefits over diesel2 % 200 177 % 200 100 90 31 100 55 32 6 0 0 17 -21 -100 -100 Biomethane Natural gas Biomethane Natural gas Analysis calculates WTW benefits combining WTT analysis Impacts from LNG storage boil-off, vehicle with a constant TTW value1 for all natural gas scenarios efficiency and methane slippage were not This well-recognised study compares only six different accurately assessed due to unavailable or natural gas and biomethane scenarios and has no incomplete data consideration of variable powertrain impacts As such, the authors concluded the report to Furthermore, the study is not UK specific contain considerable uncertainty Existing analysis identified optimal CNG and LNG siting considerations but contains high uncertainty Key findings: CNG WTT emissions increase when connected to lower pressure grid points (leaks) and LNG WTT emissions increase with greater distance between LNG terminal and station Both studies identified significant CO2 savings from the use of biomethane as an alternative to natural gas The ETI has commissioned an extensive modelling exercise3 to improve understanding of GHG emissions associated with all key stages of WTW natural gas pathways specific to UK 160 gCO2/MJfuel, 2Ranges for small HGVs, large HGVs and buses, 3 Public RfP “Gas Energy System Well to Motion Modelling for Heavy Duty Vehicles”. Source: JRC (2014), Ricardo-AEA (2014) 20
Standards and regulations for CNG and LNG provide certainty over safe siting practices but local interpretation can cause delays The Institution for Gas Engineers and Managers (IGEM) provide technical standards for the UK and global natural gas supply chains The Health and Safety Executive (HSE) aims to “secure the health, safety and welfare of people at work… by applying a mix of intervention techniques including inspection, advice and support” The British Compressed Gases Association (BCGA) aims to “promote and advise on safe practice, participate in standards making, and assist in the preparation of practicable legislation” Standards and codes of practice Many existing standards have been developed: IGEM/UP/5 (standard for CNG), COMAH regulations for LNG, IGEM/UP/20 (to become the new UK technical standard for CNG fuelling stations covering piped natural gas from the supply network and piped bio-methane supply) A number of future standards are also being developed: IGEM/UP/21 (available late 2015) will become guidance document for LNG refuelling stations, complementing ISO/DIS 16924 and BCGA code of standards Standards in place aim to eliminate uncertainty surrounding the safe siting of CNG and LNG stations However, installation delays are common, slowed down by inconsistent interpretation of standards by LAs Industry feels it is HSE’s responsibility to develop planning permission guidelines by combining existing standards and regulations with industry input SOURCE: Element Energy, CNG Services, www.igem.co.uk 21 COMAH: Control of Major Accident Hazard
In 2014, the European Commission issued a directive to help harmonise technical specifications for methane infrastructure for transport The Clean Power for Transport program, initiated in 2013, aims to facilitate the development of a single market for alternative fuels for transport in Europe The resulting 2014/94/EU directive on ‘the deployment of alternative fuels infrastructure’ aims to: 1) Harmonise technical specifications for recharging and refuelling stations 2) Develop clear, transparent fuel price comparison methodologies 3) Ensure Member States develop national policy frameworks to support the deployment of alternative fuel technologies and infrastructure Natural gas supply for transport TEN-T Core Network CNG and LNG connectors UN ECE Regulation 110 ISO/DIS 12617 and receptacles for vehicle refuelling UN ECE Regulations: ISO/DIS 16923, LNG, CNG and L-CNG ISO/DIS 16924 refuelling points for motor LNG stations for heavy duty motor vehicles vehicles along the TEN-T core network should be LNG, CNG and L-CNG approximately 400 km apart CNG stations in urban and sub-urban areas refuelling station along the TEN-T core network (at least) geographic distribution should be approximately 150 km apart 200km SOURCE: European Commission Press Release Database 22 TEN-T: Trans-European Transport Networks
CNG stations in the UK dispense at 200 and 250 bar for buses and trucks respectively whereas CNG stations in the EU dispense at 200 bar only CNG refuelling infrastructure in the EU Two common standards are relevant to the design of vehicle tanks: 1. ISO 11439 stipulates a working pressure of 200 bar but permits other working pressures (including 250 bar) 2. UN ECE-R110 stipulates a working pressure of 200 bar only OEMs are focussed on the UN standard and therefore are only interested in developing 200 bar vehicles This is reflected by the deployment of (mostly) 200 bar CNG refuelling infrastructure in mainland Europe CNG refuelling infrastructure specific to the UK Two types of CNG dispenser nozzle commonly exist: 1. 200 bar nozzles are designed to refuel vehicles in accordance with refuelling standard ISO 14469-1 2. 250 bar nozzles are designed to refuel all ISO 14469-1 non-compliant CNG vehicles All gas buses and vans in the UK currently have 200 bar tanks whilst retrofitted gas HGVs tend to have 250 bar tanks Importantly, the two nozzles types are not cross-compatible Implications for future CNG infrastructure in the UK CNG station standard ISO/DIS 16923 is unlikely to stipulate a single dispensing pressure Multiple dispensing pressures are unlikely to negatively impact OEMs decisions to bring HGVs to the UK market SOURCE: European Commission, industry input 23
Contents

 − Introduction and context

 − Background and status quo

 − Future refueling infrastructure requirements and
 barriers to deployment

 − Summary roadmap and recommendations

 − Appendix

 24
Natural gas vehicle uptake has been projected, in line with policy drivers, to quantify the methane demand in road transport In consultation with the LowCVP Fuels Working Group, we derived uptake scenarios for new powertrains/fuels, they are policy led, typically based on CCC targets. Scenarios are used to forecast infrastructure required to match transport policy ambition and estimate the corresponding upfront costs of this infrastructure In the case of natural gas vehicles, uptake is exclusively in the heavier vehicle segments A single uptake scenario was developed for HGVs and Market share of natural gas buses (new sales) buses –see “Introduction and background” Dedicated ICE Uptake of natural gas ICE passenger cars and vans is No dual fuel bus demand not expected to play a significant part in the UK’s road is expected in the UK transport decarbonisation activities Buses are expected to use exclusively CNG with only 1% 4% 10% 10% dedicated natural gas engines (no dual fuel) 2015 2020 2030 2050 HGVs will use both CNG and LNG depending on vehicle operation (e.g. long haul versus inner-city) and Market share of natural gas HGVs (new sales) will use both dual fuel (diesel and methane) and Dedicated ICE dedicated engines up to 2030 and by 2050 all vehicles Dual fuel ICE will be dedicated fuel We refer to ‘CNG’ and ‘LNG’ but the methane could be 40% biomethane – the molecule being the same, there is
Three separate classes of HGV (varying in size) are considered in
 the roadmap with a single bus class to make up total HDV demand

 Weight 3.5-7.5 tonnes 7.5-18 tonnes >18 tonnes

 Smaller 2-axle truck, Larger 2-axle truck, Multi axle truck,
 Description rigid rigid (mostly) articulated

 Local construction /
 Application commercial delivery
 Refuse collection, intercity delivery Long-haul deliveries

 Mileage 30-60,000 km/year 30-60,000 km/year >60,000 km/year

 Share of stock 12% 46% 42%
 (UK HGV fleet, c. 469k)

 Diesel
 22 L/100km 27 L/100km 36 L/100km
 consumption
 Natural gas
 n/a 15-20 kg/100km 20-30 kg/100km
 consumption
 Dedicated and dual fuel (60% gas,
 Natural gas
 Not applicable 40% diesel) both LNG and CNG by Dual fuel LNG only
 vehicle type 2030, dedicated only by 2050

SOURCE: DfT “Guide to lorry types and weights” (2013), DfT “Vehicle Licensing Statistics” (2014), DfT “Fuel consumption
by HGV vehicle type in GB, 1993-2010”, DECC “Energy Consumption in the UK” (2014)
 26
Total expected natural gas demand for transport by 2050 represents
 c.6% of the UK’s total natural gas consumption in 2015

 Thousand TWh
 tonnes/year /year
 150,000
 150,000 1989

 64,000
 64,000 848

 4,000 3,770
 53

 2,000 27 1,170
 15 220
 0
 2015 2020 2030 2050 2013 2015
 Comparison to total UK
 Transport demand
 production / consumption

 HGVs demand Total UK natural gas import and production capacity
 Buses demand Total UK natural gas consumption

Source: Element Energy analysis (2015), DUKES Chapter 3 (2014) 27
Based on current refuelling patterns for heavy duty vehicles, gas trucks and buses will require both depot stations and public stations There are broadly two types of refuelling infrastructure for liquid fuels in the UK: Refuelling at private depots: c.40% diesel sales Refuelling at public forecourts: c.60% diesel sales Large fleet operators including public Generally, public vehicle refuelling (passenger transport operators, hauliers, logistics cars, vans, motorbikes, scooters) is facilitated by companies, forklift operators tend to operate one of the UK’s c.8,600 forecourts designated refuelling depots suited to their ‘return to base’ operations Refuelling forecourts are publically accessible Such facilities tend to be private and and are generally owned and operated by large exclusively service a single vehicle type oil companies (e.g. Shell, BP, Esso, etc.), Most buses and heavy good vehicles refuel independent retailers and supermarket chains in depots – share of diesel supplied through depot: 90% for buses, 40% for coaches 80% articulated trucks, 45% rigid trucks Source: Element Energy, DfT Modes 3 study (2011) 28
Dedicated gas buses will require mainly depot-based stations and high uptake projections suggests c.210 stations could be needed by 2050 2020 2030 2050 Vehicle stock: c.2,000 c.10,000 c.17,000 (no. of buses) Energy demand: c.50,000 c.220,000 c.340,000 (tonnes/year) Required c.80 (2t/day, c.130 (5t/day, c.200 (5t/day, stations: 80% utilisation) 90% utilisation) 90% utilisation) Short/medium term Long term Vehicle fleets of c.15-30 CNG buses requiring c. Key learnings from trials (e.g. 20 CNG buses in 100kg/day/bus stations Reading) will improve station design Intra and inter-city bus operation generally adopt Increased fleet sizes (50 buses) requiring larger return to base refuelling, therefore dedicated CNG 5t/day stations, will be clustered around optimal stations will be deployed at private depots gas grid access points to improve business case Smaller fleets (
Fleets of dedicated and dual fuel gas HGVs will require c. 35% of fuel demand from public forecourts with the remainder from depots 2020 2030 2050 Vehicle stock: c.8,000 c.50,000 c.190,000 (no. of HGVs) Energy demand: c.200,000 c.1,000,000 c.4,000,000 (tonnes/year) Required 10t/day c.45 (15t/day stations, c.230 (15t/day stations, c.800 (15t/day stations, stations: 90% utilisation) 90% utilisation) 90% utilisation) Short/medium term Long term OEM vehicles increasingly available to the UK market Increased public infrastructure We expect LTS and IP connectivity for CNG stations to be a main will allow small fleet HGV focus given WTW and economic benefits operators to deploy NG vehicles and enable large fleet Key learnings from OLEV Low Carbon Truck trial are disseminated operators to increase payload and inform future station design and cover longer distances Ensure public natural gas refuelling network develops,1 especially Unclear whether infrastructure along TEN-T corridor if EU funding is sought2 and along arterial rollout will continue motorways (long-haul HGVs) deployment along TEN-T Core Assuming large station rollout (10t/day), c. 35 CNG and 45 LNG Network or develop cluster stations will be required in 20203 networks of refuelling infrastructure around key cities Infrastructure investment must be flexible with respect to uptake of other low carbon transport fuels 1>75% of HGVs are in small fleets of
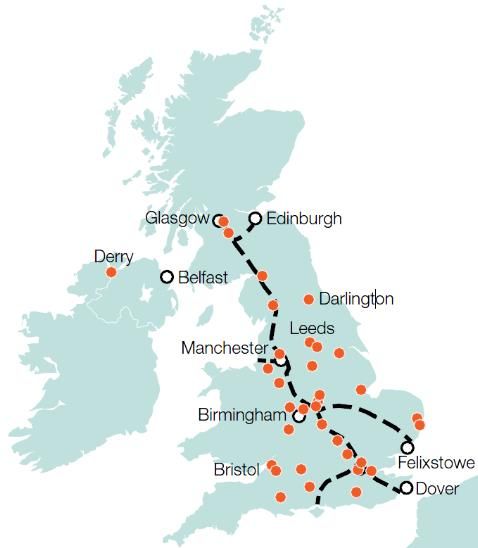
Long distance trucks (and intercity coaches) will require further development of the public refuelling infrastructure Questions to industry Feedback from industry Is the 400km separation In 2015, the majority of existing distance between LNG facilities are located at private stations sufficient, as depots stipulated by the EU Short term public refuelling Existing infrastructure directive? infrastructure rollout will be Is the 150km separation focused around demand, not distance between CNG necessarily in accordance with the stations suitable? TEN-T corridor Is the EU Directive a Cooperative models allowing semi- suitable policy for private facilities to be shared will directing infrastructure be considered in the early years to rollout? maximise throughput Infrastructure build-up is expected Note, all motorways and to be focused around the ‘golden ‘trunk’ A roads in the UK triangle’ between Bristol, have a total length of 12,000 Manchester and London, with km,1 suggesting a need for supporting infrastructure at only 80 CNG stations and 30 necessary outlier locations LNG stations Furthermore, a network of equally spaced refuelling sites is unlikely to develop 1DfT “Road lengths in Great Britain” (2013) 31
Approximately £0.8 billion is required to deploy sufficient infrastructure
to support increasing numbers of natural gas vehicles in the UK

 Approximate level of infrastructure investment
 required (station capital & civils costs only)
 £812m
 HGVs
 Buses
 £338m

 £81m

 2020 2030 2050

 Grid capacity has not been considered when producing overall station numbers. It is important to recognise that
 whilst overall spare gas grid capacity is expected to increase, local grid constraints might emerge

 Based on today’s costs. See Appendix for cost assumptions 32
The natural gas sector will need to address several barriers to allow
 the transition from demonstration activities to a commercial rollout
 Barrier Description Example solution
 CNG stations require connection to the gas
Gas grid Grid operators offer fast track applications for LTS
 grid, often costs can be prohibitive and
accessibility connection
 require lengthy approval procedures
 Grid connection costs vary significantly;
Gas grid connection Operators to offer competitive LTS connection
 LTS connection is approx. £200k more
services services to improve capital costs of CNG stations
 costly than for IP
 Pursue amendment of National Planning Policy
Planning consent Time to receive planning permission from
 Framework (NPPF) to give recognition of stations –
for new refuelling Local Authorities has caused significant
 already underway. Issue national planning guidance
stations delays to station deployment
 to facilitate planning decisions at local level
 Hazardous Area Consent (15 tonne limit)
On-site natural gas National guidelines need to be developed to allow
 and COMAH (20 tonne limit) make LNG
storage consent consent for larger storage capacity for natural gas
 fuel bunkering difficult
 Liquefied methane has a high vapour
Risk of methane Optimise dispenser and storage technology to
 pressure; methane has higher GHG effects
venting minimise venting – already underway
 than carbon dioxide in the short term
 Engage with Government on waste policy to
Limited access to accelerate introduction of separate food waste
The natural gas sector will need to address several barriers to allow
 the transition from demonstration activities to a commercial rollout
 Barrier Description Example solution

 Multiple dispenser nozzle types exist and their
 implementation has not been coordinated
 (e.g. LNG stations in the UK use multiple
Dispenser Ensure all new nozzles adhere to a UK standard
 nozzle types including JC Carter, Parker Kodiak,
incompatibility for both LNG and CNG (e.g. NGV2) dispensers
 Macrotech) resulting in drivers arriving at
 stations not compatible with their vehicle
 receptacles

 Road tunnels in the UK (e.g. Mersey, Dartford, Strategic deployment of new LNG import
Gas transportation
 Blackwell) have different restrictions for the terminals to avoid tunnels connected to major
through tunnels
 transportation of gases road networks

 34
Contents

 − Introduction and context

 − Background and status quo

 − Future refueling infrastructure requirements and
 barriers to deployment

 − Summary roadmap and recommendations

 − Appendix

 35
Regulatory barriers will be the primary focus for enabling natural gas
 infrastructure, whilst a number of technical issues must also be resolved
 Infrastructure roadmap 2015 2020 2025 2030 2050
 Total stations
Planning guidance for Local Authorities will help speed up station deployments with key outstanding safety issues addressed 1 Planning guidance 2 Safety issues A number of well informed, robust standards have been developed to Health and safety regulations and address technical issues associated the installation of natural gas codes of practice only partially refuelling stations address infrastructure requirements Infrastructure operators have identified inconsistent interpretation of these standards by Local Authorities to significantly delay station For example, natural gas installation infrastructure operators have Recommendations identified on-site storage allowances and safety distances to Central Government: develop planning guidance document to facilitate be incompatible with refuelling the uniform implementation of infrastructure equipment standards station deployment due to Consult with experienced Local Authorities, regulator unfamiliarity with the regulators, industry and utilities use of natural gas as a road fuel Collate existing Recommendations relevant standards Develop guidance document Regulators: Re-evaluate and consider amendment of existing standards for Issue a Call for Evidence to understand on-site natural gas storage allowances most commonly adopted standards and safety distances Cross cutting recommendation: Central Gov., LAs and regulators: Establish regular dialogue with the NGV Network, to address planning, safety and other technical issues as well as get industry input on funding/infrastructure strategies NGV Network = Natural Gas Vehicle Network, a platform of gas grid operators, gas and LNG suppliers, CNG/LNG station providers, gas vehicle OEMs and other related stakeholders 37
End user experience should be harmonised across UK network through standardisation of equipment and improved communication systems 3 Station economics and support 4 End user experience Industry asserted that economics for operating Inconsistent infrastructure implementation has led infrastructure in high throughput areas does not need to a fragmented driver experience at stations support, as evidenced by commercial organisations Vehicle tank receptacles are compatible with offering turn-key solutions different nozzles types and dispensing pressures but A minority of UK infrastructure projects have received no standard stipulates a specific requirement grant funding1; further support should target areas of Station downtime (e.g. for maintenance) is often not lower vehicle throughput/lower base demand communicated to drivers and fuel price variations Areas for optimisation include costs for high pressure can significantly impact fleet operations grid connection and venting prevention technologies Recommendations Recommendations Central Gov. & regulators: Work with industry to Central Government: Focus on long term support for develop the most appropriate nozzle/pressure standard natural gas vehicle deployment and the associated to meet UK fleet operator needs for CNG, LNG and L- infrastructure will follow growing demand if the correct CNG stations regulatory and legislative arrangements are in place Industry: Develop communication system to notify Gas network operators: allow competition in LTS drivers of technical/economic factors for infrastructure connection to reduce connection costs (e.g. station type, fuel price and maintenance schedules) R&D bodies: Reduce costs for venting prevention / methane capture technologies 1 - e.g. TEN-T funded projects and OLEV £4m fund for future station deployments LTS: Local Transmission System (high pressure gas grid) 38
Innovative approaches such as semi-private stations provide a transition strategy before wider vehicle and station deployment in the 2020s-2030s 5 Depot infrastructure sharing Natural gas refuelling station network A number of fleet operators have deployed semi-private Publically accessible refuelling facilities under cooperative contractual Private or semi-private arrangements allowing pre-agreed operators to share each others facilities Advantages of this approach include maximising station throughput and reducing dependency on public infrastructure rollout Opportunities for further adoption of cooperative station ownership models will enable a transition to significant vehicle uptake when sufficient investor confidence exists for larger public infrastructure deployment Recommendations Central Government: consider counting semi-private stations (where facility is shared between multiple, pre-agreed users) as ‘public’ in the Implementation plan to be submitted to the EC as part of Directive 2014/94/EU1 Key infrastructure operators: Industry: develop commercial arrangements that facilitate further adoption of the cooperative model 1 Clean Power for Transport program – Directive on ‘the deployment of alternative fuels infrastructure’ (October 2014) 39
While further research is needed, measures that minimise the GHG emissions related to distribution and dispensing of gas should be adopted 6 Well-to-Tank (WTT) emissions UK biomethane production potential In keeping with national targets for reducing transport GHG emissions, Graph units: ktpa (TWh shown as reference) emissions relating to logistics and dispensing of gas should be minimised National Grid upper and Current analysis is incomplete and UK non-specific, however some lower bound scenarios for biomethane production 2,624 ktpa emission factors are well understood: − CNG station siting activities should aim to access high pressure grid No Progression Gone Green connection points − LNG / L-CNG station siting activities should aim to optimise delivery 35 TWh 1,048 ktpa logistics and adopt state-of-the-art venting prevention and capture systems 14 TWh Biomethane achieves greater WTT emission savings than natural gas but 49 96 114 114 UK production is limited and incentives in place divert it to applications 2015 2025 2035 other than transport Recommendations National Grid has developed Local Authorities: Consider WTT emission factors in conjunction with several scenarios of biomethane production, in the planning guidance when approving natural gas station installations highest case it’s 35TWh/year Central Government: Future infrastructure strategy should consider UK i.e.
Contents

 − Introduction and context

 − Background and status quo

 − Future refueling infrastructure requirements and
 barriers to deployment

 − Summary roadmap and recommendations

 − Appendix

 41
References

− AEA, Waste and Gaseous Fuels in Transport, 2014
− Atkins, Low Carbon Truck Trial – Executive Summary, 2014
− BP Statistical Energy Review, 2014
− CCC, Pathways to high penetration of EVs, 2013
− DECC, Energy consumption in the UK, 2014
− DfT presentation at NGV day, Low Carbon Truck and Refuelling Infrastructure Demonstration Trial Evaluation, 2014
− DfT, Road lengths in Great Britain, 2013
− DUKES Chapter 3/4/5, 2015
− Element Energy for Birmingham City Council, A City Blue Print for Low Carbon Fuel Refuelling Infrastructure, 2015
− Element Energy for DfT, Ultra low emission van study, 2012
− Element Energy, Options and recommendations to meet the RED transport target, 2014
− Entsog European Natural Gas Network, 2014
− ETI, An affordable transition to sustainable and secure energy for light vehicles in the UK, 2013
− European Parliament and Council, Directive 2009/30/EC, 2009
− Gasvehiclehub.org, 2015
− GLE LNG Investment Database, 2014
− Industry input, including websites of CNG Services, Gasrec and IGEM
− JRC, WTT analysis of future automotive fuels and powertrains in the European context, 2014
− National Grid, Future Energy Scenarios, 2014

 42
Acronyms

AD Anaerobic Digestion LNG Liquefied Natural Gas
AFV Alternative Fuel Vehicle LTS Local Transmission System
CCC Committee on Climate Change Mt Million tonnes
CHP Combined Heat and Power NG National Grid
CNG Compressed Natural Gas NG Natural Gas
COMAH Control of Major Accident Hazard NGV Natural Gas Vehicle
DECC Department of Energy & Climate Change NPPF National Planning Policy Framework
DfT Department for Transport OEM Original Equipment Manufacturer
DNO Distribution Network Operators OLEV Office for Low Emission Vehicles
DUKES Digest of United Kingdom Energy Statistics PM Particulate Matter
EC European Commission R&D Research and Development
EE Element Energy RED Renewable Energy Directive
ETI Energy Technologies Institute TEN-T Trans-European Transport Networks
EU European Union TSB Technology Strategy Board
GBA Gas Bus Alliance TTW Tank-to-Wheel
HGV Heavy Goods Vehicle ULEV Ultra-Low Emissions Vehicle
HSE Health and Safety Executive WTT Well-to-Tank
ICE Internal Combustion Engine WTW Well-to-Wheel
IGEM Institute for Gas Engineers and Managers
ktpa thousands tonnes per annum
LBM Liquid Biomethane
LCN Low Carbon Network
LCNG Liquefied and Compressed Natural Gas
LCT Low Carbon Truck

 43
The modelling of the future UK fleet is based on DfT traffic and park size projections Total UK vehicle stock (million vehicles) Future vehicle projections use figures provided by DfT: +37% 47 − Cars stock to increase from c. 30 41 7 million to 39 million and c. 550 billion 37 vehicle km travelled by 2050 34 5 4 4 35 39 − Vans stock to increase from c. 32 30 3.5million to 7 million by 2050 − HGVs stock to increase from c. 500 2015 2020 2030 2050 thousands today to c. 630 thousand by 2050 Total vehicle km travelled (billion km) − Buses stock and vehicle km travelled +43% to stay broadly constant at around 738 170 thousand units and 5 billion 650 35 5 vehicle km travelled 564 30 5 142 517 5 28 103 Overall fleet and km increase of c. 40% 5 27 82 between 2015 and 2050 72 512 556 449 413 Buses HGVs Vans Cars 2015 2020 2030 2050 Source: DfT Road transport forecasts (available online) as well as direct supply of National Travel 44 Model outputs for the case of cars
The powertrain/fuel uptake scenarios underpinning the Infrastructure Roadmap are policy led Uptake scenarios focus on alternative fuels The scenarios used are not intended to cover all possible outcomes but instead focus on cases with ambitious uptake of alternative fuels Scenarios are policy led, typically based on targets set by the Committee on Climate Change (sources shown next); they are illustrative rather than based on detailed of new modelling technology costs and customer decision making behaviour Therefore the uptake scenarios represent possible futures where low and ultra low emission powertrains are successfully deployed Focus is intended to provide the most interesting inputs for the analysis of the Infrastructure Roadmap – e.g. a ‘business as usual’ case where petrol and diesel continue to provide over 98% of road transport energy would not require new refuelling/recharging infrastructure In accordance with the Fuel Roadmap, blends higher than B7 are not considered for the mainstream fuels and E20 is considered only from the 2030s Scenarios have enabled future infrastructure requirements to be quantified and upfront costs capital costs for public infrastructure have been estimated. Cost of setting new fuel production assets, distribution/logistics costs and general infrastructure operating costs have not been considered. Costs of other incentives that might be required to achieve the uptake scenarios (e.g. vehicle grants) haven not been estimated in this study 45
Overview of the powertrain options considered and key sources Cars and vans Buses HGVs NRMM ICE: petrol, diesel, ICE: diesel, ICE: diesel, ICE: diesel, LPG, POWERTRAINS /FUELS LPG, (gas), (H2 in (bio)methane (bio)methane, (gas), Liquid air for early years) EVs: BEV, PH/RE, (methanol) refrigeration units RELEVANT EVs: Battery EVs, FCEV EVs - in lighter (Batteries and plug-in hybrid EVs, (Liquid air for segments only Fuel Cells – in fuel cell (FCEVs) cooling/hybrid some power) applications) The Carbon Plan Current and Current and Data on fuel usage KEY SOURCES / INDICATORS and the announced announced of NRMM is Committee on commercial commercial sparse Climate Change’s availability, policy availability More qualitative recommendations drivers DfT HGV Task approach H2Mobility Phase Alternative Force suggested 1 report, 2013 Powertrain for TSB-DfT Low Historic trends for Urban buses, 2012 Carbon Truck Trial petrol/diesel split CCC – 4th Carbon CCC – 4th Carbon Budget Review Budget Review Parentheses indicates the powertrain/fuel option is expected to stay niche in the 2050 horizon HGV = Heavy Goods Vehicles, NRMM = Non Road Mobile Machinery 46
Cars and vans are expected to transition to zero emission powertrains for the UK to meet its GHG reduction targets Cars and light commercial vehicles (‘vans’) are treated together as they have the same technology options and fall under the same electrification targets in the Carbon Plan. Sales of vans running on methane are not considered in the modelling on the basis of the low commercial availability (only 2 models on the market), lack of policy drivers for growth and aforementioned electrification targets. Any gas demand resulting from vans would be small enough to be considered negligible, in comparison to the potential gas demand from trucks. Dual fuel vans running on diesel and hydrogen and Range Extender Fuel Cell electric vans (being deployed currently in the UK and in continental Europe) are not modelled explicitly. Instead, their hydrogen demand is accounted for in the ‘FCEV’ heading. The specific requirements for dual fuel and range-extender H2 vans are however considered in the Infrastructure Roadmap (e.g. dispensing pressure). Source: Element Energy 47
We studied infrastructure requirements set by the Committee on Climate Change targets as well as a case with a slower EV uptake Market share of EVs (new sales) Scenarios 100% 100% Moderate ambition Two EV uptake scenarios have CCC targets been used: 60% 30% − ‘CCC targets’: EVs reach 60%
We assumed continuation of the observed petrol /diesel share for cars and modelled an ambitious LPG uptake Sales of new cars with Internal Combustion Engine vehicles - split between spark-ignition (‘petrol’ type) and compression ignition Scenarios engines (‘diesel’ type) We assumed that the current split of Spark-ignition Compression ignition petrol/diesel engines for new cars (50/50) 100% is maintained going forward 54% 49% 50% 50% In line with the Fuels Roadmap, diesel will 63% be B7 (EN590) with an increasing amount 86% of drop-in renewable diesel – i.e. no 37% 46% 51% 50% 50% compatibility issue to be considered for the 14% distribution infrastructure 2000 2005 2010 2012 2013 2020-50 For petrol engines, we will evaluate the PROPOSED amount of: Rise of diesel Stabilisation SCENARIO − Ethanol needed if the E10 becomes the main grade by 2020 and E20 by 2032 Share of spark-ignition cars (ICE and HEV) stock that run on LPG − LPG needed for a case where the rate c. 800,000 units of conversion (or sales if OEM supply 5.0% is put in place) accelerates to reach Decreasing stock c. 112,000 units post-2030 as no new 5% of the petrol car stock (equivalent conversion/sales are to c. 40,000 conversions per year 0.6% until 2030) assumed All new vans are assumed to run on diesel 2013 2030 Sources: Element Energy, SMMT data for 2000-2013 sales, UKLPG for LPG 2013 figures 49
Buses have many powertrain options but overall small fuel use so we used only one scenario, where all technologies see high sales Current UK bus market Scenario UK bus fleet, c. 165,000 vehicles: We ramped up the alternative fuel market share from 2030, in line with the European study1 that suggests that the TCO of battery and FC e-city buses will become 10% 30% comparable and competitive with diesel and CNG buses by Minibus 20301 Double deck bus/coach We assume 90% uptake for Zero Emission Vehicles by 2050 Single deck bus/coach 60% This is lower that the 100% FCEVs assumed in the CCC projections, to reflect the fact that double decker buses (and buses in highly rural areas) might require gas UK low emission buses (all single or double deck, New buses sales scenario: no mini-buses) 5% 15% 100% Hybrid 4% 2% 1,787 10% 5% 15% Micro-hybrid 50% 10% Biomethane 92% 80% 60% 40% 274 Battery EV 10% 0% 127 85 FC EV 2020 2030 2040 2050 18 ‘Diesel’ refers to a blend of B7 and drop-in renewable diesel, FCEV (Bio)methane 2014 as per the Fuels Roadmap BEV Diesel, includes hybrid Source: Element Energy, DfT Statistics Table VEH0601, LowCVP Low Carbon Emission Bus Market Monitoring (Jan 2015), CCC, 4th Carbon budget, 2013 1 - Alternative Powertrain for Urban buses study (2012) 50
For Heavy Goods Vehicles, we tested a high uptake of both electric (battery and fuel cell) and gas trucks Current UK Heavy Goods Vehicle market Scenario UK HGV fleet, c. 460,000 vehicles: We to modelled a High Alternative Fuel Uptake case where both pure electric and gas trucks reach a significant sales levels in their respective markets (light and heavy trucks) 32% 29% FCEVs also capture a large share of the market, as per the > 3.5t to 8t GVW - rigid > 8t to 31t GVW - mostly rigid CCC’s vision of the role of hydrogen >31t GVW - articulated 39% UK low emission trucks - estimates New truck sales scenario: 1% 10% 100% 1% c. 1,000 5% 15% 5% 10% 20% Gas trucks all over 18t GVW, mostly 25% 20% dual fuel (diesel and methane) 94% 79% 40% Electric trucks all under 18t GVW 45% FCEV light trucks at early demo stage 10% 20% 0% 0% 1% 2020 2030 2040 2050 Methane
Non-Road Mobile Machinery typically refuels in private depots/premises but the case of LPG, liquid air and hydrogen were considered UK NRMM fleet for industry, construction and Scenario agriculture, c. 700,000 units in 2014: We to considered (qualitatively, considering the 42% lack of disaggregated data on fuel use) the infrastructure impacts of: − A transition to Liquid Air for HGV refrigeration units 17% − An increase in LPG, battery and hydrogen use 10% for forklifts 7% 23% Beyond the blending of renewable drop-in diesel in diesel, options for cleaner fuels are: Agricultural tractors (Limited options, possibly (bio)methane or high blend biodiesel) Portable generator sets (Could transition to LPG, Battery and Fuel Cell packs for some uses) Other off-roads (LPG, limited alternative fuel options) Refrigeration units on HGVs LPG, could transition to Liquid Air Forklifts Use of LPG (already used by c. 30% of forklifts ) and batteries could increase, could transition to hydrogen Other off-roads: Telescopic Handlers, Backhoe Loaders, Excavators, Cranes, Bulldozers, Compressors etc. Source: Element Energy analysis based, on DfT statistics requested in Jan 2015 and Non-Road Mobile Machinery Usage, Life and Correction Factors AEA for Dt (2004) , industry input for LPG use in forklift 52
You can also read