Infrastructure Strategy 2018-48 - Porirua City Council
←
→
Page content transcription
If your browser does not render page correctly, please read the page content below
Infrastructure
Strategy 2018–48
Foreword
   This is Porirua City Council’s second Infrastructure   expenditure in the 3 waters to renew ageing
   Strategy. It deals with the current and future         pipelines, provide more capacity to treat
   requirements of water supply, stormwater and           wastewater and to remove stormwater from
   wastewater disposal, roading networks, parks,          areas that experience regular flooding.
   property and solid waste services.
                                                          As we do this work we’ll also ensure that our
   These services cost a lot to install and to keep       network is more resilient to natural hazard
   running and they are a challenge for our city          events.
   because many are ageing and their capacity
                                                          As we work through the next few years of
   hasn’t consistently kept pace with our city
                                                          this large programme of work and begin
   growth.
                                                          thinking about the next Long-term Plan and
   This strategy will make sure we fix legacy issues      Infrastructure Strategy, we’ll also be refining our
   so we have sound infrastructure in the future          understanding of climate change effects on our
   that we can rely on.                                   infrastructure.

   To do this we’ve continued our investment              Mike Tana
   in these services and significantly increased          Mayor of Porirua City

Infrastructure Strategy 2018
Contents
Major projects and city milestones timeline    4

Part One: Infrastructure Strategy Overview     6

Executive summary                              6

Introduction                                   6

The national context                           8

The Porirua context                            8

The Porirua story                             10

Our people                                    10

Major issues                                  11

Assumptions                                   13

Part Two: Our Infrastructure Services         16

Network Infrastructure                        16

   Water                                      16

   Wastewater                                 21

   Stormwater                                 25

   Roading                                    28

Community infrastructure                      30

   Property                                   30

   Solid Waste                                33

   Parks                                      34

Part Three: Financial summaries               36

Water                                         37

Wastewater                                    38

Stormwater                                    39

Roading                                       40

Solid Waste                                   41

Parks                                         42

Property                                      43

                                                   3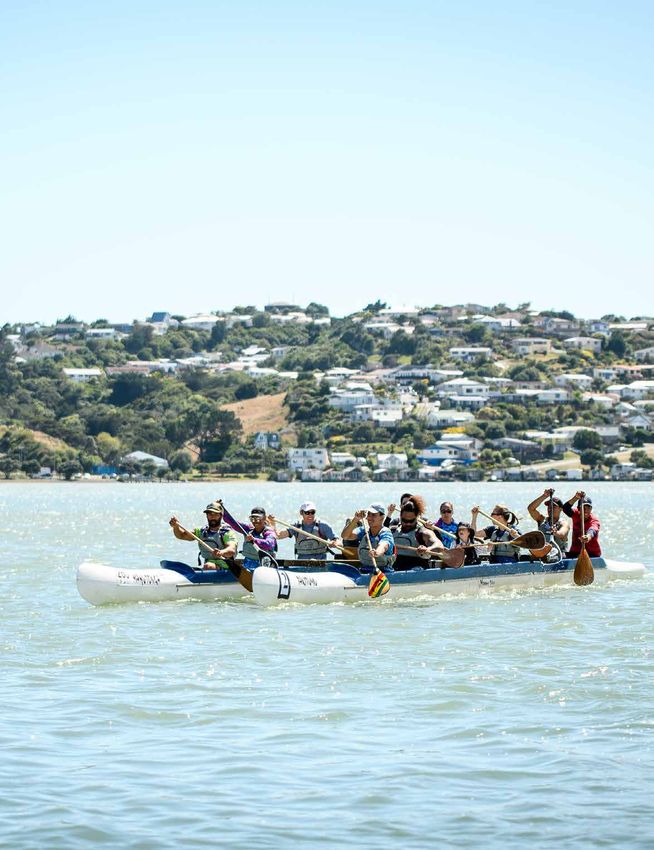
Major projects and city milestones timeline
                   2018                                    2023                             2028                                   2033                               2038                            2043                               2048
             Year         1       2      3      4      5          6   7      8      9     10      11      12       13       14    15    16      17    18     19      20    21     22   23    24     25    26     27     28     29    30

                               $2.2m           Whitby Reservoir                                                     $5m            Low-level Zone Reservoir Stage 2

       Water                          $15.9m         Low-level Zone Reservoir Stage 1

                                                                                                                                             $28.9m        Water Pipeline Renewals

                                                                                                  $19.7m                                                                               Local Network Improvements

    Wastewater                                                                                            $27.4m                                                                                    Trunk Network Improvement Plan

                          $7.6m        Treatment Plant Upgrades                                                                           $34.5m                          Treatment Plant Upgrade

                                                                                          $23.8m                                                                          CBD Flooding Improvement
    Stormwater
                                       $5.1m                  CBD Wetlands                                         $5.7m               Upper Prosser Street Pipe Upgrade

                          $7.2m        Tg-Watangirua–Whitby New Road Connection

                          $1.1m                              $1.1m                 New Cycleways
      Roading
                     $2.2m Whitford Brown/Papakowhai Intersection Upgrade
                                                                                          Te Pene Ave/Titahi Bay Road
                                                                      $1.63m              Intersection Upgrades
                                                                                        Porirua Stream
                               $1.1m           Pāuatahanui Pathway                       Naturalisation      $3m
        Parks
                                       $1.1m                 Aotea Lagoon Stormwater                                              $1.8m       New Artifical Turf

                          $5.3m        Administration Building Upgrade
      Property
                                                                                                 Eastern Porirua
                                                                                 $8m             Revitalisation

                                                      Milestone           WMMP Becomes Operative                        Milestone         Landfill Consent Renewal
     Solid waste                                                                                        New Cell
                                               $3.2m New Cell                                   $11.5m (Phase 3)                                                                   $2.6m    New Cell (Phase 4)
                                                     (Phase 2)

                                                                          Northern Growth Area Development
       Major                  Kenepuru Landing                                    Churton Park/Lincolnshire Farms
    developments
                                                     Aotea
                                                                                                 Population
                                                              SH1/58 Revocation                  reaches 60,000                                                                              Average temperatures 10C higher than 1995
    City & region
                                       Porirua Adventure Park opens                                                              Petone To Grenada Link Roads (Wellington City)
     milestones
                                                                                                        New District Plan
                                        New District Plan Operative                                     Operative                                                                                                New District Plan Operative

             Year                       GW Natural Resources Plan Operative

                          1       2      3      4      5          6   7      8      9     10      11      12       13       14    15    16      17    18     19      20    21     22   23    24     25    26     27     28     29    30

                   2018                                    2023                             2028                                   2033                               2038                            2043                               2048

4       Infrastructure Strategy 2018                                                                                                                                                                                                            5
Part One: Infrastructure
    Strategy Overview
    Executive summary
    Porirua City Council provides the community with services that require large networks
    of physical infrastructure. This Infrastructure Strategy sets out the work we need to do
    to keep all our infrastructure services running now and in the future.

       The main focus of the 30 year programme is to keep providing good quality services
       where we are currently meeting our targets, and to fix legacy problems in areas where we
       currently fail to provide services to adequate standards. As we replace and upgrade assets
       we will also take the opportunity to invest in new capacity in our networks for future growth.

    Introduction
    The strategy aims to ensure that our infrastructure services are provided to an appropriate
    standard. This means making sure that we are meeting the Levels of Service that we have
    to provide; in some activities this means fixing inadequate asset performance before we
    can look too much further ahead to increasing service quality. There is some provision for
    new infrastructure in this strategy, however on balance this is expected to cost significantly
    less than renewing and improving assets.

    The Infrastructure Strategy is one of the components of the Long-term Plan. It says what we
    are going to do to provide our services, to manage our assets to ensure we can continue to
    grow as a city, provide good quality services, look after the environment, overcome issues and
    challenges, and how much this will cost. It has a close relationship with the Financial Strategy
    which determines how much work we can afford to do, when it can be done, and where the
    funding will come from.

                                     Long-term Plan

                                                                                                     Local
     Financial Issues                                                                             Government
                                                                                                      Act
     • Affordability          Financial          Infrastructure
     • Financial              Strategy              Strategy           Service Issues
       Sustainablity                                                                              District Plan
                                                                       and Responses
     • Funding sources
                                                                       • Growth
     • Balancing the
       budget                                       Asset              • Demand                     Regional
                                                 Management            • Level of Service            Natural
                                                    Plans              • Ageing assets              Resources
                                                                                                      Plan

    Long-term Plan document relationships. Note that the District Plan is currently also being reviewed.

6        Infrastructure Strategy 2018
The most fundamental drivers and greatest            major issues and assumptions that inform
influencing factors in this strategy are:            the underlying asset management plans.

•   Recognition that it is becoming harder to        The asset management plans are the tactical
    meet today’s expected levels of service          response to the issues and challenges identified
    in each activity while at the same time          in Part One.
    preparing for the future. For this reason the
                                                     Part Two summarises the management and
    great majority of our total programme of
                                                     works programmes in our asset management
    expenditure is focussed on renewing and
                                                     plans. It’s important to note that rather than
    upgrading assets.
                                                     being programmes “set in stone”, these are
•   Ensuring that as we replace assets we are        the most likely future scenarios we can predict
    taking the opportunity to allow for future       given today’s information and assumptions.
    additional demand as well. This means that
                                                     Part Three summarises the long term
    each renewal programme contains an extra
                                                     expenditure forecast.
    allowance to size up assets as opposed to
    exact like for like replacement.                 The Infrastructure Strategy was prepared with
                                                     asset managers responsible for each activity,
•   Recognition that because of our
                                                     and has been reviewed by consultant Robyn
    affordability constraints we will not be able
                                                     McCulloch and Associates.
    to achieve everything we want to achieve
    as quickly as we’d like. For this reason we
    have needed to stagger some of our asset          Infrastructure Strategy
    renewal and upgrade programmes over a                    PART ONE
    long period of time.                                Our story, approach,
                                                        context, major issues,
                                                            assumptions               • Levels of Service
Infrastructure Strategy Structure Approach                                            • Demand
The strategy’s planning horizon is 30 years. It                                       • Asset condition
                                                           AMPs 2018-21                 and performance
covers all activities which rely on significant
                                                        The tactical response         • Risk
investment in physical assets to provide service.           to the issues             • Lifecycle
These are:                                                                              Management
•   Water                                                                             • Expenditure
                                                      Infrastructure Strategy           forecasts
•   Wastewater
                                                             PART TWO
•   Stormwater                                            Summary of AMP
                                                         tactical responses,
•   Roading
                                                           major projects
•   Solid Waste
•   Property
                                                      Infrastructure Strategy
•   Parks & Reserves                                        PART THREE
                                                        Expenditure forecasts
The combined asset portfolio has a
replacement value of about $1.1 billion.
                                                          Long-term Plan
The strategy is written in three parts. Part One
is our infrastructure story providing the context,   Infrastructure Strategy structure.

                                                                                                            7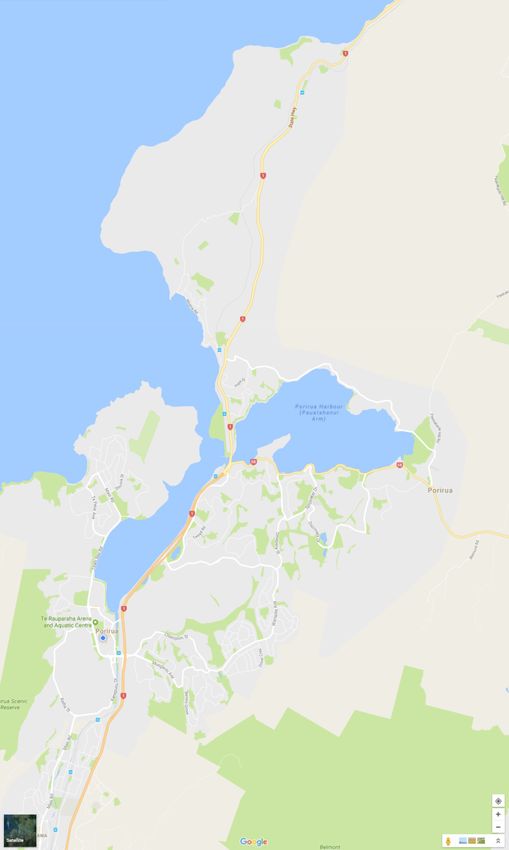
The national context                               The Porirua context
    Over the last few years there has been             Our vision for Porirua is: Porirua – a great place
    increasing debate at a national level about        to live, work and raise a family. To achieve this
    local government provision of key infrastructure   vision we have four strategic priorities.
    services, quality of those services, and
    affordability for the cities and communities
    they service. There is increasing focus and
    debate about how sustainably these services
    can be provided by Territorial Authorities going
    forward, especially in the face of continued
    population growth, climate change and
    the greater need for resilience of these core
    infrastructure services.

    While a number of central government
    initiatives have been launched recently in         A growing prosperous and regionally
    ‘high growth’ parts of New Zealand, some           connected city
    fear that these initiatives to assist some         Our city is growing. We expect that in the
    local authorities manage their infrastructure      next 30 years there will be about 67,600
    provision are ad-hoc workarounds which lack        people living here. This is a modest but steady
    cohesion, are not sustainable in the long term,    increase on the 55,600 people here today. The
    cause confusion and conflict with other central    completion of Transmission Gully Motorway
    government policy directives which impact          in the near future will provide an important
    local government. In fact there has been an        growth opportunity in the city. We need to
    increasing call from many quarters for a ‘first    position the city to take full advantage of it,
    principles review’ as to how infrastructure        and make sure that the city has room to grow
    services are funded and provided across New        and stay connected to the region. While the
    Zealand into the future. Cost of infrastructure    District Plan is the key tool for ensuring that
    is one of the biggest issues facing communities    there is enough affordable land to develop, it’s
    currently.                                         important that we provide sufficient water and
                                                       roading services to support development.
    Across New Zealand many councils are
    struggling with the same issues faced by           We see new development as imperative for
    Porirua City; that is, maintenance of current      the city, but we need to be mindful that simply
    service levels, renewal of ageing and at times     paying for what we already have is a challenge
    failing assets, future proofing for anticipated    in itself. We’ve taken an approach of “growth
    growth while managing rates and debt impact.       paying for growth”; and plan to fund as much
                                                       growth as we can through Development
                                                       Contributions.

8       Infrastructure Strategy 2018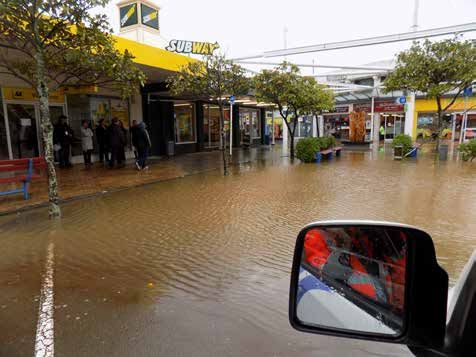
important to ensure a sustainable quality
                                                     of life for future generations.

                                                     Access to safe drinking water, a safe harbour
                                                     to swim in and access to great recreational
                                                     and cultural facilities should be part of
                                                     young people’s lives, enhancing their health,
                                                     education and wellbeing.

A great village and city experience
To achieve this priority we need to ensure that
our city’s infrastructure is resilient and fit for
purpose. A lot of our infrastructure services
support the lifestyle and experience we enjoy
in our local village centres and wider city
environment. Network infrastructure ensures
that very basic public health and economic
support is provided. Community infrastructure
                                                     A healthy and protected harbour
such as sport fields, museums, libraries and         and catchment
community halls enhances the amenity of our
                                                     Our history of development and growth has had
communities and provides places to socialise,
                                                     an effect on our environment and the harbour
preserve our heritage, and celebrate our
                                                     especially. We must improve the management
cultures.
                                                     of our infrastructure services. This involves
Through the Long-term Plan and District Plan         mitigating the environmental affects and in the
we are examining how we can influence the            long term striving to improve our harbour and
regeneration of Porirua East to improve social       catchment.
and economic opportunities there.
                                                     Along with collaborative processes like the Te
                                                     Awarua-o-Porirua Committee and regulatory
                                                     functions we can provide through the District
                                                     Plan, we have through the Harbour Strategy,
                                                     committed to infrastructure projects to
                                                     prevent some of the damage caused by our
                                                     asset activities, especially stormwater and
                                                     wastewater disposal.

                                                     These four priorities all have some dependence
                                                     on good quality infrastructure, but growth and
                                                     prosperity, a great village and city experience,
Children and young people at the heart               and a healthy and protected harbour and
of our city
                                                     catchment are especially dependant on the
Porirua has a young population, and sound            best infrastructure services we can provide.
investment in infrastructure and planning is

                                                                                                        9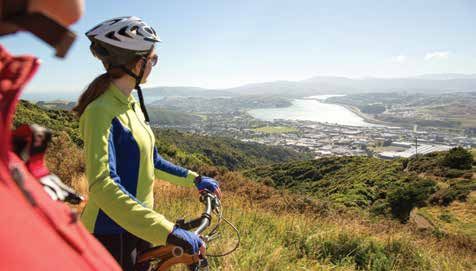
The Porirua story                                   We also expect growth in Porirua North (the
                                                         “Northern Growth Area”) and in Kenepuru.
     The settlement of modern Porirua had its
     beginnings in the 15th century. Ngāti Tara,         Our challenge is to balance our need to fix
     Ngāti Ira and later Ngāti Toa established           the infrastructure legacy issues, to grow and
     their settlements alongside the harbour and         prosper, and to provide affordable and good
     coastline.                                          quality services for people now and tomorrow.

     Modern day Porirua grew from relatively small
                                                         Our people
     European villages of the early 1900s modern
     Porirua has grown quickly. State housing            The population of Porirua City in 2018 is
     grew rapidly in Porirua East through the            approximately 55,600 people. We are the 17th
     1950s, along with the early water and roading       largest council in New Zealand, and the 4th
     infrastructure to support it. By the 1980s new      largest in the lower North Island. We expect
     areas of land along the inner harbour coast         our population to rise to about 67,600 over the
     had been created, the Kenepuru Stream had           next 30 years.
     been realigned, and the early city centre had
                                                         The following demographic factors influence
     become embedded into the city landscape.
                                                         our core and community infrastructure.
     Our city will continue to grow for decades
                                                         Age structure
     ahead, so it’s important to make sure that
     controls are in place to minimise further           Porirua has a very young population. 23% of
     damage to the harbour. The strategy is aimed        our people are under 15, making Porirua the
     at making sure there is no further decline in the   6th youngest population in the country1. By
     state of the harbour.                               contrast Kāpiti Coast to the north has one of
                                                         the oldest populations in New Zealand.
     A large portion of the infrastructure networks
                                                         Household density
     that provide clean water, easily accessible
     transport systems, and remove and treat             Porirua has a diverse range of family structures,
     wastewater were built quickly some decades          from sole parents to couples with children,
     ago. We must now begin replacing large parts        and extended families with grandparents
     of these networks to be able to make sure we        and cousins. Of note is the number of large
     can keep providing our services today and in        households where extended families and
     the future.                                         families with three or more children live.
                                                         Porirua has the highest household density in
     New infrastructure needs to be built in our         New Zealand2 at 3.04 people per household,
     growth areas. This is especially true of network    followed by Auckland City and Selwyn District.
     infrastructure such as water and roading. Some      Household density is likely to reduce as the
     of our large projects are targeted at the faster    population ages.
     growing areas. For example we’re planning new
     water reservoirs in the Aotea and Elsdon areas,     Having both a young population and larger
     and a new park in Whitby. We will also ask          households than the national average are
     the community about the regeneration of the         key considerations we need to factor into this
     eastern part of the city.                           strategy and the Long-term Plan. These

     1 2018 estimate.
     2 2013 census.

10        Infrastructure Strategy 2018
considerations will impact on two important       today’s demand. Growth - both historical and
factors in this strategy.                         future growth - are a primary driver behind
                                                  some large works programmes in stormwater.
1. Demand for services
                                                  We are working to resolve past growth issues,
Demand means the rate at which our                and water and roading we’re investing to
infrastructure services are consumed or used.     prepare for future growth.
For example, how much water is consumed,
how many people are using our parks, and          Ageing assets
how many vehicles are on the road. The major      All assets eventually reach an age where the
factor influencing demand is the size of our      maintenance cost becomes greater than the
population. Demand determines the rate at         cost of replacing them. When this happens
which our service capacity is used up, which      the asset is uneconomic to operate. Some
in turn drives the rate at which our assets are   materials have been used that aren’t lasting
wearing out.                                      as well as the engineers of the day predicted.
                                                  Asbestos Cement pipe is an example of this.
2. Affordability of services
                                                  Ageing assets and the need to maintain a
70% of our operating cash income, the money       significant renewal programme across almost
we need to provide services like water, roading   all asset groups, is a primary driver behind the
and parks, comes from rates. We have about        large renewal programmes, especially in water
18,300 rate-paying properties; however similar    and wastewater services.
sized populations typically have more. This
means we have fewer ratepayers for the same       The state of Te Awarua-o-Porirua Harbour
scale of service as for example Kāpiti, Selwyn,   The health of the harbour is the one indicator
Nelson and Napier which each have between         above all others that reveals the impact of
22,000 and 24,000 rate-paying properties.         development on our wider city environment
This means that each ratepayer has to pay a       over the last 50-60 years. The harbour has
bigger share than if we had more ratepaying       been in poor health for some time. A range
properties overall.                               of actions are planned to reduce on-going
                                                  contamination including a wetland system
Major issues                                      in Elsdon to remove contaminants from the
                                                  discharge going into the harbour, District
There are significant and emerging issues which   Plan requirements for water sensitive urban
will make it hard to balance our infrastructure   design in new developments, and wastewater
services while meeting our strategic priorities   system improvements to prevent overflows of
and regulatory requirements. Part Two             wastewater.
“Infrastructure Services” goes into more
detail on each activity and outlines the asset    Community affordability
management responses to these issues.             The comparatively small number of rate-
                                                  paying properties and lack of other significant
Capacity
                                                  income means we struggle to achieve our
Some of our service networks were built with      priorities while living within our means. This
little regard for the future expansion of the     means that although we’re expected to meet
city. It will be a challenge to support future    the challenges of growth, resilience and ageing
growth while some of our networks – especially    assets, we need to do this alongside keeping
stormwater and roading – are struggling with      rates affordable.

                                                                                                     11
Depreciation Climate change
The accounting standard we use states our
3
Climate change is not in itself a natural hazard
operating expenses must pay for the annual but is a collection of climate effects that will
rate at which our assets lose value. This loss is worsen existing weather hazards over time.
commonly called depreciation. The frequency and magnitude of adverse
weather related events in the Wellington region
One of Council’s financial prudence
will increase over time. Warmer temperatures,
benchmarks4 is to balance our level of capital
heavier rainfall, higher winds, prolonged
expenditure with the level of depreciation
periods of drought and rising seas will have
expense being charged to the ratepayer. A
some impact over the next ten years, and will
good balance means capital expenditure is
continue to heighten into the future. This will
equal to or higher than our depreciation. A
affect infrastructure capacity in most areas and
comparison of depreciation against capital
increase physical vulnerability near the coast or
expenditure from 2010 to 2016 shows that
in areas prone to flooding.
we have yet to achieve this balance. We will
continue to invest in our ageing infrastructure We are aware of the impacts of such swings
and to include operating losses in our rates with and extremes in weather conditions. For
the aim of balancing the budget by 2022/23. example we can see how each storm event
that occurs sets in motion a chain of unforeseen
The Financial Strategy is the strategy that
costs from the initial cost of closing roads or
tests the affordability of the programmes in the
evacuating property, through to sudden spikes
Infrastructure Strategy as they are developed.
in landfill volumes as clean-up operations
Natural hazards progress.
The city is exposed to natural hazards, At this time we have not planned ahead for
especially earthquakes, landslides, flooding and any works where the primary driver is climate
coastal erosion. We need to make sure that change. We are going to prepare a Climate
our infrastructure can withstand some adverse Change Strategy that will guide our decision
events; if it can’t then we need to be able to making over the next 30 years and beyond,
recover or rebuild quickly. and guide what our physical response will be.
Our responses to natural hazards are generally District Plan
limited to the way in which we design new
The District Plan is being reviewed and is
or replacement assets. We are intending
expected to be fully operative by 2021. It’s
to have District Plan provisions which will
likely to enable more areas for residential
control the location and type of development
development, and these new zones will
to protect future generations from known
determine where future infrastructure will be
natural hazards. In terms of physical works we
built. The rate at which we think newly zoned
are planning upgrades to water reservoirs to
land might be developed is still being worked
strengthen the security of our water storage.
out. The District Plan could also influence
the way we live; for example there could be
more people living in apartments or terraced
housing.
3 Generally Accepted Accounting Standard as required by Local Goverment Act 2002 Section 100.
4 Local Government Financial Prudence Regulations.
12 Infrastructure Strategy 2018Natural Resources Plan Assumptions
GWRC is preparing a new Natural Resources
Our forecasting assumptions underpin the
Plan (NRP) which should be operative by
Long-term Plan 2018-38, our Infrastructure
2021. There is heavy emphasis in the NRP on
Strategy and other supporting documents.
protecting the environment and the receiving
These assumptions bring a degree of
waters (the harbour and coast). The cost of this
uncertainty into our planning.
protection may mean that there are tougher
rules and conditions. This will mean tougher Data accuracy
resource consent conditions for the landfill, All the programmes, projects and actions in
wastewater treatment plant and stormwater this strategy are based on data about our
discharges. Until the NRP is completed and assets, especially their quantities, size and
operational its hard to know what the cost condition. It’s difficult to keep completely
impact will be. accurate and up to date information on the
We need to respond to these issues, but we also tens of thousands of assets that make up all
need to recognise our budget limitations. This the infrastructure networks as many are below
means balancing cost against levels of service ground and can’t be seen. So we’ve had to
targets and how we achieve our strategic make some assumptions on what we know
priorities. about our assets.
Summary We use a grading system developed by Water
NZ and now commonly applied across the
Capacity and ageing assets are the primary
infrastructure sector to assess how good our
drivers behind the works programme and their
asset data is.
cost estimates. Most of the programmed works
are about putting right what we know about
now and, to some extent, making reactive
investment. Put another way, we need to first
make sure that we are prepared for the future
before we try to influence it. This also means
making sure we can meet our current levels
of service and not try to increase them.
In the case of some performance targets,
for example water supply resilience, we won’t
be able to achieve everything we want to
as quickly as we might like to.
Grade Description
A Highly reliable Sound records, procedures, investigations and analysis which is properly
documented and recognised as the best method of assessment.
B Reliable Sound records with minor shortcomings, for example data is old, documentation is
missing and reliance is placed on unconfirmed reports or some extrapolation.
C Uncertain Data based on records which are incomplete or unsupported, or extrapolation from
a limited sample for which grade A or B data is available.
D Very uncertain Data is based on unconfirmed verbal reports and/or cursory inspection and analysis
13Our confidence rating for our asset data for each service is tabled below. The actual asset
condition is stated for each asset group in Part Two of the Infrastructure Strategy.
Quantity Condition Risk
& Valuation & Performance
Water A C Low
Wastewater A/B B/C Low
Stormwater A C Low/Medium
Roading A A/B Low
Solid Waste B C Medium
Parks & Reserves B/C B/C Low/Medium
Property C C Medium
Asset lifecycle
We have made some assumptions about how long our assets will last. These expected asset
lives guide our decisions on when to renew asset to prevent them from falling into a state
of impairment that affects their performance. These lives also guide the calculation of the
depreciation (loss of value) of the assets over time. The tables below are the expected lives
of core infrastructure components and their current replacement cost for the assets owned
by Porirua City Council5.
Water Life Replacement Cost Wastewater Life Replacement Cost
(years) ($millions) (years) ($millions)
Pipes 40-100 77.4 Pipes 50-120 157.2
Valves 20-60 16.1 Manholes 100 38.4
Hydrants
Valves 40 0.3
Meters
Tobies Pump Station 90 20.2
structure
Pump 60-90 1.4
Stations Pumps 25 9.4
Reservoirs 60-90 30.5 Treatment 18-90 56.4
Plant
Stormwater
Pipes 50-125 122.4 Roading
Manhole 100 30.9 Basecourse 40-100 140.2
Sumps 75 0.1 Top Surface 14-18 16.2
Valves 20-60 0.3 Footpaths 60-80 42.6
Drainage 80 11.5
Signs 15 1.6
Street lights 5-30 12.9
Bridges/large 70-100 23.7
culverts
5 Excludes the Porirua Drainage Authority assets part owned by Porirua City Council.
14 Infrastructure Strategy 2018Population and growth
Population and growth and the associated increase of houses are the most fundamental drivers
of future service demand. The following population and household forecasts have been used to
prepare our asset management plans, Development Contributions Policy and this Infrastructure
Strategy.
Porirua City Forecast year
2013 2018 2023 2028 2033 2038 2043
Population 53,700 55,687 59,435 60,504 62,300 64,019 65,664
Change in population - 1,986 3,748 1,070 1,796 1,719 1,645
Average annual change - 0.73% 1.31% 0.36% 0.59% 0.55% 0.51%
Households 17,247 18,311 19,802 20,479 21,384 22,230 22,954
Average household size 3.07 3.00 2.96 2.91 2.87 2.84 2.82
Population in non private 709 709 779 819 869 919 919
dwellings
Dwellings 18,104 19,153 20,702 21,407 22,348 23,217 23,951
Dwelling occupancy rate 95.27 95.60 95.65 95.66 95.69 95.75 95.84
Service provision
Expectations in the quality of services will change over time. These changes may be driven by
environmental regulation such as GWRC’s Proposed Natural Resources Plan or new National
Environmental Standards. Other service changes may be community driven, for example
demand for better quality community assets. We will also seek to add value to our services
by changes that may be cost effective to increase reliability, aesthetic value, and flexibility
of function.
15Part Two: Our Infrastructure
Services
Network Infrastructure
Water Asset summary
Our water network is made up of storage and
Responsibilities
distribution. Our storage for daily consumption
Our responsibilities in providing a water supply and fire-fighting is provided by 16 reservoirs
are to: that pressure the system by gravity. The water
is distributed through 328 km of pipeline
• ensure there is enough safe water for
from the reservoirs to each property. The full
industrial, commercial and residential use
replacement cost of the assets is $125 million.
• ensure there is enough water for firefighting. The book value is $62 million. In the context
of Council’s Significance and Engagement
Porirua City doesn’t extract or treat raw water. Policy 2018 these assets in their entirety are
The Council Controlled Organisation Wellington considered significant.
Water is responsible for extracting and
24% of the network is in poor condition due
treating water for Greater Wellington Regional
to the high proportion of old asbestos cement
Council from three sources; the Hutt River,
pipe which has not lasted as well as had been
the combined flow of the Wainuiomata and
predicted when it was laid. While this material
Orongorongo rivers and the Waiwhetu Aquifer.
is safe in underground pipes it’s nearing the
Wellington Water also delivers the treated
end of its expected life, and this affects the
water to local reservoirs owned by Council, and
networks condition and performance.
from there it’s sent to each property through
the underground pipe network. Some of our reservoirs are big enough to supply
drinking water but don’t hold enough back up
water for firefighting or emergencies, or won’t
be able to supply enough water in the future.
Nearly all our reservoirs are at risk of critical
damage in a large earthquake. For example if
there is a large rupture of the Ohariu fault, the
city could be without clean water up to four
weeks after the event and without adequate
storage for much longer.
16 Infrastructure Strategy 2018The table below shows the capacity (how is and % Capacity Design means how much of
much water each reservoir can hold) and the reservoir is being used. Under 100% means
Performance Class (seismic strength) of each the reservoir is putting all its water through
reservoir today. Grade A means the reservoir too quickly to be able to hold the amount we
exceeds current minimum design standards require for emergency supply or fire-fighting.
and is likely to remain in service following a For example a reservoir running at 80% that
7.5 magnitude earthquake, Grade D means became cut off from the Wellington Water
the reservoir is likely to lose water during the supply would run out of water too fast to
same earthquake and be unable to provide provide any emergency supply.
storage. Capacity means how big the reservoir
Reservoir Name Capacity (m3) % Capacity Design Performance Class
Ascot Park 2230 75% D
Bradey 720 48% A
Broken Hill 1600 127% D
Gloaming Hill 1100 127% D
James Cook Drive 1500 91% D
Kahu Road (Paremata No2) 4500 157% D
Mercury Way 139 157% D
Paremata Low Level No1 450 105% D
Pikarere Street 714 136% D
Plimmerton No1 (Pope Street) 1100 54% D
Plimmerton No2 (The Track) 1550 94% D
Porirua East High Level 4500 115% D
Porirua Low Level No1 2300 127% D
Porirua Low Level No2 4500 127% D
Pukerua Bay 2300 188% D
Tuna Terrace 110 62% D
17Water Issues, Responses and Major Projects
Issue Response and Project Cost Options Risk
($millions)
& Timing
Our water reservoirs Porirua Low Level Zone $20.9 from Provide Medium/high risk. There
are struggling Reservoirs – this is to Year 1 to 6 less is large new development
to keep up with provide additional and storage proposed in this water
demand now (and capacity and resilience. Year 12 to 14 supply zone in the next five
this will become years. This will make the
worse in the short whole zone short of drinking
term in some supply and fire-fighting
areas). For most supply.
reservoirs the risk No Medium/high risk. We’d be
of critical damage additional unable to service the scale
in an earthquake is service of development about to
unacceptable. happen.
Whitby Reservoir – to $2.05 from Use Medium. cheaper to begin
provide sufficient Year 1 to 3 pressure with, but require electricity
pressure and storage booster so in the event of a power
for new development in pumps (no cut most of this new area
Whitby (about 340 new additional would be without water.
properties). storage) The area is too low on water
storage for fire-fighting
already.
No Medium. New properties
additional on higher ground in this
service development can’t proceed.
Poor condition Water Pipeline Upgrades $28.9 from Reduce Medium risk. Pipelines in
network means – this is a long term series Year 1 to 30 the rate poor condition will leak and
high leakage of projects to replace of renewal waste water resource and
rates and lack of parts of the network that money. We’ll eventually be
ability to precisely are or will be beyond their spending too much money
measure network expected life. We will also fixing pipes that need to be
losses. be continually assessing replaced.
Due to deferred pipe condition to be sure Do not High to extreme. Almost all
asset renewals that the right pipes are renew aspects of our city rely on
there are assets being replaced at the pipelines clean water for everything
being held in right time. from business needs to
service past their basic public health. Without
life expectancy large scale replacement
and with unknown the risk will progress from
consequence medium through high to
extreme in the medium to
long term.
Extra pressure No specific capital projects – We are gradually increasing the level at which we fund
on rates funding depreciation to achieve a prudent balance between levels of funding and renewal
of non-funded expenditure.
depreciation
The map on the following page shows the pipe network and its condition. Note that pipes
coloured blue have not had a condition rating attached to them. However most of these are in
newer areas and would be assumed to be in either excellent or good condition.
18 Infrastructure Strategy 2018Water Pipeline Condition
Key Condition Pukerua Bay
Excellent
Good
Fair
Poor
Water Pipeline by Condition
Very Poor
Very Poor
12%
Excellent
Poor 41%
13%
Fair
14%
Plimmerton
Good
20%
Mana
Titahi Bay
Pauatahanui
Elsdon Waitangirua
Cannons Creek
Map of Water Network by Pipe Condition
1920 Infrastructure Strategy 2018
Wastewater                                                         53% of the network is in poor condition. As the
                                                                   pipes age the joints between them can open
Responsibilities                                                   up, and the pipes themselves can crack. This
Our key responsibility is to protect our                           is a problem for our network which has a large
community from negative effects of human                           amount of old brittle pipe material in it. As this
and industrial wastewater.                                         pipe ages ground water gets into the system
Asset summary                                                      and starts to overload it. We also have too
                                                                   much rainwater getting in from places like roof
The Wastewater Treatment Plant is jointly
                                                                   guttering on houses and ponding around gully
owned by Porirua City Council and Wellington
                                                                   traps.
City Council. About 32% of all wastewater we
treat comes from Wellington City and the rest                      These failures mean that when it rains, the
from Porirua. There are 414 km of pipe network                     amount of wastewater we have to pump to the
collecting wastewater from 18,788 properties.                      treatment plant and then clean-up is 3.5 times
The network and treatment plant assets have                        more than in dry weather. This results in more
a replacement cost of $191.5 million, and a                        chemicals and electricity being needed in the
book value of $99 million6. Council also owns                      treatment process. Some of the heavy rainfall
a 72.4% share of the assets owned by the                           wastewater doesn’t even get to the treatment
Porirua Drainage Authority. This is an additional                  plant, but spills out of the system along the
asset value of $65.5 million replacement cost                      way, polluting the land and harbour. We also
and $44.6 million book value. In the context                       experience occasional dry weather overflows from
of Council’s Significance and Engagement                           system failures like pump station breakdowns.
Policy 2018 these assets in their entirety are
considered significant.

6 Total of Porirua City Council and Porirua Drainage Authority asset valutation at Dec 2015.

                                                                                                                        21
The graph below shows the age of the pipe network with the total length of pipeline in each 5
year band. For comparison with Water and Stormwater networks these networks are also shown.
The map on the following page shows the condition of the pipe network is in by colouring each
pipe according to its condition grade (1, green = excellent condition and 5, pink = very poor
condition).
Pipeline Age by Length (km’s)
Key Stormwater Wastewater Water
90.0
80.0
70.0
60.0
50.0
Km’s
40.0
30.0
200
10.0
0
-5
10
5
0
5
0
5
0
5
0
5
0
5
0
5
0
-4
-3
-5
-6
-2
-7
-1
-7
-2
-3
-5
-6
-8
-4
5-
0
10
70
30
20
65
50
60
15
25
40
45
55
75
35
Age (years)
The graph and the map both show that an gone by our New Zealand experience has
estimated 40% of pipe network is at the end of proven otherwise. Asbestos cement cracks with
or beyond its expected life. ground movement, the joints between each
pipe don’t last, and it’s prone to eroding when
In some instances it’s ok to have assets in
it’s exposed to corrosive elements that you’d
service beyond their expected life, for example
find in large volumes of wastewater.
very large concrete stormwater structures can
still perform acceptably beyond their standard We believe that based on this information
80-100 year life. much of our wastewater network is either very
near or past its serviceable life. The system will
A very large portion of our wastewater network
keep spilling sewerage into the harbour and
was built in 1950s and 1960s when the
onto land unless we commit to a large scale
predominant material was asbestos cement. At
long-term programme of replacing the pipes
the time this was thought to be a dependable
and upgrading the pump stations.
long lasting material. As the decades have
22 Infrastructure Strategy 2018Wastewater Pipeline Condition
Key Condition Pukerua Bay
Excellent
Good
Fair
Poor
Very Poor
Wastewater Pipeline by Condition
Excellent
Very
29%
Poor
40%
Plimmerton
Good
10%
Fair
Poor 8%
Mana 13%
Titahi Bay Pauatahanui
Elsdon Waitangirua
Cannons Creek
Map of Wastewater Network by Pipe Condition
23Wastewater Issues, Responses and Major Projects
Issue Project Cost Options Risk
($millions)
& Timing
Ageing poor condition Trunk and $46.9 from Reduce Medium/High – the
network means increased local pipelines Year 1 to 24 the rate programme driver is the
infiltration rates and loss replacement – this is of pipeline rate of overflows, public
of pipe capacity. continual renewal of replacement health risk, high cost of
Also deferred asset the pipelines in the unnecessary treatment.
renewals mean there are system over a series Increase No risk – accelerating the
assets being “sweated”; of annual projects. the rate programme will meet levels
ie held in service past Continually assess of pipeline of service faster but may
their life expectancy pipe condition and not be affordable.
and with unknown replace the right
consequence. pipes at the right Do not Extreme – continued
time. This means replace overflows will breach
programmed pipes regulations and create a
camera inspections position of unacceptable
and inspections environmental, reputational
when pipes are and legal risk.
excavated.
No treatment plant Treatment Plant $7.6 from Defer Medium risk – overflows
redundancy complicates upgrades to increase Year 1 to 2, upgrades may continue at the current
future renewals and the throughput in and $34.5 rate.
additions of the treatment the plant. from Don’t do High to extreme –
plant. Year 13-20 the eventually we will be unable
Impact of future upgrades to contain the levels of
development on existing wastewater coming into
treatment plant capacity. the plant for treatment and
may need to start spilling
untreated wastewater into
the coastal environment.
Extra pressure on rates No specific capital response - We are gradually increasing the level at which we
funding of non-funded fund depreciation to a point where we have a prudent balance levels of funding
depreciation. renewal expenditure.
24 Infrastructure Strategy 2018Stormwater Contamination
Rain washes silt and contaminants into the
Responsibilities
stormwater pipes and from there into the
Council owns the stormwater pipe network that harbour.
takes rainwater away from built up areas and
discharges it to the harbour and places along This is one of the key reasons for the poor
the coastline. state of the harbour’s health today. Significant
improvement in stormwater infrastructure,
Our main responsibilities are: land-use practice and control of discharges to
• To prevent the flooding of habitable the stormwater system is needed to support
buildings and reduce property damage in our strategic priority of a healthy harbour and
rain events. catchment.
• To ensure that stormwater is managed and
removed in a manner that protects our built
environment and to keep it functioning.
Asset summary
There is 275 km of pipeline in the stormwater
network. The network has a total replacement
cost of $152 million and a book value of $96
million. In the context of Council’s Significance
and Engagement Policy 2018 these assets in
their entirety are considered significant.
The pipes are in good condition overall but we
have two serious performance issues.
Capacity
As more property comes online the amount
of stormwater running into pipes increases.
Some stormwater pipes, especially in the
CBD, aren’t big enough to carry away the
stormwater we get today. While recognising
that some overland flow is a built-in feature of
the stormwater system, we are still not properly
protecting roads and private property, so we
Flooding outside Tom Ryan’s general store near
struggle to meet our two key responsibilities.
Station Road in the 1930s above, and Cobham Court
We expect that climate changes will mean in 2016. The city has grown and the stormwater
that the size and number of rain storms will system is still under a lot of pressure.
increase and the situation becomes worse.
We may eventually find that we need to
pump stormwater if sea levels rise higher than
existing outfalls.
25Stormwater Pipeline Condition
Key Condition Pukerua Bay
Excellent
Good
Fair
Poor
Very Poor
Good
36%
Fair
10%
Poor
4%
Very
Poor
1%
Plimmerton Excellent
49%
Mana
Titahi Bay Pauatahanui
Elsdon Waitangirua
Cannons Creek
Map of Stormwater Network by Pipe Condition
26 Infrastructure Strategy 2018Stormwater Issues, Responses and Major Projects
Issue Response and Project Cost ($millions) Options Risk
& Timing
Capacity limitations CBD Stormwater $41.4 from Accelerate the Low risk. May not be
in existing networks Upgrade – a series of Year 1 to 30 programme affordable.
due to lower projects to eliminate Delay the Medium to high
historical design flooding in the CBD. programme risk. The further we
standards, especially delay this upgrade,
in the CDB. the more that the
CBD is put at risk
of unacceptable
damage.
Wider network Don’t do the High to extreme risk.
upgrades programme Without adequate
protection,
and especially
considering the
expected long term
sea level rise, the
CBD may eventually
become unusable.
CBD Wetlands – a new $5.5 Year 1 to 5 Accelerate the Low risk. May be
wetlands in the Titahi programme unaffordable.
Bay Rd area to clean, Delay the Medium risk. This
retain and control programme project is a key
stormwater runoff into action in trying to
the harbour improve the state of
the harbour.
Don’t do the Medium to high risk.
programme Stormwater will still
drain away but the
harbour will continue
to be contaminated.
Historical impact No specific capital response – Provisions for water sensitive urban design (WSUD) will
of greenfield be considered through the District Plan review process.
development
activity on silt and
sedimentation levels.
Extra pressure on No specific capital response - We are gradually increasing the level at which we fund
rates funding of non- depreciation to a point where we have a prudent balance levels of funding renewal
funded depreciation. expenditure.
27Roading The network is mainly urban with only a very
small amount of unsealed surface. Like most
Responsibilities other assets the majority of the road network
Our main responsibilities are to: was built between the 1950s to the 1970s.
• Provide safe convenient and accessible A key feature of how we manage our roads
transport between the villages and is that we categorise them into groups of
throughout the city. similar use, maintenance and service standard.
The New Zealand Transport Agency (NZTA)
• Enable Porirua to be well connected and
is developing a new categorisation method
people and goods to move throughout the
called the One Network Road Classification
city safely and efficiently.
(ONRC), which will mean every road in the
• Provide safe and easy access to great places country is categorised and maintained in
and activities for recreation and sport, exactly the same way. The effect of this for
business and employment. Porirua is unknown at this time, however we’ve
been managing our road maintenance by very
• Maintain quality open spaces as provided by similar principles to the ONRC and we don’t
the road network. expect there to be any significant change
once the ONRC is fully developed. This full
Asset summary
development will be complete by the next
The network has a total replacement cost LTP (2021).
of $306.2 million and a book value of $201.1
million. In the context of Council’s Significance We’ve made a major effort in the last few years
and Engagement Policy 2018 these assets in to catch-up on our road condition. With the
their entirety are considered significant. exception of a few very localised issues our
road network is in a reasonably good state. The
Length by Urban Rural Total graphs below show that overall the road and
surface type (km) (km) (km)
footpath network is generally in an excellent
Thin Surfaced 210.904 42.997 253.901
Flexible
to fair condition. Most of the large capital
expenditure we forecast is not related to assets
Concrete 0.219 0 0.219
in poor condition but related to our capacity
Asphaltic 69.4 0 0
Concrete issues and ensuring as the traffic patterns
Footpath 339 339
change over time we are not adding to some of
our severe congestion points but alleviating them.
28 Infrastructure Strategy 2018Footpath Condition by Percentage of Network Road Surface Condition by Percentage of Network
Poor Very Poor
2% Poor 3%
Excellent
6% 2%
Fair
10%
Good
Good 11%
31% Fair
61% Excellent
74%
Roading Issues, Responses and Major Projects
Issue Response Cost ($millions) Options Risk
& Project & Timing
Significant future changes in traffic A programme of $8.4 from Defer individual Low risk
volumes, distribution and transport 10 intersection Year 1 to 20 upgrades
modes. upgrades including
intersections on
Whitford-Brown,
Papakowhai,
Eskdale, Routeburn
and Okowai.
Transmission Gully Motorway will Remove Medium
impact by increasing traffic entering intersections risk
the city from the west and possibly from the list
increasing total volumes overall as an
indirect effect.
We also expect greatly increased New Cycleways $2.17 from Defer or remove Low risk
traffic associated with the Kenepuru and Walkways Year 1 to 8 walkways and
Landing development. cycleways from
Onepoto to Wineera $3.0 from the programme
shared pathway Year 1 to 2
Due to deferred asset renewals The last Long-term Plan allowed greater funding to catch-up on
there are assets being held in service road maintenance. This programme is still running. We expect the
past their life expectancy and with backlog of maintenance to be cleared within the first 2-3 years of
unknown consequence. this Long-term Plan 2018-38
Extra pressure on rates funding of No specific capital project – We are gradually increasing the level
non-funded depreciation. at which we fund depreciation to a point where we have a prudent
balance between the levels of funding and renewal expenditure.
Uncertainty around Transmission Gully No specific capital project – Ongoing discussion with NZTA to
Motorway tolling and potential impact work out the details of how Transmission Gully Motorway will be
on local traffic, and the nature and operated. We have dedicated staff resource, supported by existing
effect of the potential revocation of staff, to guide us through the revocation process.
the existing State Highways 1 and 58.
29Community infrastructure
Property of the design, functionality or capacity. This
information will be collected in the near future
Responsibilities and is likely to result in some change to the
Our main responsibility is to provide buildings forecast works programme.
and property for operational, social and
community activities. Our works programming method targets
buildings which are of high importance and
Asset summary low condition first.
The total replacement cost of all our buildings
is $130 million. In the context of Council’s Building Condition by Value
Significance and Engagement Policy 2018 only
Poor
the Moana Court housing units are considered 2%
significant.
Fair
The graph to the right shows the condition 14%
of the overall portfolio by building value. The
buildings represented in the graph are only
Good
the critical and very important buildings like Excellent
28% 56%
the Administration Building, Te Rauparaha
Arena and Pātaka. These condition ratings are
based on a visual inspection and don’t include
assessment of the state of structure, plant or
machinery, nor does it assess the suitability
Category Examples Replacement cost
($millions)
Community Centres Mungavin Hall, Tireti Hall $6.3
Educational and Cultural Facilities Pātaka, Whitby Library $24.6
Housing Whenua Tapu Sextons house, Moana Court $2.6
Investment Property 4 Lydney Place, 71 Kenepuru Drive $15.0
Operating Property Administration Building, Prosser Street Depot $20.4
Parks Facilities Te Rauparaha Arena, Plimmerton Domain $47.5
Pavilion
Public Toilets Grays Road Toilet Block, Dolly Varden, $8.7
Cobham Court
Strategic Property 21 Bay Drive, Titahi Bay $0.8
Utilities Wastewater Treatment Plant, $4.6
Pump Station structures
30 Infrastructure Strategy 2018Property Issues, Responses and Major Projects
Issue Response & Project Cost ($millions) Options Risk
& Timing
Lack of good Consultation will occur about $8 Year 7-10 Delay the Low risk if deferred
quality community how to best support the project
space in the city revitalisation of Porirua East. Don’t Lack of commitment
in general, lack Early conversations have been do the to the project could
of good amenity around better social and project have a damaging
to appropriately community space to support flow on effect for our
support our vision this part of the city, developed determination to
for community in partnership with central improve and grow
regeneration in government and other social a part of the city
Eastern Porirua. agency partners. in a poor state. It
may also result in a
state of inequality in
the way our library
services are provided
throughout the city.
Poor asset and In Year 1 (2018/19) we will add to our building survey work with inspection of the more
condition data complicated plant and machinery and electrical systems to improve our knowledge of
and not enough our property.
demand/usage We will also be improving our return of information from public building users to find
information. out which buildings are at full capacity and which might not be needed anymore.
Poor or no rationale In Year 1 (2018-19) we will review our property portfolio to make sure that each property
for ownership of we own has a sound purpose and is providing the benefit the community wants. We
assets. are planning to hold back all but essential maintenance until this is done to make sure
we’re not spending money on property that we might decide to dispose of.
Some dated The forward works programme includes some upgrade projects to bring some
building design properties, especially publically used facilities, up to a modern standard.
limiting function,
accessibility and
use.
Due to deferred We have produced a long term works programme at a very high level of detail to make
asset renewals sure that the right money is being spent at the right time on the right priority.
there are assets
being “sweated”;
ie held in service
past their life
expectancy and
with unknown
consequence.
Extra pressure We are gradually increasing the level at which we fund depreciation until we can reach
on rates funding a point where we have a prudent balance between the funding level and level of
of non-funded renewal expenditure.
depreciation.
Some buildings The forward works programme includes seismic strengthening in our affected buildings.
have low New
Building Standard
ratings scores.
3132 Infrastructure Strategy 2018
Solid Waste
Responsibilities
Our main responsibilities are to:

•   Enable adequate and affordable rubbish collection and disposal (eg to a landfill)

•   Protect the harbour and catchment

•   Keep the city clean.

Asset summary
We have limited information on the physical components that make the landfill work.

In the context of Council’s Significance and Engagement Policy 2018 these assets are not
considered significant.

An important driver behind a lot of the considerations in the solid waste activity is the Regional
Waste Management and Minimisation Plan (WMMP). Outcomes from the actions in the WMMP
will determine a range of variables such as recycling rates, future tonnage and ultimately income.

Asset Group                           Current Cost         Average Remaining Life            Assumed Condition
                                        ($millions)                       (years)            (1 = Good, 5 = Poor)
Civil Works and Improvements                 $15.28                          25.8                                2
Land                                           $1.16                           NA                              NA

Solid Waste Issues, Responses and Major Projects

Issue                  Response             Cost ($millions)      Options    Risk
                       & Project            & Timing
Landfill is steadily   New cell (Phase 2)   $3.2 from                        Medium to high – each of these
filling up.                                 Year 3-4                         new cells have been timed and
                                                                             estimated based on the rates of
                       New cell (Phase 3)   $11.5 from            Do not     tonnage predicted in the Asset
                                            Year 8-9              build      Management Plan.
                                                                             If we don’t proceed with these
                       New cell (Phase 4)   $2.6 in the                      projects the Spicer landfill will run
                                            third decade                     out of room by 2022 based on
                                                                             our current fill rate assumptions.
                                                                             This will require users to go
                                                                             elsewhere in the region and have
                                                                             significant effect on our cash
                                                                             flow.
Regionally low         The WMMP contains an action to investigate further what the heart of the issue is.
recycling rates
compared to
national average.
Landfill consent       During the period 2020 to 2025 we need to consider a number of options prior to
expiring 2030.         deciding exactly what is to be consented. These options including maintaining the
                       status quo, converting the service to a cleanfill only, or discontinuing the service
                       altogether. Each option will have a different bearing on what the nature of the new
                       consent will be.

                                                                                                                     33
Parks & Reserves
Responsibilities
Our main responsibilities are to:
• Provide open spaces that are healthy, well-maintained, connected and enjoyed
• Provide safe and easy access to great places and activities for recreation and sport.
This service provides a wide range of assets for a variety of different users.
Asset summary
The portfolio involves large quantities of land. It’s classified by reserve type summarised
in the table below. In the context of Council’s Significance and Engagement Policy 2018, reserves
assets are considered significant.
Book value of Parks Assets ($million) Improvements Land Total
$000 $000 $000
Outdoor Recreation and Open Spaces 9.54 61.66 71.21
Sports Fields and Courts 4.47 33.67 38.14
Total 14.01 95.33 109.35
Reserve type Local Historic Recreation Scenic Not
Purpose Reserve Reserve Reserve classified
Total Area (ha) 107.95 1.47 404.25 364.44 116.28
The parks and reserves we own include assets such as playground equipment and sport field
facilities like lighting, artificial turf and fencing. Buildings like changing rooms and pavilions are
included with the Property portfolio.
34 Infrastructure Strategy 2018You can also read