2018 Fashion Industry Benchmarking Study - Dr. Sheng Lu United States Fashion Industry Association - United States Fashion ...
←
→
Page content transcription
If your browser does not render page correctly, please read the page content below
2018 Fashion Industry Benchmarking Study

                         By

                  Dr. Sheng Lu

                Associate Professor
       Department of Fashion & Apparel Studies
              University of Delaware

              in collaboration with the

  United States Fashion Industry Association

                      July 2018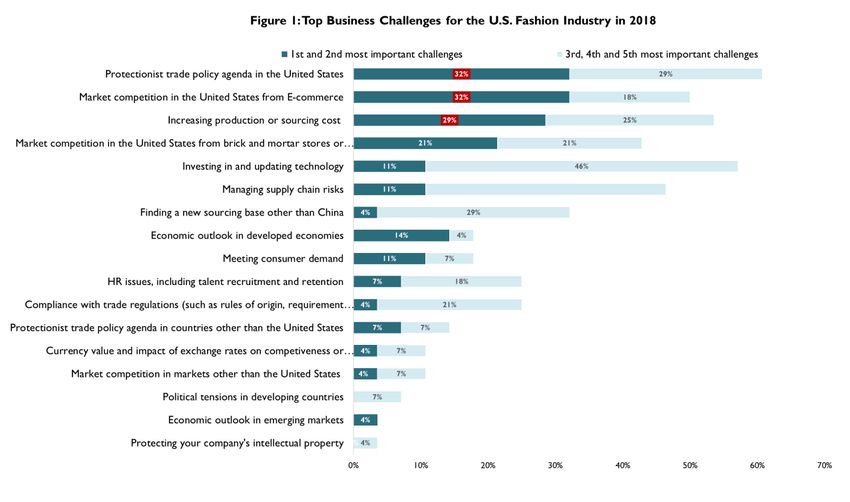
When we launched the USFIA Fashion Industry Benchmarking Study in 2014, we were hoping to help
members gain insights into their peers’ sourcing practices and views on trade—information that
companies have always kept close to the vest (no pun intended).

Now, five years later, the study is recognized by global fashion brands and retailers, policymakers, and
press around the world as one of the most important sources of data on trade and sourcing patterns
and the industry outlook. Cited by the Congressional Research Service and the World Bank, the report
enjoys a year-round media cycle as U.S. and international reporters are constantly looking for insights
into the industry’s trading practices, and how we can expect policy to impact companies doing
business across the globe.

And, as we release the fifth-annual study, this data is more important than ever.

At the same time companies were answering the surveys in April-May 2018, we were waiting to see
whether the Trump Administration would launch a trade war—and keeping a close watch on our
smartphones, since the announcement was more likely to come via Twitter than executive order.

And as we release the study, it appears the trade war (or should I say trade wars) could be here, with
the United States and several key trading partners—including, and especially, China, the industry’s
top-ranked supplier of textiles and apparel—trading jabs and new, punitive tariffs on a variety of
products, including some fashion and home products. What’s next? Let’s just say “uncertainty” is one
of the most popular words for brands and retailers right now.

This report allows us to see quite clearly how this “trade war” could impact fashion companies,
especially in terms of their sourcing practices. And we get to see just how trade policy—or at least, the
rhetoric about trade policy—has a direct impact on business. For the second year in a row,
respondents say the protectionist trade policy agenda in the United States is their #1 concern—up
from a ranking for #8-#11 between 2014-2016. Even the threat of a trade war is impacting business,
as the pressure of rising costs is returning this year as a problem (with 54 percent of respondents
rating this among their top five challenges this year, up from 34 percent last year). As you’ll see in the
following pages, it’s clear this cost pressure is directly tied to fears about the impact of tariffs and trade
wars.

But, all is not bleak. Our respondents are actually more optimistic about the five-year industry outlook.
For the first time, 100 percent say they plan to hire more employees in the next five years, too. (But,
newsflash: these new employees won’t be working in manufacturing, but in other types of jobs across
the global value chain.)

I’d like to thank Dr. Sheng Lu, Associate Professor in the University of Delaware’s Department of
Fashion & Apparel Studies, for his hard work to crunch the data and draw these important
conclusions. And I’d especially like to thank our respondents for sharing their views and their insights
about sourcing, sustainability and trade policy in this study. We hope you find value in this report.

With best regards,

Julia K. Hughes
President
United States Fashion Industry Association (USFIA)
Executive Summary
Overall, respondents are more confident about the five-year outlook for the U.S. fashion
industry in 2018 than they were a year ago, although confidence has not fully recovered to the
level seen in 2015 and 2016.
Reflecting companies’ improved confidence in the industry outlook, for the first time since we
began conducting the benchmarking study in 2014, 100 percent of respondents say they plan to
hire more employees in the next five years, compared with 80-85 percent in previous studies.
Protectionism is the top challenge for the U.S. fashion industry in 2018. More companies worry
about increases in production or sourcing cost, too.
For the second year in a row, “protectionist trade policy agenda in the United States” ranks the top
challenge for U.S. fashion companies in 2018.
The pressure of “increasing production or sourcing cost” is returning this year. As many as 54
percent of respondents rate the issue among their top five business challenges in 2018, a notable
increase from only 34 percent last year.
When it comes to sourcing, diversification is key for many companies.
Most respondents continue to maintain a diverse sourcing base, with 60.7 percent currently
sourcing from 10+ different countries or regions, up from 57.6 percent in 2017.
Larger companies, in general, continue to be more diversified than smaller companies.
Reflecting the U.S. fashion industry’s growing global reach, respondents report sourcing from as
many as 51 countries or regions in 2018, the same as in 2017. Asia as a whole continues to take
the lead as the dominant sourcing region. Meanwhile, with the growing importance of speed-to-
market and flexibility, the Western Hemisphere is becoming an indispensable sourcing base.
Keeping a relatively diverse sourcing base will remain a key element of U.S. fashion companies’
sourcing strategy. Nearly 80 percent of respondents plan to source from the same number of
countries, or more countries, in the next two years. However, respondents are equally divided on
whether to increase or decrease the number of suppliers they will work with.
About 46 percent of respondents source from the United States in 2018 (ranked #10), down from
70 percent in 2017. As an apparel sourcing base, the United States enjoys the competitive
advantage in “speed to market” and “low risk of compliance,” but cost is a notable disadvantage.
The most popular sourcing strategy remains “China plus Vietnam plus Many.” But more
companies plan to further diversify their production in response to the changing business and
trade policy environment, especially with regards to China.
“China plus Vietnam plus Many” has become an ever more popular sourcing model among
respondents. And this model is evolving as companies further diversify their China production. In
particular, China now typically accounts for only 11-30 percent of companies’ total sourcing value
or volume, compared with 30-50 percent in the past.
Although China’s position as the top sourcing destination is unshakable, companies are actively
seeking alternatives to “Made in China.” This does not seem to be due to concerns about cost, but
rather the worries about the escalating U.S.-China trade tensions.
Benefiting from the diversification away from China, Vietnam and Bangladesh are expected to play
a bigger role as apparel suppliers for the U.S. market in the near future.
Page 1 of 36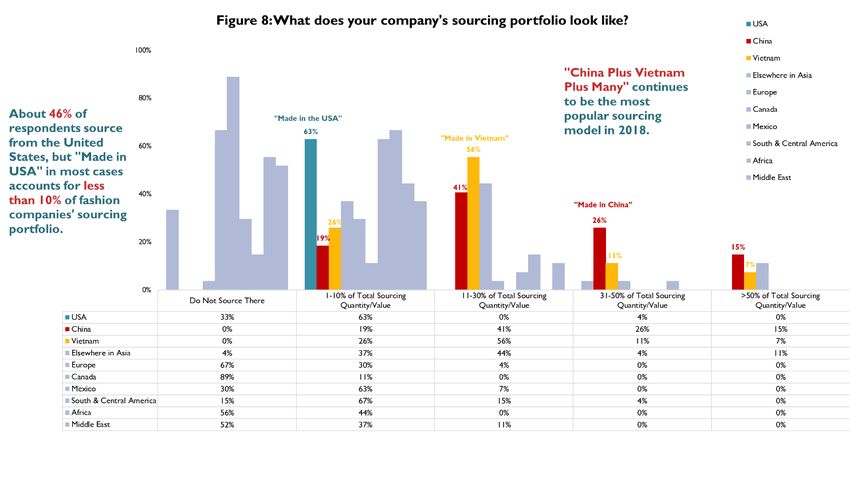
As the fashion industry becomes more globalized and fast-paced, companies’ sourcing
decisions are increasingly about striking a balance.
Three criteria —“speed to market,” “sourcing cost,” and “risk of compliance”—have the most
significant impacts on companies’ sourcing decisions.
While no sourcing destination is perfect, Vietnam, China, Mexico, and members of the Dominican
Republic-Central America Free Trade Agreement (CAFTA-DR) overall are regarded as the most
balanced sourcing bases, giving them competitive advantages as preferred sourcing destinations.
Rules of origin, and exceptions to the rules of origin, significantly impact whether companies
use free trade agreements (FTAs) and trade preference programs for sourcing.
While FTAs and trade preference programs remain largely underutilized by U.S. fashion
companies, more companies are using NAFTA (65 percent), CAFTA-DR (58 percent) and AGOA (50
percent) than in the past two years.
Still, it’s concerning that companies often do not claim the duty-free benefits when sourcing from
countries with FTAs or preference programs. Companies say this is primarily due to the strict
rules of origin.
Exceptions to the “yarn-forward” rules of origin, including tariff preference levels (TPLs),
commercial availability/short supply lists, and cumulation, are priorities for respondents; 48
percent say they currently use these mechanisms for sourcing. These exceptions provide critical
flexibilities that make companies more likely to use FTAs and source from FTA regions.
U.S. fashion companies call for further reduction of trade barriers and urge trade negotiators
to “do no harm” to NAFTA, the most-utilized free trade agreement by respondents.
Respondents predominantly support initiatives to eliminate trade barriers of all kinds, from high
tariffs, to overcomplicated documentation requirements, to restrictive rules of origin in NAFTA
and future free trade agreements.
More than half of respondents explicitly say NAFTA is important to their business—and they have
grave concerns about the uncertain future of the agreement.
Overall, U.S. fashion companies are making more commitments to sustainability and social
responsibility.
85 percent of respondents plan to allocate more resources for sustainability and social compliance
in the next two years, in areas including providing training to suppliers and internal employees,
adding more employees, and working more closely with third-party certification programs on
sustainability and social compliance. However, the availability of operational budget remains the
primary hurdle for companies that want to do more.
100 percent of respondents map their supply chains (i.e., keep records of name, location, and
function of suppliers), up from 90 percent in 2017. Over 80 percent of respondents track not only
Tier 1 suppliers (i.e., factory where the final product is assembled), but also Tier 2 suppliers (i.e.,
subcontractors or major component suppliers, such as fabrics). However, it’s less common for
companies to map Tier 3 (i.e., yarn spinners, finding and trimming suppliers) and Tier 4 suppliers
(i.e., raw materials suppliers, such as cattle/pig hides, rubber, cotton, wool, goose down,
minerals/metals and chemicals).
100 percent of respondents audit their suppliers for issues including building safety, fire safety,
and treatment of workers. The vast majority of respondents (96 percent) currently use third-party
certification programs to audit, with both announced and unannounced audits.
Page 2 of 36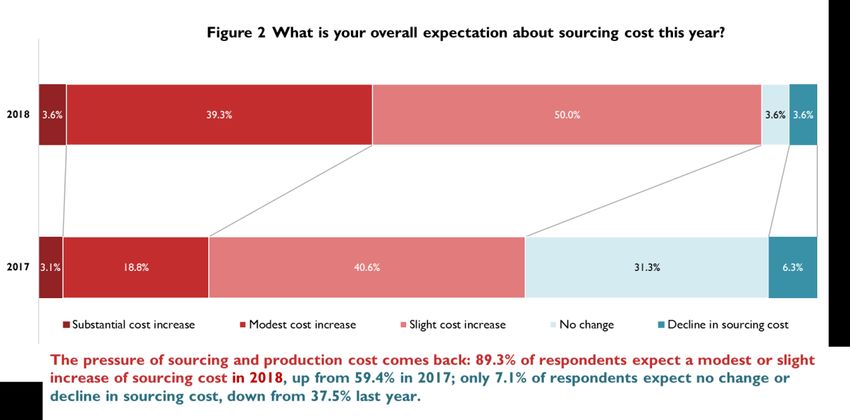
Automation technology could change the future landscape of apparel sourcing.
Respondents say automation in apparel manufacturing will bring positive changes to the existing
apparel supply chain, ranging from shorter lead time, to higher productivity, to labor cost savings.
Respondents believe automation technology may somewhat encourage reshoring, but the majority
do not think it will bring back apparel manufacturing to the United States in a significant way.
Some respondents expressed concerns about the potential negative social and economic impacts
of automation technology, such as job loss in the apparel-manufacturing sector.
Page 3 of 36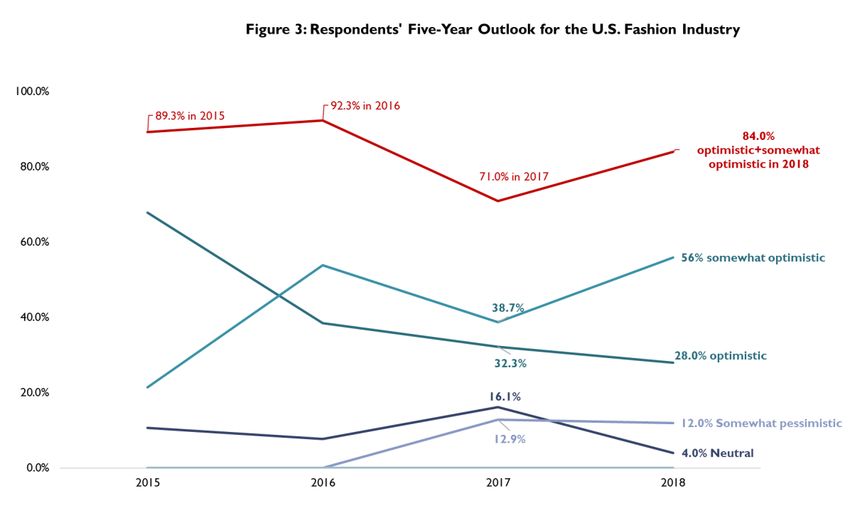
I. Business Environment in the U.S. Fashion Industry

Top Business Challenges in 2018

Table 1: Top Business Challenges for the U.S. Fashion Industry: Rank in 2018 vs. 2017
Top Business Challenges for the U.S. Fashion Industry in 2018                                                               Rank in 2017        Rank in 2018 vs in 2017
#1 Protectionist trade policy agenda in the United States                                                                            1                 No major change
#2 Market competition in the United States from E-commerce                                                                           2                 No major change
#3 Increasing production or sourcing cost                                                                                            7              Much more important
#4 Market competition in the United States from brick and mortar stores or conventional peer competitors                             3                 No major change
#5 Investing in and updating technology                                                                                              4                 No major change
#6 Managing supply chain risks                                                                                                       5                 No major change
#7 Finding a new sourcing base other than China                                                                                     13              Much more important
#8 Economic outlook in developed economies                                                                                           8                 No major change
#9 Meeting consumer demand                                                                                                           6                   Less important
#10 HR issues, including talent recruitment and retention                                                                            9                 No major change
#11 Compliance with trade regulations (such as rules of origin, requirement for restricted substances and labeling)                  9                   Less important
#12 Protectionist trade policy agenda in countries other than the United States                                                     15                   Less important
#13 Currency value and impact of exchange rates on competiveness or profitability                                                   11                 No major change
#14 Market competition in markets other than the United States                                                                      13                 No major change
#15 Political tensions in developing countries                                                                                      16                 No major change
#16 Economic outlook in emerging markets                                                                                            12                Much less important
#16 Protecting your company's intellectual property*                                                                                 /                          /
#18 Political tensions in developing countries                                                                                      16                 No major change
Note: Total score for each business issue is calculated based on weighted average as follows: 1 st importance =5 points, 2 nd importance =4 points, 3 rd importance=3 points, 4 th
This challenge option is newly added to the 2018 survey

Every year, we ask respondents to select the top five challenges for their businesses and rank these
issues in order of importance. As shown in Figure 1 and Table 1, while the results this year are highly
consistent with what we found last year, two important trends are worth highlighting in 2018:

                                                                             Page 4 of 36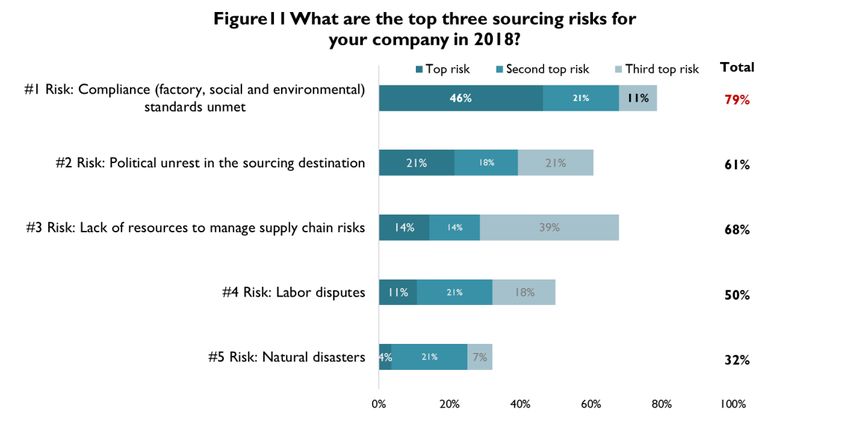
First, for the second year in a row, “protectionist trade policy agenda in the United States” is
the top challenge for U.S. fashion companies in 2018. More than 60 percent of respondents rank
the issue among their top five business challenges this year, far exceeding concerns about other
issues on the list. Notably, more than one-third of respondents regard the protectionist U.S. trade
policy agenda as either their #1 or #2 challenge this year, even higher than 23 percent in 2017.

Companies’ growing concerns about the direction of U.S. trade policy under the Trump
Administration are understandable. Since January 1, 2018, President Trump has issued at least six
presidential proclamations imposing punitive tariffs on steel and aluminum exports from several
important U.S. allies. In response, the European Union, Canada and Mexico have retaliated against
U.S. products, including some apparel and home textiles. Similarly, based on the results of the
investigation of China’s IP practices under Section 301 of the Trade Act of 1974, the Trump
Administration has announced it will levy additional tariffs of 10% to 25% on hundreds of billions of
U.S. imports from China.1 Additionally, in his tweets and public remarks, President Trump constantly
threatens to rip up the 24-year old North American Free Trade Agreement (NAFTA) between the
United States, Canada, and Mexico, an important sourcing destination for the industry. As this report
is released, the first tranche of retaliation against China went into effect, with an immediate reaction
by China to increase their duties on U.S. exports, including cotton.2 While it is too early to know
whether this will be a “trade war” or a temporary skirmish, U.S. fashion brands and retailers are
justifiably concerned.

It is important to note that between 2014 and 2016, protectionism in U.S. trade policy consistently
was a medium-ranked business challenge (ranked 8th to 11th) among survey respondents. However,
the high tensions between the United States and its major trading partners, combined with
the tremendous market uncertainties caused by the Trump Administration’s protectionist
trade agenda, mean concerns about trade protectionism could become a “new normal” for the
U.S. fashion industry.

1
  Lu, S. (2018). Timeline – Trump’s track record on trade. Just-Style. Retrieved from https://www.just-
style.com/analysis/timeline-trumps-track-record-on-trade_id133211.aspx
2
  U.S.-China Business Council (2018). List of Chinese retaliatory tariffs on the United States. Retrieved from
https://www.uschina.org/sites/default/files/list_of_chinese_retaliatory_tariffs_on_the_united_states_-
_june_15_2018.pdf
                                                     Page 5 of 36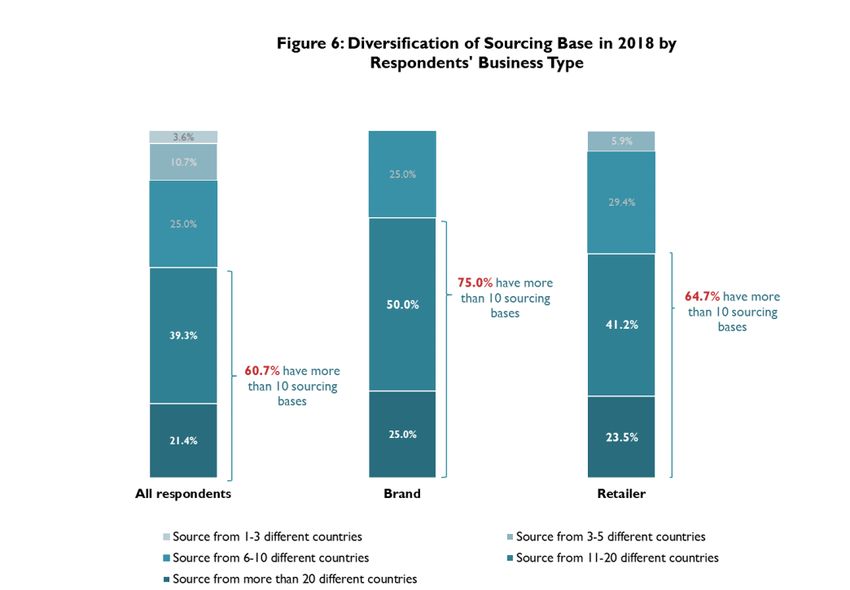
Second, the pressure of “increasing production or sourcing cost” is returning this year. As
many as 54 percent of respondents rate the issue among their top five business challenges in 2018, a
notable increase from only 34 percent last year (Figure 1).

There are two possible explanations. On the one hand, production or sourcing cost could be
rising in absolute terms this year. For example, as shown in Figure 2, close to 90 percent of
respondents expect their production or sourcing cost to increase in 2018, far more than 60 percent
last year; meanwhile, only 7.1 percent of respondents expect no change or decline in sourcing cost in
2018, substantially fewer than 37.5 percent last year. On the other hand, the intensified trade
tensions caused by the protectionist U.S. trade policy agenda may force companies to switch to
more expensive sourcing destinations. Notably, “finding a new sourcing base other than China”
moved up from the 13th challenge last year to the 7th challenge in 2018. Interestingly, statistics from
the U.S. Department of Commerce Office of Textiles and Apparel (OTEXA) show that the unit price of
U.S. apparel imports from China actually dropped by 1.6 percent between January and April 2018,
compared with a 1.7 percent increase for products from rest of the world over the same period. 3
Thus, the worry about a looming U.S.-China trade war is more likely to be the key driver behind
respondents’ eagerness to find China’s alternative than cost considerations.

Additionally, several business challenges identified in the previous benchmarking studies continue to
be major concerns for respondents in 2018, including “market competition in the United States
from e-commerce” (#2 in 2017 and 2018), “market competition in the United States from brick
and mortar stores and other conventional peer competitors” (#4 in 2018 and #3 in 2017),
“investing in and updating technologies” (#5 in 2018 and #4 in 2017), and “managing supply
chain risks” (#6 in 2018 and #5 in 2017).

Industry Outlook in the Next Five Years

3
 Office of Textiles and Apparel, OTEXA (2018). U.S. imports and exports of textile and apparel. Retrieved from
https://otexa.trade.gov/msrpoint.htm
                                                  Page 6 of 36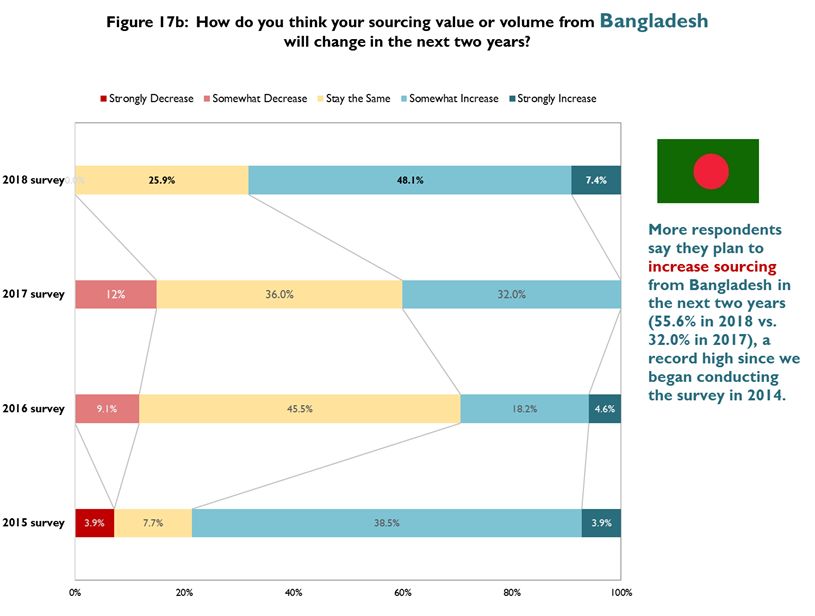
Overall, respondents are more confident about the five-year outlook for the U.S. fashion
industry in 2018 than they were a year ago, although confidence hasn’t fully recovered to the
level in 2015 and 2016. The percentage of those who are “optimistic” or “somewhat optimistic”
rose to 84 percent this year from 71 percent in 2017. Meanwhile, only 12 percent of respondents feel
somewhat pessimistic about the next five years, and zero feel pessimistic. Respondents’ regained
confidence in the five-year industry outlook can be explained by the improved economy in the United
States and globally. For example, according to the latest forecast by the International Monetary Fund
(IMF), the world economy is expected to tick up to a 3.9 percent growth rate in both 2018 and 2019,
higher than 3.6 percent in 2017. 4 The IMF says the upward economic growth will be broad-based,
including the United States, the Euro area, Japan, China, and Russia and emerging countries in
Europe. Hopefully, the improved world economy will translate into robust consumer demand for
clothing and support U.S. fashion companies’ growth in the next few years, too.
Demand for Human Talent in the Next Five Years
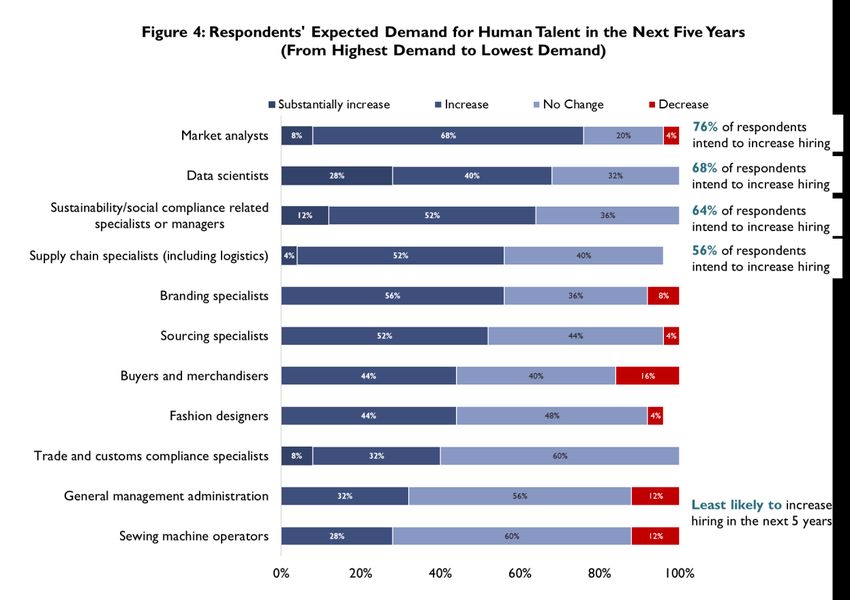
Likely reflecting companies’ improved confidence, for the first time since we began
conducting the benchmarking study in 2014, 100 percent of respondents say they plan to hire
more employees in the next five years, compared with 80-85 percent in previous studies.
However, as we find in the past, companies’ hiring plans continue to be quite unequal between
different types of positions this year. As shown in Figure 4, four types of positions—market
analysts, data scientists, sustainability/compliance related specialists or managers, and
4
International Monetary Fund, IMF (2018). World Economic Outlook, April 2018. Retrieved from
https://www.imf.org/en/Publications/WEO/Issues/2018/03/20/world-economic-outlook-april-2018
Page 7 of 36
supply chain specialists—will be most in-demand over the next five years; meanwhile, companies
are least likely to hire sewing machine operators and general management administrators in the
same time frame. The contrasting demand for talent reflects companies’ business priorities in the
years ahead and illustrates the changing nature of the U.S. fashion industry, which is becoming
increasingly globalized, supply-chain based, technology-intensive and data-driven. Likewise,
fashion companies will look for talent with more diverse educational backgrounds, going far beyond
graduates from the traditional apparel design or fashion merchanding programs.

Additionally, this is a reminder that more and more well-paid and high-quality jobs in the U.S.
fashion industry, from sourcing, supply chain management to social compliance, will depend
on international trade, and the global value chain. Unnecessary protectionist measures, such as
tariffs, will only hurt rather than create jobs in the U.S. fashion industry.

II. Sourcing Practices in the U.S. Fashion Industry

Sourcing Diversification

                                          Page 8 of 36
As the fashion industry becomes more globalized and fast-paced, it is increasingly important for
companies to strike a balance between sourcing cost, speed, reliability, flexibility, and risk control.
This year, we find companies’ selection of sourcing bases includes both continuities and changes:
First, most respondents continue to maintain a relatively diverse sourcing base, with 60.7
percent currently sourcing from 10+ different countries or regions, up from 57.6 percent in 2017 and
51.8 percent in 2016.
Second, larger companies, in general, continue to be more diversified than smaller companies.
As shown in Figure 5a and 5b, around 70 percent of respondents with 1,000+ employees source from
10+ different countries or regions in 2018, including 26 percent importing from 20+ different
countries or regions. Meanwhile, respondents with less than 1,000 employees seem to be
particularly focused on diversifying their sourcing, with 50 percent sourcing from more than 10
different countries this year, up from only 10 percent in 2017.
Third, consistent with our findings in previous years, brands and retailers are overall more
diversified in their sourcing than importers/wholesalers and manufacturers. As shown in
Figure 6, 75 percent and 65 percent, respectively, of self-identified brands and retailers source from
10+ different countries in 2018, higher than 60 percent of the total respondents. Both brands and
retailers are more likely to report sourcing from 20+ different countries or regions this year, as well.
Page 9 of 36Sourcing Portfolio
Note: Respondents were asked to select all sourcing destinations they are currently using. Utilization rate in the
above figure is calculated by dividing the frequency of each country’s utilization by total number of respondents.
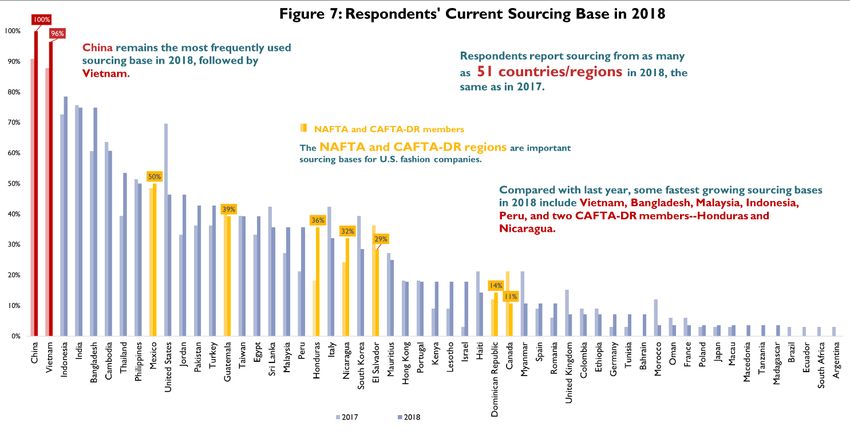
Reflecting the U.S. fashion industry’s growing global reach, respondents source from as many
as 51 countries or regions in 2018, the same as in 2017 (Figure 7). Consistent with the official
U.S. trade statistics, China (100 percent of respondents) and Vietnam (96 percent of
respondents) continue to be the two most-utilized sourcing destinations, followed by Indonesia (79
percent), India (75 percent), Bangladesh (75 percent), and Cambodia (61 percent).
Regarding the selection of sourcing destinations by respondents, two trends are worth our attention
this year.
First, Asia as a whole continues to take the lead as the dominant sourcing region for U.S.
fashion companies. Among the 10 most-utilized sourcing destinations in 2018, eight are located in
Asia, except Mexico (#9) and the United States (#10). Furthermore, almost all of these top sourcing
destinations in Asia see a higher utilization rate in 2018 than a year ago, including China (100
percent in 2018 v.s. 91 percent in 2017), Vietnam (96 percent in 2018 v.s. 88 percent in 2017),
Indonesia (79 percent in 2018 v.s. 73 percent in 2017), Bangladesh (79 percent in 2018 v.s. 61
percent in 2017), and Thailand (54 percent in 2018 v.s. 39 percent in 2017). Notably, when
companies source more from one Asian country, other Asian countries will not necessarily
become losers. This phenomenon could be explained by that fact that U.S. fashion companies are
diversifying their sourcing within Asia.
Second, with the growing importance of speed-to-market and flexibility in sourcing, the
Western Hemisphere, including members of the North American Free Trade Agreement
(NAFTA) and the Dominican Republic-Central America Free Trade Agreement (CAFTA-DR), is
becoming an indispensable sourcing base for U.S. fashion companies. Notably, several countries
in the Western-Hemisphere see a higher utilization rate this year, including Mexico (50 percent in
2018 v.s. 48 percent in 2017), Honduras (36 percent in 2018 v.s. 18 percent in 2017), Nicaragua (32
Page 10 of 36percent in 2018 v.s. 24 in 2017), and the Dominican Republic (14 percent in 2018 v.s. 12 percent in
2017). The utilization rates for Guatemala (39 percent), and El Salvador (29 percent) remain close to
last year’s results.
This year, we again asked respondents not only to list countries they source from, but also to
describe the makeup of their detailed sourcing portfolio (Figure 8). The results indicate that “China
plus Vietnam plus Many” has become an ever more popular sourcing model. And this model is
gradually evolving. Notably:
China remains the top supplier for most U.S. fashion companies. However, China now
accounts for only 11-30 percent of companies’ total sourcing value or volume, compared
with 30-50 percent in the past. As shown in Figure 9, this year, fewer respondents report
sourcing more than 30 percent of their value/volume from China (25.9 percent, down from 38.7
Page 11 of 36percent in 2017) and even fewer source over 50 percent of value/volume from China (15 percent,
down from 19 percent in 2017).
Vietnam still accounts for 11-30 percent of companies’ total sourcing value or volume.
Notably, Vietnam’s utilization rate as sourcing base reaches a record high of 96 percent since we
began conducting the study in 2014.
For the “many,” each additional country, including the United States, typically accounts for less
than 10 percent of respondents’ total sourcing value or volume.
Rating Sourcing Destinations
Table 2 Strength and Weakness as a Sourcing Base
Sourcing Speed to Risk of
Region Sourcing cost
destination market compliance
USA 5 1.5 4
Mexico 4 3 3
Western CAFTA-DR 3.5 3.5 3
Hemisphere Colombia 3 2.5 3
China 3 3.5 3
Vietnam 3 4 3
Bangladesh 2 4.5 1.5
Indonesia 2.5 3.5 3
India 2.5 3.5 2.5
Sri Lanka 2.5 3.5 3
Asia Cambodia 2.5 3.5 2.5
AGOA 2 3.5 2.5
Others Egypt 2.5 3 3
Note: The results were based on respondents’ average rating for each country in a scale of 1 (much lower performance
than the average) to 5 (much higher performance than the average). In the table, means strength as a sourcing base
(rating score between 5.0-4.0); means average performance (rating score between 3.0-3.9); means weakness as a
sourcing base (rating score between 1.0-2.9). However, the results do NOT reflect the author’s evaluation of each
country.
To understand the strengths and weaknesses of each primary sourcing destination, we asked
respondents to rate them against three criteria with the most significant impact on sourcing
decisions.
Speed to Market: The United States, Mexico, and CAFTA-DR members, unsurprisingly,
outperform all other suppliers due to geographic location. For suppliers outside the Western
Hemisphere, generally, China and Vietnam offer shorter lead time than other countries in Asia as
well as Egypt and members of the African Growth and Opportunity Act (AGOA). This evaluation
makes sense given China’s and Vietnam’s overall higher efficiency in supply chain management
based on their more advanced local textile and apparel industries. 5
Sourcing Cost: Like last year, respondents say Bangladesh offers the most competitive price,
followed by Vietnam. However, respondents see many Asian countries’ cost competitiveness
weakened in 2018 versus a year ago. Because the lion's share of U.S. apparel imports come from
5
Lopez-Acevedo, Gladys, and Raymond Robertson (Eds.). Sewing Success?: Employment, Wages, and Poverty
following the End of the Multi-Fiber Arrangement. Washington, DC: World Bank, 2012
Page 12 of 36Asia, this echoes respondents’ concerns about increasing sourcing cost this year. Additionally,
respondents say sourcing from the United States and Colombia will incur a higher cost.
Risk of Compliance (i.e., factory, social and environmental): Consistent with last year’s
finding, the United States demonstrates a competitive edge against other sourcing destinations.
However, respondents say sourcing from Bangladesh, Cambodia, and India involves higher
compliance risks in general. Additionally, respondents express more concerns about the risk of
compliance from AGOA members this year and the reasons remain unclear.
There are two important takeaways. First, no sourcing destination is perfect, which explains why
companies use a wide variety of sourcing destinations to balance cost, speed, flexibility, and risk
management. Second, Vietnam, China, Mexico, and CAFTA-DR members overall are regarded as
the most balanced sourcing destinations against the three criteria, which offers these countries
and regions unique competitive advantages as preferred sourcing destinations.
Factors Impacting Sourcing Cost
As noted earlier, respondents overall feel more pressure about production and sourcing cost in 2018,
which is driven by a mix of factors as shown in Figure 10.
First, labor cost remains the top factor driving up sourcing cost this year, with 93 percent of
respondents expecting an increase, compared with 73 percent in 2017. According to industry
sources, since late 2017, wage levels started to climb quickly in almost all major sourcing
destinations for U.S. fashion companies, including Asia, Central America, and Africa.6
6
Donaldson, T. (2017). Sourcing costs climb: Wage increases set to affect 2018. Sourcing Journal. Retrieved from
https://sourcingjournal.com/topics/business-news/apparel-sourcing-costs-wage-increases-2017-76511/
Page 13 of 36Second, close to 90 percent of respondents also expect their raw material cost to increase in
2018, compared with only 61 percent last year. This result is consistent with the continuing
upward trend of the world price for cotton 7 and several man-made fiber textiles8 since 2017.
Third, the majority of respondents (80 percent) say that trade barriers as well as compliance
with factory, social, and environmental standards are driving up their sourcing cost in 2018,
as well. In comparison, only 36 percent of respondents expected so in 2017. This is a reminder that
more needs to be done to eliminate trade and regulatory barriers to help companies manage and
reduce cost.
Additionally, respondents face less cost pressure from shipping and logistics this year, with only 46
percent expecting an increase, down from 58 percent last year. Around 46 percent of respondents
expect an increase in sourcing cost because of the exchange rate and currency factors, too.
Sourcing Risks
As managing supply chain risks becomes increasingly important for fashion businesses, this year, we
again asked respondents to identify and rate the impact of specific sourcing risks. As shown in Figure
11, “unmet compliance (factory, social and environmental) standards” tops respondents’
concerns, with as many as 79 percent rating it one of the top three risks in 2018. For years, U.S.
fashion companies and well-known brands have made great efforts to improve compliance with
social, labor, and environmental standards. We see the importance of compliance, as well as its
complexity, especially as fashion supply chains are becoming longer and more sophisticated.
At the same time, similar to the results in previous surveys, respondents see “labor disputes,”
“political unrest,” and “lack of resources to manage supply chain risks” having an overall medium
impact on their sourcing risk in 2018, whereas the risk from natural disasters is of the least concern.
7
U.S. Department of Agriculture, USDA (2018). Cotton: World markets and trade. Washington, DC. Retrieved from
https://apps.fas.usda.gov/psdonline/circulars/cotton.pdf
8
Federal Reserve Bank of St. Louis (2018). Producer price index by commodity for textile products and apparel.
Retrieved from https://fred.stlouisfed.org/series/WPU031
Page 14 of 36Sourcing in Socially Compliant & Sustainable Ways
This year, we again asked respondents to provide details about their practices related to sourcing in
socially compliant and sustainable ways, given the increasing attention to the issue from within the
fashion industry as well as from outside stakeholders.
First, U.S. fashion companies overall are making more commitments to sustainability and
social responsibility. Notably, the vast majority of respondents (85 percent) plan to allocate more
resources to sustainability and social compliance in the next two years, and another 11 percent
expect no change. As shown in Figure 12, “providing sustainability and social compliance
training for suppliers” and “providing sustainability and social compliance training for
internal employees” are the top two areas where respondents plan to allocate more resources in
the next two years. Nearly half of respondents also plan to increase “the number of employees
dedicated to sustainability and social compliance issues in sourcing,” which explains why the
demand for related human talents is high in the next five years, as shown in Figure 4. Further, around
40 percent of respondents plan to allocate more resources to either “work with third-party
certification programs on sustainability and social compliance” or conduct audits of their own.
However, only around one-third say they will have a larger operational budget available for
sustainability and social compliance in the next two years, suggesting financial resources remain a
hurdle for companies that want to do more.
Page 15 of 36Second, reflecting companies’ commitments to sourcing in sustainable and socially compliant
ways, 100 percent of respondents map their supply chains (i.e., keep records of name,
location, and function of suppliers), up from 90 percent in 2017. Notably, as indicated in Figure
13a, over 80 percent of respondents track not only Tier 1 suppliers (i.e., factory where the final
product is assembled), but also Tier 2 suppliers (i.e., subcontractors or major component suppliers,
such as fabrics). However, it’s less common for companies to map Tier 3 (i.e., yarn spinners, finding
and trimming suppliers) and Tier 4 suppliers (i.e., raw materials suppliers, such as cattle/pig hides,
rubber, cotton, wool, goose down, minerals/metals and chemicals), likely because today’s fashion
apparel supply chain is highly fragmented, long, and globalized9.
9
Dicken, P. (2015). Global shift, seventh edition: Mapping the changing contours of the world economy: Guilford
Publications, Incorporated.
Page 16 of 36Of note, the business type and the diversity of their sourcing affects how a company maps
their suppliers. As shown in Figure 13a, self-identified brands are making a greater effort to
monitor Tier 1 suppliers than average (91.7 percent vs. 85.2 percent). However, sourcing
diversification could make it more challenging to monitor supply chains closely. As shown in Figure
13b, while 100 percent of respondents sourcing from less than 10 countries or regions map Tier 1
suppliers, only 82.4 percent of respondents that source from 10+ different countries or regions do so.
Page 17 of 36Third, 100 percent of respondents currently audit their suppliers, suggesting this is a key tool
for achieving sustainable and socially compliant sourcing. As shown in Figure 14a-14c:
The vast majority of respondents (96 percent) currently use third-party certification
programs to audit. Using both third-party certification programs and companies’ own
compliance teams is also a common practice among respondents; this year, about 60 percent of
respondents do so, up from 50 percent in 2017.
Regarding the nature of inspection, 63 percent of respondents conduct both announced
and unannounced audits, which is similar to 68 percent in 2017. However, far fewer companies
conduct solely announced (15 percent) or unannounced audits (4 percent).
Regarding the content of audit, respondents say they usually focus on three primary areas
related to social responsibility: treatment of workers (81.5 percent), fire safety (77.8 percent),
and building safety (66.7 percent). Generally, brands and retailers conduct more comprehensive
audits than importers and service providers. The results further suggest that there is no clear
pattern between the size of the company and the scope of the audit.
Page 18 of 36Emerging Sourcing Trends
Looking ahead, several emerging sourcing trends are worth watching:
First, U.S. fashion companies will continue to adjust their sourcing in response to the changing
business and trade policy environment. As shown in Figure 15:
Keeping a relatively diverse sourcing base will remain a key element of companies’
sourcing strategies. Less than 10 percent of respondents plan to consolidate their sourcing (i.e.,
sourcing from fewer countries and work with fewer suppliers) in the next two years.
As part of the continuous quest for sourcing diversification, close to 80 percent of respondents
say they plan to source from the same number or more countries in the next two years.
While companies are not leaving any particular sourcing destination en masse, respondents are
divided on whether to increase (54 percent) or decrease (46 percent) the number of
suppliers they will work with over the next two years. In general, larger companies prioritize
consolidating their existing suppliers for the sake of improving supply chain efficiency, whereas
relatively smaller companies are more interested in building business ties with new vendors.
Page 19 of 36Second, although China’s position as the top sourcing destination is unshakable, U.S. fashion
companies are actively seeking alternatives to “Made in China.” In 2017, China supplied nearly
49 percent of total textiles and apparel to the United States by quantity and 36 percent by value, with
no near challenger on the horizon. 10
While 100 percent of respondents currently source from China, around 67 percent plan to
somewhat decrease their sourcing value or volume from the country over the next two
years, a significant increase from 46 percent in 2017. In comparison, only 26 percent expect
to maintain their current sourcing value or volume from China through 2020, a substantial
decrease from 47 percent last year (Figure 16a).
Cost concerns do not seem to be the most critical factor driving companies to reduce their
China production. Interestingly, in contrast with the popular view that “Made in China” is
becoming more expensive, official trade statistics show that the unit price of U.S. apparel imports
from China actually dropped from $2.68 per square meters equivalent (SME) in 2015 to
$2.38/SME in 2017, a decrease of 11.4 percent, as shown in Figure 16b. Similarly, the unit price of
“Made in China” apparel in the U.S. market was 80 percent of the world’s average ($2.96/SME) in
2017, down from 86 percent in 2015 ($3.13/SME). According to respondents, the adoption of
automation technology, improved supply chain efficiency, and currency factors could explain the
demonstrated price competitiveness of Chinese apparel.
Concerns about escalating U.S.-China trade tensions seem to have more of an impact on
decisions to shift sourcing from China to other countries. Among respondents who plan to
reduce their sourcing value or volume from China over the next two years, close to 70 percent
rank “protectionist U.S. trade policy agenda” as one of their top five challenges. This echoes a
comment in last year’s survey: “We will never be completely out of China due to their speed, ease
of doing business. The only thing that could change that is a protectionist agenda.”
10
United States Fashion Industry Association, USFIA (2018). Sourcing Trends & Outlook 2018. Washington, DC.
Page 20 of 36 The ongoing structural change in China’s textile and apparel industry is another factor that will
shape the future landscape of sourcing from the country. In particular, it is important to
recognize that China is playing an increasingly critical role as a textile supplier for many
apparel-exporting countries in Asia. As shown in Figure 16c, measured by value, 47 percent of
Bangladesh’s textile imports came from China in 2017, up from 39 percent in 2005. We observe
similar trends in Cambodia (up from 30 percent to 65 percent), Vietnam (up from 23 percent to
50 percent), Pakistan (up from 32 percent to 71 percent), Malaysia (up from 25 percent to 54
percent), Indonesia (up from 28 percent to 46 percent), Philippines (up from 19 percent to 41
percent) and Sri Lanka (up from 15 percent to 39 percent) over the same time frame. 11 Instead of
focusing on China’s apparel exports alone, a more meaningful indicator to watch is the value
of “Made in China” in Asian countries’ apparel exports to the world.12
11
UNComtrade (2018). Time Series on international trade. Retrieved from https://comtrade.un.org/
12
Lu, S. (2017). Five key trends in world textile and apparel trade. Just-Style. Retrieved from https://www.just-
style.com/comment/5-key-trends-in-world-textile-and-apparel-trade_id132343.aspx
Page 21 of 36Third, benefiting from U.S. fashion companies’ expected decrease in sourcing from China,
Vietnam and Bangladesh are expected to play a bigger role as apparel suppliers for the U.S.
market.
This year, Vietnam remains the #2 sourcing destination among respondents, with a 96
percent usage rate, up from 88 percent in 2017. In addition, respondents appear to be more
optimistic about the prospect of sourcing from Vietnam over the next two years; those expecting
to increase sourcing jumped from 36 percent in 2017 to 70 percent this year, whereas those
expecting no change fell from over 50 percent in 2017 to just 22 percent (Figure 17a).
Nevertheless, few respondents plan to substantially increase apparel sourcing from
Vietnam over the next two years, which reflects concerns about the limits of Vietnam’s
production capacity. Recent studies suggest that, pretty soon, U.S. fashion companies may have
to compete for orders with their counterparts in Europe and Asia, once the Comprehensive and
Progressive Agreement for Trans-Pacific Partnership (CPTPP) and EU-Vietnam Free Trade
Agreement (EVFTA) go into effect. These two agreements, likely to be implemented in late 2018
or 2019, will provide strong incentives for Vietnam to prioritize fulfilling orders for the EU and
Japan because of the duty-free benefits under the agreements. Further, the CPTPP and EVFTA
could intensify the competition for resources (especially labor) between the apparel industry and
other export-oriented sectors in Vietnam, which may also try to expand their production and
exports. As a result, Vietnam’s apparel industry could face labor shortages and wage hikes.
Page 22 of 36 This year, Bangladesh is the #5 sourcing destination, with 75 percent usage among
respondents, moving up from #7 (61 percent usage) in 2017. As shown in Figure 17b, similar
to the case of Vietnam, respondents express more interest in expanding sourcing from
Bangladesh in the next two years as companies are actively seeking China alternatives.
Nearly half of respondents expect to somewhat increase sourcing from Bangladesh through 2020,
up from 32 percent in 2017; another 7 percent expect to strongly increase sourcing there, a
record high since 2015.
As shown in Table 2, “Made in Bangladesh” enjoys a prominent price advantage over many other
Asian suppliers. However, respondents still regard “risk of compliance” as a notable weakness.
The high level of media and public attention to the social responsibility problems remaining in
the Bangladeshi garment industry, such as factory safety and treatment of workers13, further
adds to the complexity and sensitivity of the issue. Since compliance is so important to U.S.
fashion companies, concerns about the compliance risks involved in sourcing from Bangladesh
could hold companies back from giving more orders to the country.
13
For example: Edmont, J. (March 29, 2018) A 2013 Collapse Killed 1,100 People. Bangladesh Factories Are Still
Unsafe. Wall Street Journal. Retrieved from https://www.wsj.com/articles/five-years-after-tragedy-bangladesh-
factories-remain-unsafe-1522324800; Fair Labor Association (2018). Toward fair compensation in Bangladesh.
Retrieved from http://www.fairlabor.org/bangladesh-2018
Page 23 of 36Fourth, other than Vietnam and Bangladesh, to a lesser extent, respondents also plan to somewhat
increase sourcing from India, members of CAFTA-DR, Indonesia, Cambodia, and members of the
African Growth and Opportunity Act (Figure 18a). Meanwhile, around 15 percent of respondents say
they will somewhat decrease sourcing from Mexico, Sri Lanka, and Egypt over the next two years
(Figure 18b).
Finally, the United States is ranked #10 among respondents in 2018, with 46 percent usage. As
shown in Figure 19, sourcing from the United States is likely to remain stable in the next two years
with over half of respondents planning to keep their current sourcing value or volume.
Page 24 of 36Automation Technology and the Future Landscape of Apparel Sourcing
Since apparel manufacturing traditionally is highly labor-intensive, most clothing is produced by
developing countries today, where labor is abundant. However, with the advancement of automation
technologies, such as Sewbots, firms soon may be able to use machines to make garments, too. 14
To understand how automation in apparel manufacturing could change the future landscape of
apparel sourcing, we invited respondents to share their perspectives. Several themes emerge from
the comments.
First, respondents share the view that automation in apparel manufacturing will bring
positive changes to the existing apparel supply chain, ranging from shorter lead time, to
higher productivity, to labor cost savings. As one respondent put it, ”Automation in apparel
manufacturing will reduce lead times, reduce design iterations, and improve quality.” Another
respondent said, “I believe automation will grow and dramatically increase efficiencies worldwide.”
Second, respondents believe automation may somewhat encourage reshoring, but the
majority don’t think it will bring apparel manufacturing back to the United States in a
significant way. As noted by one respondent, “Automation will change the future landscape of
apparel sourcing allowing brands to source closer to the markets they are serving. It is possible that we
will see some reshoring in the US.” Another respondent said that “It [automation] may reshore with
short runs and simple garments.”
One important roadblock in expanding apparel manufacturing in the United States is the difficulty of
rebuilding the apparel supply chain. According to one respondent, “There are still too many parts of
the material supply chain (fabric/trim) that would need to be imported to the US, and I would imagine
the capital cost to build this back up in the states would be prohibitive.” Similarly, another said “the
14
Nayak, R., & Padhye, R. (Eds.). (2017). Automation in Garment Manufacturing. Woodhead Publishing.
Page 25 of 36supply chain is too established with sourcing overseas in other facets to switch to the US.” “Even with
automation, USA has limited fabric availability,” added another.
On the other hand, some respondents argue that, even in the era of automation, U.S.-based fashion
companies should focus on higher value-added non-manufacturing business functions, rather than
apparel manufacturing. According to one respondent, “My view is that low-level cut/sew operations
should remain offshore. The focus in the U.S. should be in design, development, marketing, etc.”
Third, some respondents expressed concerns about the potential negative social and
economic impacts of automation in apparel manufacturing. The major conern is loss of jobs. One
respondent said, “Automation may cause many people in Bangladesh to lose their garment
manufacturing jobs, resulting in a shift of apparel manufacturing going to wealthier countries that can
develop and produce the technology for machines like the Sewbots.” Another shared a similar view,
that “(automation technology will) change talent of labor needed that may be able to operate
machinery different than what is needed today.”
To sum up, as one respondent commented, “Automation is the future!”
III. Trade Policy and the U.S. Fashion Industry
Utilization of Enacted Free Trade Agreements and Preference Programs
Note: Utilization rate equals the frequency of each free trade agreement/preference program’s utilization divided by
the total number of respondents.
Page 26 of 36Each year, we ask respondents to tell us whether they utilize any free trade agreements (FTAs) and
trade preference programs enacted by the United States or other countries for sourcing.
Theoretically, FTAs and preference programs should help companies save money on import tariffs
and more easily obtain access to foreign markets. This is especially the case for the fashion industry;
while the average applied U.S. tariff rate for all goods has been lowered to only 2.4 percent by 2017,
the average tariff rate remains as high as 8.0 percent for textiles and 11.6 percent for apparel.15 In
2017, textiles and apparel accounted for only 4.9 percent of the total value of U.S. merchandise
imports but contributed nearly 40 percent of tariff revenues (or $33 billion).16
As shown in Figure 20a, while FTAs and preference programs remain underutilized by U.S.
fashion companies, we’re encouraged that the utilization rates of NAFTA (65 percent), CAFTA-
DR (58 percent) and AGOA (50 percent) have improved and reached 50 percent or more. In
addition, more than one-third of respondents use Egyptian Qualifying Industrial Zones (46 percent),
the U.S.-Korea FTA (38 percent), and the U.S.-Peru FTA (35 percent). The remaining FTAs and
preference programs are utilized by less than 20 percent of respondents this year. Overall, compared
with last year's survey, 10 FTAs and trade preference programs are used more often by respondents
in 2018, but 10 are used less often.
The results of our findings are consistent with the official trade statistics. 17 As shown in Figure 20b,
the share of U.S. apparel imports entering under FTAs improved slightly, from 15.6 percent in 2016
to 15.7 percent in 2017. However, considering textile and apparel as a whole, only 14.2 percent of
imports were entered under FTAs in 2017, down from 14.3 percent a year ago. Notably, between
2007 and 2017, the value of U.S. apparel imports increased from $76.7 billion to $82.7 billion (or up
7.7 percent). After all, the value of U.S. apparel imports under FTAs decreased from $13.0 billion to
$12.9 billion (or down 0.2 percent) over the same period, even though more FTAs are in force today
than ten years ago. Illustrating the importance of NAFTA and CAFTA-DR to U.S. fashion
15
World Trade Organization, WTO (2017). World tariff profile. Retrieved from
https://www.wto.org/english/res_e/booksp_e/tariff_profiles17_e.pdf
16
United States International Trade Commission, USITC (2018). Interactive trade and tariff dataweb. Retrieved from
https://dataweb.usitc.gov/
17
Office of Textiles and Apparel, OTEXA (2018). U.S. imports and exports of textiles and apparel. Retrieved from
http://otexa.trade.gov/msrpoint.htm
Page 27 of 36companies, these two trade agreements together accounted for 76-80 percent of the value of
total U.S. apparel imports entering under FTAs between 2007 and 2017.
Additionally, it is concerning that when sourcing from member countries of a free trade
agreement, some U.S. fashion companies, for whatever reason, do not claim the duty-free
benefits. For example, of respondents who source from the CAFTA-DR region, about 10 percent said
they chose to forgo the duty-free benefits under the agreement. Nationwide, respectively about 22.0
percent and 15.3 percent of U.S. apparel imports under CAFTA-DR and NAFTA in 2017 did not claim
the FTA duty-free benefits, either.18 As mentioned in our previous studies, U.S. fashion companies say
strict, complicated rules of origin and heavy documentation requirements deter them from taking
advantage of the duty savings. Many say the duty savings are not worth the time and resources
required to comply with programs and obtain the required documents from the suppliers.
Usage of Exceptions to the Yarn-Forward Rules of Origin
When U.S. fashion brands and apparel retailers import apparel from the FTA region, only products
that meet the FTA rules of origin can enjoy the preferential tariff treatment.19 The textile and apparel-
specific rules of origin for apparel under most U.S. FTAs is known as “yarn forward,” meaning that
fibers may be produced anywhere, but each component starting with the yarn used to make the
apparel garments must be formed within the free trade area. The “yarn-forward” rule sometimes is
also called “triple transformation,” as it requires that spinning of the yarn or thread, weaving or
knitting of the fabric, and assembly of the final apparel garments all occur within the FTA region.20
18
The same as above.
19
Gelb, B. A. (2003). Textiles and apparel rules of origin in international trade. Washington, DC: Congressional
Research Service. Retrieved from http://research.policyarchive.org/1737.pdf
20
Platzer, M. (2017). Renegotiating NAFTA and U.S. textile manufacturing. Washington, DC: Congressional Research
Service. Retrieved from https://fas.org/sgp/crs/row/R44998.pdf
Page 28 of 36Since the fabrics and yarns needed to make apparel are not always actually available in the FTA
region, most FTAs include exceptions to the “yarn-forward” rule to provide flexibilities to users.
Three types of exceptions to the “yarn-forward” rule are most commonly seen:21
Tariff Preference Level (TPL): TPL allows for a certain quantity of textile and apparel goods
(usually yarns, fabrics and cut pieces) from a third country (i.e., a country which is not a party
to the agreement) to qualify for the benefits. For example, with the NAFTA TPL, in 2017,
Mexico and Canada can export up to 45 million and 88 million SME of apparel, respectively,
that contain non-NAFTA originating yarns and fabrics to the United States duty-free.
However, beyond these quota limits, any additional apparel exports from Mexico and Canada
to the United States must meet the “yarn-forward” rules of origin to enjoy the preferential
tariff treatment.
Commercial availability/short supply list: Fibers, yarns, and fabrics determined not to be
available in commercial quantities in a timely manner from within the FTA partner countries
may be sourced from outside the countries for use in qualifying textile and apparel products.
For example, fabric that is determined not to be commercially available under the U.S.-
Australia FTA may come from a third-party, i.e., China, be cut-and-assembled into a garment
in Australia, and then imported to the United States duty-free.
Cumulation: Yarns and/or fabrics from one FTA partner country to be used in another FTA
partner country and qualify for duty-free benefits. For example, CAFTA-DR allows its
members to use a certain amount of woven fabrics made in Mexico (i.e., a member of NAFTA)
and the finished apparel will still qualify for the CAFTA-DR preferential duty benefit.
This year, for the first time, we asked respondents about their usage of the exceptions to the “yarn-
forward” rules of origin. Several findings are worth attention:
First, the exceptions to the “yarn-forward” rule are important to U.S. fashion companies, with
48 percent of respondents currently using these mechanisms for sourcing. Specifically, as
shown in Figure 21, TPL is used by most respondents (34.6 percent), followed by a commercial
availability/short supply list (19.2 percent) and cumulation (7.7 percent).
21
U.S. Customs and Border Protection, CBP (2004). Textile and apparel rules of origin. Washington, DC. Retrieved
from https://www.cbp.gov/sites/default/files/assets/documents/2016-Apr/icp006r3_3.pdf
Page 29 of 36You can also read