The carbon impact of the national roads programme - Lynn Sloman and Lisa Hopkinson With contributions from Phil Goodwin, Jillian Anable, Sally ...
←
→
Page content transcription
If your browser does not render page correctly, please read the page content below
The carbon impact of the
national roads programme
                          Lynn Sloman and Lisa Hopkinson

    With contributions from Phil Goodwin, Jillian Anable,
                              Sally Cairns and Ian Taylor

                                               July 2020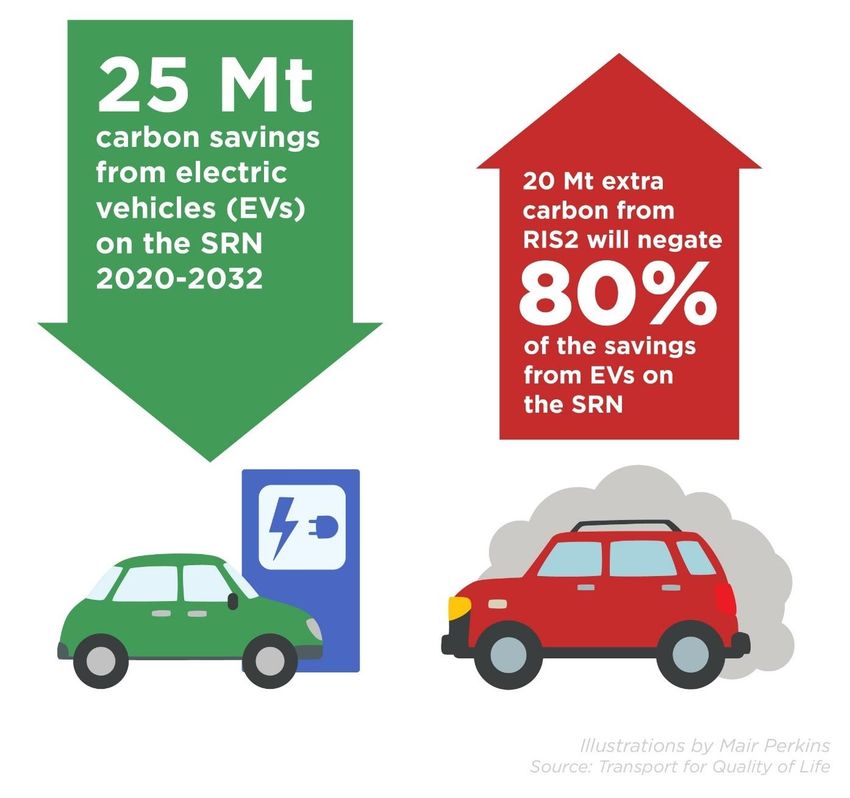
Contents
Headline findings .................................................................................................................................... 3
1.     Introduction .................................................................................................................................... 6
2.     Why carbon emissions from the SRN matter ................................................................................. 7
3.     A suggested carbon budget for the SRN ......................................................................................... 9
4.     Current approach to assessing carbon impacts of road schemes ................................................ 11
5.     Scale of the roads programme ...................................................................................................... 14
6.     How RIS2 schemes will affect carbon emissions .......................................................................... 16
     6.1      Carbon emissions from construction .................................................................................... 18
     6.2      Carbon emissions from changes in vehicle speeds ............................................................... 19
     6.3      Carbon emissions from induced traffic ................................................................................. 20
7.     Discussion and conclusions ........................................................................................................... 23

Acknowledgements
Thanks to Mair Perkins www.mairperkins.co.uk for all illustrations, which are licensed for reuse under
this Creative Commons Licence.
Thanks to Christian Brand for assistance with data on construction emissions and Jaise Kuriakose for
assistance with understanding local authority carbon budgets.
Thanks to David Dixon for cover photo: Junction 18 on the M6 © David Dixon, licensed for reuse under
this Creative Commons Licence.

Transport for Quality of Life
Email: info@transportforqualityoflife.com
Web: www.transportforqualityoflife.com
Contact: Lynn Sloman, lynn@transportforqualityoflife.com

                                                                                                                                                        2
Headline findings
In terms of carbon emissions, transport is the worst-performing sector of the
economy. Whereas emissions in all other sectors have fallen, emissions from transport
are still going up.
The Department for Transport is developing a decarbonisation plan for the transport
sector, and has stated that the forecast rate of carbon reduction from transport is
much slower than is needed.
The Climate Change Act 2008 now commits the UK to reduce net carbon emissions to
zero by 2050, and to five-yearly carbon budgets between now and then. The
Committee on Climate Change (CCC) has already shown that transport is not even on
track to comply with existing carbon budgets (set when the target was to reduce
emissions by 80% by 2050), let alone net-zero ones.
However, in terms of impact on the climate, what matters is not so much the end date,
as the total amount of CO2 that is emitted between now and then. Under the Paris
Climate Agreement, the UK is committed to restricting the increase in global average
temperatures to well below 2°C and preferably below 1.5°C. For this, cutting carbon
emissions over the next decade will be crucial.

The significance of the Strategic Road Network (SRN)
Total carbon emissions from the Strategic Road Network (SRN) and other roads over
the next decade will depend on the rate of adoption of electric vehicles and the volume
of traffic. Even using the DfT road traffic forecast (RTF) with the most optimistic
assumptions about take-up of electric vehicles (RTF Scenario 7), we calculate that total
carbon emissions from the SRN between now and 2032 will be 381 MtCO2.
We believe that DfT should set a binding Paris-compliant carbon budget for all parts
of the transport sector, including Highways England which is responsible for the SRN.
By analogy with carbon budgets proposed for local authorities by the Tyndall Centre
for Climate Change, we estimate that a fair, Paris-compliant budget for the SRN
between now and 2032 is about 214 MtCO2.
This would mean that total carbon emissions from the SRN over the next 12 years need
to be cut by about 167 MtCO2, or 44% of forecast levels, even assuming DfT’s most
optimistic forecast of how emissions will change with rapid uptake of electric vehicles.
This scale of reduction is extremely challenging. It will only be possible through a
combination of a faster switch to electric vehicles (e.g. requiring all new cars/vans to
be fully electric from 2030) and a significant reduction in vehicle mileage. Mileage
reduction will require measures to restrict driving, such as road pricing, better and
more affordable rail and coach services, improvements in conditions for active travel
(since many journeys on the SRN could potentially be replaced by a combination of

                                                                                      3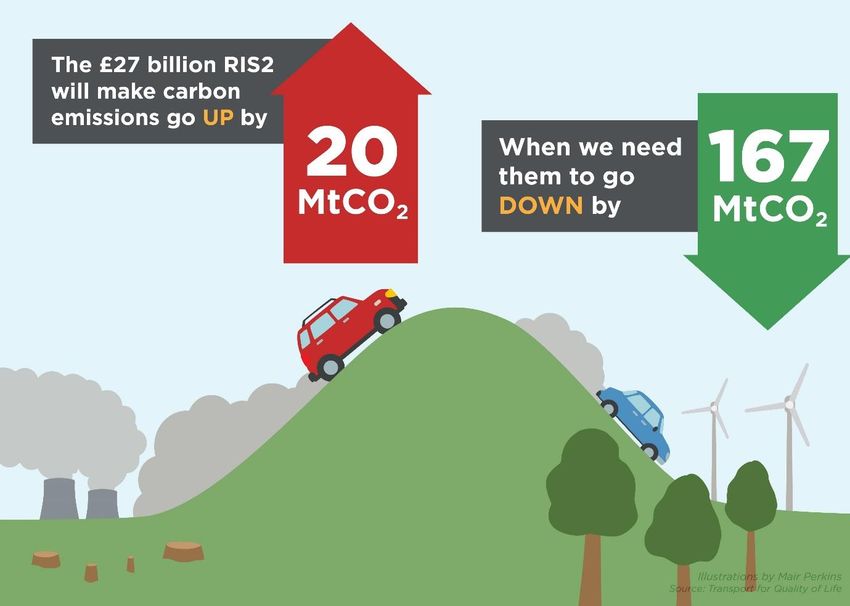
cycling and rail travel), better planning to prevent car dependent development and
universal roll-out of superfast broadband to support remote working. Further carbon
could be saved by reducing the speed limit on the SRN to 60mph, with speed camera
enforcement.
Two weeks before publishing its initial thinking about how to decarbonise the
transport sector, DfT published the second Road Investment Strategy (RIS2). This
commits expenditure of £27.4 billion over the next five years to the SRN. Just over half
(£14.1 billion) is for “capital enhancements” – that is, new roads and increasing the
capacity of existing roads.
This is a very substantial increase in expenditure on road building. It has been
described by the Chancellor as the largest ever road investment package, and it
represents a doubling in average expenditure.
DfT has not published any assessment of the cumulative carbon impact of RIS2.

The carbon impact of RIS2
This paper estimates the likely carbon impact of RIS2. To do this, it uses Highways
England’s own figures from post-opening project evaluations of strategic road
schemes built over the last 18 years, and every publicly-available Environmental
Statement for a planned RIS road scheme.
A road scheme increases carbon emissions in several ways. There is significant
embodied carbon in the steel, concrete, asphalt and other raw materials used to build
it. If there is extensive land clearance and many mature trees are felled, a carbon ‘sink’
is lost. Once the road is opened, it may result in higher speeds, and this may lead to
more carbon emissions: an increase in average speeds from 60mph to 70mph causes
carbon emissions to go up by about 13%. And over time, increased road capacity
generates more traffic, as it encourages driving and enables development of car-
dependent housing estates, retail parks and business parks. This is known as ‘induced’
traffic.
Highways England measures some of these effects, in its appraisal and evaluation
process for individual roads. However, failings in the way it evaluates road schemes
(using a method categorised as ‘weaker / riskier’ in the government’s own evaluation
‘rulebook’, the Magenta Book) lead it to systematically underestimate the effect of
induced traffic.
Our estimate of the likely carbon impact of RIS2 takes account of embodied carbon,
carbon emissions from higher speeds, and carbon emissions from induced traffic. We
estimate that these three factors have roughly equal effect, and that total additional
emissions between now and 2032 as a result of RIS2 will be about 20 MtCO2. Emissions

                                                                                        4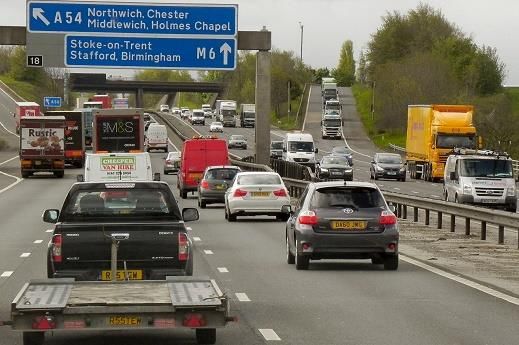
could be higher than this if planning policy becomes more permissive, allowing more
out of town, car-dependent development.
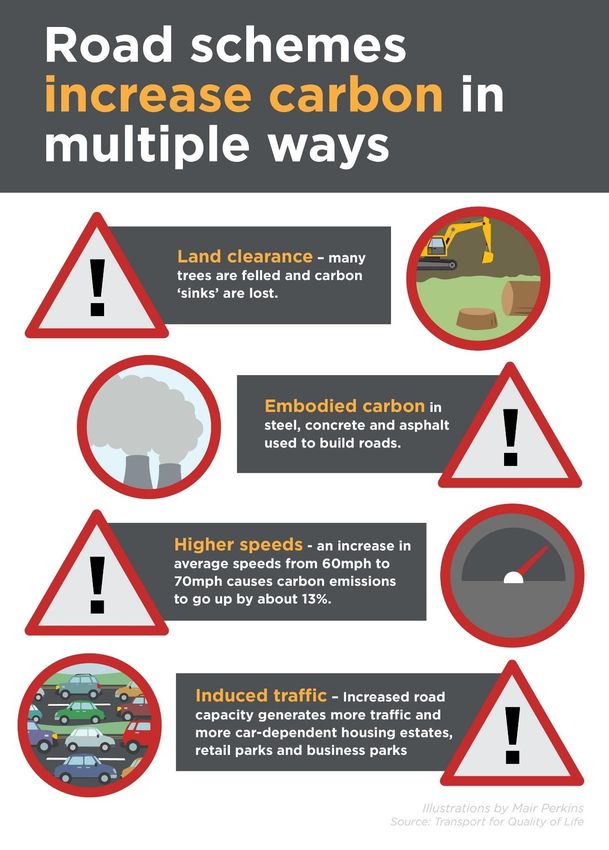
RIS2 will make carbon emissions from the SRN go up, by about 20 MtCO2, during a
period when we need to make them go down, by about 167 MtCO2. This increase in
CO2 from RIS2 will negate 80% of potential carbon savings from electric vehicles on
the SRN between now and 2032.
This suggests that RIS2 is incompatible with our legal obligation to cut carbon
emissions in line with the Paris Climate Agreement, the CCA budgets and the emerging
principles for the DfT’s decarbonisation plan. We therefore believe that it should be
cancelled.
Re-purposing RIS2 funding to address the COVID-19 and climate emergencies
The COVID-19 pandemic has wrought enormous behaviour change, with both work
and non-work journeys replaced by a variety of video conferencing solutions and
greater use of local facilities. When rebuilding the economy, it is vital that investment
supports behavioural shifts that will also help to achieve reductions in carbon
emissions. Cancelling RIS2 would free up investment for this.
In the short term, funding could be used to develop thousands of local ‘remote
working’ hubs. These would enable businesses to start to function again while
maintaining social distancing, would reduce the difficulties many people face when
working at home, and would avoid an increase in carbon and congestion as commuters
shift from public transport to driving.
In the medium term, funding could enable universal superfast broadband, providing a
more efficient and low-carbon way of meeting our everyday needs. It could also be
used to improve active travel and public transport networks, thereby reducing
congestion on the SRN in a more effective, sustainable and permanent way.
5
1.      Introduction
The Department for Transport is currently developing a decarbonisation strategy for the transport
sector. Its recent paper Decarbonising transport: setting the challenge states that current plans and
policies will not achieve the reduction in emissions that is needed if transport is to play its part in
contributing to our legal obligation to “net zero” carbon emissions by 20501.
The need to take account of our legally binding climate commitments when making transport policy
decisions has also been highlighted by the recent judgment by the courts in relation to expansion of
Heathrow airport.
This raises the question of what other areas of transport policy may be problematic for the
achievement of our climate commitments. One particular cause for concern is the large-scale road-
building programme. This paper uses carbon data reported by Highways England to make, for the first
time, a programme-level estimate of the likely carbon impact of the government’s second Road
Investment Strategy, RIS2. It considers the potential impact due to construction (including embodied
energy of construction materials), increases in vehicle speeds, and induced traffic, and compares the
likely carbon impact of RIS2 with total emissions from the motorway and trunk road Strategic Road
Network (SRN), and with a suggested carbon budget for the SRN.

                                                                                                     6
2. Why carbon emissions from the SRN matter
Transport is the UK’s worst-performing sector for carbon reduction, and the only sector where
greenhouse gas emissions are still going up, as shown in Figure 1. If emissions from international
aviation and shipping are included, it is now responsible for over a third of UK greenhouse gas
emissions.
Figure 1: Greenhouse gas emissions: transport is the only sector with emissions still going up2
300
250
Energy supply
200
Emissions (MtCO2e)
Transport
Business
150 Residential
Agriculture
Waste
100
Industrial
Public
50
0
1990 1995 2000 2005 2010 2015
Road transport accounts for the bulk (two-thirds) of total transport greenhouse gas emissions, or 91%
of domestic transport emissions. Emissions from the SRN account for two-fifths of all CO2 from road
transport in England, as shown in Figure 2. This means the SRN in England accounts for roughly a third
of the UK’s domestic transport emissions3. If we are to get transport emissions down, the emissions
from traffic on the SRN are a key target for action.
Figure 2: Road transport CO2 emissions by type of road in England, 20154
7The Climate Change Act (CCA) 2008 was amended in 2019 so that it now commits the UK to reduce
net carbon emissions to zero by 2050, as well as to five-year carbon budgets between now and then.
The Committee on Climate Change (CCC) has already shown that transport is not even on track to
comply with existing carbon budgets, and has called for all infrastructure decisions to be checked
against their consistency with the UK's Net Zero target5. We estimate that by 2032 the policy gap for
domestic transport will be around 60 MtCO2e and even higher for total transport6.
It might be thought that even if RIS2 increases carbon emissions over the medium term, this does not
matter because the shift from petrol and diesel to electric cars means that by 2050 the transport
network will be decarbonised. However, because of the longevity of carbon emissions in the
atmosphere, the catastrophic impacts of climate change can only be avoided by limiting our total
emissions between now and 2050 to stay within a total atmospheric carbon budget. Climate models
show a strong relationship between cumulative CO2 emissions and temperature rise. What matters is
the amount of CO2 that is emitted in every year between now and 2050 (i.e. the CCA carbon budgets),
not just the amount emitted in the final year. This is a key concept underpinning the IPCC’s 1.5-degree
report. This estimated the global carbon budgets and pathways to limit warming to 1.5°C above pre-
industrial levels in line with the Paris Climate Agreement, and explains why they consider the next
decade to be so important.
Because we have left it so late to act to reduce carbon emissions, we have very little carbon budget
remaining. Research by the Tyndall Centre for Climate Research suggests that if a global carbon budget
consistent with the Paris Climate Agreement is divided fairly between all countries and all sectors, the
carbon budget for the UK car sector is equivalent to just 7-8 years of current carbon emissions7. Other
researchers agree that remaining within a fair carbon budget for the period to 2050 requires deep and
rapid cuts in carbon emissions over the next 10 years in the UK8 9.
The government is currently consulting informally on bringing forward the end-date for sales of new
petrol and diesel cars to 2035. If this happens, the majority (around 65%) of cars on the road in 2030
will still be petrol and diesel. In order to stay within a Paris-compliant fair carbon budget, we estimate
we will need to make cuts in car traffic of around 40-50% by 2030 compared to current traffic levels.
Under other scenarios for the rate of take-up of electric cars, the scale of traffic reduction that is
needed by 2030 in order to stay within a Paris-compliant fair carbon budget ranges from 20% to 60%10.
These findings are consistent with the conclusion of a recent report from the Centre for Research in
Energy Demand Solutions (CREDS) that “a reduction in CO2 emissions from transport by technology,
without changing demand, [does] not appear to be based on a realistic assessment of what is
practically possible”11.
In this situation, any RIS2 investment that increases carbon emissions from the transport sector is
impossible to justify. The challenge of achieving even a 20% cut in car mileage is so large that we
cannot afford to make the problem worse. This message has been echoed by Chris Stark, CEO of the
CCC, who has said: “The government mustn’t be investing in anything likely to increase carbon
emissions… I would spend the roads budget on fibre. You would get a huge return to the economy with
people having better connections.”12
83. A suggested carbon budget for the SRN
Government departments and agencies such as Highways England have no carbon budget, or any plan
to show how they will stay within their budget13. This means that there is nothing against which the
carbon emissions from RIS2 can be judged.
However, the government’s latest road traffic forecasts show that (even without RIS2) carbon
emissions from the SRN will not fall fast enough to achieve “net zero” emissions by 2050 (Figure 3). In
a reference scenario (RTF Scenario 1), emissions from the SRN only fall by 14% between 2020 and
2050. Even in the best performing scenario with rapid uptake of electric vehicles (RTF Scenario 7 which
assumes all car and LGVs sold are zero exhaust emission by 2040), emissions only fall by two-thirds
(67%) by 2050.
We suggest a binding carbon budget for the whole transport sector14, including the SRN, will need to
be adopted soon, in order for the DfT Decarbonisation Strategy to be credible. To be consistent with
the Paris Climate Agreement, it is likely to require a reduction in emissions similar to that calculated
for local authorities by the Tyndall Centre for Climate Change, at around 10-16% year-on-year15. The
change in annual emissions from the SRN using a 13% annual reduction (i.e. in the middle of this range)
is shown in Figure 3. This provides a basis against which the potential effect of RIS2 can be compared.
Figure 3: Forecast CO2 emissions from traffic on the SRN compared to proposed carbon budget for
the SRN
40
35
30
25
MtCO2
20
15
10
5
0
RTF Scenario 1 - reference scenario
RTF Scenario 7 - rapid uptake of EVs
Proposed carbon budget for SRN: 13% year-on-year reduction
Source: Department for Transport (2018) Road Traffic Forecasts. Forecasts take account of all fully committed road schemes
implemented as part of RIS1, but not the RIS2 schemes (or any further road building in RIS3).
9Table 1 shows how our proposed carbon budget for the SRN compares with forecast emissions, for
the crucial period up to the end of 2032. We have chosen this end date to align with the CCC’s 5-year
carbon budget periods (running up to the end of their fifth carbon budget period). Using the DfT road
traffic forecast with rapid take-up of electric vehicles (RTF Scenario 7), we calculate that total carbon
emissions from the SRN between now and 2032 will be 381 MtCO2. A fair, Paris-compliant carbon
budget for the SRN would be about 214 MtCO2. This means that we need to cut total carbon emissions
from the SRN over the next 12 years by about 167 MtCO2, or 44% of forecast levels, even compared
to the most optimistic forecast of how emissions will change with rapid uptake of electric vehicles.i
Table 1: How a proposed Paris-compliant carbon budget for the SRN compares to forecast emissions
Total emissions, MtCO2
2020 - 2032
Forecast, assuming rapid uptake of EVs (RTF Scenario 7) 381
Paris-compliant carbon budget 214
Necessary reduction in emissions 167 (44%)
i
Even if the ban on ICE cars/vans is brought forward from 2040 to 2035 the majority (ca. 65%) of vehicles on the
road in 2030 will still be petrol/diesel fuelled. While an earlier ban will reduce forecast emissions from the SRN
the main impacts of this policy will not be felt until after 2030, and by itself will not be sufficient to meet carbon
budgets. In 2030 we estimate it will reduce UK car emissions by less than 5 MtCO2e compared to a 2040 ban.
104. Current approach to assessing carbon impacts of road schemes
At present, the carbon impact of the roads programme is considered at the level of individual road
schemes, but there is no assessment for the programme as a whole16. Carbon impacts of individual
schemes are predicted as part of the appraisal of a scheme, and reported in the Environmental
Statement. This figure is then monetised and added into calculations for a scheme’s Benefit Cost Ratio.
For schemes designed to alleviate severe congestion, it is possible that there could be carbon emission
reductions (at least in the short-term). However, based on our assessment of reports and evaluations
about schemes (see section 6), most schemes are expected to result in carbon emission increases.
We discuss below why we believe that these carbon increases are often under-estimated.
Nevertheless, the estimates of additional CO2 resulting from some RIS1 and proposed RIS2 schemes
are very substantial, even according to Highways England’s own figures. Some of the more egregious
examples are the Lower Thames Crossing, which Highways England predicts will increase carbon
emissions by 5.7 MtCO2 over its 60-year life; A303 Stonehenge (+1.95 MtCO2); A1 Cambridge to
Huntingdon (+1.4 MtCO2); and M42 Junction 6 (+0.6MtCO2). The lifetime emissions from these five
schemes alone are equivalent to the annual emissions from 4.4 million carsii.
As far as we are able to tell from the road schemes we have reviewed, the conclusion of the
Environmental Statement is always that any change in emissions resulting from the scheme is small
relative to the total carbon emissions of the economy, and therefore not relevant to the decision to
grant consent for the scheme. Government policy in fact requires that the carbon impact of any
individual road scheme should only be treated as a material factor in deciding whether the scheme
should go ahead if “the increase in carbon emissions resulting from the proposed scheme [is] so
significant that it would have a material impact on the ability of government to meet its carbon
reduction targets”17.
This approach remains unchanged even after the net zero legislation, Heathrow judgement and DfT’s
consultation on decarbonisation18.
Some examples of conclusions in Environmental Statements are summarised in Table 2.
For example, a recent Environmental Statement for the A38 Derby Junctions scheme concludes that
total emissions as a result of the scheme during the period 2023-2027 will be roughly 87 ktCO2e,
compared to a total carbon budget for the whole UK economy over the same period of 1,950 MtCO2e.
This is a proportion of 0.004%, and so the Environmental Statement concludes that the increased
carbon emissions from the scheme do not have a material impact on UK carbon reduction targets19.
ii
Based on the emissions of an average petrol car and average mileage per car in 2018.
11Table 2: Typical findings from Environmental Statements about the carbon impact of road schemes
Road scheme Region Comment in Environmental Statement
A585 Windy NW “This increase in emissions as a result of the Scheme would be
Harbour to Skippool negligible, and therefore, effects would be Not Significant.”
A1 Birtley to NE “Based on professional judgement, the magnitude of change in GHG
Coalhouse emissions is considered to be negligible. The Scheme with the
Allerdene embankment option is therefore expected to have a slight
adverse effect (not significant) on climate.”
M42 Junction 6 WM “The assessment has identified that the emissions arising as a result
of the Scheme represent less than 0.006% of the total emissions in
any five year UK carbon budget during which they would arise.
Accordingly, the assessment has concluded that the GHG emissions
impact of the Scheme would not have a material impact on the UK
Government meeting its carbon reduction targets.”
M54 to M6 Link Rd WM “Indeed, emissions arising as a result of the Scheme represent less
than 0.01% of total emissions in any five-year carbon budget during
which they arise. In this context, it is concluded that the GHG impact
of the Scheme would not have a material impact on carbon reduction
targets as set by the UK government.”
A38 Derby EM “Indeed emissions arising as a result of the Scheme represent less
than 0.01% of total emissions in any five year carbon budget during
which they arise. In this context, it is concluded that the GHG impact
of the Scheme would not have a material impact on carbon reduction
targets as set by the UK government.”
A14 Cambridge to E “The additional operational emissions of the scheme represent only
Huntingdon 0.0043% and 0.012% of the third and fourth national carbon budgets
respectively. Those percentages are considered to be negligible and
have no bearing on the likely achievement of the relevant policy
objectives.”
A303 Stonehenge SW “Indeed emissions arising as a result of the Scheme represent less
than 0.03% of total emissions in any five year carbon budget during
which they arise. In this context it is concluded that the GHG impact
of the Scheme would not have a material impact on the Government
meeting its carbon reduction targets.”
A27 Arundel Bypass SE “..all Scheme options represent less than 0.004% of any of the current
UK carbon budgets. All Scheme options represent between 0.07 and
0.14% of emissions from West Sussex in 2016, and less than 0.5% of
emissions from West Sussex A roads in 2016.” [Tables 14-29 and 14-
30 assesses significance as ranging from negligible adverse to
moderate adverse]
Lower Thames SE “In the context of the total UK emissions from transport modes
Crossing presented in Table 16.4, and the UK carbon budget, it is considered
unlikely that the Project alone would have a significant adverse effect
on climate change. However further calculations to determine carbon
emissions during the operational phase of the Project, including
cumulative effects, will be undertaken and reported within the ES.”
12There are three flaws with the current approach to assessing the carbon impacts of individual road
schemes. First, the denominator (i.e. the comparison with emissions across the whole economy) is
inappropriate, since it is true of almost any single investment that its impact is small relative to the
emissions of the economy as a whole. There should be a strategic assessment which looks at the
carbon emissions from the whole programme in the context of a transport carbon budget. At the
scheme level, a comparison with a Paris-compliant carbon budget for road transport emissions in the
local authority area in which the scheme is proposed would be more relevant.
Second, the denominator used for this comparison is in any event out of date and too high, as it was
set before the Paris Agreement and the government legislated for net zero emissions by 2050 and is
based on out of date carbon budgets.
And finally, the method used to assess a scheme’s carbon impact does not take full account of likely
increases in emissions over time due to induced traffic and car-based development, and so the carbon
impact is systematically under-estimated. The failure of transport modelling to properly account for
induced traffic is a longstanding concern, and we summarise in Table 3 the main issues as they relate
to assessment of the carbon impact of road schemes. More detail on these points is given in section
6.3.
Table 3: How evaluation and appraisal underestimate carbon emissions from induced traffic
Post-opening When Highways England evaluates whether a new road scheme has caused
project induced traffic, it compares actual traffic volumes after construction to a
evaluation prediction of what would have happened to traffic “without” the scheme.
(POPE) is not However, the prediction of what would have happened without the scheme is
robust based on inaccurate forecasts which systematically overstate the general rate of
traffic growth. The evaluation thus understates the amount of induced traffic, i.e.
the difference between traffic volumes “without” and “with” the scheme.
Modelling is When a road scheme is proposed, the effect of it on specific behavioural
more of an art responses is modelled. Models always allow for route changes, and generally
than a science consider changes in mode and destination. But models are weaker in taking
account of more complex changes – for example, changes in car occupancy,
consequential land use, and effects on trip rates. These are exactly the features
which may lead to induced traffic. There is a lot of discretion for promoters to
judge qualitatively which features are important and should be modelled.
Long-term Post-opening project evaluation (POPE) only collects and analyses traffic flow data
effects are not for one and five years after a road scheme opens; and models are particularly poor
considered at taking account of longer term effects (such as changes in land-use facilitated by
changes in travel opportunities). This means that long-run induced traffic effects
are under-recorded and under-predicted.
135. Scale of the roads programme
Carbon emissions as a result of RIS2 are of growing concern because the programme itself is now
bigger than it has ever been, as shown in Figure 4.
In the six years to 2013, capital expenditure on the SRN averaged £1.6 billion per year (2018-19
prices)20.
In 2013, the Treasury signalled the government’s intention to “commit to the biggest programme of
investment in roads since the 1970s”21. DfT subsequently allocated more than £15 billion to Highways
England for the first Road Investment Strategy, RIS1, covering the period between 2015 and 202022.
This budget covered both capital expenditure and operational costs. From 2014-15 to 2018-19,
outturn capital expenditure averaged £2.3 billion per year (in 2018-19 prices).
Figure 4: Real-terms capital expenditure on the Strategic Road Network in England (£billions)
5
pre-RIS1 RIS1
4
average £1.6b average £2.3b
per year per year
Expenditure £billions
3
2 RIS2
average £4.2b
per year
1
0
2008-9 2010-11 2012-13 2014-15 2016-17 2018-19 2020-21 2022-23 2024-25
Data from 2008-09 to 2018-19 is for national roads in England funded by central government, from Country and Regional
Analysis Interactive Tables adjusted to 2018-19 prices. Data for 2020-21 to 2024-25 from RIS2 Statement of Funds Available.
In the autumn 2018 budget, the Chancellor went further, announcing that the government would
deliver “the largest ever strategic roads investment package from 2020-2025”23 [our italics]. Income
from Vehicle Excise Duty was ring-fenced to form a National Roads Fund to pay for this. Budget 2020
confirmed that RIS2 would cost £27.4 billion over five years (see Table 4). Total capital expenditure
would average £4.2 billion per year. Of this, £14.2 billion (average £2.8 billion per year) was allocated
to be for capital enhancements i.e. road schemes.
Highways England’s draft Strategic Business Plan presumes that funding will continue at the high level
set by RIS2 until at least 2034/35. The Office for Rail and Road’s Efficiency Review of RIS224 shows that
Highways England is working to create a pipeline of road schemes which will lead to expenditure of
over £28 billion in RIS3 (2025/26 – 2029/30) and over £31 billion in RIS4 (2030/31 – 2034/35).
14Table 4: RIS2 Statement of Funds Available
Item (£000s) 2020/21 2021/22 2022/23 2023/24 2024/25 Total
Operations, Resource 1,201 1,160 1,199 1,221 1,293 6,074
maintenance,
renewals and Capital 1,098 1,145 1,113 1,276 1,193 5,825
business costs
Capital enhancements 2,475 3,076 2,980 2,885 2,702 14,118
Designated funds 159 169 174 184 184 870
Preparing for RIS3 39 59 107 142 124 472
RIS2 Total 4,973 5,609 5,572 5,708 5,496 27,358
Source: DfT (2020) Road Investment Strategy 2: 2020-2025. Funding for road schemes is highlighted in grey.
The National Roads Fund (announced in 2014 but still not legislated) is also intended to provide £3.5
billion for road schemes on local authority roads, through a Major Road Network programme and a
Large Local Majors programme25. This funding will be provided over the same period as RIS2 (2020-
2025), but has not yet been allocated between years. It is in addition to an extra £2.5 billion for local
road maintenance, announced in the Spring 2020 Budget26.
Other government funding streams are also being used for road-building. For example, we estimate
that the Housing Infrastructure Fund may provide additional funding for road schemes of about £1.8
billion between 2018-19 and 2023-2427. There is also significant government funding for road schemes
via the Local Enterprise Partnerships (LEPS)28.
This increase in spending on roads represents a huge opportunity cost in terms of foregone investment
in active and sustainable travel, at a time when we need to rapidly reduce carbon and other impacts
of road traffic.
1516
6.          How RIS2 schemes will affect carbon emissions
RIS2 road schemes will increase carbon emissions in several ways. Some impacts are one-off; some
are ongoing at about the same level; and some are both ongoing and increase over time. Table 5
summarises the main factors, and indicates which of these are probably already accounted for in
Highways England’s estimates, and which are likely to be underestimated.

Table 5: How RIS2 road schemes will affect carbon emissions
 Factor         Accounted Description
                 for in HE
                 estimates
      Land               Y          If there is extensive land clearance and many mature trees are felled,
      clearance                     a carbon ‘sink’ will be removed. Over the medium term (e.g. between
                                    now and 2030), it is not possible to offset this by replacement
                                    planting of saplings, which will take many years to mature and
                                    capture significant amounts of carbon.
      Construction       Y          One-off impact of embodied carbon in the steel, concrete, asphalt
      materials                     and other raw materials used to build the road.
      Construction       Y          There are emissions associated with fuel, electricity and water used
      activity                      to clear the site and build the road, as well as fuel used to transport
                                    workers, materials and waste to and from the site.
      Vehicle            Y          Once a road is completed, it may increase vehicle speeds. Carbon
      speed                         emissions for petrol / diesel vehicles are lowest at speeds of about
                                    40mph. An increase in average speed from 60mph to 70mph causes
                                    carbon emissions to rise by about 13%29. This is an ongoing impactiii.
                                    In congested locations with average speeds below 40mph, a road
                                    scheme that increases speeds to around 40mph could temporarily
                                    reduce speed-related emissions – at least, until induced traffic causes
                                    average speeds to fall back to the original level.
      Induced            N          Over the medium- to long-term, roads which increase the capacity of
      traffic                       the network are likely to result in increases in traffic volume, relative
                       (may be
                                    to what would have happened if the road had not been built. This is
                       partially
                                    due to a combination of factors: mode change, destination change,
                      taken into
                                    trip frequency change, and changes in land use as the road opens up
                     account for
                                    land for car-dependent development such as housing estates, retail
                        some
                                    parks and business parks. The carbon impact of this induced traffic is
                      schemes)
                                    ongoing and increases over time.
      Large-scale        N          At a regional level, the combined effect of all new road schemes on
      regional                      traffic volumes, and therefore carbon emissions, may be
      effects                       substantially greater than the sum of the effects of each individual
                                    scheme. For example, dualling individual sections of a single-
                                    carriageway A-road may have a fairly modest impact on traffic
                                    volumes until such time as the road is dualled from end to end, at
                                    which point it may quite quickly attract large amounts of extra traffic.

iii
  It also has an effect on casualty rates, as highlighted in a recent British Medical Journal issue, which argued for
a reduction in speed limits on main roads to 50mph in order to free up health service capacity for COVID-19
work.

                                                                                                                  17
This was seen in the case of the Newbury bypass, which was the final
‘upgrade’ on a N-S corridor: traffic volumes on the new road and the
existing road jumped by almost 30% within a year of scheme
completion30.
Cumulatively these carbon impacts across the RIS2 programme are significant but are currently not
assessed and effectively ignored. We used two sources of official information to estimate the overall
effect of these factors for the whole of the RIS2 programme:
Publicly-available Environmental Statements for RIS road schemes, downloaded from the
website of the Planning Inspectorate31. These are available for a relatively small number of
schemes (15 with suitable data for our analysis). Most include an assessment of carbon
emissions from construction. They also include modelled change in carbon emissions due to
use (reflecting modelling assumptions about changes in vehicle speeds, but, as noted above,
probably significantly underestimating induced traffic and not taking account of large-scale
regional effects). Estimated changes in emissions in use are typically reported for the scheme
opening year and the “design year” 15 years later, though sometimes a total over 60 years of
the lifetime of the scheme is reported as well or instead of these annual figures.
Post-opening project evaluation (POPE) reports for all Highways England road schemes.
These are available for 87 road schemes built over the last two decades. The “One Year After”
and subsequent “Five Year After” POPEs estimate the outturn change in carbon emissions in
the scheme opening year (relative to what would have happened “without” the scheme). This
takes account of changes in vehicle speeds (and also link length and traffic composition), but
since it is for the scheme opening year, cannot take account of medium- or long-run induced
traffic or large-scale regional effects (and probably also underestimates short-run induced
traffic). Total carbon emissions in the scheme opening year are also reported, and we make
use of these figures to estimate plausible emissions from medium-to-long run induced traffic.
We made the assumption that the road schemes that will form RIS2 are likely to be broadly similar to
the schemes built by Highways England in the recent past, and that the main differences are the
increased scale of funding for the programme, and the improvement in average vehicle efficiencies.
6.1 Carbon emissions from construction
Most Environmental Statements for planned road schemes include an assessment of the one-off
increase in carbon emissions from construction.
The construction impacts of road building arise from land use changes (e.g. site clearance and loss of
trees, disturbance of soil); embodied emissions associated with the materials (e.g. steel, concrete,
asphalt); fuel, electricity and water associated with plant and equipment used in clearance and
construction; travel of construction workers to the site; and transport of construction materials and
waste. These emissions are generally estimated using the Highways England Carbon Tool32 (published
in 2015 and updated in 2019) and guidance set out in a British Standards Institute specification33.
Relevant chapters of all publicly available Environmental Statements for Highways England road
schemes were downloaded from the Planning Inspectorate websiteiv. Of these, 11 (with a combined
iv
Most of the publicly available Environmental Statements for road schemes on the SRN form part of the RIS2
programme. A few are formally “RIS1 schemes” in terms of their funding, but are now programmed for
construction during the RIS2 time period.
18cost of £5.3 billion) reported CO2 emissions from construction. Embodied emissions accounted for
31% - 97% of the total greenhouse gas emissions from construction of the road schemes, with an
average of around 70%. Construction carbon ranged from 60-730 tCO2e per £1 million expenditure,
with an average of 456 tCO2e per £1 million.
If we assume that these 11 schemes are representative of the likely construction impact of RIS2
schemes, the £14,118 million expenditure on RIS2 road schemes will generate around 6.4 MtCO2e
from construction.
6.2 Carbon emissions from changes in vehicle speeds
Eighty out of the 87 schemes for which a POPE was available included an assessment of the change in
carbon emissions in the scheme opening year due to the scheme. Reported changes in carbon
emissions increased for 72 schemes and went down for 8 schemes.
For most schemes, the method used to estimate changes in emissions is a simple spreadsheet model34.
It takes account of changes in average speeds “with” versus “without” the scheme, and also of any
changes in road length and traffic composition. While it is reported that the method also takes account
of changes in traffic flows (“with” versus “without” the scheme), medium- to long-term induced traffic
effects cannot be included, since the calculation is for the scheme opening year. It is also unlikely that
the method takes full account of short-term induced traffic effects, for reasons noted in Table 3 above
and discussed further in section 6.3. Emissions due to scheme construction are not included.
Essentially, this means that we can treat the reported change in emissions in the scheme opening year
as being largely the result of changes in average vehicle speeds.
For each scheme, we factored the reported change in opening year carbon emissions downwards, to
reflect current (2018) average vehicle efficiencies. For example, emissions from schemes completed
in 2003 were factored downwards by 0.88; emissions from schemes completed in 2010 were factored
downwards by 0.94. These factors were calculated using UK CO2 emissions from all road travel, and
road traffic vehicle kilometres for all vehicles, for each year from 2002 to 201835.
Added together, the scheme opening year change in emissions from all 80 schemes, adjusted to reflect
current vehicle efficiencies, totalled 389 ktCO2. Expenditure on these schemes was £7.9 billion (in 2020
prices). These figures give an increase in scheme opening year emissions of 49 tCO2 for each £1 million
expenditure (in 2020 prices).
This increase in emissions is ongoing i.e. it will occur not just in the scheme opening year but also in
subsequent years. However, emissions in subsequent years will fall due to improvements in vehicle
efficiency. We used the DfT Road Traffic Forecasts (RTF) to estimate by how much the annual change
in emissions would fall in each year between 2020 and 2032 (i.e. the period for which we propose a
Highways England carbon budget). Using RTF Scenario 1 (the “reference scenario”), average emissions
would fall by 21% between 2020 and 2032. Using RTF Scenario 7 (with the most rapid growth in use
of electric vehicles), emissions would fall by 41%.
Cumulative emissions between 2020 and 2032 were calculated, for each £1 million capital
enhancement expenditure in each year of RIS2, on the assumption that the carbon effect of changes
in speed, link length and traffic composition is ongoing, but diminishes over time due to improving
average vehicle efficiency. The results are shown in Table 6. Expenditure early in the RIS2 period has
a larger cumulative effect in the period of interest (2020 to 2032) than expenditure later on. The
additional emissions between 2020 and 2032 are calculated as 6.6 MtCO2 using vehicle efficiency
factors based on RTF Scenario 1, or 5.9 MtCO2 using vehicle efficiency factors based on RTF Scenario
7.
19Table 6: RIS2 expenditure, and cumulative CO2 emissions between 2020 and 2032 due to changes in
vehicle speed, link length and traffic composition from schemes built in each year of RIS2
Year of scheme construction 2020 2021 2022 2023 2024 TOTAL
RIS2 capital enhancement
2,475 3,076 2,980 2,885 2,702 14,118
expenditure £m
Cumulative RTF Scenario 1 1.39 1.58 1.38 1.21 1.00 6.56
emissions
(Mt CO2) RTF Scenario 7 1.28 1.44 1.25 1.08 0.89 5.95
We cross-checked this estimate from completed road schemes against modelled predictions from RIS
road scheme Environmental Statements.
A total of 12 publicly available Environmental Statements included predicted CO2 emissions from
operation in the scheme opening year and the “design” year (15 years later). These 12 schemes
overlapped with, but were not identical to, the ones for which construction emissions were reported
(see section 6.1) and had a combined cost of £5.2 billion.
The modelled changes in CO2 emissions (“with” versus “without” the scheme) in the scheme opening
year and “design” year enabled us to estimate the change in emissions for intervening years by
interpolation. The modelling appears to take account of changes in average speed, link length and
traffic composition. Given the extended time period that is being modelled, it is possible that some
element of induced traffic has been taken into account. However, the change in annual emissions over
this period is very small for most schemes, suggesting that, in most cases, (with the single exception
of the A303 Stonehenge scheme), little or no induced traffic has been allowed for. Cumulative
emissions were calculated for each scheme over 13 years (equivalent to the 13 years from 2020-2032
inclusive for which emissions were estimated using POPE data from completed road schemes).
Cumulative emissions over this period ranged from -35 to +1754 tCO2e per £1 million, with an average
of 410 tCO2e per £1 million. If this average is applied to the £14,118 million RIS2 road schemes, it
suggests cumulative emissions from operation of 5.8 MtCO2e over 13 years, which is similar to the
estimates in Table 6 (although note that it is not exactly equivalent because the calculations shown in
Table 6 are based on staggered expenditure over a five year period). This cross-check suggests that
our earlier estimate is plausible.
6.3 Carbon emissions from induced traffic
As noted earlier, changes in carbon emissions in the scheme opening year reported in POPEs are likely
to underestimate any short-term induced traffic effects, and take no account of medium- to long-term
induced traffic.
The method used in the POPEs to estimate traffic flows “with” the scheme versus those “without”
relies on national road traffic forecasts to predict what traffic flows would have been expected if the
scheme had not been built. This is a form of evaluation which is categorised by the government’s
Magenta Book guidance on evaluation as “weaker / riskier”36, because there is no comparison with
changes in traffic flows at similar locations where no road building has occurred. Since national road
traffic forecasts have repeatedly over-estimated traffic growth, using a “do-nothing” forecast as the
counterfactual is highly unreliable, and is likely to substantially understate the amount of induced
traffic. This is the main reason why Highways England argue that their POPEs show relatively little
evidence of induced traffic. For example, a recent “meta-insights” paper by Highways England
20examined the POPEs for a sample of 71 schemes, and (using this “weaker / riskier” research design)
concluded that evidence of induced traffic was observed in only a quarter (24%) of schemes37.
A further weakness of the Highways England POPE methodology is that no evaluation of longer-term
induced traffic effects, over periods of more than five years, is undertaken. Since large-scale regional
induced traffic effects may occur over much longer time periods of a decade or more, the POPE meta-
insights finding that only a minority of schemes show evidence of induced traffic is more likely
“absence of a search for evidence” rather than “evidence of absence”.
In an earlier study, we evaluated changes in traffic flows from road schemes by comparing with
regional and county-level traffic trends38. In a sample of nine schemes across England, plus four longer-
term case study schemes, use of this method found evidence of induced traffic (defined as traffic
growing in the scheme corridor at a higher rate than in the relevant region and county) for all 13
schemes. The rate of traffic growth in excess of background regional / county trends was fairly modest
in the short-term (averaging about 7% over periods of 3-7 years) but much larger in the longer-term
(averaging about 40% over periods of up to 20 years). The combined data from these 13 schemes
suggests induced traffic might on average increase at around 2% per year, although it would be
expected that some schemes might show higher rates, and some lower. However, it should be noted
that the time period on which this estimate is based includes the 2008 economic downturn, following
which there was a hiatus in new development. It may therefore be an underestimate of the amount
of induced traffic in periods of normal economic activity.
These findings are consistent with analysis in 1994 by the Standing Advisory Committee on Trunk Road
Assessment (SACTRA) on trunk roads and the generation of traffic39. SACTRA reported 11 before-and-
after studies in which traffic levels were compared with background general traffic growth, or with
growth on specific control (unimproved) roads in the same area. In every case, the growth rate in the
corridor of the scheme was substantially greater than that on the roads used as controls, and greater
than background growth rates, with an unweighted average of “unexplained” growth of 25%, and a
range from 7% to 66%. The unweighted average of the growth rates over less than a year was 9.5%,
increasing to 33% after 5 years.
More recently, a 2018 evidence review on induced traffic, commissioned by DfT to inform the
development of RIS2, supports the findings of the SACTRA report on induced traffic40. It also notes the
inaccuracy of “do-nothing” scheme forecasts, citing a statistical analysis of 20 road projects in the UK
and 15 in Denmark, for which the “do-nothing” case could be empirically established (for example,
schemes for which “do-nothing” forecasts were made, the scheme was cancelled, and “do-nothing”
outcomes could then be observed). A systematic bias was found towards overstating the forecast of
“do-nothing” demand.
In order to estimate the possible effect of induced traffic on carbon emissions at the programme level
for RIS2, we checked the POPEs for all 87 road schemes for the total carbon emissions in the scheme
opening year. POPEs for 63 schemes reported this figure (a subset of the 80 schemes for which the
change in carbon emissions was reported).
For each scheme, we factored total carbon emissions in the opening year downwards to reflect current
average vehicle efficiencies, in the same way as described in section 6.2. Opening year total emissions
from all 63 schemes, adjusted to reflect current vehicle efficiencies, were 4.2 MtCO2, and expenditure
on these schemes was £6.9 billion (in 2020 prices). These figures give an opening year figure of 613
tonnes CO2 for each £1 million expenditure (in 2020 prices).
We made the assumption that induced traffic would be zero in the year the scheme was completed;
2% of opening year traffic in the year after the scheme was completed; and rising by 2% per year to
2124% of opening year traffic 12 years after scheme completion. We then used the same assumptions
from RTF Scenarios 1 and 7 described in section 6.2 to estimate cumulative emissions due to induced
traffic for the period between 2020 and 2032, for each £1 million expenditure in each year of RIS2,
assuming, as before, that the carbon effect of each extra kilometre of induced traffic would diminish
over time due to improvements in vehicle efficiency. The results are shown in Table 7. As before,
expenditure early in the RIS2 period has a larger cumulative effect in the period of interest (2020 to
2032) than expenditure later on. The additional emissions between 2020 and 2032 are 8.0 MtCO2
using vehicle efficiency factors based on RTF Scenario 1 or 6.9 MtCO2 using vehicle efficiency factors
based on RTF Scenario 7.
These figures are sensitive to the assumed rate of increase of induced traffic. If induced traffic
increases at only 1% per year, additional emissions are 3.4 - 4.0 MtCO2, and if induced traffic increases
at 3% per year, additional emissions are 10.3 - 12.0 MtCO2. Induced traffic is likely to be higher if land
use planning policy is more permissive (i.e. allowing more out-of-town car-dependent development).
The shift towards more permissive planning policy by the current government means that it is
plausible that cumulative emissions from RIS2 could be in the higher range of 10 – 12 MtCO2.
Table 7: RIS2 expenditure, and cumulative CO2 emissions between 2020 and 2032 due to induced
traffic, from schemes built in each year of RIS2
Year of scheme construction 2020 2021 2022 2023 2024 TOTAL
RIS2 capital enhancement expenditure
2,475 3,076 2,980 2,885 2,702 14,118
£m
Cumulative RTF Scenario 1 1.98 2.07 1.66 1.31 0.97 7.99
emissions
(Mt CO2) RTF Scenario 7 1.74 1.80 1.43 1.11 0.82 6.89
227. Discussion and conclusions
Table 8 summarises our findings on the potential increase in carbon emissions due to RIS2 schemes.
RIS2 schemes could increase cumulative emissions from the SRN between 2020 and 2032 by around
19 – 21 MtCO2e, as a result of emissions from construction, higher speeds and induced trafficv.
This compares with our suggested Paris-compliant carbon budget for the SRN over the same period
of 214 MtCO2. The additional carbon emitted as a result of RIS2 could therefore use up around 10% of
the proposed carbon budget for the SRN over the crucial period when we most need to reduce our
carbon emissions.
Another way of putting this is that RIS2 will make carbon emissions from the SRN go up, by about 20
MtCO2, during a period when we need them to go down, by about 167 MtCO2.
Comparing forecast emissions from the SRN in RTF Scenarios 1 (the reference scenario) and 7 (the
high electric vehicle scenario) suggests that the estimated increase in CO2 from RIS2 will negate 80%
of the potential carbon savings from electric vehicles on the SRN (which is 25 MtCO2, i.e. 406 minus
381 MtCO2, between now and 2032). The roads programme will thus negate almost all of the effort
that will go into reducing SRN emissions by stimulating take-up of electric vehicles.
v
Note that estimates of increased emissions from higher speeds and induced traffic are for CO 2, but a small part
of the estimated emissions from construction is from other (non- CO2) greenhouse gases, and hence reported
as CO2e.
23This suggests that RIS2 is incompatible with our legal obligation to cut carbon emissions in line with
the CCA carbon budgets, the Paris Climate Agreement and the emerging principles for the DfT’s
decarbonisation plan. We therefore believe that RIS2 should be cancelled.
Highways England’s high expenditure on road schemes during RIS2 is set to continue, at a similar rate,
for at least a decade after the end of RIS2. This will lead to further increases in carbon emissions.
Table 8: Estimated carbon emissions from RIS2 compared with proposed carbon budget for the SRN
over the period 2020-2032
Cumulative carbon
emissions 2020-2032
(Mt CO2)
Forecast emissions from SRN (Scenarios 1, 7), 2020 - 2032 381 - 406
Proposed carbon budget for SRN 2020-2032 214
Emissions from RIS2 construction 6.4
Emissions from higher speeds on RIS2 roads 6.0 – 6.6
Emissions from induced traffic on RIS2 roads 6.9 – 8.0
Total increase in emissions from RIS2 19.3 – 21.0
Proportion of proposed SRN carbon budget 2020-2032 consumed by RIS2 9 – 10%
But it would be an illusion to think that merely cancelling the roads programme funding will of itself
mean we keep carbon emissions from the SRN within a Paris-compliant carbon budget. The scale of
emissions cuts that is required on the SRN in response to the climate emergency is extremely
challenging. We believe that it will only be possible through a combination of a faster switch to zero
exhaust emission vehicles than is currently being considered (e.g. requiring all new cars and vans to
be fully electric from 2030) and a significant reduction in vehicle mileage on the SRN. Further carbon
could be saved by reducing the speed limit on the SRN to 60mph, with camera enforcement.
Mileage reduction will require measures to restrict driving, such as road pricing41, better and more
affordable rail and coach services, improvements in conditions for active travel (since many journeys
on the SRN could be replaced by a combination of cycling and rail travel), better planning to prevent
car dependent development and universal roll-out of superfast broadband to support remote
working.
The reduction in traffic that would result from these policies would reduce the perceived need for
road building to alleviate congestion. At present, the roads programme only gets a (weak, disputed)
cost-benefit ‘justification’ due to the presumption that it will cater for traffic demand growth that will
happen anyway. If there are carbon-related (or congestion or health-related) reasons for policies that
reduce the growth in demand, the benefit-cost ratios for road schemes will drop, and much of the
roads programme will not be justified even on its own criteria. In other words, once the policy
imperative to reduce traffic mileage is accepted, cost-benefit analysis is unlikely to show RIS2 schemes
are value for money.
The COVID-19 pandemic has wrought enormous behaviour change, with both work and non-work
journeys replaced by a variety of video conferencing solutions and greater use of local facilities. In the
process, it has generated new debates – for example, about the time ‘wasted’ by commuting or
travelling to business meetings by those who have the flexibility to work remotely; about the benefit
24of families all being home in the early evening to eat meals together; about the potential to involve
more colleagues in work meetings, or people in different parts of the country in social events; about
the opportunity for more regular interactions with elderly relatives where a reliable teleconference
link is possible; about the role for local delivery services (both commercial and community-based) to
ensure vulnerable residents can access what they need; about the advantages/disadvantages of
people’s immediate local environments for taking daily exercise etc.. Whilst the lifting of lockdown is
likely to be welcomed, it is unlikely that things will revert to how they were before the pandemic.
Improved understanding of technology; experience of new ways of working and socialising; and a
greater appreciation of local environments will all affect future travel habits.
When rebuilding the economy, it is vital that investment helps to support behavioural shifts that
people may wish to maintain in the future for a wide variety of reasons, that can also help to achieve
reductions in carbon emissions.
In this new context, RIS2 is anachronistic. Instead, money saved by cancellation of RIS2 funding would
free up substantial investment for a variety of more efficient and low carbon ways of meeting our
everyday needs. In the short term, funding could be used to develop thousands of local ‘remote
working’ hubs. These would enable businesses to start to function again while maintaining social
distancing, would reduce the difficulties many people face when working at home, and would avoid
an increase in carbon emissions and congestion as commuters shift from public transport to car.
In the medium term, funding could enable universal superfast broadband, providing a more efficient
and low-carbon way of meeting our everyday needs. Even the President of the AA has recently been
quoted as supporting a shift in funding from road infrastructure to broadband services42. Funding
could also be used to improve active travel and public transport networks, thereby reducing
congestion on the SRN in a more effective, sustainable and permanent way.
One of the contributors to this paper has argued elsewhere that a complete rethink of the way the
road programme is appraised is now required, in order to take full account of carbon emissions43. This
should include appraisal of the programme as a whole; a new approach to appraisal of individual
schemes; and comparison of each scheme (and of the whole programme) with its alternatives. It
requires all of the following:
Strategic
Setting of a binding carbon budget for the SRN, and assessment of the cumulative impact of
RIS2 road investment against this carbon budget.
Recognising that legally-binding constraints on carbon emissions should take precedence over
economic trade-offs e.g. between more carbon and shorter journey times.
Appraisal and evaluation
Better evaluation of the short, medium and long-term impact of road schemes on induced
traffic, using a robust methodology to estimate the counterfactual, and incorporation into
scheme appraisal of realistic assumptions (derived from new evaluation evidence) about the
likely level of induced traffic from proposed schemes.
25You can also read