Sustainability in bicycle sharing systems: evidences of travel mode choice changings in Rio de Janeiro - Redalyc
←
→
Page content transcription
If your browser does not render page correctly, please read the page content below
Production
                                                             ISSN: 0103-6513
                                                             ISSN: 1980-5411
                                                             Associação Brasileira de Engenharia de Produção

Sustainability in bicycle sharing systems:
evidences of travel mode choice changings
in Rio de Janeiro
Vieira, Yesus Emmanuel Medeiros; Francisco, Fábio de Rezende; Silva Júnior, Orivalde Soares da;
Bandeira, Renata Albergaria; Leal, Jose Eugenio
Sustainability in bicycle sharing systems: evidences of travel mode choice changings in Rio de Janeiro
Production, vol. 30, 2020
Associação Brasileira de Engenharia de Produção
Available in: http://www.redalyc.org/articulo.oa?id=396762077027
DOI: 10.1590/0103-6513.20190068

                                PDF generated from XML JATS4R by Redalyc
                    Project academic non-profit, developed under the open access initiative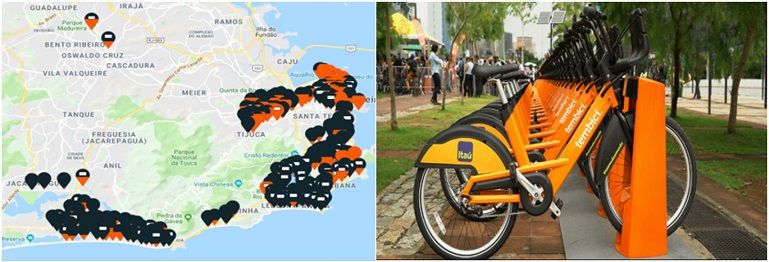
Thematic Section - Sustainability in Transportation and
Logistics
Sustainability in bicycle sharing
systems: evidences of travel mode choice
changings in Rio de Janeiro
Yesus Emmanuel Medeiros Vieira a*
Instituto Militar de Engenharia, Brasil
ORCID: hp://orcid.org/0000-0002-1335-5308
Fábio de Rezende Francisco a
Instituto Militar de Engenharia, Brasil
ORCID: hp://orcid.org/0000-0002-8647-5554
Orivalde Soares da Silva Júnior a
Instituto Militar de Engenharia, Brasil
ORCID: hp://orcid.org/0000-0003-0743-8024
Renata Albergaria Bandeira a
Production, vol. 30, 2020 Instituto Militar de Engenharia, Brasil
Associação Brasileira de Engenharia de ORCID: hp://orcid.org/0000-0002-2776-2473
Produção
Jose Eugenio Leal b
Received: 30 June 2019
Accepted: 07 July 2020 Pontifícia Universidade Católica do Rio de Janeiro, Brasil
DOI: 10.1590/0103-6513.20190068
ORCID: hp://orcid.org/0000-0002-7416-8987
Funding
Funding source: CAPES
Contract number: 001
CC BY Abstract
Paper aims: is study aims to analyze the travel behaviors changings and the emissions
reduction of CO2, CO, NOx and Particulate Matter (PM) promoted by the bicycle
sharing system in the city of Rio de Janeiro.
Originality: e bicycle sharing systems have been experiencing rapid development in
recent years, however, few empirical studies explore comprehensively the externalities
of bicycle sharing, seeking to quantify the impacts of this travel system type on urban
transport.
Research method: e research method used a modal distribution model calibrated
with stated preference interviews and travel data provided by Tembici company.
Main findings: Results indicated a reduction in 2018 CO2 emissions compared to
the existing system in 2014, not only because of the increase in the bicycle sharing
system offer, but also due to a higher transfer rates from motorized transport to bicycle,
particularly those originated from public transport and Transportation Network
Company (TNC) services.
Implications for theory and practice: Results reveal the bicycle sharing in the city of
Rio de Janeiro should be understood as a part of a process of adopting multimodality,
with effective reductions achieved by the incentive to change passenger’s travel behavior.
Keywords: Bike sharing system++ Environment benefits++ Nested logit model.
PDF generated from XML JATS4R by Redalyc
Project academic non-profit, developed under the open access initiative
Yesus Emmanuel Medeiros Vieira, et al. Sustainability in bicycle sharing systems: evidences of travel mode choice changings in Rio de Janeir...
1. Introduction
Passenger transport, as well as freight transport, plays a key role in urban
environments. However, in recent years, there has been an increase in the
levels of motorized individual transport in relation to public transport
(Observatório das Metrópoles, 2012), imposing externalities on society,
economy and the environment.
Urban transport in general, especially motorized individual transport,
requires the use of fossil fuels, generating thus negative environmental
impacts, such as the emission of greenhouse gases (GHG), air pollutants,
noise, public health problems, road damage, accidents, traffic congestion
and the excessive use of public spaces in cities. ese problems represent
challenges to public authorities and transport planners, who must address
such externalities in order to promote a better quality of life to local
population.
In this way, this theme has attracted the attention of the academy
in the search of sustainable solutions for urban passenger transport
(Campos, 2006; Litman, 2007; Guimarães & Leal Junior, 2017). Among
the proposed solutions, bicycle sharing has emerged as a viable and
sustainable transportation alternative and has received attention in recent
years (Wang & Zhou, 2017).
Bicycle sharing systems are oen implemented aiming to increase
mobility in the first and last miles of passenger transport to other modes
of transport, and thus reducing traffic congestion, energy consumption
and environmental impact in cities, as well as improving the quality of life
and urban population public health (Audikana et al., 2017). However,
few empirical studies explore comprehensively the externalities of bicycle
sharing, seeking to quantify the impacts of this type of travel system on
urban transport.
In this context, this present paper seeks to quantitatively assess the
externalities of bicycle sharing systems regarding its contribution to the
reduction of CO2, CO, NOx and Particulate Matter (PM) emissions in
the city of Rio de Janeiro, Brazil. e three mentioned pollutants are, in
the specific case of transport, among the ones that cause the most impact
in urban areas (D’Agosto & Ribeiro, 2009). Additionally, this study aims
to analyze travel behavior changings promoted by the bicycle sharing
system in the city of Rio de Janeiro, using a modal split model calibrated
with stated preference interviews and travel data provided by Tembici
Company.
e number of bike sharing is growing worldwide (Suchanek, 2018). In
Brazil, the municipality of Rio de Janeiro is the precursor of the national
system, started in October 2011 and currently operated by the Tembici
Company. Since then, bicycle sharing systems have been implemented
in several cities in Brazil: São Paulo, Rio de Janeiro, Salvador, Recife
e Porto Alegre. According to information from the Mobilize Website
(2018), about 13,5 million bicycle trips were made in 2017. is paper
is structured as follows: a history of the bicycle sharing system, the
estimation of environmental impacts and its use are presented in Section
PDF generated from XML JATS4R by Redalyc
Project academic non-profit, developed under the open access initiative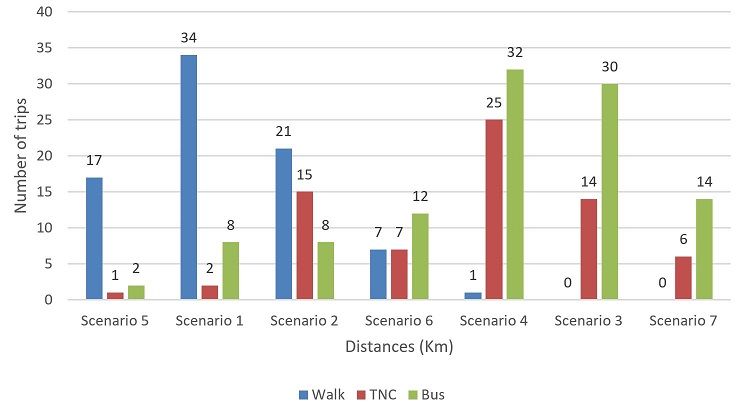
Production, 2020, vol. 30, ISSN: 0103-6513 / 1980-5411
2. Section 3 describes the methodology used in the calculation of CO2,
CO, NOx and Particulate Matter (PM) emissions. In Section 4, the
application of the proposed methodology in the bike sharing system in
the city of Rio de Janeiro is presented, as well as the assessment of results
obtained. Finally, Section 5 presents the conclusions, limitations of the
research and suggestions for future research.
2. A brief history on bike sharing and estimation of the
environmental benefits
e first initiative in the world involving the implementation of a Bike
Sharing System (BSS) was in Amsterdam in 1965. e system, called
White Bike, failed relatively quickly due to thes and vandalism, which
were facilitated by the fact that bicycles were not equipped with safety
features (DeMaio, 2009). is first generation of BSS was characterized
by the absence of a payment system or safety devices (Parkes et al. 2013).
e second generation appeared in 1995 in the city of Copenhagen
that consisted of a coin’s deposit system to perform the transport
payment. However, the the problems persisted (DeMaio, 2009). With
developments in security systems such as bicycle tracking and electronic
payment systems, risks have been reduced in the management of BSSs.
ese innovations, along with fixed anchoring stations enabled for
Internet & Communication Technologies (ICT), portray the third
generation of BSSs (Shaheen et al., 2014).
ere has been a growing interest of public managers in the benefits
associated with BSSs (Midgley, 2011; Shaheen et al., 2010). As a result,
there was a significant increase in third generation BSSs around the
world between 2004 and 2014, when the number of cities with bicycle
sharing systems rose from 13 to 855 (Fishman, 2016). ese cities
adopted different operation and prices schemes. In Netherlands, for
example, there is a single national bicycle sharing system, a program called
“OV-fiets”, which operates through the signature of “OV-chipkaart” -
a contactless smart card. In London, supported by private sector, the
Transport for London, responsible for BSSs system, allows the first 30
minutes to be subsidized with a payment of an access fee of £ 2.00 per
credit card. In North America, a Montreal-based company, PBSC Urban
Solutions, offers integrated BSS solutions (including bicycles, payment
stations, locking systems and smartphone applications) to various cities
such as Montreal and Toronto in Canada; Boston, New York and
Washington, D.C. in the USA; and Guadalajara and Toluca in Mexico.
In South America, the cities of Buenos Aires, Rio de Janeiro and Quito
have established partnerships with private entities to operate BSSs. In this
way, the fourth generation of BSSs has emerged. It includes features such
as solar-powered docking stations, power assisted bikes, transit smartcard
integration, and the use of smartphone applications for real-time updates
(Parkes et al., 2013). In June 2017, the company Urbo started to operate
dockless bicycle sharing programs in Ireland and across Europe.
PDF generated from XML JATS4R by Redalyc
Project academic non-profit, developed under the open access initiative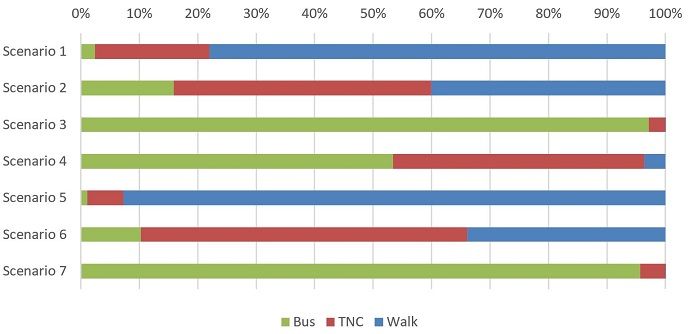
Yesus Emmanuel Medeiros Vieira, et al. Sustainability in bicycle sharing systems: evidences of travel mode choice changings in Rio de Janeir...
ere are a number of possible social, environmental and health
benefits associated with BSSs, such as: (1) reduction in traffic jam,
emissions of GHG, air pollutants and noise; (2) flexible mobility,
improved transport connection; (3) health promotion; and (4) customer
financial savings (Shaheen et al., 2010, 2013). Many of these benefits
assume that the implementation of BSSs has encouraged their users
to shi the mode of transportation of their trips, previously made by
motorized vehicles, for the use of bicycle. For end users the main perceived
benefits of BSSs are convenience and low travel cost (Fishman et al.,
2013). However, empirical evidence has not reached consensus if such an
assumption is actually based on reality (Midgley, 2011).
e first researches on the topic show general agreement with the
assumption that the launch of BSSs demonstrated an increase in global
cycling activities in urban areas. For instance, the percentage of trips made
by bicycles aer the launch of the BSSs increased from 0.75% in 2005
to 1.76% in 2007 in Barcelona, from 1.0% in 2001 to 2.5% in 2007 in
Paris and from 0.5% in 1995 to 2% in 2006 in Lyon (García-Palomares
et al., 2012). In addition, a BSS (OYBike) study in London revealed that
40% of the bike sharing system users previously traveled by cars (Noland
& Ishaque, 2006). On the other hand, Pucher et al. (2010) argued that
such results were inconclusive because, despite the fact that cycling has
been increasing in cities since the introduction of BSSs, the growth of
bicycle sharing mode may have been the result of the overall improvement
of bicycle facilities. Even so, DeMaio (2009) showed explicitly that the
BSS in Montreal was successful, reducing GHG emissions by more than
1,300 tons since its implementation in May 2009, although this figure
represents only 0.009% of total greenhouse gases emission from Montreal
(13.7 million tons of CO2 equivalent) (Pembinas Institute, 2019). A
recent study by Hamilton & Wichman (2018) revealed that BSSs reduced
neighborhood jam in Washington, D.C.
It is important to note that, although several cities around the world
have implemented BSSs to encourage the use of bicycles, the success
of this system relies on how end-user demand would be met (Frade &
Ribeiro, 2015; Wolf & Seebauer, 2014). For end users the main perceived
benefits of BSSs are convenience and low travel cost (Fishman et al.,
2013). It is noted that there has been no consensus on whether the launch
of BSSs has promoted the transfer of trips previously performed by motor
vehicles for bicycles.
Shaheen et al. (2011) conducted a survey of BSS users in Hangzhou,
verifying that 78% of respondents who owned their own cars used
public bicycles to replace their private vehicles. Among those interviewed
without a car in their homes, 20% used public bicycles as a substitute
for taxis. While this evidence suggests that BSSs are reducing vehicle
use, more research is required to determine its true impact on reducing
greenhouse gas emissions.
As noted by Fishman et al. (2013), a calculation of emission reductions
requires knowledge of the distance traveled using public bicycles, as
well as knowing the mode of transport that would have been used if
PDF generated from XML JATS4R by Redalyc
Project academic non-profit, developed under the open access initiativeProduction, 2020, vol. 30, ISSN: 0103-6513 / 1980-5411
the BSS not existed. Li et al. (2014) proposes a theoretical model that
suggests a bicycle sharing system can result in net emission reductions if
combined with a policy of taxing these emissions. e proposed model
considered a travel disutility function for the auto mode, that consists
on the following cost components: in-vehicle travel time, out-of-vehicle
walking time, (monetary) travel cost, and additional emission taxes. is
last term corresponds to a tax rate per unit of traffic emissions, which is
measured in dollars per kilogram. is model, however, was not applied
to an existing program. Zhang & Mi (2018), using big data techniques,
estimated the impacts of bicycle sharing on energy use and emissions
of carbon dioxide (CO2) and nitrogen oxide (NOX) in Shanghai from
a space-time perspective. By 2016, bicycle sharing in Shanghai saved
8,358 tons of gasoline and reduced CO2 and NOx emissions by 25,240
and 64 tons, respectively, representing 0.06% of total transportation
emissions (42 Mt). Qiu & He (2018) estimate the impacts of bicycle
sharing on economy, energy use, environment and public health. e
empirical results show that bicycle sharing programs have significant
positive externalities. In addition, CO2 emissions from road transport in
Beijing would decrease by almost 616.04 thousand tons, and emissions
of SO2, NO2 and CO would decrease by 22.50, 58.64 and 1586.66 tons,
respectively, when compared to year 2015.
Although most of the papers and reports suggest that BSSs promote
environmental benefits in terms of GHG and air pollutants emission,
due to the replacement of cars by active transport, few demonstrate
quantitatively this reduction. us, this article proposes to quantify the
environmental benefits in terms of CO2, CO, PM and NOx emissions
reduction due to the use of the BBS in Rio de Janeiro, BikeRio. CO2 is
the main GHG, while atmospheric pollutants act locally and therefore
have a greater impact on urban areas, are CO, NOx and PM (D’Agosto
& Ribeiro, 2009).
3. Methodology and data collection
In this section, we present a contextualization of the study area, as well as
the data collection process. Besides, it is presented the proposed method
for estimating the reduction of GHG and Atmospheric Pollutants
emissions due to the modal shi to the BSS.
3.1. Area of study and data collection
With an area of 1,255 km2 and a population of 6.68 million, Rio de
Janeiro is the second largest city and the main international tourist
destination in Brazil, representing one of the largest economic, cultural
and financial centers in the country.
e BSS in the city of Rio de Janeiro, called BikeRio, was released
in October 2011 in the South, North and West Zones of the city,
through a partnership between Rio de Janeiro City Hall and Itaú Bank,
PDF generated from XML JATS4R by Redalyc
Project academic non-profit, developed under the open access initiativeYesus Emmanuel Medeiros Vieira, et al. Sustainability in bicycle sharing systems: evidences of travel mode choice changings in Rio de Janeir...
and it is operated by the Serttel concessionaire. e system currently
has more than 2,600 bicycles available at 193 dock stations in Ipanema,
Copacabana, Leblon, Urca, Centro, Lagoa, Botafogo, Flamengo, Jardim
Botânico, Gávea and other neighborhoods of the North and West
Zone. In February 2018, the system was replaced by Itaú Bike, with
the bicycles and technology provided by the Canadian company PBSC
Urban Solutions and operated by Tembici Company.
Currently, Itaú Bike has stations in the North Zone, in the Center
of Rio and in Port Zone, interconnecting with the already existing
system in South Zone. Recently, this service was implemented in the
regions of Barra da Tijuca and Recreio dos Bandeirantes, interconnecting
them, according to the existing bicycle routes, with the local beaches,
commercial points, and shopping malls, in addition to the BRT
TransCarioca, BRT TransOeste and Metro Rio. e stations are powered
by solar panels and use locking latches and pins as a security system
to difficult bicycle the. e stations are interconnected by wireless
communication system, connected to the Control Center. Figure 1 shows
a map of the stations and bicycles in a station.
Figure 1
Map of the stations and bicycles in a station.
Data used in this research were provided by the company Tembici,
and it corresponds to the period from 07/31/2018 to 10/01/2018.
From August to September 2018, the average usage of this system in
Rio de Janeiro was 17,476 trips per day with a total of 1,048,575 trips.
Aer excluding trips with the same origin and destination, 926,069 was
remained, for each of which data were collected regarding trip start time,
longitude and latitude of origin, trip end time, longitude and latitude of
destiny.
3.2. e proposed benefits estimation method for bike sharing systems
For estimating the reduction in GHG and air pollutants emissions due to
the use of BSS in the city of Rio de Janeiro, we must understand how the
modal transfer process occurs, identifying the number of motorized trips
avoided. erefore, it is necessary to define the transport alternatives that
would be adopted by the BSS user, if this system were not available.
In this paper, the following alternative scenarios were considered:
walking, bus and car transport service provided by Transportation
PDF generated from XML JATS4R by Redalyc
Project academic non-profit, developed under the open access initiativeProduction, 2020, vol. 30, ISSN: 0103-6513 / 1980-5411
Network Company (TNC), such as Uber or Cabify. It is important to
reinforce that recently the use of other modes of individual transport is
increasing in cities worldwide, such as the dockless scooter-share services,
which were not considered in this research because they only started
operating in Rio de Janeiro in 2019. Moreover, while the BSS are being
offered for a longer period of time and are primarily used by individuals
commuting to and from work, the scooter-share service is not, and it has
not been offered for a period of time long enough to build trust within
the community, and for many residents these scooters remain a novelty
(McKenzie, 2019). e Subway mode was not considered, once this paper
has focuses on last mile travel behavior along short travels scenarios up to
5 km, similarly to that adopted by Liu et al. (2019).
e Multinomial Logit Model, widely used in transport problems
(Williams & Abdulaal, 1993; Ortúzar, 2000; Kuklys, 2002), was used for
establishing the discrete choice model among the three travel alternatives.
is model assumes that negative travel pattern factors, such as high
direct cost, can be offset by positive factors such as reduced travel time.
erefore, individuals choose a mode of transport (or a sub-mode), based
on the total sum of positive or negative utilities that are associated with
factors that influence the trip's accomplishment. Hence, the probability
of choosing a given alternative is due to identifiable logical variables in an
observed universe, as presented in Equation 1.
(1)
Wherein: : represents the probability of choosing the transport
alternative i;
: corresponds to the utility function of transport mode i.
For the case assessed, three substitute choice options for the BSS (car,
bus and walking) are considered, so the probability of using the TNC
mode, for example, can be defined by Equation 2.
(2)
In this paper, we used the Nested Logit Model, which is an extension
of the multinomial logit model designed to capture correlations between
alternatives (Bierlaire, 1998). It differs from the multinomial logit model
because it is possible to group alternatives that are similar in the same
hierarchy. e grouping of transport alternatives was carried out in
two hierarchical levels: (i) level one corresponding to the alternatives of
walking and motorized transport; and (ii) level two corresponding to
transport by TNC and bus. Figure 2 shows the structure of the Nested
Logit Model in two levels, adopted in this paper.
PDF generated from XML JATS4R by Redalyc
Project academic non-profit, developed under the open access initiativeYesus Emmanuel Medeiros Vieira, et al. Sustainability in bicycle sharing systems: evidences of travel mode choice changings in Rio de Janeir...
Figure 2
Structure of the hierarchical model used in the article.
e configuration commonly used for the utility function follows
a linear additive model (Ben-Akiva & Lerman, 1985), in such a way
that , where are the parameters of the model, k is the attribute of the
alternatives, and are the attribute values of the alternatives. In this paper,
the following attributes were considered: driving time using TNC ttnc;
cost of TNC utilization ctnc; travel time using bus tbus; cost of bus use
cbus; and walking time tpe;
e parameters , presented in the utility functions of each transport
alternatives, were calibrated to better explain the existing modal split. A
total of 64 stated preference interviews were carried out with BSS users
during November-December 2018, in the neighborhoods of Botafogo
and Tijuca, which were chosen because they present a greater flow
of passengers and also have BSS stations near subway terminals and
transfer stations. e values of the independent variables presented in the
questionnaires were determined by varying the hypotheses of the trip and
the distances of the trip, in intervals between 0.6 km and 4.8 km. us, for
each hypothesis of trip, the interviewee had to choose only one of three
transport alternatives presented, having as decision criteria the cost and
travel time associated with them (Table 1).
Table 1
Scenarios inserted in the interviews of stated preference.
PDF generated from XML JATS4R by Redalyc
Project academic non-profit, developed under the open access initiativeProduction, 2020, vol. 30, ISSN: 0103-6513 / 1980-5411
Aer selecting the variables and carrying out the interviews, the Logit
calibration was performed using the SPSS 25.0 soware, applying the
maximum likelihood method to define the final model that minimizes
the number of utility function variables of each travel alternative assessed,
maximizing the accuracy of the model. It was applied the Forward
Stepwise Wald (SPSS 25.0 soware) (SPSS Inc., 2003), which consists
of a regression technique in which the model begins with no variables in
the equation, adding one variable at a time, until all of them are in the
model or until one stop criterion is satisfied. is procedure starts from
the assumption that there is no variable in the model, only the intercept,
and the first variable selected is the one with the highest correlation with
the response. e variable is kept in the model if the F statistic is greater
than the critical point, which is calculated for a given critical alpha. us,
assuming that a variable x1 was selected for the model, the next step is to
find a variable with the highest correlation with the response, considering
the presence of the first variable in the model. is is called a partial
correlation, and it is the correlation of the residuals of the model with
the residuals of the model . erefore, assuming that the largest partial
correlation with y is x2 and this implies that the largest partial F statistic
is calculated by expression 3.
(3)
Wherein: SQR: is the sum of the squares of the model;
QME: is the mean square of the errors, for variables x1 and x2. If the
value of the statistic is greater than the critical point, x2 is selected to
compose the model.
e utility functions of the three transport alternatives were defined
and calibrated. e resulting Logit model was then used to estimate
the probability of choosing each transport mode (walk, TNC and
bus), considering the case that the BSS was not available. For that, we
considered the 37,249 trips between the 193 BSS stations in the origin-
destination (OD) matrix formed by the data provided by Tembici. To
construct this OD matrix, we used the Google Maps APIs with data from
the aernoon peak hours, established as the period between 17h and
18h, as reported by the PDTU of Rio de Janeiro (2015). Moreover, since
each pair of origin-destination of this matrix is associated with the geo-
referenced localizations of two bicycle sharing stations, it was possible to
estimate the travel times, costs and distances for these hypothetical trips,
according to each of the three transport modes considered in this study.
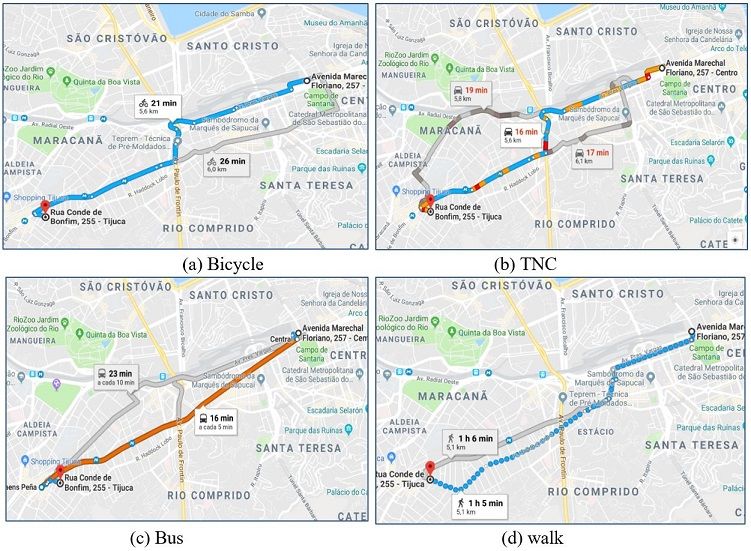
e simplifying hypothesis, therefore, is that the distances evaluated
in each mode of transport will correspond to the paths that provide the
shortest travel time, as shown in Figure 3.
PDF generated from XML JATS4R by Redalyc
Project academic non-profit, developed under the open access initiativeYesus Emmanuel Medeiros Vieira, et al. Sustainability in bicycle sharing systems: evidences of travel mode choice changings in Rio de Janeir...
Figure 3
Travel modes and its corresponding calculated time and distances.
For estimating reductions in GHG and air pollutants emissions due to
the modal shi, trip projections were made for the time interval of one
year, adopting, in a simplified way, the average value of the trips made in
the two months whose data were made available by Tembici. We followed
the bottom-up methodology, using the emission factors proposed in the
2nd National Inventory of Atmospheric Emissions by Road Automotive
Vehicles (Brasil, 2013). Data on the category and average age of the car
fleet was obtained in the data provided by the authors of the Technical
Report - GHG Emission Scenarios - 2050 (D’Agosto et al., 2018), and
the average age of the bus fleet was obtained from the Summary Report of
the transportation system by bus in the city of Rio de Janeiro (Federação
das Empresas de Transportes de Passageiros do Estado do Rio de Janeiro,
2018). e percentage of the current fleet according to each type of fuel
was obtained from the State of Rio de Janeiro - 2017-2031 Energy Matrix
Report (Rio de Janeiro, 2018). Table 2 presents the summary of the
factors considered for the calculation of emissions. Since it is not possible
to estimate the exact proportion of consumption between gasoline or
ethanol options for flex vehicle, the row corresponding to flex vehicle
presents the range of values for the hypothesis of gasoline or ethanol use
by flex-fuel vehicles, according to MMA (Brasil, 2013).
PDF generated from XML JATS4R by Redalyc
Project academic non-profit, developed under the open access initiativeProduction, 2020, vol. 30, ISSN: 0103-6513 / 1980-5411
Table 2
GHG and pollutant emission factors by vehicle category.
* ethanol use hypothesis by Flex vehicles;
** gasoline use hypothesis by Flex vehicles;
CNG: compressed natural gas; CO: Carbon monoxide; PM: Particulate matter.
4. Findings and discussions
From the interviews conducted in Botafogo and Tijuca neighborhoods,
we could estimate the number of trips that would be made by bus, TNC
or walking, if the BSS was not available, such as shown in Figure 4. e
sum of the scenarios 1 to 7 totalizes 256 answers. Since the questionnaire
contains 4 possible scenarios, there has been therefore a total of 64 BSS
users interviewed.
Figure 4
Travel quantities declared by mode and distance.
It was verified that the behavioral changes regarding the choice of
transport mode is related to the distances presented in the questionnaire
and their consequent variations of travel time and cost. As shown
in Figure 5, as distances increase the motorized travel mode choice
is preferred in relation walking. In the selected regions, respondents
answered that the trips up to 1.4 km occur predominantly by walking.
However, in trips with distances equal or greater than 1.9 km, both
TNC and bus are the transport alternatives most adopted. In order
to extend the modal repartition analysis to the 193 Tembici stations
system, the Logit calibration was carried through the stated preference
PDF generated from XML JATS4R by Redalyc
Project academic non-profit, developed under the open access initiativeYesus Emmanuel Medeiros Vieira, et al. Sustainability in bicycle sharing systems: evidences of travel mode choice changings in Rio de Janeir...
surveys, applying the Forward Wald Stepwise method, and by estimating
parameters of maximum likelihood to evaluate the quality of the
calibrated models. It should be emphasized that the models were
generated including several different combinations of the explanatory
variables and, therefore, the presented results include the models and
variables that present greater significance. e level of significance was set
at 5%. Results are presented in Table 3. Aer the iterations, four of the five
independent variables presented significance to compose the final model.
Figure 5
Modal replacement according to transport mode and scenario.
Table 3
e model estimation results.
B=Estimated parameters; S.E=standard error; W=Wald statistic; df=degrees of freedom; Sig=
Significance of Wald statistics; Exp(B)=ODDS; TNC= Transportation Network Company.
According to the parameters estimated in Table 3, the utility functions
were obtained as follows:
(4)
(5)
(6)
PDF generated from XML JATS4R by Redalyc
Project academic non-profit, developed under the open access initiativeProduction, 2020, vol. 30, ISSN: 0103-6513 / 1980-5411
When analyzing the utility functions for walking trips (equation 4),
the variable that was statistically significant to explain the choice of the
interviewees for this mode was the time in which the trip would be done
by walking (twalk). As for trips made by TNC (equation 5), the travel cost
by TNC is considered (ctnc), and for the travel mode by bus (equation
6), all the three travel times are considered in the model (twalk, ttnc
and tbus). ODDS corresponds to the odds ratio (Hosmer & Lemeshow,
2000), and is defined as the ratio between the probability for x=1 and
x=0, of choosing between two alternatives for the Nested Logit Model.
ODDS greater than 1 indicates that the variable concerned increases the
probability of choosing the mode of transport analyzed, and ODDS less
than 1 decreases the choice’s likelihood.
e Wald (W) test is used to verify constraints imposed on the
regression coefficients and computes a statistic that measures the estimate
of the coefficients of the original regression to satisfy the constraints of
the null hypothesis, thus testing the significance of each model coefficient
(B). Cox & Snell's R-square and the Nagelkerke’s R-square, whose values
are less than or equal to 1, are pseudo statistical R2 that represent a fraction
of the variance that is shared between the variables and are calculated on
the basis of the likelihood function (Hosmer & Lemeshow, 2000).
erefore, by applying Equation 2, the probabilities of choosing
walking, TNC and bus travel are defined according to Equations 7 to 9.
(7)
(8)
(9)
Figure 5 presents the results for the modal split obtained by the
application of Equations 7 to 9, considering the 7 scenarios described in
Table 1 (Section 3). Walking is the predominant choice in scenarios 1
and 2, which consider shorter travel distances. However, as walking time
increases, this option becomes disadvantageous, which is translated by the
negative coefficient of parameter B, equal to -0.247 in Table 3. e utility
function for this travel mode assumes positive values for routes performed
up to 18 minutes, which suggests this as the time limit that the individuals
interviewed would predispose to walk, without opting for the adoption
of a motorized travel mode.
Trips performed by TNC exceeds the number of trips performed by
bus only in scenario 2, since the distances considered in these scenarios,
result in the minimum fees charged for private transport applications,
making it thus a viable option in comparison to bus. To the extent,
however, that travel time per car increases, reflecting on higher service
PDF generated from XML JATS4R by Redalyc
Project academic non-profit, developed under the open access initiativeYesus Emmanuel Medeiros Vieira, et al. Sustainability in bicycle sharing systems: evidences of travel mode choice changings in Rio de Janeir...
charges, bus transportation becomes more advantageous. is explains
the negative sign of parameter B in the TNC utility function variable ctnc
(Table 3). For scenarios 3, 4, 6 and 7, the bus option prevails in relation to
other modes of transport. When comparing the interviews results (Figure
4) with the result of the utility functions application (Figure 5), it was
verified that the model was able to determine the BSS users predominant
choice between motorized and non-motorized transport for all seven
scenarios, proving to be equivalent to all observed results in interviews.
Expanding this analysis to the total of 1,048,575 trips registered in the
BSS of Itau Bike, the modal split model resulted in 283,220 foot trips
(27.01%), 109,262 TNC trips (10.42%) and 656.093 bus trips (62.57%),
indicating, therefore, that in the city of Rio de Janeiro most of the users
would be replacing the walk and the public transit by the use of the
bicycle, in accordance with the findings in the literature for other cities
(Fishman et al., 2015; Zhu et al., 2012). As shown in Table 4, the modal
replacement rates obtained from the proposed model for BSS of Rio de
Janeiro are included among the values verified in other existing bicycle
sharing systems in the world, indicating the validation of the calibrated
model.
Table 4
Transport modes replaced by BSSs.
Source 1: OBIS (Intelligent Energy Europe, 2011); Source 2: Oliveira (2014).
Table 5 shows the estimations of CO2, CO, PM and NOx emission
reductions due to the use of BSS. Estimations were made according to
the methodology presented in Section 3, considering the number of
trips made, the transportation mode employed, and the total distances
traveled. Due to the greater transport capacity offered by these transport
modes when compared to bicycles, the average occupancy factor adopted
was: 1.3 people per vehicle for cars, and 35 people per vehicle for the urban
bus, thus trips were grouped according to the offered transportation
capacity. Both data obtained from the Energy Matrix Report of the State
of Rio de Janeiro - 2017-2031 (Rio de Janeiro, 2018).
Table 5
Estimated emissions reduction due the bike sharing in Rio de Janeiro.
* Assumption for exclusive use of gasoline.
PDF generated from XML JATS4R by Redalyc
Project academic non-profit, developed under the open access initiativeProduction, 2020, vol. 30, ISSN: 0103-6513 / 1980-5411
CNG: compressed natural gas; CO: Carbon monoxide; PM: Particulate matter.
Detailed interviews were conducted by Oliveira (2014) with BSS
users in Rio de Janeiro and their results were checked for plausibility,
comparing it with rates for transport modes replaced by BSSs collected in
papers published for other cities (Intelligent Energy Europe, 2011; Zhu
et al., 2012; Fishman et al., 2015). When comparing the CO2 reduction
results estimated in this paper with the analysis by Oliveira (2014), it is
possible to verify that the BSS in the city of Rio de Janeiro has evolved in
terms of the environmental benefits provided, since there was an increase
in the gross reduction of CO2 (ton CO2/year). It is justified by the
greater number of bicycles available, reflecting in the number of trips
and kilometers traveled per year, as shown in Table 6. Average distances
traveled per trip changed from 3.5 km in 2014 to 2.62 km in 2018,
presenting an average reduction of 25.14%, which can be explained by the
growing number of stations made available by the system. is figure went
from 60 stations in 2014 to 193 in 2018.
Table 6
Quantitative evolution of the bicycle sharing system in the city of Rio de Janeiro.
* Considered only emissions from individual transport;
** Compared to the estimated for the year 2016, according to the Inventory and scenario of greenhouse gases emissions
from the City of Rio de Janeiro (Instituto Alberto Luiz Coimbra de Pós-graduação e Pesquisa de Engenharia, 2011).
It can also be observed, from Table 6, changes in the percentage of
BSS trips that replace the use of public and individual transport when
comparing the research scenarios of 2014 and 2018. is fact is mainly
due to the transportation alternatives considered in these two studies. In
2014, interviewees had the option to choose from individual motorized
transportation by private cars, whereas in 2018 the alternative offered to
the interviewees was the travel mode by cars offered by TNC services,
through applications. us, it has been identified that, under certain
conditions of time and cost, transport applications begin to compete
with public transport modes, modifying the modal split between trips
made by car and bus, particularly in last-mile travel scenarios. It is also
suggested that the usage expansion of transport applications, especially
to non-private car owners, justifies the higher adoption rate of individual
transportation by the interviewees.
is change in modal replacement percentages significantly affects
the calculated emission values. In fact, the average load factor of
PDF generated from XML JATS4R by Redalyc
Project academic non-profit, developed under the open access initiativeYesus Emmanuel Medeiros Vieira, et al. Sustainability in bicycle sharing systems: evidences of travel mode choice changings in Rio de Janeir...
1.3 passengers per vehicle adopted for the TNC exerts a greater
environmental impact than 35 passenger load factor per vehicle adopted
for the bus, so that a higher percentage of car modal shi to bicycles
directly influences emission reduction efficiency indicators by the BSS. In
2018, this system allowed a reduction of 0.0418% of the total emissions
made by the road transport sector in the city of Rio de Janeiro, which
was estimated for the year 2016 at 4,937.2 Gg CO2, according to the
Inventory and scenario of greenhouse gases emissions from the City
of Rio de Janeiro (Instituto Alberto Luiz Coimbra de Pós-graduação e
Pesquisa de Engenharia, 2011).
5. Conclusions, research constraints and recommendations
for future research
e present paper aims to quantitatively explore the contribution of
the bicycle sharing system in the reduction of CO2, CO, MP and
NOx emissions to the city of Rio de Janeiro. In a first stage, we used
actual travel data from the Tembici company the Google Maps APIs
to estimate origin-destination matrices, constituted by distances, travel
times and costs, to each considered alternatives. en, we applied the
preempted interviews to the users of the Tembici system, in order to
allow the calibration of a modal split model that explains the choice
behavior among the modes of transportation, for the scenarios evaluated.
Finally, emissions were estimated in accordance to the information
on the circulating fleet, vehicles occupancy rates and emission factors
characteristic of each pollutant and GHG considered.
Results indicated a gross increase in CO2 emission reductions,
compared to the existing system in 2014, not only due to the increase
in the service offer, but also due to a higher transfer rate from private
motorized to bicycle trips.
e logistic regression models obtained, allowed us to identify BSS
user’s behavioral trends, and revealed that the variables travel time by
walk, TNC and bus, as well as the travel cost by TNC, were the most
statistically significant for the prediction of travel replacement models.
Only the travel cost by bus was not incorporated into the model, since the
fee charged is constant in all the routes studied. Hence, for the scenarios
and distances assessed in the interviews the utility function for walking
travel mode assumes positive values for the trips performed up to 18
minutes, whereas, for the TNC mode, the travel times results on the
minimum fare charged by the transport applications, allowing favor to
the use of this travel mode in relation to the bus one. As the price charged
increases, bus trips become more advantageous, as verified in the utility
function generated.
It was verified that the mode most substituted by BSS is
public transport. Moreover, aer introducing in questionnaires the
transportation alternative by using TNC, it was observed a 7.43%
reduction average net in public transport use among BSS users in Rio
de Janeiro, comparing the research scenarios of 2014 and 2018. is
PDF generated from XML JATS4R by Redalyc
Project academic non-profit, developed under the open access initiativeProduction, 2020, vol. 30, ISSN: 0103-6513 / 1980-5411
phenomenon is in accordance to previous findings in major cities in
the United States, where the average net change in public transport use
suffered a 6% reduction (Clewlow & Mishra, 2017). It can be explained
due to the increasing “technology-oriented” lifestyles: the degree of
familiarity with modern technologies and their adoption in daily life
is associated with a higher likelihood of adopting TNC services. Yet,
many of the most fundamental changes occurred by these innovations –
such as competitive travel – would seem to work in opposite directions,
acknowledging concerns that “[…] every technological innovation has
acted to increase demand rather than to reduce it […]” (Gössling, 2018,
p.157).
e net environmental benefits of bicycle sharing depend on whether
the system is considered a good substitute for the ownership and use of
private vehicles, and whether it is well integrated with public transport,
cycling and pedestrian infrastructure, so that it improves rather than
replaces walking and public transport (Fishman et al., 2015). erefore,
although the emission reduction contribution reveals a small influence
on the total emissions generated by the road transportation system in the
city of Rio de Janeiro, bicycle sharing should be understood as part of
the multimodality adopting process, with effective reductions achieved by
encouraging the behavioral change of the transport systems users. us,
the increase in bicycle density provided by the BSS growth, integrated
with other public transport options and associated with measures that
make car traffic less attractive, are likely to trigger a much more significant
reduction in GHG and air pollutant emissions.
Although this study provides innovative and quantitative estimations
of the environmental benefits of BSS, there are some constraints. First,
due to the privacy issue, the bike-sharing data obtained were preprocessed
by Tembici. Each trip only contained a collection of chronologically
unordered spatial locations, consequently, it was impossible to accurately
retrieve a user's actual travel route from their travel information. It is
suggested that in the future, the original trip data can be tracked by GPS.
Based on this dataset, more accurate trips can be retrieved. Second, the
survey relies on self-reported behavior and Some respondents may have
provided information that did not reflect their real behavior, although
there was little reason to do so knowingly. As a suggestion for future
research, a larger sample size may help improve the degree to which the
non-member sample represent the wider population.
Acknowledgements
e present study was carried out supported by the Coordination
of Higher Education Personnel Improvement - Brazil (CAPES,
Coordenação de Aperfeiçoamento de Pessoal de Nível Superior - Brasil) -
Financing Code 001.
PDF generated from XML JATS4R by Redalyc
Project academic non-profit, developed under the open access initiativeYesus Emmanuel Medeiros Vieira, et al. Sustainability in bicycle sharing systems: evidences of travel mode choice changings in Rio de Janeir...
References
Audikana, A., Ravalet, E., Baranger, V., & Kaufmann, V. (2017). Implementing
bike sharing systems in small cities: evidence from the Swiss experience.
Transport Policy, 55(C), 18-28. http://dx.doi.org/10.1016/j.tranpol.201
7.01.005.
Ben-Akiva, M., & Lerman, S. R. (1985). Discrete choice analysis: theory and
application to travel demand. New Jersey: MIT Press.
Bierlaire, M. (1998). Discrete choice models. In M. Labbé, G. Laporte,
K. Tanczos & P. Toint (Eds.), Operations research and decision aid
methodologies in traffic and transportation management (NATO ASI
Series, pp. 203-227). Berlin, Heidelberg: Springer.
Brasil. Ministério do Meio Ambiente – MMA. (2013). 2º Inventário Nacional
de Emissões Atmosféricas por Veículos Automotores Rodoviários, Brasília:
MMA.
Campos, V. B. G. (2006). Uma visão da mobilidade urbana sustentável. Revista
dos Transportes Públicos, 2, 99-106.
Clewlow, R. R., & Mishra, G. S. (2017). Disruptive transportation: the adoption,
utilization, and impacts of ride-hailing in the United States. Davis: Institute
of Transportation Studies, University of California. Research Report
UCD-ITS-RR-17-07.
D’Agosto, M. A., & Ribeiro, S. K. (2009). Assessing total and renewable energy
in Brazilian automotive fuels. A life cycle inventory (LCI) approach.
Renewable & Sustainable Energy Reviews, 13(6-7), 1326-1337. http://dx
.doi.org/10.1016/j.rser.2008.08.008.
D’Agosto, M. A., Schmitz, D. N., & Goes, G. V. (2018). Cenários de emissão
de gases de efeito estufa até 2050 no setor de transportes: referência e
1,5 °C. In E. L. L. Rovere, W. Wills, C. B. S. Dubeux, A. O. Pereira
Junior, M. A. D’Agosto, M. K. C. Walter, C. Grottera, G. Castro, D.
Schmitz, O. Hebeda, S. M. Loureiro, D. Oberling, C. Gesteira, G. V. Goes,
I. F. Zicarelli, & T. J. P. Oliveira. Implicações Econômicas e Sociais dos
Cenários de Mitigação de GEE no Brasil até 2050: Projeto IES-Brasil,
Cenário 1.5 °C. Rio de Janeiro: COPPE/UFRJ
DeMaio, P. (2009). Bike-sharing: history, impacts, models of provision, and
future. Journal of Public Transportation, 12(4), 41-56. http://dx.doi.org/
10.5038/2375-0901.12.4.3.
Federação das Empresas de Transportes de Passageiros do Estado do Rio de
Janeiro – FETRANSPOR. (2018). Idade média da ota – Intermunicipal
e capital – 1996 a 2018. Retrieved in 2019, July 30, from https://www.fe
transpor.com.br/mobilidade-urbana-setor-em-numeros
Fishman, E. K. (2016). Bikeshare: a review of recent literature. Transport
Reviews, 36(1), 92-113. http://dx.doi.org/10.1080/01441647.2015.1033
036.
Fishman, E., Washington, S., & Haworth, N. (2013). Bikeshare: a synthesis of
the literature. Transport Reviews, 33(2), 148-165. http://dx.doi.org/10.1
080/01441647.2013.775612.
Fishman, E., Washington, S., Haworth, N., & Watson, A. (2015). Factors
influencing bike share membership: an analysis of Melbourne and
Brisbane. Transportation Research Part A, Policy and Practice, 71, 17-30.
http://dx.doi.org/10.1016/j.tra.2014.10.021.
PDF generated from XML JATS4R by Redalyc
Project academic non-profit, developed under the open access initiativeProduction, 2020, vol. 30, ISSN: 0103-6513 / 1980-5411
Frade, I., & Ribeiro, A. (2015). Bike-sharing stations: a maximal covering
location approach. Transportation Research Part A, General, 82, 216-227.
http://dx.doi.org/10.1016/j.tra.2015.09.014.
García-Palomares, J., Gutiérrez, J., & Latorre, M. (2012). Optimizing the
location of stations in bike-sharing programs: a GIS approach. Applied
Geography (Sevenoaks, England), 35(1-2), 235-246. http://dx.doi.org/10
.1016/j.apgeog.2012.07.002.
Gössling, S. (2018). ICT and transport behavior: a conceptual review.
International Journal of Sustainable Transportation, 12(3), 153-164. http
://dx.doi.org/10.1080/15568318.2017.1338318.
Guimarães, V. A., & Leal Junior, I. (2017). Performance assessment
and evaluation method for passenger transportation: a step toward
sustainability. Journal of Cleaner Production, 142, pt 1, 297-307. http://d
x.doi.org/10.1016/j.jclepro.2016.05.071.
Hamilton, T. L., & Wichman, C. (2018). Bicycle infrastructure and
traffic congestion: evidence from DC’s Capital Bikeshare. Journal of
Environmental Economics and Management, 87(C), 72-93. http://dx.doi
.org/10.1016/j.jeem.2017.03.007.
Hosmer, D. W., & Lemeshow, S. (2000). Applied logistic regression. (2nd ed.).
New York: J. Wiley http://dx.doi.org/10.1002/0471722146.
Instituto Alberto Luiz Coimbra de Pós-graduação e Pesquisa
de Engenharia – COPPE. (2011). Inventário e Cenário de
Emissões dos Gases de Efeito Estufa da Cidade do Rio de
Janeiro. Rio de Janeiro: COPPE. Retrieved in 2019, July 30,
from http://www.rio.rj.gov.br/dlstatic/10112/1712030/DLFE-222982.
pdf/NelsonSINVENTARIOFINALMAC_Resumo_Geral_Inv_e_Cen
ario_v05abr_E.pdf
Intelligent Energy Europe. (2011). Optimizing bike sharing in European cities –
OBIS (90 p.). Retrieved in 2019, July 30, from https://ec.europa.eu/ener
gy/intelligent/projects/en/projects/obis#results
Kuklys, W. (2002). Stated choice methods: analysis and application, Jordan J.
Louviere, David A. Hensher and Joffre D. Swait, Cambridge University
Press, ISBN: 0-521-78830-7. Journal of Applied Econometrics, 17(6),
701-704. http://dx.doi.org/10.1002/jae.701.
Li, Z.-C., Yao, M.-Z., Lam, W. H. K., Sumalee, A., & Choi, K. (2014).
Modeling the effects of public bicycle schemes in a congested multi-modal
road network. International Journal of Sustainable Transportation, 9(4),
282-297. http://dx.doi.org/10.1080/15568318.2013.767398.
Litman, T. (2007). Developing indicators for comprehensive and sustainable
transport planning. Transportation Research Record: Journal of the
Transportation Research Board, 2017(1), 10-15. http://dx.doi.org/10.31
41/2017-02.
Liu, Y., Chen, J., Wu, W., & Ye, J. (2019). Typical combined travel mode choice
utility model in multimodal transportation network. Sustainability,
11(2), 549. https://doi.org/10.3390/su11020549.
McKenzie, G. (2019). Spatiotemporal comparative analysis of scooter-share
and bike-share usage patterns in Washington, D.C. Journal of Transport
Geography, 2019(1), 19-28. http://dx.doi.org/10.1016/j.jtrangeo.2019.0
5.007.
PDF generated from XML JATS4R by Redalyc
Project academic non-profit, developed under the open access initiativeYesus Emmanuel Medeiros Vieira, et al. Sustainability in bicycle sharing systems: evidences of travel mode choice changings in Rio de Janeir...
Midgley, P. (2011). Bicycle-sharing schemes: enhancing sustainable mobility in
urban areas. New York: United Nations. Retrieved in 2019, July 30,
from http://www.un.org/esa/dsd/resources/res_pdfs/csd-19/Backgroun
d-Paper8-P.Midgley-Bicycle.pdf
Mobilize Website. (2018). Bike sharing, um mercado em anca expansão.
Retrieved in 2019, July 30, from http://www.mobilize.org.br/noticias/10
862/bike-sharing-um-mercado-em--franca- xpansao.html
Noland, R. B., & Ishaque, M. M. (2006). Smart Bicycles in an Urban Area:
Evaluation of a Pilot Scheme in London. Journal of Public Transportation,
9(5), 71-95. http://dx.doi.org/10.5038/2375-0901.9.5.5.
Observatório das Metrópoles. (2012). Níveis de integração dos municípios
brasileiros em RMs, RIDEs e AUs. À dinâmica da metropolização (Relatório
de Pesquisa, 108 p.) Rio de Janeiro: Observatório das Metrópoles.
Oliveira, A. (2014). Contribuição e perspectivas do sistema de compartilhamento
de bicicletas para mobilidade e sustentabilidade na cidade do Rio de Janeiro
(Dissertação de mestrado). Departamento de Engenharia Civil Pontifícia,
Universidade Católica do Rio de Janeiro, Rio de Janeiro.
Ortúzar, J. D. (2000). Modelos econométricos de elección discreta. Chile:
Ediciones Universidad Católica de Chile. Retrieved in 2019, July 30,
from http://www.researchgate.net/publication/ 230752816_Modelos_
Econometricos_de_Eleccion_Discreta
Parkes, S., Marsden, G., Shaheen, S., & Cohen, A. (2013). Understanding the
diffusion of public bike sharing systems: evidence from Europe and North
America. Journal of Transport Geography, 31, 94-103. http://dx.doi.org/
10.1016/j.jtrangeo.2013.06.003.
Pembinas Institute. (2019). Canada’s Coolest Cities looked at the question: “What
are Canada’s large cities doing to encourage low-carbon choices for personal
transportation?” Retrieved in 2019, January 1, from https://www.pembin
a.org/reports/coolest-cities-case-study-montreal.pdf
Pucher, J., Garrard, J., & Greaves, S. (2010). Cycling down under: a comparative
analysis of bicycling trends and policies in Sydney and Melbourne. Journal
of Transport Geography, 9, 332-345. http://dx.doi.org/10.1016/j.jtrangeo
.2010.02.007.
Qiu, L. Y., & He, L. Y. (2018). Bike sharing and the economy, the environment,
and health-related externalities. Sustainability, 10(4), 1145. http://dx.do
i.org/10.3390/su10041145.
Rio de Janeiro. Governo. (2015). PDTU: Plano Diretor de Transporte da Região
Metropolitana do Estado do Rio de Janeiro: Relatório 4 – Planejamento e
Execução das Pesquisas: Parte 3 (Tomo I): Diagnóstico da Situação Atual.
Rio de Janeiro: Secretaria de Transportes.
Rio de Janeiro. Governo. (2018). Matriz Energética do Estado do Rio de Janeiro.
Rio de Janeiro: Subsecretaria de Desenvolvimento Econômico.
Shaheen, S. A., Martin, E. W., Chan, N. D., Cohen, A. P., & Pogodzinski,
M. (2014). Public bike sharing in North America during a period of
rapid expansion: understanding business models, industry trends and user
impacts. San Jose, CA: Mineta Transportation Institute. Retrieved in
2019, January 30, from http://transweb.sjsu.edu/PDFs/research/1131-p
ublic-bikesharingbusiness-models-trends-impacts.pdf
Shaheen, S. A., Zhang, H., Martin, E., & Guzman, S. (2011). China’s
Hangzhou Public Bicycle. Transportation Research Record: Journal of the
PDF generated from XML JATS4R by Redalyc
Project academic non-profit, developed under the open access initiativeProduction, 2020, vol. 30, ISSN: 0103-6513 / 1980-5411
Transportation Research Board, 2247(1), 33-41. http://dx.doi.org/10.31
41/2247-05.
Shaheen, S., Guzman, S., & Zhang, H. (2010). Bikesharing in Europe,
the Americas, and Asia: Past, Present, and Future. Davis: Institute of
Transportation Studies. http://doi.org/10.3141/2143-20.
Shaheen, S., Martin, E., & Cohen, A. (2013). Public bike sharing and modal
shi behavior: a comparative study of early bike sharing systems in North
America. International Journal of Transportation, 1(1), 35-54. http://dx.
doi.org/10.14257/ijt.2013.1.1.03.
SPSS Inc. (2003). Statistical Package for Social Sciences: brief guide (71 p).
Chicago: SPSS Inc.
Suchanek, M. (2018). New research trends in transport sustainability and
innovation: TranSopot 2017 Conference . USA: Springer.
Wang, M., & Zhou, X. (2017). Bike-sharing systems and congestion: evidence
from US cities. Journal of Transport Geography, 65, 147-154. http://dx.d
oi.org/10.1016/j.jtrangeo.2017.10.022.
Williams, H. C. W. L., & Abdulaal, J. (1993). Public transport services
under market arrangements, part I: A model of competition between
independent operators. Transportation Research Part B: Methodological,
27(5), 369-387. http://dx.doi.org/10.1016/0191-2615(93)90023-4.
Wolf, A., & Seebauer, S. (2014). Technology adoption of electric bicycles: a
survey among early adopters. Transportation Research Part A, Policy and
Practice, 69, 196-211. http://dx.doi.org/10.1016/j.tra.2014.08.007.
Zhang, Y., & Mi, Z. (2018). Environmental benefits of bike sharing: a big data-
based analysis. Applied Energy, 220, 296-301. http://dx.doi.org/10.1016/
j.apenergy.2018.03.101.
Zhu, W., Pang, Y., Wang, D., & Yu, X. (2012). Travel behavior change aer
the introduction of public bicycle system: a case study of Minhang District,
Shanghai. Washington: TRB.
Notes
How to cite this article: Vieira, Y. E. M., Francisco, F. R., Silva Júnior, O. S.,
Bandeira, R. A., & Leal, J. E. (2020). Sustainability in bicycle sharing systems:
evidences of travel mode choice changings in Rio de Janeiro. Production, 30,
e20190068. https://doi.org/10.1590/0103-6513.20190068
Author notes
*
yesuscad@gmail.com
PDF generated from XML JATS4R by Redalyc
Project academic non-profit, developed under the open access initiativeYou can also read