WHAT'S THE FORECAST? (WTF) - A Virtual Event Thursday, November 19, 2020 - Santa Monica
←
→
Page content transcription
If your browser does not render page correctly, please read the page content below

WHAT’S THE FORECAST? (WTF)

                     A Virtual Event
            Thursday, November 19, 2020
BOARD OF DIRECTORS                                     TOURISM MARKETING DISTRICT COMMITTEE

Damien Hirsch - Chairman                               Gerry Peck - Chairman
General Manager, JW Marriott Santa Monica Le Merigot   General Manager, Shore Hotel

Albin Gielicz - Vice Chair/Resident                    Erik Kreft - Vice Chair
                                                       General Manager, The Ambrose Hotel Santa Monica
Neil Carrey - Treasurer
Attorney, Baker & Hostetler, LLP                       Mark Averett - Secretary/Treasurer
                                                       General Manager, The Georgian Hotel
Jan Williamson - Secretary
Executive Director, 18th Street Arts Center            Kevin Anawati - Member
                                                       Area Director of Sales & Marketing, Le Méridien Delfina
Darlene Evans - Member/Resident                        Santa Monica

Gerry Peck - Member                                    Younes Atalla - Member
General Manager, Shore Hotel                           General Manager, Loews Santa Monica Beach Hotel

Mark Averett - Member                                  Sam Jagger - Member
General Manager, The Georgian Hotel                    General Manager, Fairmont Miramar Hotel & Bungalows

RoseMary Regalbuto - Member/Resident                   Charlie Lopez-Quintana - Member
                                                       Hotel Casa del Mar, General Manager
Lauralee Asch - Member/Resident
                                                       Juan Viramontes - Member
Jeff S. Klocke - Member                                General Manager, Gateway Hotel Santa Monica
Vice President & General Manager, Pacific Park

Anuj K. Gupta - City Liaison
Deputy City Manager, City of Santa Monica

Laurel Rosen - Chamber Liaison
President/CEO, Santa Monica Chamber of Commerce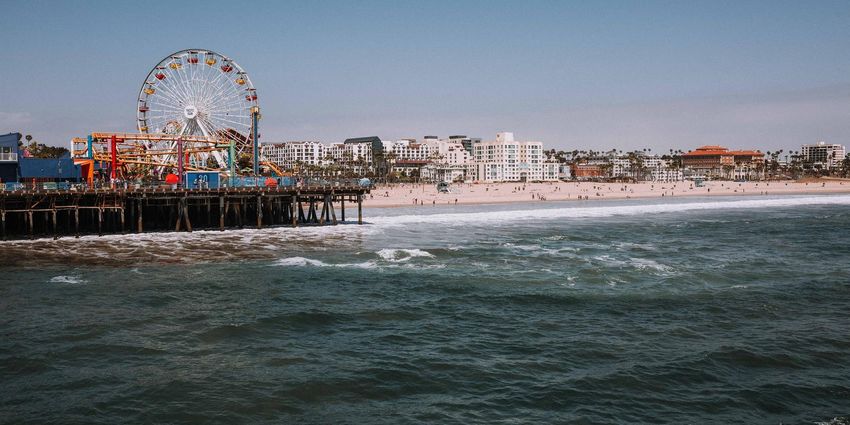
Wendy Kheel

Los Angeles Tourism and Convention Board - VP of Tourism Insights
• Oversaw all tourism related research and data analysis enabling the
   organization and its members to formulate well-informed marketing and sales
   plans.

Universal Studios Hollywood - Director of Consumer Insights
• Established and managed an internal consumer research department that
   designed, executed and analyzed research influencing the strategic,
   operational, and marketing objectives for the theme park.

Walt Disney Imagineering - Director of Market Research

Travel and Tourism Research Association - Former Board Member

Visit California, U.S. Travel Association, and Brand USA - Advisory Research
Committees

Lauren Schlau

Lauren Schlau Consulting (LSC) - Founder & President
• LSC offers a wide range of quantitative and qualitative market research
   services for economic impact, brand development; customer/visitor profiles.
• Notable clients include: Destination Management Organizations; retail
   developers and operators; housing developers; assessment districts; cultural
   arts entities; large-scale special events, educational institutions and others.

San Diego Convention & Visitors Bureau - Research Director

PKF Consulting (now CBRE) - Senior Manager

CalTravel, Travel & Tourism Marketing Association, California Downtown Assn.,
Travel & Tourism Research Association, LA Tourism & Convention Board, LA5
Rotary, and LA Downtown Center BID
IMPACT OF COVID-19 ON
TOURISM AND HOSPITALITY

        What’s the Forecast? (WTF)
        Santa Monica Travel & Tourism
        November 19, 2020

        Wendy Kheel
        wkheel@gmail.com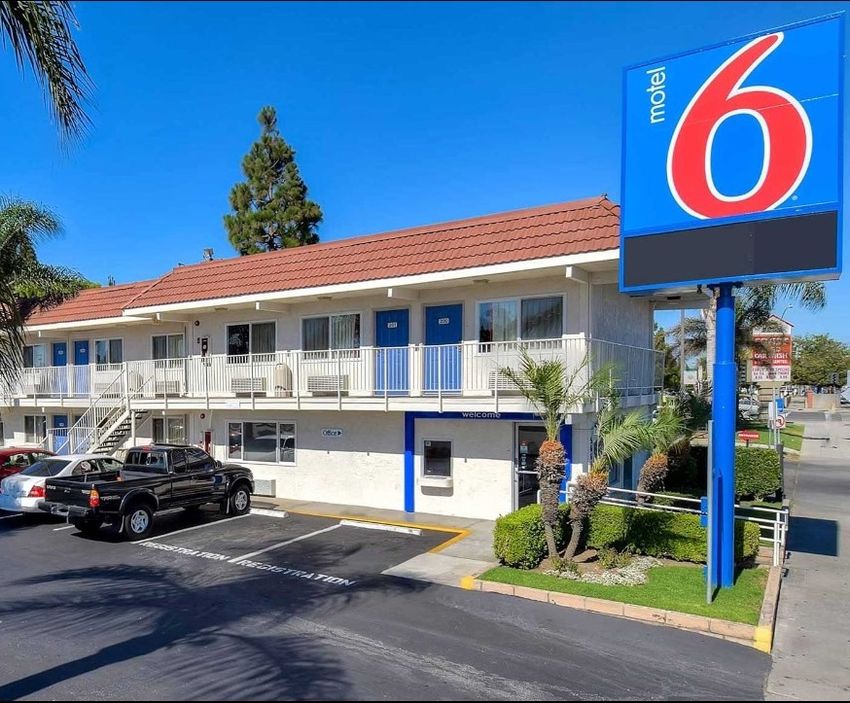
Objectives                                            Content
                                                        •   Market Conditions to Track
  • Curation of data and key findings from a wide
                                                        •   COVID-19 Update
    variety of sources and research companies
                                                        •   Bruising Times for the Economy
                                                        •   COVID-19 Impact on Travel and Hospitality
  • Reliable and timely data and insights to inform     •   Traveler Segments and Sentiment
    marketing and business strategies and key           •   Recovery Forecasts
    stakeholders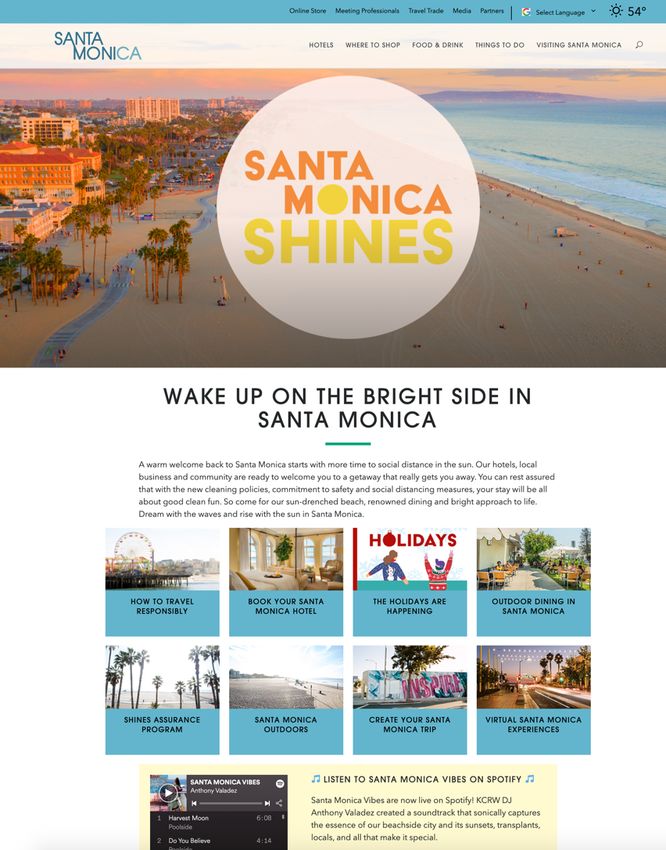
COVID-19 UPDATE
COVID-19 Globally, U.S. and California
Updated November 16, 2020

                        Cases           Deaths           New Daily Cases Per Million Residents
  Global                55.0 million    1.3 million
  United States         11.3 million    247,000
  California            1.05 million    18,304

• Over the past two weeks, France, Germany, Spain, and
  the U.K. have reduced case growth rates while U.S.
  cases continue to spike.

• What is Europe doing differently?

    Ø Crack down on indoor gatherings that most
      commonly spread the virus.
    Ø U.K. closed pubs, restaurants, gyms and more on
      Nov. 5 until at least Dec. 2.
    Ø France, Germany’s regional governments and the
      Catalonia region of Spain also shut restaurants,
      among other businesses.
COVID-19 World Map
Updated November 11, 2020

                            What is China doing differently?
                            •   National level co-ordination
                            •   Mandatory masks
                            •   Widespread rapid testing
                            •   Contact tracing
Source: NY Times            •   Lock-down of hot spots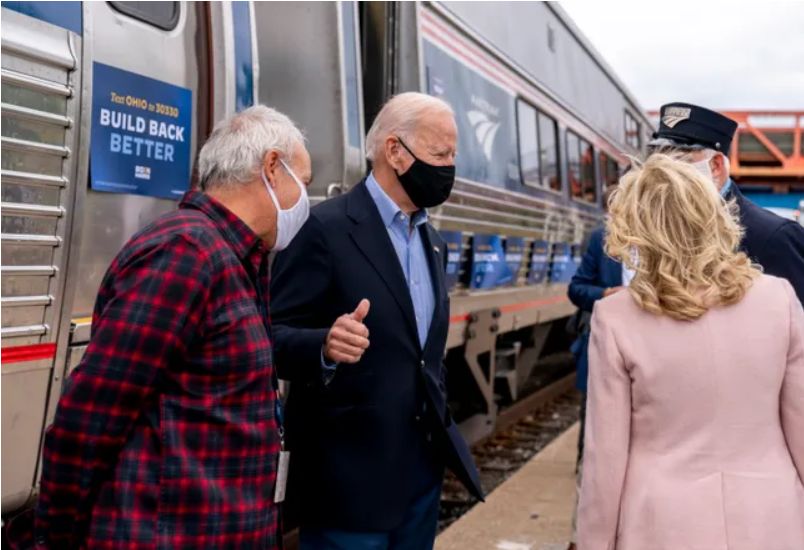
This Time It’s Everywhere
Updated November 16, 2020

 • U.S. cases continue to be concentrated in densely
   populated cities and states but now, it’s everywhere with
   most of the new cases in the Midwest.

  New Reported Cases in the U.S.
Governor Newsom Pulls the Emergency Brake
Updated November 16, 2020

• 41 counties now in most restrictive purple tier impacting restaurants, gyms,   County Reopening Tiers
  retailers; changes must be implemented within 24 hours, instead of 72 hours.

• Possible statewide curfew to stop flocking to bars/restaurants as number of
  COVID-19 cases reported over the last 10 days doubled — largest
  acceleration of new cases seen thus far.

• Changes in way counties are reassigned to new tiers. Before, counties
  moved backward if failed to keep cases down for two consecutive weeks.
  Now a county can be reassigned after just one week of elevated numbers.

                                       New cases Cases per
                        Total cases                                 Deaths
                                         (1 day*) 1M people

 Los Angeles County         339,640         3,010       34,345        7,269
What Elvis Can Teach Us About Vaccines
• Moderna Inc. announced Covid-19 vaccine 94.5% effective week
after a Pfizer Inc. and BioNTechv SE vaccine was found to be
more than 90% effective.
• Vaccine ability to control the pandemic is dependent on
widespread availability and use.
• Less than half of Americans say they will get the vaccine as soon
as it is available. A similar percentage would wait a few months.
Using Elvis as an advocate for the
polio vaccine led to an increase
among American teens from 0.6% to
more than 80% in six months.Bruising Times for the
EconomyU.S. Economic Recovery is Underway But Slowly and Bumpy • Economy is expected to recoup two-thirds of its output loss by the end of Q3 2020. This is expected to translate into a 3.5% GDP contraction in 2020, despite historic fiscal stimulus. • Although significantly better than 7% drop in GDP projected in June or even the 4.2% decline projected in the summer, this would still be the largest reduction in GDP in the past 70 years. • GDP is expected to recover to prior-peak levels (2019 Q4) in the final quarter of 2021.
Jobless Claims Fell But Unemployment Rate Still High
• New unemployment applicants fell last week to 709,000 from 757,000 the week prior suggesting that
  layoffs are easing.
• Unemployment rate dropped to 6.9% from 7.9% but much of the job gains were bars, restaurants and
  retailing – jobs at most risk from virus resurgence.

                                                                                                   Slow
                                                                                                 down in
                                                                                                    job
                                                                                                 creation

                                          Oct:
                                          6.9%
Amtrak Joe is Back. What Does That Mean for Travel?
• Urging Congress to pass a large relief package modeled on
the $3 trillion Heroes Act that House passed in May then
stalled in the Senate.
• Reverse travel ban to U.S. from 13 mostly Muslim countries.
• Reverse withdrawal from Paris Agreement on climate
control. Proposed path to net-zero emissions by 2050.
Ø Transportation is fastest-growing source of U.S. climate
pollution.
Ø Aviation accounts for 12% of global carbon dioxide
emissions.
• Infrastructure investment in roads, bridges, airports and
transit systems.
• Improvements in passenger railroads such as replacing
aging bridges and tunnels and funds for faster rail corridors
including California’s high-speed rail project.U.S Travel Association and COVID RELIEF NOW
• U.S. Travel estimates total 2020 spending in the U.S. will decline 45% resulting in travel
industry losses of $510 billion. 4.2 million travel-supported jobs have been lost and,
without a targeted stimulus plan, 1.3 million more will be lost by year end.
• COVID RELIEF NOW, coalition of nearly 300 major public and private sector groups
calling for Congress to take action NOW and pass an economic relief package.
Ø COVID-19 relief bill in 2020 for small businesses, workers, and invests in public health.
Ø Tax credit for leisure and business travel; $10 billion in domestic travel promotion
grants.
Ø Health and safety guidance that enables domestic travel, large meetings, events,
and conferences to resume.
Ø Safely reopen international travel through risk-based approach to COVID-19 testing
to alleviate need for quarantines upon arrival.
Ø Creating new Assistant Secretary for Travel and Tourism at U.S. Department of
Commerce.
Ø Call for historic federal investments in all modes of travel infrastructure, including
airports, highways, passenger rail, and public transit.COVID-19 Impact on Travel and Hospitality
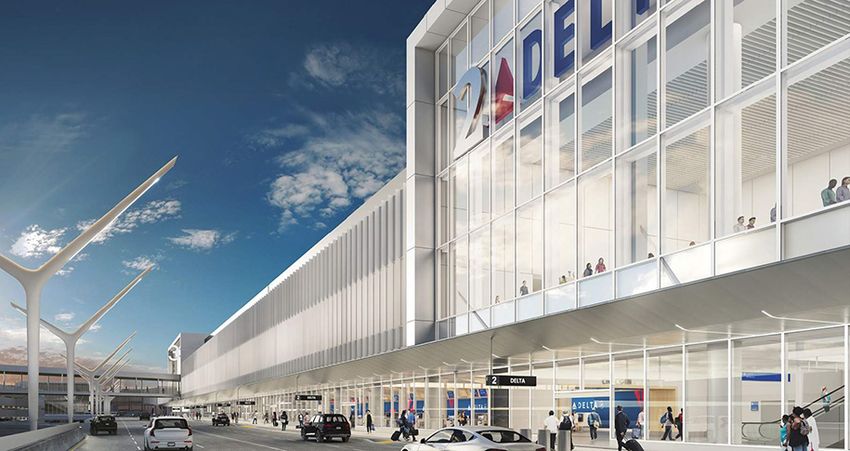
Impact of COVID-19 on Global and U.S. Air Travel
• Air transportation is critical to the recovery of tourism, but COVID-19 has been catastrophic with airline
  traffic and demand disappearing almost overnight..
U.S. Air Travel Increasing But Still 1/3 of Prior Levels
• TSA daily screenings through November 10 were 66% lower Y/Y…the worst performance in five weeks.
• Bookings for travel to and within the U.S. both continue to be well below the same time last year.
LAX Passenger Traffic: Jan-September 2020
• Los Angeles World Airports (LAWA) providing increasingly touch-free experience through technology,
physical changes and policies designed to help people Travel Safely at LAX.
• Even so, Domestic traffic, though showing improvement, was almost 69% less than last year in
September. International traffic improved slightly to 88% less than last year.
LAX Domestic Passenger Traffic Year Over Year LAX International Passenger Traffic Year Over Year
7,000,000 -1% -1% 0% 3,000,000 -1% 0%
-10%
6,000,000 -20% 2,500,000 -20%
5,000,000
-40% 2,000,000 -40%
4,000,000
-55% -57%
-60% 1,500,000 -60%
3,000,000 -69%
-78% -74% -80% 1,000,000 -80%
2,000,000 -84%
-91% -91% -88%
-95% -95% -92%
1,000,000 -100% 500,000 -97% -97% -100%
0 -120% 0 -120%
il
t
ly
ch
ay
r
y
ry
ne
t
ne
ry
h
ril
ly
ay
r
us
y
be
pr
s
ar
be
Ju
ar
c
a
Ju
ar
gu
ua
Ap
M
Ju
A
M
ar
Ju
ug
u
m
nu
nu
em
M
br
br
Au
M
te
A
Ja
Ja
Fe
Fe
pt
ep
Se
S
LAX Domestic Passenger Traffic 2019 LAX International Passenger Traffic 2019
LAX Domestic Passenger Traffic 2020 LAX International Passenger Traffic 2020
LAX Domestic Passenger Traffic 2020 LAX International Passenger Traffic 2020
Source: Los Angeles World AirportsWhoo Hoo! LAX Terminal Project Will Finish 18 Months Early • The $1.86 billion effort to modernize LAX terminals 2 and 3 will be completed 18 months earlier than expected. • Lower passenger volumes have allowed for accelerated construction, which allows the SkyWay to open in mid-2023 instead of late 2024.
U.S. Hotel Performance Week of November 7, 2020
• U.S. hotel performance improved significantly from a low 22% occupancy in April to 44% but is at the
  lowest level since June 14.

• Only two major markets surpassed 50% occupancy: Phoenix (55.1%); and New Orleans (53.9%).

• Hotels hardest hit are luxury hotels in major cities more dependent on business travel and meetings.

• Weekend occupancy tends to be strongest in most markets. In fact, Las Vegas hotels are experimenting
  with midweek closures.

                                                                        Week of November 2020
                                                                        •   Occupancy: 44.2%
                                                                        •   ADR: US$91.40
                                                                        •   RevPAR: US$40.36
Short-Term Rentals Doing Better… Relatively
• Short-term rentals have yet to recover with booked
listings on Airbnb and Vrbo still 29 percent below last
year’s level in September.
• However, not hit as hard as hotels presumably
because less dependent on business travelers and
group meetings.
• Interestingly some listings performed better than
usual, as some travelers booked extended stays and
others sought out rural, drive-to destinations.
• Airbnb unveiled paperwork for initial public offering
showing Q3 profit after pandemic forced business
overhaul and shedding costs, including 25% of staff.Restaurant Industry Pummeled • NRA survey shows that about 100,000 restaurants - nearly 1 in 6 – has either shut down permanently or closed for the foreseeable future. • Despite rapid shift to take-out, delivery, and outdoor seating, most restaurants struggle to survive.
California Theme Parks Remain Closed
• Governor Newsom tied re-opening California theme parks to infection rates and number of virus cases per
  thousand in the counties where the parks are located.

• Disneyland and Universal Studios Hollywood may not open until the summer of 2021 or later. Shops and
  eateries at Disney Downtown and Citywalk are currently open.

• Disney plans to lay off 28,000 people across its theme parks and products and experience divisions, with
  about 10,000 hitting the Disneyland Resort parks, hotels and stores in Anaheim.
California Museums Angry That Shopping Malls Can Open
While They Remain Closed

• According to California’s mandates,
  museums are in the same risk category as
  movie theaters and indoor dining.
  Businesses like shopping malls and retail
  locations have been permitted to reopen.

• In comparison, New York gradually allowed
  museums to open at reduced capacity.

• In response, multiple California mayors
  and museum directors have written a letter
  to the Governor imploring him to rethink
  the state’s museum designations.
Traveler Sentiment
  and Segments
Factors Impacting Decisions to Travel: It’s the Virus

• Travelers are most concerned about COVID-19 though the economy and the costs of traveling are
  also factors negatively impacting travel.
Confidence in Traveling Safely: It’s All About Trust
• Despite efforts by airlines, hotels and restaurants to address safety concerns, less than 30% of American
  travelers are traveling or are ready to travel without hesitation.

• To fully recover, the travel industry needs to restore trust at every point of the travel journey…
  airlines, ground transportation, hotels, restaurants, attractions, etc.

                                       27.1%

                                                                                                  Unsafe average
                                                                                                  of all activities
Travelers Confused by Inconsistent Travel Restrictions • Travelers in the U.S. and globally face a baffling array of different types of travel rules. • L.A. Times on Saturday, Nov 14 published five-page section on how to navigate uncertainty of traveling. • Result – travelers are planning a week at a time with more last-minute trips even for major destinations like Orlando and Hawaii. The Points Guy’s 11 Things You Absolutely Must Know If You Travel This Holiday Season 1. Planes are full 2. Airports are busier but still not fully open 3. You may have to quarantine…in a hotel 4. Not everywhere is as clean as you think 5. You may not be able to return to work or school 6. You may be travel shamed 7. Rules can change … while you’re in the air 8. Your hotel may close or cancel 9. Your packing list is longer 10. Quarantines mean quarantine 11. You may need to talk about testing and expectations
Domestic Leisure or Business Trip in the Next 6 Months
Among Those Who Took a Leisure of Business Trip in the Past 12 Months

• Likelihood to take a domestic trip in the next six months is 40% for Leisure and 24% for Business.

• Americans’ international travel is low and dependent on travel restrictions by individual countries.
Business Travel: Corporations and Employees Need Confidence
that Travel is Safe
 “Duty of Care”…Fiduciary responsibility that requires
 companies to live up to a certain standard of care
 including health, safety, and well-being of employees
 while they travel for work

 • Some business travel can effectively be replaced by
   video conferencing…i.e. five-hour flight for a one-hour
   meeting.

 • Travel budgets reduced. Business travel will be
   evaluated on how essential it is and the return of
   investment.

 • Will not fully return until offices re-open.

 • Availability of travel routes is an issue. Cash strapped
   airlines are suspending service to smaller U.S. cities.

 • Without business travel, there is no “bleisure.”
Meetings and Conferences • Duty of Care requires safe facilities for large
group events and all aspects of the travel
journal.
• Many future meetings will be a hybrid of virtual
and in-person with reduced in-person
attendance.
• Small meetings are an opportunity now but
have very short booking windows.
• Citywide Conventions and compression from
the LA Convention Center (LACC)
o LACC hopes to reopen in Qtr. 2, 2021 following
In-Person Event LA County Public Health guidelines.
Still Preferred
o LA Tourism has been re-booking events as
early as 2022-2024 and booked some new
business.
o Renovation of LACC delayed but expects to
have shovel in the ground by end of 2021/early
2022.
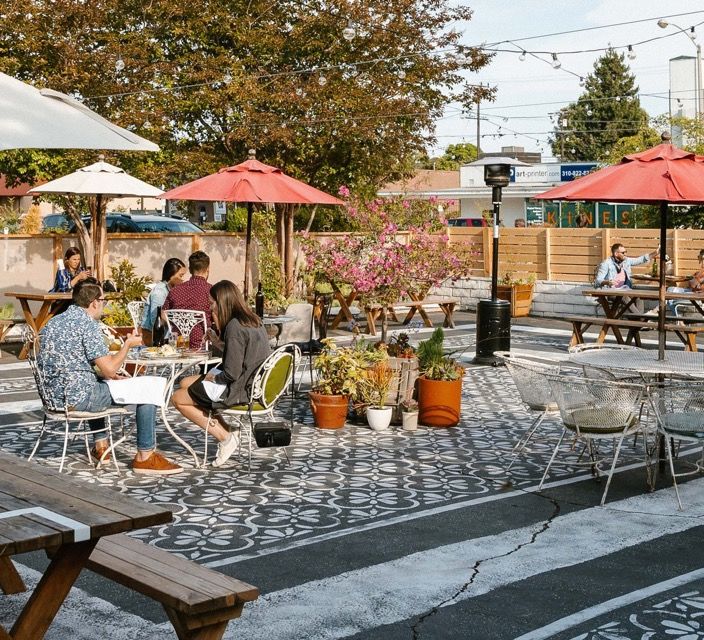
Source: Destination AnalystsTypes of Travel and Activities • In addition to connecting with friends and family, travelers are looking for drive-to regional destinations, beaches and waterfronts, outdoor recreational areas, and places with less crowded, less dense populations. Source: H2R Market Research – Wave 5 Oct 1, 2020
More Americans Now Open to Discounting as a Travel Motivator
  • Beware of rate cutting and discounting…hard hole to climb out of historically.

Source: Destination Analysts
Travel by Personal Car is the Preferred Transportation
 • Rental car firms benefited from uptick in leisure travel with bookings improving over the summer and
   customers renting cars for longer periods.

 • However, the likelihood of traveling by personal car in the next six months has declined to lowest level
   observed to date.
One in Five Travelers Is Willing To Drive More Than 500 Miles
(Each Way) For A Leisure Trip (Next Six Months)
• Lack of confidence in flying and lack of control has resulted in renewed popularity of the “road trip.”
• Fall gas prices have not been this low since 2017, and 80% of travelers planning to drive will save about
  $16 per fill up compared to this time last year.
Overnight, the Roadside Motel is a Hot Commodity

• “Hitting the open road” has been a saving grace for
  midscale and economy roadside and small-town hotels.

• Exterior corridor properties have a new shine as
  travelers shy away from close human contact.

• Guests can drive to their room’s front door, use a mobile
  check-in, and even order food and beverage via an app.
Staycations
      • “Staycations” typically means spending a vacation enjoying the local region/area. It often includes going to
        restaurants and attractions not frequented before and staying overnight in a local hotel.

      • Hesitation to travel increased interest in “staycations” this summer which will most likely continue into 2021.

Source: Destination Analysts
Workcations and Daycations
• “Working from home” does not necessarily mean “home.”
• “Workcations” are being enjoyed by those, often called Digital
Nomads, who want to work in a fun, relaxing environment
outside their home, even if just for a day or two.
• Day-use guest is hyper local with over 60% coming from 25
miles ore less.
• Ideal “workcation” destinations are
relaxing, safe, on waterfronts, and offer
high speed WIFI, Internet, of course.
Source: Destination AnalystsMost and Least Marketable Traveler Most Marketable • Get out of the house for a staycation or workcation • Willing to drive up to 300+ mile from home • Re-connect with friends and family but also looking for fun, relaxing, stress free, leisure experiences • Feel safest outdoors at beaches, hiking, parks, etc. • Promotions are motivating but safety is most important factor • Need updated information and transparency about a destination’s safety practices and restrictions Least Marketable • International Visitors • Business Travelers • Group Meetings and Conferences • Large Social Functions
RECOVERY FORECASTS
Anatomy of the Travel Industry Recovery

                                                                                              • Consumer side will recover
                     Initial recovery               Began Summer 2020                           sooner than the supply side.

                 •     Leisure                                                                •   Demand is and will be there.
                 •     Especially drive                                                       • The challenge will be to
                                                                                                minimize the supply side
                                                                                                damage and reset the industry
                                     Secondary recovery          Begins 2021Q1                  each step of the travel journey.
                                 •    Essential business
                                 •    Small- and medium-size groups
                                 •    Regional international (intra-Americas, intra-Europe)

                                                    Final recovery            Begins 2021Q3
                                                •     Long-haul international Return to “normal” levels of travel
                                                •     Large events           likely be 2023.

Source: Tourism Economics
Los Angeles County Five-Year Visitor Forecast
as of November 2020
• LA Tourism and Convention Board forecasts show total visitation expected to recover to 2019 levels by 2024.
Millions 2019 2020 % Chg. 2021 % Chg. 2022 % Chg. 2023 % Chg. 2024 % Chg.
Total Visitors 50.7 28.3 -44.1% 39.3 38.5% 46.0 17.2% 49.3 7.2% 52.0 5.3%
Domestic Visitors 43.3 26.9 -37.8% 36.6 35.9% 41.5 13.4% 43.4 4.6% 45.1 3.8%
International
Visitors 7.4 1.4 -80.8% 2.7 87.8% 4.5 70.0% 5.9 31.1% 6.9 15.8%
Canada 0.77 0.19 -75.1% 0.35 89.2% 0.58 58.3% 0.71 23.8% 0.78 9.8%
Mexico 1.73 0.40 -76.9% 0.77 91.3% 1.17 53.2% 1.44 23.6% 1.62 12.1%
China 1.17 0.15 -87.3% 0.29 92.4% 0.58 103.7% 0.88 47.4% 1.08 25.7%
Australia 0.42 0.07 -82.5% 0.14 90.6% 0.25 79.5% 0.33 32.4% 0.39 17.7%
United Kingdom 0.38 0.64 -83.3% 0.12 83.8% 0.21 77.8% 0.28 36.3% 0.33 17.5%
France 0.33 0.05 -83.7% 0.09 78.9% 0.18 86.1% 0.24 35.1% 0.28 18.0%
Japan 0.35 0.07 -79.3% 0.10 44.8% 0.19 90.3% 0.27 35.7% 0.30 13.0%
Source: Tourism Economics; LA Tourism and Convention BoardU.S. and L.A. County Hotel Forecast • Hotel demand will catch sight of normalcy in the second half of 2021 with full recovery in 2023. RevPar not likely to recover to 2019 levels until 2024. L.A. County Hotel Forecast 2019 2020 YOY Chg. % 2021 YOY Chg. % Occupancy 79.7% 50.6% -36.5% 62.5% 23.4% ADR $180.39 $139.68 -22.6% $142.60 2.1% RevPar $143.74 $70.74 -50.8% $89.12 26.0% Assumes no new supply in November - December 2020 or in 2021 Source: Tourism Economics, November 2020
Thank you!

Keep Well…and Wear
    Your Mask!

wkheel@gmail.com
Outlook for Santa Monica Hotels
& Fall 2020 Visitor Profile
November 19, 2020
Market Research | ConsultingOverview - Method
§ We all know this year has been (politely) difficult and challenging. But when we quantify the
situation, we can visualize and (more) rationally understand what is happening and where we
could be going from here.
Hotel Market
§ We have been tracking hotel performance for the past year (2019), the current year 2020 and
forecast for 2021, presented by month.
q Performance data is from Smith Travel Research, STR reports Santa Monica Travel & Tourism receives
weekly.
q We used market occupancy as reported by STR
q We adjusted STR reported supply based on hotel closures tracked by SMTT
q We adjusted market ADR downward by 5% to account for the economy properties not included in
the STR data sample
Visitor Profile
§ We conducted on-site interviews among non-local visitors (out of L A County), and for the first
time as the market has shifted, we surveyed LA County residents visiting Santa Monica.
Market Research | ConsultingIn Sum…
What Do We Know – What Do We Think?
§ We already know the Santa Monica economy, including business activity, taxes, jobs and support of city
services is highly reliant on tourism.
§ The disruptive impacts from COVID-19 of this magnitude are reverberating throughout the city.
§ As a well known and beloved beach community Santa Monica’s plethora of outdoor areas and its temperate
climate are a hedge against harsher impacts other areas are experiencing.
§ The city’s lodging industry has enjoyed competitively high occupancy and room rates, strongly emerging
from and sustaining since the 2008-2012 recession until this past March. Since May, hotel demand has been
slowly rebuilding; it is expected to take another 3 – 4 years to return to 2019 levels.
§ However, the pandemic has most impacted the international segment, which has comprised about 50% of
the city’s visitor volume and over 50% of its total visitor spending. This segment has virtually disappeared
and is expected to take longest to return visiting the U.S.
§ Santa Monica as a destination and its hotels can (continue) marketing to visitors from California and the
western U.S., encouraging overnight stays until longer-haul markets travel here again. Over the next 3 – 4
years expect Santa Monica visitor volume, stays and spending to be well below the base year of 2019.
§ Overall, the tourism market has shifted - this may be what the market “is.” SMTT and destination
stakeholders can all benefit by working together for the common good, by optimizing the situation for the
short term and considering strategies for the “new” Santa Monica now, and into and after 2024.
§ This is an opportunity (though born of distress).
Market Research | Consulting1. 2019 & 2020 Scenario
§ Overall Tourism and Hotel Performance Indicators
Market Research | ConsultingOverview – What (the) Forecast Did We Expect?
§ In 2019 Santa Monica tourism was essentially flat but just below the record year of 2018.
§ 2020 began with tourism was humming along (mainly) in Santa Monica, the Los Angeles
region, state of California and the world. However, areas including Santa Monica highly
dependent on international travel, had already seen this segment softening in 2019.
§ For 2020, the economy, consumer attitudes and other indicators lead to expectations of
continued strength, with minor slowing, after 7 years of notable growth from the recession.
§ A summary of Santa Monica 2019 and 2018 key visitor performance measures:
2019
Indicator Number % Change 2018
Total Number of Visitors 8,413,100 .2% 8,399,000
Average Length of Stay (days, all visitors) 1.37 - 1.37
Total Visitor Days 11,528,200 .1% 11,511,600
Total Annual Visitor Spending $1.89 billion -2.2% $1.93 billion
Per-capita Daily Visitor Spending $164 -2.4% $168
Hotel Tax Revenue to City (from non-local visitors)2 $58,315,740 -.5% $58,597,400
Visitor Retail Sales Tax Revenue to City $13,875,500 -4.2% $14,487,400
Equivalent tax per SM household from visitor spend $1,496 -2.9% $1,540
Santa Monica Jobs Supported by Tourism 12,010 -4.4% 12,573
Market Research | ConsultingSanta Monica Hotel Occupancy
§ …And Then Came March! (in like a lion, out like a bomb…)
§ 2020 January and February occupancy rates were just a shade lower than 2019.
§ Tourism began slowing late February, plunging by the end of March, bottoming in April.
§ There was some upward momentum in August and September. J
§ We project a 43% year-end occupancy rate for 2020, versus 82.5% for 2019, a 48% drop. L
Actual/Projected Occupancy
(calendar year)
100.0%
82.5%
80.0%
60.0%
40.0%
20.0% 43.2%
0.0%
Jan Feb Mar Apr May Jun Jul Aug Sep Oct Nov Dec Tot
Year
2020 2019 Linear (2020) Linear (2019)
Market Research | ConsultingSanta Monica Hotel Demand
§ January and February 2020 room demand was slightly above 2019 (Feb. was a leap month)
§ With the Lower Occupancy – coupled with hotel closures starting in April, demand spiraled
downward thereafter and remained well below 2019 levels.
Room Demand
120,000
97,658
100,000
80,000
Rooms
60,000
40,000 43,309
20,000
- 6,807
Jan Feb Mar Apr May Jun Jul Aug Sep Oct Nov Dec
Mo./CY 2020 2019
Market Research | ConsultingSanta Monica Hotel Room Average Rate
§ As has been a pattern in past demand crises, not surprisingly average rate suffered as
demand fell.
§ Rate did pick up some momentum closing the rate gap (more so than occupancy)as the
year progressed.
§ We project 2020 ADR to end at about $260, a 22% drop from $331 in 2019.
Avg. Daily Room Rate
$500.00
$400.00 $330.90
$302.77
$300.00
$200.00
$259.49
$100.00 $142.95
$0.00
Jan Feb Mar Apr May Jun Jul Aug Sep Oct Nov Dec Tot Yr
2020 2019
Market Research | ConsultingSanta Monica Hotel Total Room Revenue
§ Given the drop in occupancy, demand and ARD, total room revenue plunged from $30
million in February to $13 million in March and then under $1 million by April.
§ Revenues inched up thereafter but didn’t close the gap to 2019 revenues.
Total Room Revenue
$45,000,000
$40,000,000
$35,000,000 $30,809,371
$30,000,000
REVENUE ($)
$25,000,000
$20,000,000
$15,000,000
$13,112,624
$10,000,000
$5,000,000 $972,968
$-
Jan Feb Mar Apr May Jun Jul Aug Sep Oct Nov Dec
MO/CY 2020 2019
Market Research | Consulting2. Forecast for 2021
§ Hotel Performance Indicators
Market Research | ConsultingFactors Driving the Lodging Forecast
§ Projecting to the end of calendar 2021, the year can be considered as one of “rebuilding.”
§ For the overall lodging industry, we expect occupancy, ADR, demand and revenue to:
q grow albeit slowly, especially in the first half of 2021
q pick up momentum into the second half of the year but still well below 2019 rates
q The lodging market will reflect the shift in visitation to more regional and U.S. domestic visitors and
far fewer international visitors
§ Our forecast is based on several factors:
q A new national approach to slow COVID infection nationwide when the new administration takes
office
q A COVID vaccine that at least half the population has access to and is willing to take (by the end of
the first half of the year)
q Evident and continued decreases in COVID infections as the year progresses; that will help restore
consumer confidence to travel
q For the Santa Monica destination, enough venues (e.g., attractions, restaurants, culture/arts, etc.) are
open and perceived safe by visitors to make the visit engaging and worthwhile
q Forecasts by national tourism experts that leisure (and business) travel will not recover to 2019
levels until 2024, making this a three-year recovery process. And recovery assumes COVID is under
control with no new health or other crisis erupting between now and then.
Market Research | ConsultingOccupancy
§ We expect occupancy: Actual/Projected Occupancy
(calendar year)
q Will start 2021 below 2019 and 2020 but
after March remain at levels above 2020 100.0%
82.5%
80.0%
59.6%
q Show slow grow in the first half of 2021 60.0%
43.2%
40.0%
q Pick up momentum into the second half
20.0%
of the year (but still well below 2019
rates) 0.0%
Jan Feb Mar Apr May Jun Jul Aug Sep Oct Nov Dec Tot
Year
q Finish the year nearly 60% occupancy, in- 2021 2020 2019 Linear ( 2021) Linear ( 2020) Linear ( 2019)
between 82.5% in 2019 and the 40% -
45% range we expect for 2020 overall
Market Research | ConsultingDemand 120,000
Room Demand
111,124
100,000
§ As a function of occupancy (and
supply), the growth pattern for 80,000 95,534
demand is similar to occupancy.
Rooms
60,000
§ With the expectation that the 40,000
factors for containing COVID and 48,163
20,000
encouraging travel occur:
q we foresee a strong rise into -
Jan Feb Mar Apr May Jun Jul Aug Sep Oct Nov Dec
summer; August demand could
reach 85% of 2019 July and August
Mo./CY 2021 2020 2019
levels (versus 60% lower this past
August).
q 2020 demand would total 575,100 Total Annual Room Demand
rooms, 52% below 2019. 1,400,000 1,189,636
1,200,000
q 2021 demand would reach nearly 1,000,000
893,790
900,000 rooms, up 55% from 2020, 800,000
575,100
and about 25% below 2019. 600,000
400,000
200,000
-
2019 2020 2021
Market Research | ConsultingAverage Rate
§ 2020 ADR started about $10/night Avg. Daily Room Rate
below 2019. By April ADR had plunged
to $142. $450.00
$400.00
§ Rate has recovered but slowly since $303.62 $330.90
$332.88
then. Given this pattern we expect ADR $350.00
to average $259 for 2020, $70 or 22% $300.00 $292.00 $268.34
below 2019 ADR of $331. $250.00
$200.00
§ Again given all COVID recovery factors $237.50 $259.49
noted above, for 2021 we expect a slow $150.00 $142.95
but steady rise in ADR to reach $268 $100.00
for 2021 overall, about 20% below 2019 $50.00
and 3% above 2020. $0.00
Jan Feb Mar Apr May Jun Jul Aug Sep Oct Nov Dec Tot Yr
§ Of note, hotel revenue managers have
discretion to adjust rate as demand 2021 2020 2019
dictates. This rate forecast is likely to
vary more in real time than demand as
the year progresses.
Market Research | ConsultingTotal Room Revenue
Total Room Revenue
§ The result of demand and room $50,000,000
rate is total room revenue. $40,000,000
REVENUE ($)
$30,000,000
§ We expect 2020 to end with $20,000,000
$149 million of total revenue, off $10,000,000
by $244 million or 62% below $-
2019. Jan Feb Mar Apr May Jun Jul Aug Sep Oct Nov Dec
MO/CY 2021 2020 2019
§ We forecast 2021 to recover
about $90 million to reach a total $450,000,000
$393,653,070
of about $240 million, a 61% $400,000,000
increase over 2020. $350,000,000
$300,000,000
$239,838,755
$250,000,000
$200,000,000
$148,884,152
$150,000,000
$100,000,000
$50,000,000
$-
2019 2020 2021
Market Research | Consulting3.Visitor Profiles - Fall 2020 &
2019
Market Research | ConsultingVisitor Profile - Methodology
Surveying Overview
§ On-site interviewing using QR code self-administered surveys on respondents’ mobile
device, overseen by professional interviewers.
§ Surveying on Main Street, Third Street Promenade and the Pier
§ Surveying on weekends starting October 3 - 4 through November 15.
§ A total of 170 visitors took the survey of which 13 were in hotels
§ Data comparable to Fall 2019 as shown in parentheses ( ) after the Fall 2020 data result
Definition of a Visitor
§ A visitor is anyone from outside Los Angeles County in Santa Monica for any temporary
purpose other than to work or to attend school.
Market Research | ConsultingFall Visitors – Now Most All U.S. Residents
§ In Fall 2020 the difference is the lack of International visitors since Fall 2019, at 3% now
versus 50% then.
§ Perhaps surprisingly is the strength of U.S. Domestic at 59% this Fall versus 32% last Fall.
Fall 2019 Fall 2020
Int'l.
2.9%
Calif.
18.2%
Int'l.
49.9% Calif
37.6%
Other US Other U.S.
31.9% 59.4%
Market Research | ConsultingProfile of Non-Local Visitors (Outside L A County)
§ 58% (60%) have visited Santa Monica in the past three years
§ Impressions have improved among past visitors) since last visiting compared to 2019.
Fall Fall
2020 2019
Base: Visited SM 98 217
Gotten better 32.7% 12.9%
Stayed about the same 58.2% 74.7%
Gotten worse 9.2% 12.4%
Mean rating (3=Better, 1=Worse): 2.23 2.00
§ 47% (41%) are visiting mainly for vacation/leisure
§ Santa Monica is the main destination for 47% (27%) of all visitors; usually higher when
visitor origin closer to the destination
§ To arrive in the L A Region 48% (26%) used a personal vehicle,13% (3%) used a rental
vehicle, and 28% (67%) came by commercial air, a strong reflection of the times this Fall.
Market Research | ConsultingMain Venues & Activities Similar but by Fewer
SM Top Venues visited SM Top Visitor Activities
2020 2019 2020 2019
Fall Fall Fall Fall
Base: Visitor 170 Base: Visitor 363 Base: Visitor 170 Base: Visitor 363
Santa Monica Pier 78.2% Santa Monica Pier 81.5% Sightsee/explore SM 64.7% Sightsee/explore SM 59.0%
Santa Monica Beach 30.6% Santa Monica Beach 62.0% Eat in restaurants 49.4% Eat in restaurants 65.3%
3rd St. Promenade 28.2% 3rd St. Promenade 53.2% Go shopping 40.0% Go shopping 41.6%
Santa Monica Place 15.3% Santa Monica Place 35.5% Santa Monica Beach 29.4% Santa Monica Beach 45.2%
Pacific Park * 13.5% Main Street 23.1% Cultural: museums/art 10.0% Visit/socialize/attend family or 31.1%
Main Street 12.4% Pico Blvd. areas 16.8% galleries/theater personal event
Other DTSM (excl. 3rd St.) 8.8% Montana Avenue 12.1%
Montana Avenue 5.9% Pacific Park 10.7%
* Pacific Park is closed in 2020 but its food court and retail shop are open
Market Research | ConsultingMore Staying Overnight in Santa Monica
More Overnighters Staying in Hotels
Shorter Stays
Overnight Trip Length of Stay
2020 2019
Percent staying overnight Fall Fall
Base: Visitor 170 363 Mean nights per respondent Fall Fall
Overall 80.0% 92.0% Base: All Visitors Avg. Nights 170 363
Nights in Santa Monica 54.1% 32.8% Overall 4.53 8.36
Nights in Los Angeles area (excl. SM) 41.2% 70.2% Nights in Santa Monica 1.42 1.24
Nights in all other locations/ 24.7% 45.7% Nights in Los Angeles area (excl. SM) 1.51 3.36
destinations Nights in all other locations/ 1.07 3.68
destinations
2020 2019 Minimum Base: Overnight Avg. Nights 42 119
Fall Fall Overall 5.66 9.08
Base: Staying in SM 92 119 Nights in Santa Monica 2.62 3.78
Paid Hotel or motel 65.2% 46.2% Nights in Los Angeles area (excl. SM) 3.66 4.79
Unpaid Private home/condo or 7.6% 33.6% Nights in all other locations/ 4.33 8.04
apartment of friends, family destinations
Short term rental (e.g., AirBnB) 6.5% 14.3%
Paid Corporate long-stay lodging 4.3% 1.7%
Santa Monica hostel 3.3% 2.5%
Both paid and unpaid lodging 0.0% 0.8%
Other 13.0% 0.8%
Market Research | ConsultingSpending Incidence and Amount Much Reduced
This Fall from Fall 2019
Spending Incidence by Category Mean Per-Capita Spending By Category
Spending Incidence: Percentage of 2020 2019 2020 2019
visitor groups spending in category Fall Fall Mean spending per individual visitor Fall Fall
Base: Visitor 170 363 Base: Visitor 170 363
Overall 80.6% 85.7% Overall $74.36 $137.70
Meals out/snacks 54.7% 62.8% Lodging (per night – not rate) 28.09 25.81
Drinks/Beverages 42.4% 56.7% Meals out/snacks 17.96 25.13
Shopping/Gifts/Souvenirs 42.4% 38.6% Shopping/Gifts/Souvenirs 14.83 68.69
Lodging 28.8% 17.4% Drinks/Beverages 8.39 9.39
Activity rental fees 10.0% 8.0% Activity rental fees 1.63 1.39
Local Transportation 8.2% 22.3% Attractions/entertainment 1.41 1.26
Groceries/personal items/incidentals 6.5% 6.9% Groceries/personal items/incidentals 1.00 2.26
Attractions/entertainment 4.1% 5.5% Local Transportation 0.89 2.02
Spa/beauty/health services/products 1.8% 1.4% Other 0.11 1.34
Other 0.6% 0.3% Spa/beauty/health services/products 0.06 0.40
None/No spending 19.4% 14.3%
Market Research | ConsultingThis Fall More Couples, Friends, Fewer Families
Visitors Far Younger, Lower Income
§ Travel group – more couples and friends groups, fewer families
2020 2019
Fall Fall
Base: Visitor 170 363
A couple 31.8% 25.9%
A family group 27.1% 34.7%
Group of friends, co-workers, colleagues 25.9% 12.1%
Alone 9.4% 24.0%
A mixed group family/friends 1.8% 1.4%
Other 4.1% 1.9%
§ Travel group this Fall of 3.2 persons versus 2.3 in 2019
§ Respondent median age 28 versus nearly 41 last Fall
§ 2020 median household income of $56,000 versus $97,300 last Fall
Market Research | ConsultingThank You! Market Research | Consulting
Shines Advertising Campaign Performance August 3 – October 31

• 38,000 website engagements on SantaMonicaShines.com

• 6,200 Room Nights Generated via Expedia from users exposed to our campaign; Room
  nights booked on Expedia YOY on were up 18% (LA is down by 24% for comparison)

• Paid Social is Top Performing Channel, delivering 24 million impressions

• Top Converting Age Group: 35-44

• Started with Southern California, but expanded geotargeting to statewide campaigns in
  Arizona, Nevada California. Currently scaling back due to rising case counts and California
  Travel Advisory

• Deployed refreshed creative earlier this month after conducting photoshoot to capture
  COVID-19 safety and cleanliness, diversity, socially distanced activities
Santa Monica Shines COVID-19 Assurance Program:

Congratulations to the 38 businesses who have earned their seal – many
more are in progress! 180 total businesses have signed up to date.
Pre-COVID: Santa Monica Experience Management Plan

8 Strategies to Nurture the Santa Monica Experience Through 2030

1. Support and enhance Santa Monica’s most important facets

2. Highlight and leverage cultural and historic experiences

3. Foster memorable accommodation experiences that enhance the value proposition

4. Promote a diversity of retail, dining, and evening experiences

5. Support livability for Santa Monica residents

6. Facilitate the viability of small and unique businesses

7. Enhance mobility for visitors and residents

8. Ensure Santa Monica continues to be a clean and safe place
City of Santa Monica Economic Recovery Task Force Formed in April 2020

Key Areas of Focus
How do the Two Intersect? City of Santa Monica Economic Recovery Task Force
Key Areas of Focus + Santa Monica Experience Management Plan Strategies
THANK YOU FOR HELPING SANTA MONICA SHINE!
You can also read