Causal Nexus between Sci-Tech Talent and Economic Growth in the Pan-Yangtze River Delta of China
←
→
Page content transcription
If your browser does not render page correctly, please read the page content below
sustainability

Article
Causal Nexus between Sci-Tech Talent and Economic Growth in
the Pan-Yangtze River Delta of China
Chenhui Hu and Haining Jiang *

                                          College of Geography and Environmental Sciences, Zhejiang Normal University, Jinhua 321004, China;
                                          hch2268@zjnu.edu.cn
                                          * Correspondence: jhn841263@zjnu.cn

                                          Abstract: Spatial coupling analysis, cointegration, and the Granger causality test model were adapted
                                          from a geographical perspective to analyse the relationship between sci-tech talent and economic
                                          growth, as well as their spatial differences in the Pan-Yangtze River Delta from 1998 to 2019. The
                                          results demonstrate that the sci-tech talent centre of gravity and economic centre of gravity are
                                          close to each other, showing as two parallel chains, and there is higher spatial overlap and variation
                                          consistency between centres of gravity. Sci-tech talent and economic growth are in a long-term
                                          relationship of equilibrium, showing a better fitting cointegration equation, in which the latter affects
                                          the former. Shanghai has the greatest elasticity, with a 2.119 coefficient of sci-tech talent, while
                                          Zhejiang has the smallest elasticity with a coefficient of 0.859. There are differences in the causal
                                          nexus between sci-tech talent and economic growth. Economic growth has a unidirectional effect on
                                          sci-tech talent in Shanghai and Jiangsu while sci-tech talent has a unidirectional effect on economic
                                          growth in Zhejiang. There is a bidirectional effect between sci-tech talent and economic growth in
                                          Anhui. There is also a unidirectional effect from economic growth to sci-tech talent in the entire
                                Pan-Yangtze River Delta.


Citation: Hu, C.; Jiang, H. Causal        Keywords: karmic connection; overseas high-level returned talents; location choice; the Bohai Rim
Nexus between Sci-Tech Talent and         region sci-tech talent; economic growth; Granger causality; Pan-Yangtze River Delta
Economic Growth in the Pan-Yangtze
River Delta of China. Sustainability
2021, 13, 6707. https://doi.org/
10.3390/su13126707                        1. Introduction
                                               With social development and progress, science and technology have increasingly
Academic Editor: Ermanno Tortia
                                          become a decisive force for economic growth, and sci-tech talent, as carriers of scientific
                                          and technological innovation, have played an increasingly prominent role in economic
Received: 16 April 2021
Accepted: 8 June 2021
                                          development [1,2]. Tryggvi quantified the impact of talent cultivation, capital, working
Published: 12 June 2021
                                          hours, and TFP on economic growth by using relevant data from five Nordic countries and
                                          concluded that 12–33% of the economic growth came from the input in talent cultivation [3].
Publisher’s Note: MDPI stays neutral
                                          At the same time, economic growth has become an important factor in the location choice
with regard to jurisdictional claims in
                                          of sci-tech talent [4], as many scholars have found that sci-tech talent are more inclined to
published maps and institutional affil-   flow into high-grade cities with advanced economic development in location selection [5,6].
iations.                                  The topic has been the focus of extensive attention by many scholars at home and abroad,
                                          who have obtained relatively fruitful results.
                                               More specifically, existing studies mainly focus on the agglomeration of regional sci-
                                          tech talent and its role in knowledge spillover or innovation promotion, which can promote
Copyright: © 2021 by the authors.
                                          regional economic growth [7–10]. In addition, as a specific part of human capital, sci-tach
Licensee MDPI, Basel, Switzerland.
                                          talent is effective with the increasing of human capital, and more varied quantitative mea-
This article is an open access article
                                          sures are aimed at the direct influence of human capital on regional economic development.
distributed under the terms and           Nelson et al. believe that human capital accelerates the development of national frontier
conditions of the Creative Commons        science and technology, thus improving the total factor productivity and economic growth
Attribution (CC BY) license (https://     of the country [11]. Feng and Li discussed the influence of human capital structure on
creativecommons.org/licenses/by/          economic growth based on the theoretical paradigm of new structural economics, and the
4.0/).                                    results showed that middle- and high-level human capital had a better promoting effect on

Sustainability 2021, 13, 6707. https://doi.org/10.3390/su13126707                                    https://www.mdpi.com/journal/sustainability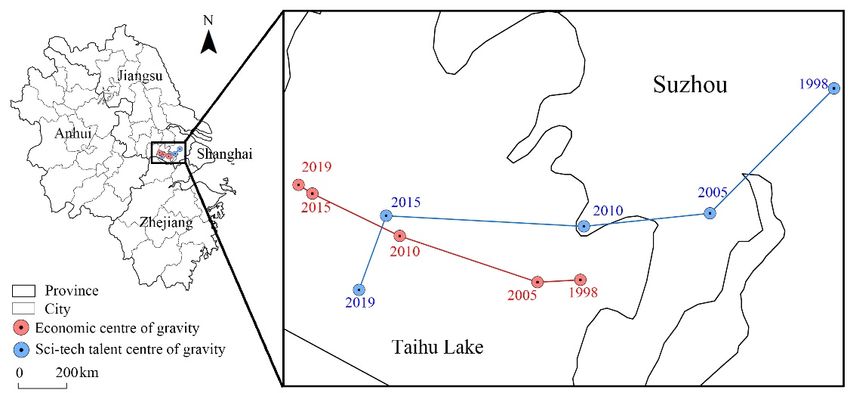
Sustainability 2021, 13, 6707 2 of 18
economic development [12]. In addition, many scholars believe that sci-tech talent has a
significant driving effect on regional economic growth in China, where there is a long-term
and effective interaction between both [13–15]. For example, Wang empirically analysed
the interaction effect and lag effect among talent agglomeration, scientific and technological
innovation, and economic growth in 31 provinces of China from 1998 to 2017 and found
that an increase in sci-tech talent could drive economic growth, and the effect on economic
growth was gradually enhanced [16]. The OLS, SLM, and SEM methods were adopted by
Xu to test the relationship between innovative human capital and provincial economy, and
the results showed that human capital played an important role in economic growth in all
Chinese provinces [17]. On the other hand, the development of a regional economy can
often effectively drive the inflow and training of sci-tech talent [18], and as the basic guar-
antee of local quality, the regional economy has a direct impact on facilities, income, etc.,
thus determining the distribution of talent [19,20]. Factors such as the regional economic
gap lead to the distribution characteristics of high-level talent flow in China, which shows
the pattern of net inflow from the east and net outflow from the northeast and midwest [21].
However, few studies have conducted empirical analyses on the influence mechanism or
formation effect between sci-tech talent and economic growth, which are related to the
perspective of many factors, including sci-tech talent or economic growth [22,23].
Obviously, it can be fully verified from the existing research conclusions whether a
close promoting relationship exists between sci-tech talent and economic growth, which
is more significant in the region of relatively high scientific and technological innovation
and economic development. In addition, the Pan-Yangtze River Delta is among the regions
with the most dynamic economic development, the highest degree of openness, and the
strongest innovation capacity in China. The Pan-Yangtze River Delta has effectively driven
economic growth through the agglomeration of scientific and technological human capital.
Its high level of economic development has attracted many research institutions and
positions and much sci-tech talent [24,25]. The sci-tech talent and economic growth of
all provinces and cities in the Pan-Yangtze River Delta showed an evolutionary trend of
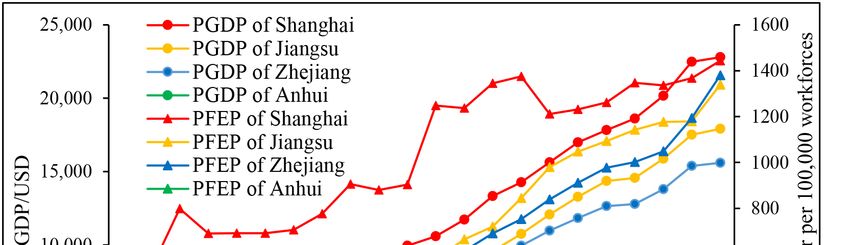
annual growth from 1998 to 2019, which is supported by the existing conclusions (Figure 1).
It is typical and representative to choose this region as the research object, but problems
remain such as whether there is ‘spurious regression’ between both, which few scholars
have analysed empirically.
Figure 1. Evolution of sci-tech talent and economic growth in the Pan-Yangtze River Delta from 1998
to 2019.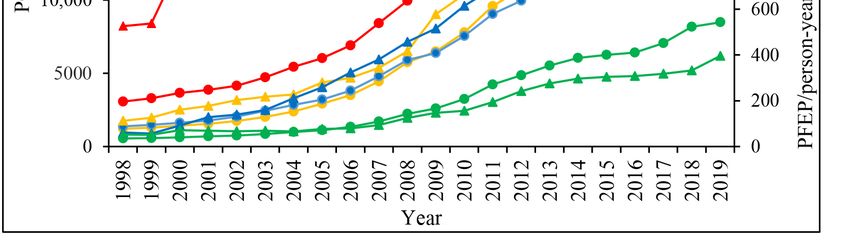
Sustainability 2021, 13, 6707                                                                                            3 of 18

                                      Therefore, this study adopts spatial coupling analysis, cointegration, and the Granger
                                causality test model to quantitatively measure whether a mutually promoting relationship
                                exists between sci-tech talent and economic growth in the provinces and cities of the
                                Pan-Yangtze River Delta. The full-time equivalent of research and development (R&D)
                                personnel per 100,000 laborers (PFEP) and per capita gross domestic product (PGDP) of
                                the Pan-Yangtze River Delta are taken in this study as the research objects to explore the
                                causal nexus between both, thus further reflecting the interplay between sci-tech talent and
                                economic growth. On this basis, this study tries to solve the following scientific problems.
                                Does sci-tech talent have a positive effect on economic growth in different regions? Is there
                                a corresponding effect on the reverse?
                                      Through an in-depth study of the causal mechanism between sci-tech talent and
                                economic growth, as well as their spatial differences, and in light of describing the interplay
                                between both factors in the Pan-Yangtze River Delta, this paper reflects and verifies the
                                existence of a direct positive relationship. The structure is as follows. Section 2 provides a
                                literature review on the causal mechanism between sci-tech talent and economic growth.
                                Section 3 briefly introduces the data and methodology used in this study. Section 4
                                analyses the spatial coupling, while Sections 5 and 6 focus on the empirical analysis of
                                the causal mechanism. Section 7 discusses the conclusions and provides implications for
                                further research.

                                2. Literature Review
                                     Sci-tech talent is the first resource for economic growth and the development of a
                                country or region. For example, Silicon Valley, the North Carolina Triangle Science Park,
                                and many other advanced industrial parks in the United States have attracted talent
                                globally, making important contributions to American economic development [26,27]. A
                                number of ‘technology cities’ with intensive high-tech research and manufacturing were
                                built around the Japanese islands, gathering much sci-tech talent to achieve rapid economic
                                growth [28]. In China, the strategy of reinvigorating the country through human resource
                                development has long been an important link in the national strategic system, as ‘The
                                Outline of the National Medium- and Long-Term Talent Development Plan (2010–2020)’
                                clearly points out that sci-tech talent is the primary resource for Chinese economic and
                                social development and one of the keys to implementing China’s reform and opening up
                                to the outside world [29].
                                     The importance that countries attach to sci-tech talent obviously stems from its role in
                                regional development. Additionally, the specific interaction between sci-tech talent and
                                economic growth presents a unidirectional or bidirectional activity relationship, rooted in
                                the influence of one part on another. On the one hand, an increase in sci-tech talent has
                                a positive effect on economic growth [30–32]. For example, Lucas emphasised that the
                                accumulation of human capital is the main driving force for economic growth and is a key
                                factor in promoting industrial development [33]. Uzawa found that the technology of the
                                education sector would affect the linear improvement of technology in the production sector
                                with the accumulation of human capital, thus achieving balanced economic growth in both
                                sectors [34]. As the intermediary of technological innovation, sci-tech talent can produce
                                indirect economic growth effect [11], and as a direct input element, sci-tech talent realises
                                direct economic growth effect through a spillover effect at the same time [35]. Specifically,
                                the growth of sci-tech talent brings the innovation, acquisition, and transformation of
                                knowledge and technology in high-tech industries, promoting the formation of new growth
                                points [36]. Additionally, with the expansion of scientific and technological talent, it can
                                also collaborate on research and development effectively to improve productivity levels,
                                driving the growth of regional economic performance [37]. On the other hand, economic
                                growth has a positive promoting effect on the increase in sci-tech talent [4]. Economic
                                interests are the main inducement to promote talent aggregation, and the level of economic
                                development determines the cohesion of talent in the region [38]. Romer believes that six
                                major factors, including economies of scale, national economy, and personal disposable
Sustainability 2021, 13, 6707 4 of 18
income, are the main drivers of talent agglomeration [39]. Shapiro’s study attributes
the growth of human capital to improved urban productivity and quality of life [40].
Regional economic growth provides the possibility of higher-level research platforms,
suitable environment, sufficient scientific research funds, and high salaries, promoting the
attraction of sci-tech talent [41,42].
Most studies have confirmed the existence of a relationship between sci-tech talent
and economic growth under certain conditions [17,43]. However, further empirical tests
are lacking in the causal nexus between both and whether differences exist in the effects
between different objects or regions in the case of a positive causal relationship. There is a
total of 4.38 million R&D personnel in China, which places China first in the world, while
the number of R&D personnel represents 56.5 person-years per 10,000 people employed,
which is still lower than developed countries. In addition, insufficient innovation and
entrepreneurship abilities are problems, as are the unreasonable structure and layout of
talents, leading to a reduced contribution to economic growth. Therefore, a more detailed
empirical study is needed on the relationship between sci-tech talent and economic growth.
In terms of regional differences, different regional scales and influences lead to regional
competitiveness and many other aspects of difference, including the ability of interaction
between sci-tech talent and economic growth [44,45]. Furthermore, as the gap of science
and technology is often regarded as the main reason for regional economic differences [46],
factors such as the ability of interaction can both create and enhance regional disparities [47],
consistent with the theory of circulatory accumulation. In addition, Mamuneas analysed the
output elasticity of factors and the social rate of return on investment for 51 countries and
found that there is almost no promoting effect on economic development with low stock
accumulation of sci-tech human capital, while it can create balanced and stable investment
returns and effectively promote economic development with a higher stock accumulation
of sci-tech human capital [48]. Based on this, sci-tech talent is increasingly concentrated
in national and regional centres or metropolitan areas [49], creating the distributional
differences and further leading to the Matthew effect that improves the development level
of high-level areas tendentiously in the overall function [50]. However, at the same time, the
cultivation and flow of sci-tech talent plays an important role in improving the interaction
between sci-tech talent and economic growth in each region, narrowing the regional
differences and promoting balanced development [51,52], which is more evident within
developed metropolitan areas [53]. Under the influence of market mechanisms, policy
guidance, and cultural guidance, the region tends to codevelop, promoting the balanced
allocation of regional elements which further promotes the inter-regional flow of sci-tech
talent, creating a new positive cycle and providing impetus for further development [33,54].
However, based on the same characteristics of spatial dependence, the effect between
regions attenuates with the increase in distance [55].
More specifically, the regions can be roughly divided into developed regions and
undeveloped regions, which also differ in the interaction between sci-tech talent and
economic growth due to differences of development degree.
From the perspective of developed regions, the interaction between sci-tech talent
and economic growth takes on more complex forms. It is generally believed that there
is a bidirectional effect in developed regions [39]. For example, in a study of the rela-
tionship between the European creative industry and regional economy, the growth of
creative workforces, as the direct carrier of the creative industry, plays a significant role
in the regional economy, which can explain 60% of the difference in PGDP [56], while
regions with high-level economic development have higher opportunities to attract cre-
ative workforces [57]. In addition, Francis and Chris studied the relationship between
human capital and economic growth in the United States using the Granger causality test
model and found that the accumulation of human capital promotes economic growth,
while economic growth also provides favourable conditions for the formation of human
capital and promotes its accumulation [58]. However, there are also cases that only have
unidirectional effects in developed regions [31,32]. As sci-tech talent has a unidirectionalSustainability 2021, 13, 6707 5 of 18
effect on economic growth, it is closely linked to the development of high-tech industries,
which makes sci-tech talent play the role of driving the development of emerging industries
and to further drive economic growth. At the same time, the limited demand for new
technical talent cannot further drive the agglomeration of sci-tech talent, which is more
significant in regions with the rise of single private technology companies [59]. In addition,
it is more obvious that only economic growth has a unidirectional effect on sci-tech talent.
On the one hand, economic growth provides important guarantees for a series of needs,
such as research platforms, funding, and salaries, which is significantly attractive to sci-tech
talent [49]. On the other hand, economic growth is more influenced by the huge market size
and trade scale in developed regions, diluting the role of sci-tech talent significantly [60].
Additionally, with the advancement and transformation of regional economies, problems
such as structural shortages are further highlighted, which cannot meet the innovation
needs of the new economy [61].
From the perspective of the undeveloped regions, the interaction between sci-tech
talent and economic growth tends to a weak trend, even nonexistent. For example, Hansen
believes that the relationship between human capital returns and regional economic growth
is affected by the size of R&D investment, resulting in a double-threshold effect of R&D
investment according to threshold theory [62]. In addition, Kancs pointed out that only
when the accumulation of technical knowledge reaches a specific critical value can sci-tech
talent promote economic growth [63]. Due to the problems of insufficient accumulation, it
is difficult for undeveloped regions to play the role of sci-tech talent in economic growth,
and inadequate regional economic development makes it difficult to attract sci-tech talent,
which even causes brain drain [21]. However, there can still be a bidirectional effect between
sci-tech talent and economic growth, especially in an emerging developmental regions with
a good development trend. Song constructed a model of ‘bidirectional interaction’ between
scientific and technological innovation talent and economic growth; the long-term cycle
of the two could rely on scientific and technological progress and investment in science
and education [64]. Dai tested the Granger causality on Jiangxi province in central China
and found that the human capital accumulation causes industrial structure upgrading, and
vice versa [65]. Although still small in aggregate, these emerging regions can achieve rapid
growth in the long run, with a long-term balance between sci-tech talent and economic
growth, which is also influenced by external and opening factors, such as industrial transfer,
higher level policy support, etc. [66].
In terms of the development status of various regions in China, the positive association
between sci-tech talent and economic growth is increasingly significant, especially in terms
of the promotion of the economy [17]. However, although the increase in scientific and
technological human capital is accompanied by the process of regional economic growth
and also act as an economic driver, there are great regional differences in scientific and
technological human capital, and their influence on regional economies are also different.
Conversely, the effect of economic growth on scientific and technological talent is the
same. On this basis, according to the data of PFEP and PGDP, this study mainly adopts
the Granger causality test model to analyse the causal nexus and regional differences
between sci-tech talent and economic growth of provinces and cities in the Pan-Yangtze
River Delta and the correlation mechanism between them. Subsequently, we propose the
following hypothesis.
Hypothesis 1. There is a positive relationship between sci-tech talent and economic growth in the
Pan-Yangtze River Delta, and there is a unidirectional effect in developed regions and a bidirectional
effect in undeveloped regions.Sustainability 2021, 13, 6707 6 of 18
3. Data and Methods
3.1. Study Area
It is typical to study the causal relationship between sci-tech talent and economic
growth taking the example of the Pan-Yangtze River Delta of China. In the context of
China’s reform and opening up, the Pan-Yangtze River Delta, the most economically
developed region in China, has significant advantages in terms of regional integration,
economic spillover, and other aspects, with a high degree of openness and division of
labour and cooperation intensity [67]. It concentrates about one quarter of the economic
aggregate in less than 1/25 of China’s land area. According to statistics, the GDP of the
Pan-Yangtze River Delta reached USD 536.5014 trillion in 2019. At the same time, the
Pan-Yangtze River Delta is one of the main areas where sci-tech talent is concentrated. In
2019, the FEP in this region reached 1.54400 million person-years, accounting for 32.16%
of the equivalent in China. This makes the agglomeration of talent and other factors
of production mutually synergistic to promote high-quality regional development [25].
Within the interior region, the Pan-Yangtze River Delta consists of Shanghai as the core
city, Nanjing, Suzhou in Jiangsu Province, Hangzhou and Ningbo in Zhejiang Province
as the regional centre cities, and Hefei in Anhui Province as the peripheral centre city,
which forms the characteristics of “core-periphery”, with a remarkable gradient structure,
and has become one of the most prominent integration areas of economic development
nationally and even globally [68,69]. In 2019, the PGDP of Shanghai, Jiangsu, Zhejiang,
and Anhui reached USD 22,799, USD 17,918, USD 15,601, and USD 8479, respectively, and
the population of each province was 24.2814 million, 80.7 million, 50.3891 million, and
63.659 million, respectively, while the full time equivalent of R&D personnel was 1443.44,
1338.78, 1379.90, and 395.81 person-years per 100,000 workers, respectively. On this basis,
the relative constraints of the flow of sci-tech talent and any other economic factors can
be reduced to a greater extent in the Pan-Yangtze River Delta [70], which establishes a
benign interaction relationship between sci-tech talent and economic growth. Based on the
‘Outline of the Yangtze River Delta Regional Integrated Development Plan’ in 2019, which
Sustainability 2021, 13, 6707 7 of 20
delimits the Pan-Yangtze River Delta into the whole region of Jiangsu, Zhejiang, Anhui,
and Shanghai, this paper studies the ‘1 + 3’ model region, as shown in Figure 2.
Figure
Figure 2.
2. Study
Study area.
area.
3.2. Data
3.2. Data Sources
Sources
Focusing on
Focusing on the
the causal
causal nexus
nexus between
between sci-tech
sci-tech talent
talent and
and economic
economic growth
growth in
in the
the
Pan-Yangtze River Delta, we selected PGDP and PFEP for various provinces
Pan-Yangtze River Delta, we selected PGDP and PFEP for various provinces and cities and cities
in
in the
the Pan-Yangtze
Pan-Yangtze River
River Deltafrom
Delta from1998
1998toto2019.
2019.PGDP
PGDPisisan an important
important indicator
indicator of
of the
the
level of
level of international
internationaleconomic
economicdevelopment.
development.‘R&D
‘R&Dpersonnel’ refers
personnel’ to the
refers to personnel who
the personnel
who participate in the research, management, and auxiliary work of research and experi-
mental development projects, including project (subject) team members, enterprise sci-
ence and technology administrative personnel, and auxiliary personnel who provide ser-
vices directly to project (subject) activities. ‘FEP’ refers to the sum of full-time R&D per-Sustainability 2021, 13, 6707 7 of 18
participate in the research, management, and auxiliary work of research and experimental
development projects, including project (subject) team members, enterprise science and
technology administrative personnel, and auxiliary personnel who provide services directly
to project (subject) activities. ‘FEP’ refers to the sum of full-time R&D personnel and part-
time R&D personnel converted into full-time R&D personnel according to the workload in
the reporting period, which is a more accurate count of the number of R&D personnel and
a more accurate reflection of the extent of participation of regional sci-tech talent compared
with the number of researchers [71]. Additionally, PFEP is the FEP per 100,000 workers,
which is the normalised version of FEP. Data were obtained from the ‘China Statistical
Yearbook’ and ‘China Statistical Yearbook on Science and Technology’ from 1999 to 2020.
3.3. Research Methods
3.3.1. Coupling Analysis of Centre of Gravity
Coupling refers to the phenomenon by which two or more systems or modes of
movement influence each other through various interactions, and the degree of coupling
can effectively measure the degree of coordination between systems [72,73]. If we refer to
the research method of Fan on the spatial coupling of the economic centre of gravity and
population centre of gravity in China [74], the spatial overlap and variation consistency of
the sci-tech talent centre of gravity and economic centre of gravity in the Pan-Yangtze River
Delta were adopted to analyse the changes in the spatial coupling relationship between
them. Spatial overlapping is represented by the spatial distance between two centres of
gravity, and the closer the spatial distance between the two, the higher the spatial overlap.
In the formula, E and P represent the coordinates of different centres of gravity in the same
year, which are (x E , y E ) and (x p , y p ), respectively. The calculation formula is as follows,
created by Fan [74]: q
2 2
S = d GE G P = xE − x p + yE − y p (1)
In addition, the variation consistency is reflected by the vector intersection angle θ
caused by the displacement of the sci-tech talent centre of gravity and the economic centre
of gravity relative to the previous time, whose range is 0◦ ≤ θ ≤ 180◦ . The smaller the θ
change, the more consistent it is. The cosine value of C can be used to represent the change
consistency index (−1 ≤ C ≤ 1), and the larger the value, the more consistent the change.
When C = 1, it means it is completely in the same direction, and when C = −1, it means it is
completely in the opposite direction. Let the longitude and latitude change of the centre of
gravity from the previous time be ∆x and ∆y, respectively. According to the law of cosines,
C = cos θ
2
h i
(∆xE 2 +∆yE 2 )+(∆x p 2 +∆y p 2 )− (∆xE −∆yE )2 +(∆x p −∆y p )
=
(2)
q
2 (∆x E 2 +∆y E 2 )(∆x p 2 +∆y p 2 )
∆x E ∆x p +∆y E ∆y p
= q
(∆x E 2 +∆y E 2 )(∆x p 2 +∆y p 2 )
3.3.2. Granger Causality Test Model
It is necessary to test the stationarity of variables before the Granger causality analysis.
Hence, we use the ADF unit root test to verify the stationarity, to avoid the spurious
regression. In addition, the Engle–Granger two-step test was used to test the cointegration
relationship between variables, to reflect whether there is a long-term stable equilibrium
relationship [75]. The VAR model, including the ADF test and E–G test, regards the study
variables as endogenous variables, constructs the model with each endogenous variable in
the system, and estimates the dynamic relationship of the endogenous variables, which
may be limited by the amount of data. Based on this, the LLC test based on the PVAR
model is also used to improve the accuracy, which considers the time effect and fixed effect
and represents the long-term influence between variables [76].Sustainability 2021, 13, 6707 8 of 18
With the help of the Granger causality test analysis, the specific influence between
the two variables of the leader-lag relationship in the time series can be tested [75,77],
including unidirectional and bidirectional effects. The former means that the previous
behaviour of a variable can affect the current behaviour of another variable, while the latter
means that the previous behaviour of two variables influences the current behaviour of
both. The Granger causality test model is adopted to analyse the causal nexus between
sci-tech talent and economic growth in each region and to compare the differences between
various regions. The specific model of the Granger causality test analysis is as follows:
yt = β 0 + ∑im=1 β i yt−i + ∑im=1 αi xt−i (3)
xt = δ0 + ∑im=1 δi xt−i + ∑im=1 λi yt−i (4)
Specifically, y refers to economic growth, and x means sci-tech talent. In addition,
Model 2.1 is used to reflect whether the previous behaviour of sci-tech talent has an
influence on the current behaviour of economic growth, while Model 2.2 is used to reflect
whether the previous behaviour of economic growth influences sci-tech talent. There are
Sustainability 2021, 13, 6707 four results. Specifically, there is a unidirectional effect from x to y: all the parameters 9before of 20
each lag item of x in Model 2.1 are not 0, while all the parameters before each lag item of y
in Model 2.2 are 0. There is a unidirectional effect from y to x: all the parameters before
each of
item lagx item of y in
in Model 2.1Model
are 0. 2.2 are is
There not 0, while all the
a bidirectional parameters
effect betweenbefore
x andeach
y: alllag
theitem of x
param-
in Model 2.1 are 0. There is a bidirectional effect between x and y: all the parameters
eters before each lag item of x and y are not 0. There is no bidirectional effect between x before
eachy:lag
and allitem of x and y are
the parameters not 0.
before There
each lag is no of
item bidirectional
x and y areeffect
0. between x and y: all the
parameters before each lag item of x and y are 0.
4. Spatial Coupling Analysis of Centre of Gravity
4. Spatial Coupling Analysis of Centre of Gravity
4.1.
4.1. Characteristics
Characteristics of
of the
the Migration
Migration Trajectory of Sci-Tech
Trajectory of Sci-TechTalent
TalentCentre
CentreofofGravity
Gravityand
andEconomic
Economic Centre of Gravity
Centre of Gravity
Using
Using the
the ArcGIS
ArcGIS spatial
spatial analysis
analysis method,
method, the
the sci-tech
sci-tech talent
talent centre
centre of
of gravity
gravity and
economic
economiccentre
centreofofgravity
gravityduring
during thethe
main years
main in the
years Pan-Yangtze
in the Pan-YangtzeRiver DeltaDelta
River are rep-
are
resented on the
represented map
on the mapto further connect
to further connect and
andform
formthe
themigration
migrationtrajectory
trajectoryof
oftwo
two centres
centres
of
of gravity
gravity in
in the
the Pan-Yangtze
Pan-Yangtze River Delta (Figure 3).
Figure
Figure 3.3. The
Themigration
migrationtrajectory
trajectoryof
ofsci-tech
sci-techtalent
talent centre
centre of
of gravity
gravity and
and economic
economic centre
centre of
of gravity
gravity
in
in the
the Pan-Yangtze
Pan-Yangtze River
River Delta.
Delta.
From aa macroscopic
From macroscopic point
point of
of view,
view, all sci-tech talent centres of gravity and economic
centres of
centres of gravity
gravity inin the
the Pan-Yangtze
Pan-Yangtze River
River Delta
Delta are
are concentrated
concentrated in in Suzhou
Suzhou of of Jiangsu;
Jiangsu;
more specifically, the economic centres of gravity are all located in the Taihu LakeSuzhou.
more specifically, the economic centres of gravity are all located in the Taihu Lake of of Su-
Additionally,
zhou. both of
Additionally, them
both are close
of them to thetoborders
are close of Shanghai,
the borders Jiangsu,
of Shanghai, Zhejiang,
Jiangsu, and
Zhejiang,
Anhui,
and whilewhile
Anhui, the moving trajectories
the moving of theofcentres
trajectories of gravity
the centres show as
of gravity twoas
show parallel chains.
two parallel
This indicates
chains. that the that
This indicates geographical characteristics
the geographical of their distribution
characteristics are consistent
of their distribution are with
con-
sistent with the overall characteristics of regional development. In addition, the sci-tech
centre of gravity and economic centre of gravity of sci-tech talent show an obvious con-
vergence, with the characteristics of westward movement, indicating that both the sci-tech
talent and economic growth in the Pan-Yangtze River Delta region have a relatively goodSustainability 2021, 13, 6707 9 of 18
the overall characteristics of regional development. In addition, the sci-tech centre of
gravity and economic centre of gravity of sci-tech talent show an obvious convergence,
with the characteristics of westward movement, indicating that both the sci-tech talent and
economic growth in the Pan-Yangtze River Delta region have a relatively good trend of
balanced development. Although both centres of gravity moved a long distance to the west,
they are still concentrated in the east, near Shanghai, indicating that the overall pattern of
sci-tech talent and economic development remains relatively stable.
From the perspective of a smaller spatial scale, there are some differences in the
migration trajectory of the centre of gravity and economic centre of gravity in the Pan-
Yangtze River Delta. On the one hand, the migration trajectory of the sci-tech talent centre of
gravity proceeds from northeast to southwest, then to northwest, and finally to southwest.
The migration to the southwest is more prominent, while the distance to the west is
longer than that to the south. In addition, the migration trajectory of the sci-tech talent
centre of gravity is significant enough to be an ‘N’ shape with a long migration distance,
indicating that the sci-tech talent in each region changes more significantly. Moreover, the
westward migration was the most significant during 1998–2015, indicating the rapid growth
of sci-tech talent in Anhui, compared with other provinces. The southward migration
was the most significant during 1998–2005 and 2015−2019, mainly because the sci-tech
talent in Zhejiang grew fast in the early stage, while the overall base of sci-tech talent
was small in the Pan-Yangtze River Delta. Meanwhile, the demand for the development
of the science and technology industry has driven the rapid growth of sci-tech talent
in recent years. On the other hand, the migration trajectory of the economic centre of
gravity proceeds from northeast to southwest, then from southeast to northwest, which is
straighter than the migration trajectory of the sci-tech talent centre of gravity at the same
time, indicating that the change of economic growth is more consistent and maintains
a relatively stable situation for a long time. To be specific, there was only a small trend
of the southward migration from 1998 to 2005, mainly related to the fast development
of private economies in Zhejiang. Additionally, the migration to the northwest is more
prominent from 2005 to 2019, indicating the rapid growth of economy of western regions,
with the obvious trend of migration of the economic centre of gravity to Anhui. However,
the distance of migration trajectories has decreased significantly in recent years, indicating
that the equilibrium development trend has slowed down. In addition, there was a more
coordinated development between sci-tech talent and economic growth in Anhui, according
to the relationship between the migration trajectory of the sci-tech talent centre of gravity
and the economic centre of gravity from 2005 to 2015.
4.2. Spatial Coupling Characteristics between Sci-Tech Talent Centre of Gravity and Economic
Centre of Gravity
Based on the spatial analysis using ArcGIS, the spatial coupling relationship between
the centre of gravity of sci-tech talent and the economic centre of gravity in the Pan-Yangtze
River Delta was analysed through spatial overlapping and variation consistency (Figure 4).
The spatial overlap between the sci-tech talent centre of gravity and the economic
centre of gravity in the Pan-Yangtze River Delta always followed a low fluctuation trend,
as the distance between the two centres of gravity remained approximately 9–40 km,
and the overall spatial distance showed a decreasing trend. The overall development
of sci-tech talent and economic growth in the Pan-Yangtze River Delta tended towards
balanced regional development, with better spatial coupling. Specifically, the spatial
distance between the centre of gravity of sci-tech talent and the economic centre of gravity
decreased significantly from 1998 to 2005, and from 2010 to 2015, reaching approximately
23.1 km and 9.6 km, and increasing the spatial overlap significantly, mainly for relatively
increasing sci-tech talent in the western region as compared to other regions. Additionally,
the spatial distance remained relatively stable from 2005 to 2015, showing that sci-tech
talent and economic growth tended to balance in the Pan-Yangtze River Delta in this stage.
However, the spatial distance between the centre of gravity and economic centre of gravity
of sci-tech talent increased from 2015 to 2019, up to 15.1 km, which is less than that in 2010,opment between sci-tech talent and economic growth in Anhui, according to the relation-
ship between the migration trajectory of the sci-tech talent centre of gravity and the eco-
nomic centre of gravity from 2005 to 2015.
Sustainability 2021, 13, 6707 4.2. Spatial Coupling Characteristics between Sci-Tech Talent Centre of Gravity and Economic10 of 18
Centre of Gravity
Based on the spatial analysis using ArcGIS, the spatial coupling relationship between
the centre of gravity of sci-tech talent and the economic centre of gravity in the Pan-Yang-
indicating somewas
tze River Delta emphasis
analysedonthrough
the different
spatialregions to develop
overlapping sci-techconsistency
and variation talent or economic
(Fig-
growth,
ure 4). where the overall balance is still relatively maintained.
Spatial Overlapping 1 Variation Consistency
40
Consistency index
0.75
Distance/km
30
0.5
20
0.25
10
0 Year
0 Year 2005 2010 2015 2019
1998 2005 2010 2015 2019 -0.25
(a) (b)
Figure 4.
Figure 4.(a)
(a)Spatial
Spatialoverlapping andand
overlapping (b) variation consistency
(b) variation between
consistency sci-tech sci-tech
between talent centre of grav-
talent centre of
ity and economic centre of gravity in the Pan-Yangtze River Delta.
gravity and economic centre of gravity in the Pan-Yangtze River Delta.
The spatial
From overlap between
the perspective the sci-tech
of variation talent centre
consistency, of gravity
the spatial and theofeconomic
coupling the sci-tech
centre of gravity in the Pan-Yangtze River Delta always followed a
talent centre of gravity and the economic centre of gravity in the Pan-Yangtzelow fluctuation trend,
River Delta
as the distance
presented between
a wavy trendthe two centres
of first movingofingravity remained
the same approximately
direction 9–40
steadily, then km, and
moving away
thethe
in overall spatial
opposite distance with
direction, showed its acurve
decreasing trend. the
resembling Theshape
overallofdevelopment
the numeralof‘7’. sci-This
tech talent and economic growth in the Pan-Yangtze River Delta tended towards
indicates good coordination consistency between sci-tech talent and economic growth in balanced
regional development, with better spatial coupling. Specifically, the spatial distance be-
the Pan-Yangtze River Delta and that the changes between both were significantly related.
tween the centre of gravity of sci-tech talent and the economic centre of gravity decreased
Specifically, the highest variation consistency was 0.921 in 2015, followed by 2019 and 2005,
significantly from 1998 to 2005, and from 2010 to 2015, reaching approximately 23.1 km
which were 0.910 and 0.741, respectively. This shows that the changes in sci-tech talent and
and 9.6 km, and increasing the spatial overlap significantly, mainly for relatively increas-
economic growth were consistent, but there were still minor differences in the directions of
ing sci-tech talent in the western region as compared to other regions. Additionally, the
change in different regions. In addition, the change consistency in 2019 was negative, only
spatial distance remained relatively stable from 2005 to 2015, showing that sci-tech talent
up to −0.204, further explaining the differences in the directions in different regions, which
and economic growth tended to balance in the Pan-Yangtze River Delta in this stage.
were small, mainly due to the rapid growth of sci-tech talent in Zhejiang. However, in
However, the spatial distance between the centre of gravity and economic centre of grav-
general, the developmental
ity of sci-tech talent increaseddifferences
from 2015intodifferent
2019, upregions are formed
to 15.1 km, which isunder the conditions
less than that in
of relative balance, which is consistent with the spatial overlapping changes of different
regions in the Pan-Yangtze River Delta.
5. Results of Granger Causality Test of Each Province and City in the Pan-Yangtze
River Delta
5.1. Augmented Dickey–Fuller (ADF) Unit Root Test
The software EViews was adopted to test the stability of the time series of variables in
each province and city through the augmented Dickey–Fuller (ADF) unit root test. The
logarithms of the original data are taken, and LnY and LnX are used to represent the data
of economic growth and sci-tech talent processed, while D and DD are used to represent
the first-order and second-order differences, respectively. At a significance level of 1%,
the sequences of LnY and LnX in each region all have unit roots, indicating that they are
nonstationary sequences, which shows that the sequences of LnY and LnX in all regions
are flat under the condition of second-order difference after the operation of the first-order
and second-order differences. Cointegration and Granger causality analyses were carried
out on the two variables in each region since all sequences were second-order flat (Table 1).
5.2. Cointegration Test
The EG two-step method was adopted to test the cointegration relationship between
two variables in each region. Specifically, EViews is adopted to obtain the cointegration
equation and obtain the residual sequence e to carry out the unit root test (Table 2). At
a significance level of 1%, the residual unit root test rejects the null hypothesis of the
existence of unit roots; that is, the residual sequence of each region is stable, so there is a
co-integration relationship between LnY and LnX in each region.Sustainability 2021, 13, 6707 11 of 18
Table 1. Augmented Dickey–Fuller (ADF) unit root test.
ADF Critical Critical Critical
Prob. Result
t−Statistic Value 1% Value 5% Value 10%
LnY −2.855 −3.857 −3.040 −2.661 0.0705 Nonstationary
DLnY −2.874 −4.498 −3.658 −3.269 0.1903 Nonstationary
DDLnY −6.703 −3.857 −3.040 −2.661 0.0000 Stationary
Shanghai
LnX −2.570 −4.468 −3.645 −3.261 0.2955 Nonstationary
DLnX −5.705 −4.498 −3.658 −3.269 0.0009 Stationary
DDLnX −6.236 −2.700 −1.961 −1.607 0.0000 Stationary
LnY −3.457 −3.857 −3.040 −2.661 0.0223 Nonstationary
DLnY −0.863 −2.686 −1.959 −1.607 0.3295 Nonstationary
DDLnY −4.884 −2.700 −1.961 −1.607 0.0001 Stationary
Jiangsu
LnX −1.717 −3.788 −3.012 −2.646 0.4086 Nonstationary
DLnX −3.229 −3.809 −3.021 −2.650 0.0332 Nonstationary
DDLnX −6.477 −2.692 −1.960 −1.607 0.0000 Stationary
LnY −3.188 −3.857 −3.040 −2.661 0.0378 Nonstationary
DLnY −2.809 −4.498 −3.658 −3.269 0.2103 Nonstationary
DDLnY −5.645 −2.700 −1.961 −1.607 0.0000 Stationary
Zhejiang
LnX −5.390 −3.809 −3.021 −2.650 0.0003 Stationary
DLnX −4.439 −3.809 −3.021 −2.650 0.0026 Stationary
DDLnX −9.161 −2.692 −1.960 −1.607 0.0000 Stationary
LnY −2.853 −4.616 −3.710 −3.298 0.1996 Nonstationary
DLnY −2.210 −3.809 −3.021 −2.650 0.2091 Nonstationary
DDLnY −4.875 −2.700 −1.961 −1.607 0.0001 Stationary
Anhui LnX −3.459 −4.572 −3.691 −3.287 0.0748 Nonstationary
DLnX −4.169 −3.809 −3.021 −2.650 0.0046 Stationary
DDLnX −8.270 −2.692 −1.960 −1.607 0.0000 Stationary
Table 2. ADF residual test.
ADF Critical Critical Critical
Prob Result
t-Statistic Value 1% Value 5% Value 10%
Shanghai e −3.531 −2.686 −1.959 −1.607 0.0013 Stationary
Jiangsu e −3.076 −2.686 −1.959 −1.607 0.0039 Stationary
Zhejiang e −3.337 −2.686 −1.959 −1.607 0.0021 Stationary
Anhui e −2.445 −2.692 −1.960 −1.607 0.0176 Stationary
Based on the above results, the cointegration equations of each region were compared,
and the fitting results of the cointegration equation between LnY and LnX in the Pan-
Yangtze River Delta are all good, with the adjusted judgement coefficient R2 of each
region being especially high. Among all regions, Jiangsu had the highest (up to 0.990), and
Shanghai had the lowest value (0.889) (Table 3). The estimated LnX coefficient represents the
elasticity of the effect from sci-tech talent to economic growth in the long-run equilibrium,
with values of 2.119, 1.179, 0.859, and 1.375, respectively, which are all positive for Shanghai,
Jiangsu, Zhejiang, and Anhui. Among them, Shanghai has the highest flexibility; with
every 1% increase in the amount of sci-tech talent, the corresponding growth rate of the
economic aggregate is 2.119%, indicating that potential sci-tech talent has the highest
positive promoting effect on economic growth. In addition, Zhejiang has the lowest
flexibility, where every 1% increase in the amount of sci-tech talent corresponds to a 0.859%
increased growth rate in the economic aggregate, indicating that the potential positive
promoting effect is the lowest.Sustainability 2021, 13, 6707 12 of 18
Table 3. Cointegration test.
Adjusted
Equation ADF t-Statistic Prob
R-Squared
Shanghai LnY = 2.118539 × LnX – 5.441891 17.528 0.0000 0.889
Jiangsu LnY = 1.179424 × LnX + 1.344716 34.601 0.0000 0.990
Zhejiang LnY = 0.859016 × LnX + 3.497242 23.410 0.0000 0.975
Anhui LnY = 1.374828 × LnX + 0.931472 18.939 0.0000 0.971
5.3. Vector Autoregression (VAR) Model
To find the optimal lag, the result is estimated by the VAR model and provides the
appropriate lag lengths of LR (Likelihood), FPE (Final Prediction Error), AIC (Akaike
Information Criterion), SC (Schwarz Information Criterion), and HQ (Hannan–Quinn
Information Criterion). Based on this, the estimated results are as follows (Table 4): the
optimal lags of the data of Shanghai, Jiangsu, Zhejiang, and Anhui are ‘1’, ‘3’, ‘3’, and ‘1’,
respectively.
Table 4. Vector autoregression (VAR) model.
Lag LogL LR FPE AIC SC HQ
Shanghai 1 56.508 89.119 * 1.69 × 10−5 * −5.316658 * −5.018414 * −5.266183 *
Jiangsu 3 72.679 7.556 7.66 × 10⁻⁶ * −6.176700 * −5.480797 −6.058925 *
Zhejiang 3 75.424 8.253 4.06 × 10⁻⁶ * −6.824871 * −6.132360 * −6.729383 *
Anhui 1 53.906 110.913 * 2.86 × 10−5 * −4.790677 * −4.491958 * −4.732364 *
‘*’ indicates the lag order selected by the criterion.
5.4. Granger Causality Test
The results of the cointegration test show a long-term equilibrium between economic
growth and sci-tech talent in the Pan-Yangtze River Delta. Meanwhile, according to the
estimation of the optimal lag coefficient of the VAR model, the lag time of each province
and city is selected, respectively. On this basis, a Granger causality test was conducted
to determine whether causality was formed between variables in each region. There are
differences in the causal nexus between economic growth and sci-tech talent in different
regions, including unidirectional and bidirectional effects (Table 5). The specific results are
as follows.
Table 5. Granger causality test.
Null Hypothesis Obs F-Statistic Prob. Result
LnX does not Granger Cause LnY 21 0.08347 0.7759 Accept
Shanghai
LnY does not Granger Cause LnX 21 9.19044 0.0072 Refuse
LnX does not Granger Cause LnY 19 0.29722 0.8268 Accept
Jiangsu
LnY does not Granger Cause LnX 19 12.7557 0.0005 Refuse
LnX does not Granger Cause LnY 19 5.68821 0.0117 Refuse
Zhejiang
LnY does not Granger Cause LnX 19 1.53314 0.2565 Accept
LnX does not Granger Cause LnY 21 11.9990 0.0028 Refuse
Anhui LnY does not Granger Cause LnX 21 16.4597 0.0007 Refuse
There is a unidirectional effect from economic growth to sci-tech talent in Shanghai. At
the significance level of 5%, the null hypothesis of ‘LnY does not Granger cause LnX’ was
rejected, and the probability reached 0.0072, indicating that LnY is the Granger cause of
LnX. Compared with the PFEP, the growth of PGDP is more stable and faster, which drives
the growth of PFEP. In other words, economic growth has effectively promoted the growthSustainability 2021, 13, 6707 13 of 18
and agglomeration of sci-tech talent in Shanghai and attributed to the significant attraction
of various aspects, such as development prospects, innovation environment, income level,
and quality of life, engendered by the rapid economic growth in Shanghai. At the same
time, at the significance level of 5%, the null hypothesis of ‘LnX does not Granger cause
LnY’ was accepted, and the probability reached 0.7759, indicating that sci-tech talent does
not play a positive role in economic growth in Shanghai. It is mainly because the growth
rate of PFEP is slower than PGDP in Shanghai and presents a relatively tortuous change.
Problems remain, such as the lack of high-level sci-tech talent, uncoordinated structure, and
failure to make full use of the advantages of sci-tech talent to achieve economic potential,
including in the fields of finance, trade, industry, and many others.
There is also a unidirectional effect from economic growth to sci-tech talent in Jiangsu.
At the significance level of 5%, the null hypothesis of ‘LnY does not Granger cause LnX’
was rejected, and the probability reached 0.0005, indicating that economic growth has a
significantly positive effect on sci-tech talent in Jiangsu. The main reason for this is the
rapid and large-scale growth of PGDP in Jiangsu, the second-largest economic province
in China, where the per capita GDP is only second to Beijing and Shanghai, and a high
level of scientific and technological innovation also plays an important role in cultivating
and attracting sci-tech talent. In addition, Jiangsu also benefits from industrial transfer and
inflow of sci-tech talent from Shanghai as part of the regional integration in the Pan-Yangtze
River Delta. On the other hand, at the significance level of 5%, the null hypothesis of ‘LnX
does not Granger cause LnY’ was accepted, and the probability reached 0.8268, indicating
that the amount of sci-tech talent does not play a positive role in economic growth in
Jiangsu, given that the growth rate of PFEP dropped significantly after 2008 compared with
overall growth of PGDP in Jiangsu. This was the case especially in recent years, except for
2019, which showed a flattening trend related to the lack of construction and the shortage
of basic research talent and research funds.
There is also a unidirectional effect between economic growth and sci-tech talent in
Zhejiang, whereby sci-tech talent Granger causes economic growth. At the significance
level of 5%, the null hypothesis of ‘LnX does not Granger cause LnY’ was rejected, and
the probability reached 0.0117, indicating that sci-tech talent has a significantly positive
effect on economic growth. The main reason is that the growth trend of PFEP is signif-
icantly higher than the rate of PGDP in Zhejiang, especially after 2017. With regard to
the innovation economy, the role of sci-tech talent in providing intellectual support for
economic growth can be fully used, especially in the fields of information networks and
such in Zhejiang. On the other hand, at the significance level of 5%, the null hypothesis
‘LnY does not Granger cause LnX’ was accepted, and the probability reached 0.2565, indi-
cating that economic growth does not play a positive role in sci-tech talent, as the economy
lacks the attraction that the effective agglomeration of talent provides in Zhejiang. The
construction of sci-tech talent in Zhejiang has yet to be improved, as it has failed to fully
absorb the inflow of sci-tech talent from Shanghai. In addition, there are disadvantages in
such aspects as the training platform for sci-tech talent, which makes it fail to effectively
translate economic growth into favourable factors for attracting sci-tech talent.
There is a bidirectional effect between economic growth and sci-tech talent in Anhui.
At the significance level of 5%, the null hypotheses of ‘LnY does not Granger cause LnX’
and ‘LnX does not Granger cause LnY’ were both rejected, and the probability reached
0.0007 and 0.0028, respectively, indicating a good bilateral circulation between the amount
of sci-tech talent and economic growth in Anhui, thus promoting the long-term common
development of both. Although the proportion of PGDP and PFEP of Anhui is relatively
small in the Pan-Yangtze River Delta, it presents a more balanced situation. On the one
hand, the industries and talent are actively transferred from the developed regions to
Anhui in the Pan-Yangtze River Delta, and the transfer of scientific and technological
innovation are fully realised by relying on sci-tech talent, with the adjustment of industrial
structure. On the other hand, policy support is fully used to gradually implement the
construction plan of sci-tech talent in Anhui, to promote the agglomeration of sci-techSustainability 2021, 13, 6707 14 of 18
talent, and to increase investment, in the form of improving the construction of scientific
research platforms and guaranteeing the innovation incentive mechanism with the help of
economic development.
6. Results of Granger Causality Test of the Whole Pan-Yangtze River Delta
6.1. Stationarity Test
The PVAR model is used for the following empirical analysis. Additionally, the
stationarity test of the research variables is needed to avoid spurious regression. The LLC
test based on the PVAR model is used, and the results are as follows (Table 6). The original
assumption is that the panel data is nonstationary, and the test results show that all the
variables of the research samples are stationary, which can be used for the analysis of the
PVAR model.
Table 6. Stationarity test.
LLC
t-Statistic Prob.
LnY −1.8666 ** 0.0310
LnX −3.6212 *** 0.0001
‘***’, ‘**’, and ‘*’ indicate significance at the 1%, 5%, and 10% levels, respectively.
6.2. Selection of Lag Order Length
The lag order is selected according to AIC, BIC, and HQIC, and the smaller the three
standard index values are, the more suitable the lag order is. The results (Table 7) show
that the selection lag under BIC is ‘4’, whilereas the selection lag under AIC and HQIC is
‘5’. Considering the stability and effectiveness of the model, the lag order is selected as ‘5’.
Table 7. Selection of lag order.
Lag AIC BIC HQIC
1 −3.8528 −3.49545 −3.7095
2 −4.7704 −4.2797 −4.5743
3 −5.6311 −4.7813 −5.1619
4 −5.63117 −4.84781 * −5.32078
5 −5.73758 * −4.79307 −5.36549 *
6 −5.39584 −4.27885 −4.95892
‘*’ indicates the lag order selected by the criterion.
6.3. Granger Causality Test
According to the above results, the Granger analysis is carried out under the lag
order of ‘5’, and the results are shown as follows (Table 8). The null hypothesis is that
there is no Granger causality at a significance level of 1%, while the result shows that
h_LnY is the Granger cause of h_LnX, indicating that the economic growth has effectively
promoted the growth and agglomeration of sci-tech talent in the Pan-Yangtze River Delta,
similar to the results of Granger causality test of each province and city in the Pan-Yangtze
River Delta. It shows that significant economic growth can attract sci-tech talent more
effectively in the whole of the Pan-Yangtze River Delta, which is closely related to the role
of the internal provinces and cities. However, at the same time, the sci-tech talent has
no effect on the economic growth, indicating that the whole interactive process is subject
to many constraints, and the role of sci-tech talent has yet to be further enhanced. The
region is undergoing economic transformation, which leads the economic change from
quantitative growth to qualitative improvement, and further strengthening the attraction
and cultivation of new sci-tech talent is essential.You can also read


