ACTION PLAN FOR REJUVENATION OF JUMAR RIVER IN JHARKHAND - JHARKHAND STATE POLLUTION CONTROL BOARD, DHURWA, RANCHI JHARKHAND-834004
←
→
Page content transcription
If your browser does not render page correctly, please read the page content below
ACTION PLAN FOR
REJUVENATION OF JUMAR RIVER
       IN JHARKHAND

 JHARKHAND STATE POLLUTION CONTROL
BOARD, DHURWA, RANCHI JHARKHAND-834004

                                     pg. 1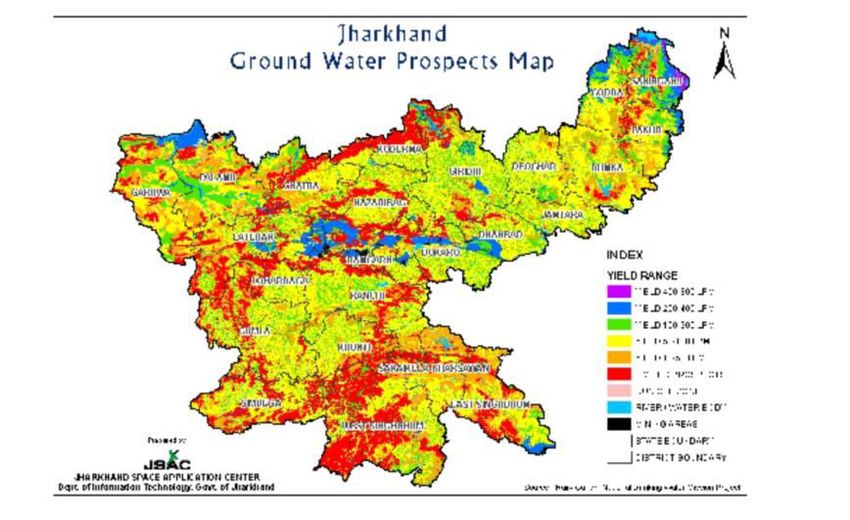
CONTENT
CHAPTER I

❖    BACKGROUND
❖    INTRODUCTION
❖    PHYSIOGRAPHY
❖    WATER RESOURCES & RAINFALL
❖    ANNUAL RAINFALL
❖    DEVIATION OF RAINFALL
❖    SEASONAL RAINFALL
❖    RAINFALL TREND IN RABI SEASON
❖    AVERAGE MOTHLY RAINFALL
❖    MOVING AVERAGE OF THE RAINFALL
❖    EXTREME EVENT ANALYSIS
❖    SURFACE WATER RESOURCES
❖    GROUND WATER RESOURCES
❖    DRAINAGE SYSTEM AND MAPS
❖    RIVERS AND RIVER BASINS

CHAPTER II - JUMAR RIVER

❖    WATER QUALITY GOALS AS PER THE EXISTING PROVISIONS OR
     GUIDELINES/ SPECIFICATIONS OF CENTRAL POLLUTION CONTROL
     BOARD (CPCB)
❖    IDENTIFIED STRETCHES FOR REDUCING POLLUTION

CHAPTER III- VISION MISSION AND STRATEGY FOR JUMAR RIVER

❖   VISION STATEMENT OF JHARKHAND STATE POLLUTION CONTROL
    BOARD
❖   VISION STATEMENT FOR CLEAN RIVERS IN JHARKHAND
❖   MISSION STATEMENT FOR CLEAN RIVERS

                                                           pg. 2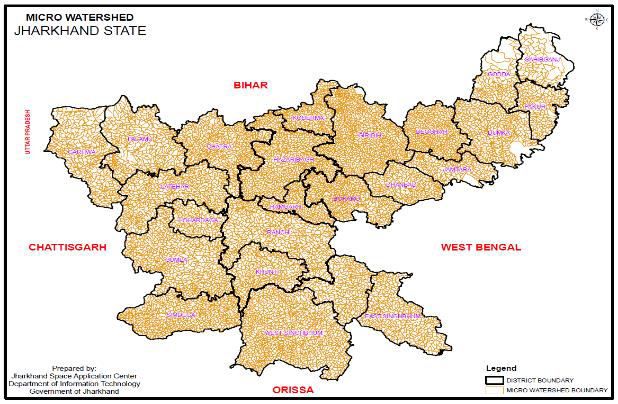
CHAPTER IV-CURRENT STATUS AND TRENDS OF WATER QUALITY IN
             JHARKHAND RIVERS
❖   IDENTIFICATION OF MONITORING LOCATIONS
❖   CENTRAL POLLUTION CONTROL BOARD'S NORMS FOR DESIGNATED
    BEST USE

CHAPTER V- ACTION PLAN
❖   ACTION PLAN- SHORT TERM AND LONG TERM ACTION AND THE
    IDENTIFIED AUTHORITIES FOR INITIATING ACTIONS AND THE TIME
    LIMITS FOR ENSURING COMPLIANCE
❖   SHORT TERM AND LONG TERM ACTION PLANS FOR REJUVENATION
    OF RIVERS AND THE IMPLEMENTING AGENCIES RESPONSIBLE FOR
    EXECUTION OF THE ACTION PLANS AND THE TIME LIMITS ARE
    GIVEN IN TABLE AS BELOW
❖   PROPOSED ACTION PLAN BY VARIOUS DEPARTMENT OF GOVT. OF
    JHARKHAND
❖   PROPOSED ACTION PLAN FOR RESTORATION OF JHARKHAND
    RIVERS
❖   ACTION PLAN AT VILLAGE LEVEL
❖   TIMELINES FOR IMPLEMENTATION OF MODEL RESTORATION PLAN
    in 2019-2020 and 2020-2021

                                                          pg. 3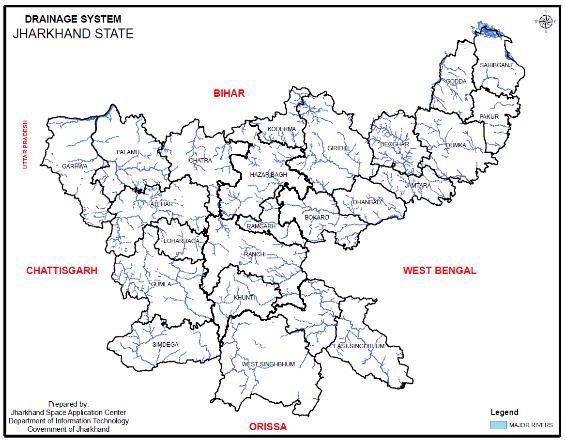
Chapter-1
                 JHARKHAND & ITS WATER RESOURCES

1.0 BACKGROUND:-Hon’ble National Green Tribunal passed the following orders in OA
No. 673/2018 & M.A. No. 1777/2018 titled News item published in “The Hindu “authored by
Shri Jacob Koshy titled “More river stretches are now critically polluted: CPCB on
20.09.2018 as per excerpts below.

“The issue taken up for consideration in this matter is abatement of pollution in 351 river
stretches in the country, identified as such by the Central Pollution Control Board (CPCB).
The said river stretches 2 are not meeting the prescribed standards of the water quality in
terms of Bio-chemical Oxygen Demand (BOD). Existence of polluted river stretches is
evidence to show that the State Pollution Control Boards (SPCBs) have failed to perform
their statutory obligation to take appropriate action to achieve the objects of the Water
(Prevention and Control of Pollution) Act, 1974.

Having regard to the importance of the issue and in the light of judgments of the Hon’ble
Supreme Court in M.C. Mehta Vs. Union of India & Ors.1, M.C. Mehta Vs. Union of India
And Ors.2 (Calcutta Tanneries' Matter), Vellore Citizen’ Welfare Forum Vs. Union of India3,
S. Jagannath Vs. Union of India & Ors.4, And Quiet Flows The Maily Yamuna5, Tirupur
Dyeing Factory Owners Association Vs. Noyyal River Ayacutdars Protection Association &
Ors.6 and TechiTagi Tara Vs. Rajendra Singh Bhandari & Ors.7 and of this Tribunal in
Manoj Mishra Vs. Union of India8, M.C. Mehta Vs. Union of India9, Mahendra Pandey Vs.
Union of India &Ors.10, Sobha Singh & Ors. Vs. State of Punjab & Ors. 11, Nityanand
Mishra Vs. State of M.P. & Ors12, Stench Grips Mansa’s Sacred Ghaggar River (Suo-Moto
Case)13, Doaba Paryavaran Samiti Vs. State of U.P. & Ors.14, Arvind Pundalik Mhatre Vs.
Ministry of Environment, Forest and Climate Change & Ors.15, Meera Shukla Vs. Municipal
Corporation, Gorakhpur & Ors.16, Amresh Singh Vs. Union of India & Ors.17, Sudarsan
Das Vs. State of West Bengal & Ors.18, Satish Kumar vs. U.O.I & Ors.19, this Tribunal
noted 1 (1987) 4 SCC 463 ¶14 & (1988) 1 SCC 471 2 (1997) 2 SSC 411 3 (1996) 5 SSC 647
4 (1997) 2 SCC 87 5 (2009) 17 SSC 720 6 (2009) 9 SSC 737 7 (2018) 11 SCC 734 8 O.A. No.
6/2012, 2015 ALL(I) NGT REPORTER (1) (DELHI) 139 9 O.A No. 200 of 2014, 2017 NGTR

                                                                                     pg. 4
(3) PB 1 10 O.A. No. 58/2017 11 O.A.No. 101/2014 12 O.A. No. 456/2018 13 O.A. No.
138/2016 (TNHRC) 14 O.A. No. 231/2014 15 O.A. No. 125/2018 16 O.A. No. 116/2014 17
Execution Application No. 32/2016 in O.A. No. 295/2016 18 O.A.No. 173 of 2018 19 O.A No.
56 (THC) of 2013 3 the need for steps to check discharge of untreated sewage and effluents,
plastic waste, e-waste, bio-medical waste, municipal solid waste, diversion of river waters,
encroachments of catchment areas and floodplains, over drawal of groundwater, river bank
erosion on account of illegal sand mining. There is need for installation of Effluent Treatment
Plants (ETPs), Common Effluent Treatment Plants (CETPs), Sewage Treatment Plants
(STPs), Solid Waste Treatment and processing facilities etc.

It was also noted that BOD was required to be less than 3.0 mg/l, Dissolved Oxygen more
than 5.0 mg/l and Faecal Coliform bacteria less than 500 MPN/100 ml”

1.1      Introduction
The State of Jharkhand was created as the 28thState of the Indian Union by the Bihar Re-
organization Act on 15th November 2000, the birth anniversary of the legendary Bhagwan
Birsa Munda. It comprises of the forest tracts of Chhotanagpur plateau and Santhal Paragna.
It is bounded by Bihar on the North, Orissa on the South, Chhattisgarh on the west and West
Bengal on the East. Topography of the State is mostly undulating, hilly and sloping with
mountains, forests, river basins and valleys. It has a rich endowment of forests and mineral
resources. It has some of the richest deposits of coal and iron ore in the world. It is the largest
producer of coal, copper, kyanite and mica in the country. It is blessed with rich fauna and
flora.
The State is home to nearly a tenth of the country’s Scheduled Tribes1, who constitute 28% of
Jharkhand’s population. Another 12% of the population is from Scheduled Castes. Jharkhand
is mostly rural, with 77.77% of the State’s population in villages. The State has 24 districts,
38 sub-divisions, 260 blocks, 4118 panchayats and 32620 villages. For safeguarding and
protecting the interest of the Scheduled Tribes and for ensuring equity and social justice in
the planned process of development, the State is following Tribal Sub-Plan (TSP) approach in
12 districts fully and 2 districts partly, covering 112 blocks.

1The main tribes in Jharkhand are Asur, Birhor, Birjia, Chik Baraik, Korba, Lohara, Mahali, Mal Paharia,
Kumarbhag Paharia, Souriya Paharia, Savar, Santal, Oraon, Munda, Ho and Kharia.

                                                                                                  pg. 5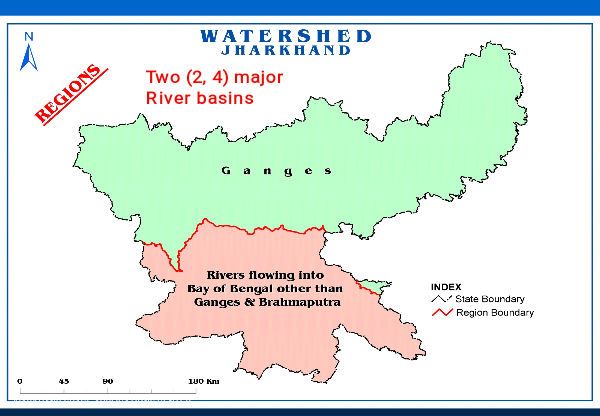
With an area of 79714 km2 which accounts for 2.42% of the country’s area, Jharkhand
supports a population of 32.97 million (2011) which constitutes 2.72% of the country’s
population. South Bihar, as it was called in the earlier dispensation, is a hill state comprising
ethnic groups (tribals), Hos, Mundas, Santhals and others ; The state needs intensive
development initiatives.
Jharkhand, literally meaning a forested region, is landlocked and is an integral part of the
north-eastern portion of the Peninsular Plateaus of India. As part of ancient Gondwanaland,
Jharkhand has rock formations ranging from the earliest Archean Era to the latest Post-
tertiary period. It is a region of diverse physical features consisting of a succession of
plateaus, hills and valleys, drained by several large rivers such as Damodar, Barakar,
Subarnarekha, Koel, Brahmani, Baitarani and Mahanadi. The northern part of Jharkhand
adjoining Bihar broadly comes under the Gangetic river basin.
The State has a sub-humid climate with average annual rainfall of 1,350 mm. However, due
to high variability of monsoon rains, low moisture holding capacity of soils, absence of
developed aquifers due to the hard rock substrate and high run-off due to the undulating
terrain, agriculture is fraught with high risks2. Paddy, the principal crop of the State sown
over 1.3 mha in 2001-023 had an average yield of only 1.11 ton/ha4. Maize, minor millets and
pulses are the other principal crops and together occupy about 25% of the net sown area, with
similar low yields. Oilseeds production is negligible. Horticulture and floriculture is
undeveloped in spite of a suitable climate.
Jharkhand is a mineral rich state, contributing 40% of the nation’s mineral wealth. Yet, it had
little impact on local livelihoods outside the industrial enclaves. Even in the most
industrialized districts, such as East Singhbhum, Bokaro, Ranchi and Dhanbad, the
proportion of main workers engaged in mining and industry is less than 3%. Agriculture
remains the principal source of livelihoods for an overwhelming majority of the population.
About 48% of the State’s geographical area is cultivable. However, the net sown area is only
about 23% (all India 47%) of the geographical area and more than half of the cultivable land
remains fallow. Subsidiary farm-based activities like dairy, poultry, etc. generally follow
2 As per the categorization by Indian Meteorological Department, Jharkhand figures in the "drought corridor” of
the country, which also includes Rajasthan, Gujarat, Andhra Pradesh (drought prone districts of Rayalaseema
and Telengana regions), West Uttar Pradesh, Madhya Pradesh (including Chhatisgarh), Bihar and parts of West
Bengal adjoining Jharkhand.
3Planning Commission, ibid.
4 The average yield for India during the year was 1.9 ton/ha, with Tamil Nadu, having the highest average yield

at 3.2 ton/ha. Yields vary a great deal within Jharkhand due to the undulating topography and varying levels of
development of agriculture. Source: Fertilizer statistics 2002-03 New Delhi (Published in Jharkhand Agriculture
data book 2006)

                                                                                                        pg. 6
growth in agriculture. These have not developed in the State in spite of increasing demand for
the products. The State has a large population of scrub cattle, kept principally for draught
power and manure.
In the last 13 years, since the creation of the State, the Government has done effective work
in extending primary education in the rural areas. Government’s priority to spread road
network in the rural areas is very important. Similarly, the health sector also needs serious
attention in the rural areas. Health services in rural areas need improvement, the people are
traditionally dependent on traditional medicine men. In terms of potential opportunities, some
of the considerations which require action to reduce poverty and enhance food security are:

▪      An overwhelming majority of the State’s population is rural and dependent on
       agriculture and other natural resource based livelihoods.
▪      Less than half the cultivable land in the State is presently utilized.
▪      85% of the net sown area is under mono-cropping.
▪      Potential of water resources is not adequately developed.
▪      Productivity of agriculture is significantly lower than potential.
▪      There is little diversity in the farm sector.
▪      The State is a net importer of food grains, oilseeds, milk and milk products and
       poultry.
▪      Intensification of agriculture would in the long run call for improved land husbandry,
       including use of organic inputs given the undulating and hilly terrain and relatively
       low fertility of soils.
▪      Almost a third of the State is classified as forests.
▪      Forests have been a significant source of income (produce/materials required for
       domestic use in general/during scarcity) for nearly 1/3 of the population.
▪      Livelihood infrastructure of extension services and input-output markets is not
       adequately developed.

1.2 PHYSIOGRAPHY
Physiography of the State: Physiographically Jharkhand state consists of series of four
distinct plateaus, the highest plateau is formed by western Ranchi plateau or the pat region,
which is 800 to 1100 meters above the mean sea level. It covers the north-western part of the
Ranchi district and southern edge of Palamau district. The next plateau is known as the

                                                                                        pg. 7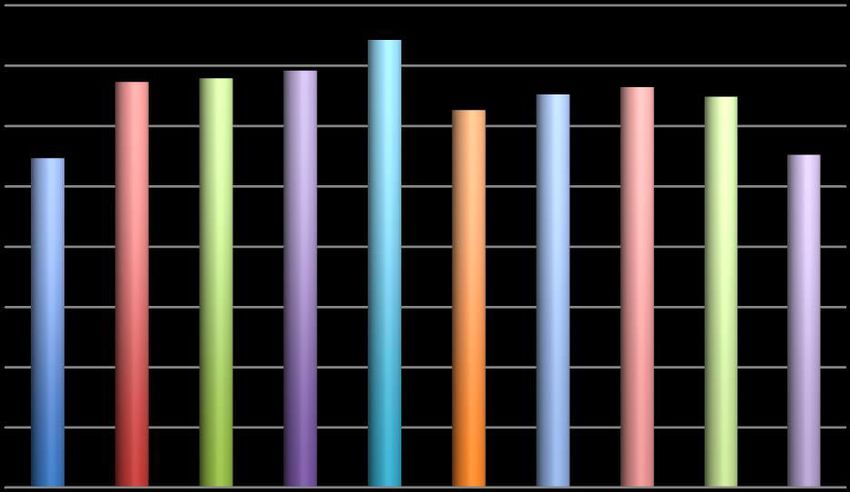
Ranchi, except the pat region. This plateau is about 600 meters above mean sea level. The
Ranchi plateau is separated from the other surface of the same elevation by Damodar trough.
The third plateau has an elevation of 300 meters above mean sea level and may be termed as
the lower Chotanagpur plateau. The fourth plateau is a uniform surface formed by the river
valleys, plains and lower parts of the outer plateau lying between 150-300 meters above mean
sea level. Rajmahal hills and the Kaimur plateau belong to this category.
The soil in the state of Jharkhand has been formed from disintegration of rocks and stones.
The soil thus formed can be divided into various soil types including red soil, micacious soil,
sandy soil, black soil and laterite soil. Red soil is found mostly in the Damodar valley, and
Rajmahal area. The Micacious soil (which consist particles of mica) is found in the regions of
Koderma, Jhumeritilaiya, Barkagaon and areas around the Mandar hill. Sandy soil is
generally found in Hazaribagh and Dhanbad and black soil in Rajmahal area whereas the
lateritic soil is found in western part of Ranchi, Palamu, and parts of Santhal Parganas and
Singhbhum.

1.3 Water Resources & Rainfall

The state receives rainfall in the range of 1200-1300 mm per year against the national
average of 1000mm. Precipitation is rather variable. Winter season precipitation is meagre
and highly variable. About 60 percent of the rainy days have rainfall below 2.5 mm. On about
40 percent rainy days, evaporation level is more than 2.5 mm per day.

Jharkhand receives rain mainly from South Western monsoon wind. Generally, this
monsoon wind hits Jharkhand in the mid of June and continues up to the month of
September. The total precipitation during these months amounts to 90-95% of the total
rainfall. July and August are the peak month of the monsoon and are the backbone of
the agriculture in Jharkhand. The table given below shows that the state receives good
amount of rainfall. However, the erratic distribution of rainfall across monsoon months
(June to September) creates drought situation in the state. Graph showing the
distribution of rainfall across months (JSAC) is given below:

The erratic rainfall of 5 years, for instance, depicts the pattern well in the graph above.
During winter months the state receives winter rain (10-5% of the total rainfall). These small
rains become the deciding factors for rabi crops for many farms. The South Chhotanagpur

                                                                                         pg. 8
and Santhal Pargana Divisions receive higher rainfall whereas Palamu Division receives
lowest rainfall in the state.
Despite the fact that the state has a good rainfall, the surface water availability is not
sufficient especially for agriculture due to inadequate storage facilities etc. As far as the
status of ground water is concerned, it is also in the poor state due to little recharging of
ground water by natural process and the absence of artificial recharging facilities, as a result
the water level in the plateau goes down.
1.3.1 Annual Rain fall:
Rainfall data for the catchment area has been collected from the India water portal for the last
100 Years. It has been grouped and made arithmetic average to get the decadal average
rainfall. The normal rainfall has been assumed at 1200 mm and deviation has been calculated
based on the assumption and arithmetic average of the decadal rain fall.
Extreme events related to rain fall has been measured with the deviation in the rain fall and
number of times that it has exceeded or fall short of the normal rainfall. These deviations
have been depicted in the graphs.
Rainfall
Max Temp
Min Temp
pg. 9Rain Fall over last century
1.3.2 Deviation of rainfall:
The deviation has been measured with reference to the normal rain fall and all data has been
taken from the IMD data which is accepted country wise. It has been taken from the year
1900 onwards. In the data it can be seen that in the last 10 Decades there has been seven
decades with positive rainfall and three decades have shown negative deviation.
Rain fall deviation from normal
If we see the deviation in the last 10 years there has been absolute reversal of the pattern and
out of the ten year only three years have positive deviation otherwise seven years have
negative deviation.
pg. 10Rainfall Deviation ibetween 2000-2010
1.3.3Seasonal Rainfall:
The district receives maximum rain from the advancing north east monsoon. Through the
retreading south west monsoon district also receives some rainfall. District has been mainly
mono cropped and it has only 3% area under irrigation as compared to 11% under the
catchement area. It has been not because that the district receives less rainfall but it has been
mainly because land is undulating and it causes fast runoff in the area. The variations as said
above has been also high and it causes greater run off. It has also been noticed in recent years
that number of rainy days has been shrinking as evident from the wet day data on the web site
of India water portal.
There has been wide variation in the rainfall during the Khariff and Rabi season. It has been
put as graph and it shows that there has been decreasing rend over the last few years which
can lead to a significant decrease in the coming years. The highest rainfall in Kahriff has been
reported in the year 1990 at 1693 mm and lowest in the year 1992 at 688 mm. Number of
rainy days has decreased from 69 days /year to 63 days/year in the last decade.
pg. 11Kahriff rainfall and Moving average for same
Rainy days
1.3.4 Rainfall trend in Rabi season:
The state and district are by-enlarge remain mono cropped, however the red lateritic soil is
good for vegetables and hence rainfall in Rabi or irrigation facilities has a great bearing on
the cultivation in Rabi season. Over the last few years there has been significant decrease in
rainfall. Especially after 1996 the trend has been alarming.
The highest rainfall has been reported in the year 1919 at 138 mm and lowest rainfall has
been reported in the year 1999 at 37 mm. The trend has been showing that since 1992 in the
month of December there has been rarely rain while before 1992 there has been rain in the
month of December. Even in January there has been decreasing trend.
pg. 121.3.5 Average Monthly Rainfall:
The data for the last 30 years has been collected to know the trends and deviations in the each
half of fifteen years. The data has been collected for last 50 years from the web site. The
trends have shown that there has been variation in average monthly rainfall and for some
decade starting from 1990 it has shown an increasing trend and then it has started showing a
decreasing trend for the district.
It has implications on the agriculture production and all livelihood activities based on land
and water. Even the allied livelihood activities of fisheries and animal husbandry are bound
to be affected by the changes in the precipitation regime.
pg. 13Rainfall in mm Average rainfall 72-86 Vs 87-01
72-86
87-01
1.3.6 Moving Average of the Rainfall:
It can be clearly seen that there has been a decreasing trend of rain fall indicted by the
moving average line. Post 1992 there has been decline in the average rain fall. The heaviest
rain has been received in the year 1994 at 1416.47 mm and lowest rainfall has been received
in the year 1992 at 732.61 mm. Rest of the years have received lesser rainfall and it varies
with the last two year receiving approximately 850 mm rainfall which is less than the average
rain fall received by the state and the district.
Rainfall and Moving average rainfall
Rainfall
Moving average
pg. 141.3.7 Extreme event analysis:
As mentioned above that in the last century there has been three decades with deficit average
rainfall where as in the last decade only there has been three average rainfall year. This
indicates the absolute reversal of trends in the last decade.
Rainfall Deviation ibetween 2000-2010
There have been consecutive droughts in the year 2001-02-03, 2005-06 and 2009-10. It can
be seen that on average every third year there has been drought.
1.3.8 Surface Water Resources
Considering average annual rainfall of 1200 mm, the state receives 95,652 MCM rain water annually.
However, as per the Second Bihar Irrigation Commission’s Report (1994), the total availability of
water in the state of Jharkhand is 33,489 MCM, including downstream discharge from the basins.
1.3.9 Ground Water Resources
Groundwater constitutes a major and widely used resource in Jharkhand for drinking and domestic
purposes. However, it is not uniformly distributed due to the varied hydrogeology of the state. About
20% of the available ground water is used for irrigation mainly from privately owned dug well or
shallow tube wells. District-wise ground water balance data indicate high levels of ground water
withdrawal in certain urban agglomerations where groundwater potential developed is only a tenth of
the utilizable reserves.
Presently, the availability of water resource is only 287810 lakh m3, out of which 237890 lakh m3 is
from surface water and rest 49920 lakh m3 is from ground water. The total utilization of surface and
ground water in the state for irrigation purposes so far is only 47360 lakh m3, out of which 39640 lakh
m3 is surface water and 7720 lakh m3 is ground water.
Today, nearly 90% of the water supplied to rural areas is from ground water sources whereas about
30% of the water supply in the urban areas comes from ground water sources and the rest from over
pg. 15ground reservoirs and rivers. In the last 25 to 30 years the villages have shifted to the utilization of
water from surface water to ground water through wells and hand pump for their domestic purposes.
Table1 : Surface Water Snapshot of Jharkhand (Surface Water Information)
Average annual rainfall 1200 mm
Total average annual precipitation 95652 MCM
River Basin Area 79,262 sq. km
Surface water availability 27,528 MCM
Ground water availability 5,251MCM
Surface water usage 6,965 MCM
pg. 16The annual replenishable ground water resource in the state has been established at 5.58 BCM
(Billion Cubic Meters) and net annual ground water availability is estimated to be 5.25 BCM (Central
Ground Water Board, 2006). Altogether, the state puts to use 21% of its ground water resources.
Allocation of Water- Table II
Surface Water Ground Water
Irrigation purpose 41% 89.40%
Industry & Drinking 5321 MCM 538 MCM
Municipal Use 6% 10.60%
Industrial Use 13.76% Nil
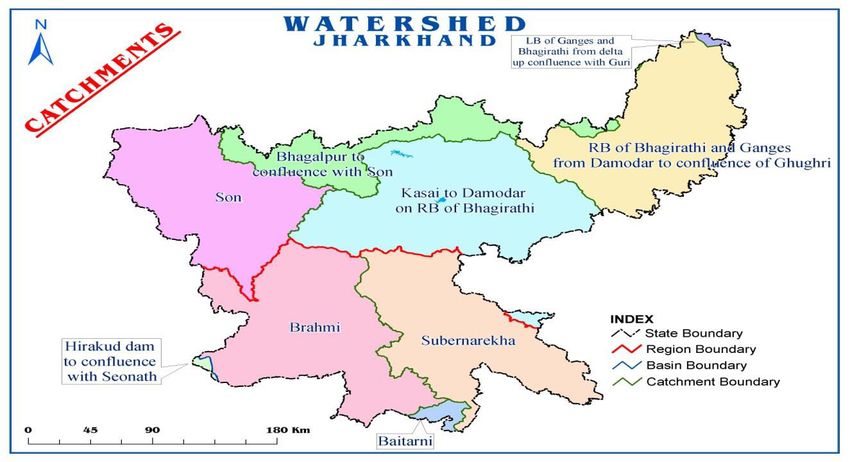
1.4 Drainage systems and Maps
Jharkhand falls under the Chotanagpur Plateau from the North Eastern position of peninsular
plateaus of India. The entire state is drained into Bay of Bengal. Major rivers such as Son,
Damodar, Barakar, Subarnarekha, Brahmi and Baitarani and their sub drainage systems form
pg. 17nine major catchments in the state. These drainage systems and catchments are depicted by
following two maps:
Demarcation of micro-catchment areas
The state of Jharkhand has 678 sub catchment areas, which has been further divided into
1952 mini catchment areas and finally broken up into 10,439 micro catchment areas5. The
Rural Development Department has sought support from Jharkhand Space Application
Centre (JSAC) under the aegis Department of Information Technology, Government of
Jharkhand. JSAC digitized all sub- catchment area, mini-catchment areas and micro-
catchment areas. These digitized maps are available for planning, review and monitoring.
Each micro-catchment area has been given a unique code along with broad features of the
catchment area. Below is the map showing micro- catchment areas in Jharkhand:
5The area covered under a micro -catchment area varies from 60 hectares to more than 3,000 hectares
depending on the drainage outlet of that area.
pg. 18JSAC has developed/ compiled information related to each of the catchment area with its code, boundaries and
other features, which are available in website (http://210.212.20.94:8081/rural_GIS/Default.aspx). SLNA and
PIAs are able to access the required maps, etc. for various purposes. A sample of coding of catchment area is
shown in the following picture:
pg. 191.5 Rivers & River basins: The State has following main rivers and river
basins:
Rivers : Subarnarekha, Damodar, Barakar, South Koel, North Koel, Shankh, Ajay,
Mayurakshi, Gumani, Kharkai, Ganga, Sone, Batane, Auranga, More, Karo and Bansloi;
River Basins : Subarnarekha, Damodar, Barakar, South Koel, North Koel, Mayurakshi,
Gumani, Ajay, Bilasi, Chandan Chir, Sone Stem with Kanhar, Punpun-Kiul, Harohar, Koa-
Bhena, Sankh, Dwarka mor.
The following map shows the broad division of the state with one side confluence towards
river Ganges in the north and north-east and the other part draining out towards south and
south-east meeting the Bay of Bengal.
pg. 20Drought is a situation whereby the shortfall in the precipitation from monsoon becomes more
than 15% of the normal. The state receives an average annual rainfall of 1,200 mm. Rainfall
is concentrated during the four monsoon months from June through September. Over 80% of
the rain is received in the state during this period. Further, the quantum and distribution of
rainfall have a profound impact on the overwhelmingly rain-fed farming system. High
variability of monsoon rains, low moisture holding capacity of soils, absence of developed
aquifers due to the hard rock substrate and high run-off due to the undulating terrain make
agriculture fraught with high risks6. Even in years of normal monsoons with overall rainfall
around the long-term average, farmers are often faced with the spectre of total crop failure
due to long dry spells at critical junctures (such as Hathia rain failure) in the crop cycle
during the wet season when almost 90% of the crops are cultivated. This phenomenon is
observed almost regularly once in every 3 years.
6 As per the categorization by Indian Meteorological Department, Jharkhand figures in the "drought corridor” of
the country, which also includes Rajasthan, Gujarat, Andhra Pradesh (drought prone districts of Rayalaseema
and Telengana regions), West Uttar Pradesh, Madhya Pradesh (including Chhatisgarh), Bihar and parts of West
Bengal adjoining Jharkhand.
pg. 21Chapter 2
JUMAR River
The Jumar River:
It flows for 15km in the north of capital Ranchi and another 15km outside the city. Although
the point of origin of this river has not been officially noted, geologist Nitish Priyadarshi
claims the Jumar’s source is close to the Kanke reservoir. According to him, before the
construction of the dam in 1954, another natural reservoir close to the site was developed as a
water pumping station in 1932. Two rivulets flowing out of it was known as Potpoto and
Jumar, the latter widened in the north to become a river. Both meet near Boreya before
draining into River Subernarekha. Ramdev Ram, a resident of Kanke, says Jumar is cleaner
than Harmu because it does not wend its way through the concrete jungles of Ranchi.
However, it needs immediate attention because of extensive sand mining. Priyadarshi agreed.
“Jumar is an excellent source of sand. Owing to unauthorized mining operations, sand layers
have almost vanished and the river is on the brink of death. Unless it rains very heavily,
Jumar remains as dry as a bone. Encroachments along Potpoto and littering by people are
polluting the river,” he pointed out.
Water Quality Goals as per the existing provisions or guidelines/
specifications of Central Pollution Control Board (CPCB)
It is an important aspect for revival of River Subrnarekha, Nalkari, Garga, Shank, Damodar,
Jumar & Konar in context of their utility as streams are perennial rivers. The ultimate goal for
beneficial use of river will determine the level of actions to be taken for maintaining the
water quality. Under the present circumstances, it appears that River Subrnarekha, Nalkari,
Garga, Shank, Damodar, Jumar & Konar may serve the purpose of outdoor bathing
(organized) and for meet the outdoor bathing standards. The industrial effluents generated
from various industries in the catchment of River Subrnarekha, Nalkari, Garga, Shank,
Damodar, Jumar & Konar, which are ultimately falling and contributing to the pollution load
of the rivers shall be treated to meet the effluent discharge standards stipulated under
Schedule-VI of the Environment (Protection) Rules, 1986 which is given as Annexure-I. The
river water quality for outdoor bathing (organized) requires more stringent conditions and
river water quality has to maintain adequate Dissolved Oxygen (DO) content. Suggested
pg. 22criteria for outdoor bathing (organized) for River River Subrnarekha, Nalkari, Garga, Shank,
Damodar, Jumar & Konar are given in the following Table - IV.
Table IV:-
Sl. No. Parameters Class ‘B’ Water Quality Criteria for
Outdoor Bathing (Organized)
1. Ph 6.5 to 8.5
2. Dissolved Oxygen (DO) 5 mg/l or less
3. Biochemical Oxygen Demand (5 3 mg/l or less
days, 200 C)
4. Faecal Coliforms Organism 500 or less (MPN/100 ml)
Identified stretches for reducing pollution- Table IX
The different identified stretches across Subarnarekha for reducing pollution are
RIVER STRETCH SAMPLING POINT PROBABLE SOURCE
OF POLLUTION
Jumar Kanke Dam To Kadal Kanke Dam Ranchi Municipal Corporation
Discharge, Agricultural Run off
pg. 23Chapter-3
Vision Mission and Strategy for Jumar River
3.0 Vision statement of Jharkhand State Pollution Control Board: Jharkhand State
Pollution Control Board aims at taking Jharkhand through the path of sustainable
development, equitable opportunities and appropriate governance by rigorous implementation
of environmental laws; by being pro-active in preventing and mitigating pollution; by
committing to the tenants of good governance; by enhancing involvement of all; and by
promoting self regulation and self certification among stake holders.
3.1 Vision statement for clean rivers in Jharkhand: Vision statement for Clean Rivers in
Jharkhand can be stated as – To achieve clean rivers, with safe drinking water to all its
inhabitants for sustaining and nourishing life and efficient use of water in irrigation using
micro-irrigation techniques and in industry by using water efficient technologies with
mandatory provision for treatment of waste water and reuse it for other purposes except for
drinking.
3.2 Mission statement for clean rivers:
3.2.1 To prepare and implement a comprehensive action plan for clean Rivers-:
Build holistic awareness among people, companies, farmers and other water users for
importance of rivers in identified patches with people centered monitoring mechanisms and
mitigating adverse impact of water pollution on health of people living in the different river
basin.
3.2.2 Strategy for clean rivers:
To achieve mission for clean rivers steps that will be necessary have been identified by the
JSPCB and has been communicated with the concerns for actions. This has been jointly
developed by the JSPCB and the different stakeholders in the chain. It has been done by
convening meetings and workshops for sharing the idea and then collating it for joint action
with defined timelines and expected results. The strategic steps are followings-
pg. 24 Identification of stake holders
Community in the river basin and especially in the polluted stretches:
Communities in the river stretches are mostly rural communities mixed with
cosmopolitan community Approximately 15 villages along with suburban areas falls
in the catchment of the proposed river stretch. The villages' houses close to 4003
families with a population size of 10021.
Municipal corporations in the identified stretches: There are two municipal
corporations in the catchment area of the river – Ranchi Municipal Corporation,
Community and private health care centers: As such there are no health care facilities
on the banks of the river which disposes medical waste in the river.
Main line departments like water resources, Agriculture, industries, Panchayati raj,
Rural development and others.
Nodal department
Convergence and Integration of departmental plans: The district level monitoring
committee will be responsible for convergence and dove tailing of the programmes
from different departments.
Monitoring of the action plans executed on regular intervals> it will be done by the
district level monitoring committee headed by District Collector.
pg. 25Chapter-4
Current Status and Trends of Water Quality in Jharkhand Rivers
4.0 Identification of monitoring locations
4.0.1 River Jumar:-
The water quality of river Jumar is being monitored at1 locations, at BIT Mesra on monthly
basis under National Water Quality monitoring Programme (NWMP) and it will be
monitored across all types of polluting sources like domestic and agriculture pollution.
Ranchi Municipal Corporation Discharge
Agricultural Run off
4.1 Central pollution control board's norms for designated best use :-
Central pollution control board has set certain norms for classifying water quality based on
the 8 defined para meters and these has been the guiding lines for setting up standards for
cleaning river water qualities.
Table: - X
Sl. Constituent Designated best uses classes
No. Parameters A B C D E BELOW
E
1 Total Coliforms 50 500 5000 - -
Organism,
MPN/100ml, Max
2 pH value 6.5 to 8.5 6.5 to 6 to 9 6.5 to 6.5 to
8.5 8.5 8.5 Not
3 Dissolved Oxygen, 6 5 4 4 meeting
mg/l, A, B, C,
Min D
4 Biochemical Oxygen 2 3 3 &E
Demand, mg/l, 5 days criteria
20C,
Max
5 Free Ammonia (as N) 1.2
mg/l, Max
pg. 266 Sodium absorption 26
Ratio,
Max
7 Electrical Conductivity 2250
at
25C micro mhos/cm,
Max
8 Boron, mg/l, Max 2
Note:
Class A: Drinking Water Source without conventional treatment but after disinfection
Class B: Outdoor bathing (Organized)
Class C: Drinking water source after conventional treatment and disinfection
Class D: Propagation of Wild life and Fisheries
Class E: Irrigation, Industrial Cooling, Controlled Waste disposal.
pg. 27Current status of quality of water in River Jumar: - From the above table which shows results along different indicators shows that water
quality is improving on all parameters and hence it can be said that in the coming times it will further improve.
Water quality data as per designated best use excluding rainy season for Jumar River at sampling station
(August To October)
Designated best
Parameters
use
2017- 2018 2017 2018- 2017- 2018- 2017- 2018- 2017- 2018- 2017
2018-19
18 -19 -18 19 18 19 18 19 18 19 -18
Sl. sampling D.O B.O.D T.C F.C
pH class
No station (mg/l) (mg/l) (MPN/100ml (MPN/100ml)
Maximum. 7.8 6.8 6.8 7.1 2.6 2.7 1500 930 210 150 B B
JUMAR AT BIT
1 Mesra Minimum 6.6 6.5 6.0 5.9 2.5 2.6 1200 750 150 140 B B
Average. 7.2 6.65 6.4 6.5 2.55 2.65 1350 840 180 145 B B
pg. 28Chapter 5
ACTION PLAN WITH TIMELINE
A. Action Plan- Short Term and Long Term Action and the Identified
Authorities for initiating actions and the time limits for ensuring compliance
Sl.No. Action plan for rejuvenation of river Concerned Time Target
Dept.
A Industrial Pollution Control
1 Compliance of industries located in catchment area with JSPCB Continuous
respect to effluent discharge standards and its disposal as
per consent conditions
2 Inventorization of the industries in the catchment area of JSPCB Continuous
Rivers covering assessment on aspects relating to Status
of Consents under Water & Air Acts and Authorization,
Effluent Generation, ETP capacities and final mode of
effluent discharges
3 Actions against the Identified industries in operation JSPCB Continuous
without Consents under Water & Air Acts/Authorization
under the H& OW ( M & TM) Rules, 2016 as amended
4 Action against the industries not installed ETPs or ETPs JSPCB Continuous
exist but not operating or ETP outlet or treated effluent is
not complying to the effluent discharge standards or
norms
5 Action against the red category industries for installation JSPCB Continuous
of OCEMS and not transferring data to CPCB and
JSPCB
6 Small scale/tiny and service providing units located in Local December
urban or semi-urban limits like Dairies, Auto Service Authorities/ 2019
Stations to have minimum provision of O & G traps Municipal
Corporation
pg. 297 Prohibition of burning of any kind of waste including State Govt. / Continuous
agro residues District
Administration
and Local
Authorities
& Agriculture
Department
8 Directions to all the Industries which are observed to be JSPCB/ Continuous
not in operation or closed or temporarily closed to District
remain close till further orders from JSPCB. Administration
9 Estimation of industrial effluent generation and the State September
existing CETP capacity and to arrive gap between the Government , 2020
industrial effluent generation and the existing treatment District/Local
capacity Administration
10 Channelization of industrial effluents to CETPs for State December
ensuring treatment to comply with the discharge Government , 2020
standards. District/Local
Identification of suitable site within industrial areas, Administration
Execution and Commissioning of Adequate Capacity
CETPs.
pg. 30B. Short term and long term action plans for rejuvenation of rivers and the
implementing agencies responsible for execution of the action plans and the
time limits are given in table as below :-
Concerned Time
Sl.No. Action Plan For Rejuvenation Of River
Dept. Target
A Sewage Treatment and Disposal Plan
State
Government,
District-wise estimation of total sewage generation,
UDD, Water
existing treatment capacities, quantum of disposal
Resource Dept., March 2020
1 of sewage presently through drains and the gaps in
District
sewage treatment capacity.
Administration
and Local
bodies
State
To undertake measurement of flow of all the drains Government,
presently contributing pollution load in rivers and UDD, Water
to formulate detailed project report (DPR) for each Resource Dept., March 2020
2
drain and corresponding town and submission of District
DPR. Administration
and Local
bodies
State
Government,
UDD, Water
Proper design, execution of STPs with full
Resource Dept.,
3 utilization capacity March 2020
District
Administration
and Local
bodies
Channelization including diversion of sewage State
4 March 2021
generated from household/town ships/villages to Government,
pg. 31sewer lines/interception of all the drains presently UDD, Water
carrying sewage and for ensuring proper treatment Resource Dept.,
through the upcoming STPs District
Administration
and Local
bodies
Ensuring dairy/automobile service stations and
Hotels / Restaurants particularly located on road- Local
5 March 2020
side should have a treatment system and levy of authorities
fine in case found Violations
B Ground water quality
Rural drinking
water and
Sealing of contaminated hand pumps and found to Sanitation September
1
be unfit for drinking purpose by the public Department and 2020
Local
authorities
Rural drinking
water and
Supply of potable water to the affected Sanitation
2 March 2020
communities in the identified critical blocks Department and
Local
authorities
Carrying assessment of ground water survey for
Ground Water
3 quality and to identify over exploited and critical March 2020
Authority
blocks in the districts
JSPCB &
To conduct periodic surprise inspection of the
Ground Water
4 industry to rule out any forceful injection of Continuous
Authority
industrial effluents into ground water resource
All the industry should be directed to obtain NOC CGWB/ CGWA Continuous
5 from the CGWB and action against the Units in and .Ground (The
Operation without obtaining of NOC from CGWA Water proposed
pg. 32Authority new
industries
will be
directed to
obtain NOC
from
CGWA)
To ensure rain water harvesting by the industrial, CGWA/
commercial and other institutions and groundwater Ground Water
March 2020
6 recharging with only clean water be encouraged by Authority/
CGWB/CGWA JSPCB
C. Proposed Action Plan by various Department of Govt. of Jharkhand
Phases Actions Required Role
through work break
down structure
Pre- Planning Phase Identification of JSPCB
(Recognition Phase) problem related to river
health
Assessment of drivers JSCPB, Industries, WRD,
and barriers for the UDHD
problem
Assessment of WRD
catchment and valley
area bio-physical
properties
Stakeholder River Rejuvenation
consultations and Committee
development of road
map
pg. 33Planning Phase Formation of core team River Rejuvenation
(Restoration Phase) – Management - Committee
technical team-
Community
mobilization team
Survey of the river sites WRD, Industries, JSPCB,
and prioritization of UDHD
restoration measures
Community Industry, JSPCB, UDHD,
mobilization District Administration
Preparation of detailed River Rejuvenation
project report Committee
(Technical and
Financial)
Implementation Phase Prioritization of River Rejuvenation
(Protection Phase) measures Committee
Implementation of UDHD, Industry, JSPCB,
measures District Administration
Monitoring/Regulation JSPCB (Regulate and
of the implantation Monitor),
measures JSPCB to work in
coordination of UDHD,
Industries, District
Administration to execute
the measures
Documentation of JSPCB, UDHD and
measures Industries
Scaling Up Phase Identification of lesson River Rejuvenation
Committee
(Improvement Phase)
Review and River Rejuvenation
Committee
consultation
Planning for second River Rejuvenation
Committee
phase
pg. 34D. Achievable water quality goals with specific timelines
Sl.No. ACTION TO BE TAKEN TIMELINES
Identification and Cleaning of major drains directly September 2020
1
falling into Rivers of Jharkhand
Cleaning all tributary drains of Jharkhand River, – September 2020
2 Setting up of decentralized sewage treatment plants
and allied works
Trapping/ cleaning of remaining identified drains September 2020
3
directly falling into River
Dredging of major drains and stretches of River September 2020/
4
bed continuous process
Laying of sewerage system in un-sewered areas Master Plan, September
5
2020/ continuous process
Rehabilitation & up-gradation of old sewerage September 2020/
6
infrastructure continuous process
Bio remediation & development of public space September 2020
7
along all major drains
E. Proposed Action Plan For Restoration Of Jharkhand Rivers
Regular cleaning of River Bed for removal of Eichhornia Vegetation.
Removal of encroachment (Slum areas) & restriction on Bathing /washing activity all
along the river Bed.
Provision of sanitation facility (Such as Sulabh Sawchalaya) near slum area & dense
populated area to avoid open defecation. Provision of STP for Cities.
Treated sewage of the city will have to be utilized for irrigation / gardening purpose.
The treated sewage after disinfection shall be used for gardening or could be
commercially sold to Industries.
Various Municipal Councils can undertake the river front beautification activities and
rainwater harvesting project along the stretch of the river. Rainwater harvesting can
help in attaining the minimum flow in the river water for scouring the sediments and
dilution water availability.
Scavenging of river beds will have to be undertaken before onset of monsoon
pg. 35F. Action Plan at Village Level:-
For Zilla Parishad: Joint action need to take by Zilha Parishad, Irrigation & Agriculture
Departments. Agriculture Department shall undertake public awareness program to convey
that agriculture / horticulture by untreated river water is unhygienic. Instead bulk sewage /
sullage flowing in the rivers, nallas will have to be treated by artificial wet land systems.
Such systems rely on natural purification by photosynthesis and subsequent aeration by
“emergent macrophytes”. Pathogens are destroyed during the process. Such systems will be
suitable for small villages also. Effluent of artificial wet land system can be safely used for
agriculture because it will be free from pathogens. Zilla Parishad should pass a resolution that
it will spare appropriate land for artificial wet land system.
For Gram Panchayats: A resolution has to be passed by each Gram Panchayat of banks of
river that, they will not allow sewage / sullage from their respective villages to enter the river.
Further they should also provide sulabh shauchalay in villages to avoid open defecation.
Narrow-bore sewerage has been recommended for wastewater treatment. Water supply and
sanitation department of Govt. of Jharkhand should provide proto type designs for narrow-
bore sewerage followed by a stabilization pond.
G. Status of Flood Plain Zone and Environmental Flow (E-Flow)
Sl.No. Action plan for rejuvenation of river Concerned Dept. Time Target
A Flood Plain Zone (FPZ)
Forest,
1 Plantation in Flood Plain Zone (FPZ) Environment & June 2020
Climate Change
District /Local
2 Checking encroachments in the FPZ of river Regular
Administration
Prohibition of disposal of municipal plastic and Local
3 September
bio- medical waste particularly in drains Administration
2020
State Up to March
4 Protection and management of flood plain zone 2020 and
Government/Water
execution of
pg. 36Resource agreement by
October 2019
Department
B Environmental Flow (E-Flow) and Irrigation Practices
Measurement of flow in the river and records Water Resource
1 Regular
maintained Department
To conserve water and good irrigation practices
Water Resource
2 to be adopted by the farmers by organizing mass Continuous
Department/
awareness programmes and through media in
Agriculture Dept.
vernacular language.
Up to March
2020
Water Resource
3 Completion of work for issues related to E-flow execution of
Department
agreement by
October 2019
Up to March
2020
Completion of work related ground water Water Resource
4 execution of
recharge/rain water harvesting Department
agreement by
October 2019
pg. 37Annexure-III (To be revised, as monitoring and regulation to be done by JSPCB)
TIMELINES FOR IMPLEMENTATION OF MODEL RESTORATION PLAN in 2019-2020 and 2020-2021
YEAR 2019-2020 2020-2021
QUARTER QUARTER III QUARTER IV QUARTER I QUARTER II QUARTER III QUARTER IV
PHASES AND ACTION YEAR JUL AUG SEP OCT NOV DEC JAN FEB MAR APR MAY JUN JUL AUG SEP OCT NOV DEC
Pre- Planning Phase: (Recognition)
Gathering of information of non-identified
I
polluted river stretch
Reconnaissance survey sampling of river I
Assessment of water quality I
Planning Phase: (Restoration)
Identification of sources of pollution I
Preparation of Detailed Project Report I
In-situ bioremediation of drains II
Implementation Phase: (Protection)
Assessment of Treatment technologies,
available river flow, prevailing discharge II
standards
Setting up of sewage treatment plants
(STPs)/Effluent treatment plants (ETPs)/ II
CETP
Complying the regulation under JSPCB for
existing industries, causing the pollution I&II
based on survey data
Setting up tertiary level sewage treatment
facilities for grossly polluted stretches devoid II
of perennial fresh water flow
Scaling Up Phase: (Improvement)
Augment river flow, if feasible II
pg. 38You can also read