Investigating Industrial Effluent Impact on Municipal Wastewater Treatment Plant in Vaal, South Africa - MDPI
←
→
Page content transcription
If your browser does not render page correctly, please read the page content below
International Journal of
           Environmental Research
           and Public Health

Article
Investigating Industrial Effluent Impact on Municipal
Wastewater Treatment Plant in Vaal, South Africa
Eunice Iloms 1 , Olusola O. Ololade 2 , Henry J. O. Ogola 1,3                    and Ramganesh Selvarajan 1, *
 1    Department of Environmental Science, University of South Africa—Florida Campus, Roodepoort 1709,
      South Africa; euniceiloms@yahoo.com (E.I.); henryogola@gmail.com (H.J.O.O.)
 2    Centre for Environmental Management, University of the Free State, Bloemfontein 9301, South Africa;
      shola.ololade@gmail.com
 3    School of Agricultural and Food Sciences, Jaramogi Oginga Odinga University of Science and Technology,
      P.O. Box 210-40601, Bondo, Kenya
 *    Correspondence: ramganesh.presidency@gmail.com

 Received: 25 November 2019; Accepted: 28 January 2020; Published: 9 February 2020

 Abstract: Industrial effluents with high concentrations of toxic heavy metals are of great concern
 because of their persistence and non-degradability. However, poor operation and maintenance of
 wastewater treatment infrastructure is a great concern in South Africa. In this study, physico-chemical
 parameters and heavy metals (HMs) concentration of wastewater from five different industries,
 Leeuwkuil wastewater treatment plant (WWTP) inflow and effluent, and Vaal River water samples
 were monitored between January and September 2017, to investigate the correlation between heavy
 metal pollution and the location of industries and ascertain the effectiveness of the municipal
 WWTP. Physico-chemical variables such as pH, biological oxygen demand (BOD), dissolved oxygen
 (DO), chemical oxygen demand (COD), total dissolved solids (TDS) and electrical conductivity
 (EC) exhibited both temporal and spatial variations with the values significantly higher in the
 industrial samples. Inductively coupled plasma optical emission spectrometry (ICP-OES) results
 also showed that aluminium (Al), copper (Cu), lead (Pb) and zinc (Zn) were significantly higher
 in industrial effluents (p < 0.05), with only Zn and Al exhibiting significant seasonal variability.
 Statistical correlation analysis revealed a poor correlation between physicochemical parameters and
 the HMs compositional quality of wastewater. However, toxic HMs (Zn, Cu and Pb) concentrations in
 treated wastewater from WWTP were above the permissible limits. Although the WWTP was effective
 in maintaining most of the wastewater parameters within South African Green drop Standards,
 the higher Cu, Zn, Pb and COD in its final effluent is a concern in terms of Vaal river health and
 biological diversity. Therefore, we recommend continuous monitoring and maintenance of the
 WWTPs infrastructure in the study area.

 Keywords: industrial effluents; monitoring; wastewater treatment; water quality; Vaal River

1. Introduction
     Industrialisation is key to the economic development and prosperity of any nation.
However, the importance of industrialisation in the achievement of global and national economic
growth, wealth and development notwithstanding, it can also be harmful to the environment.
Rapid industrialisation is believed to be one of the main contributors to the pollution of environmental
resources around the world [1], and South Africa is no exception [2,3]. While high-quality water is
essential for most industrial processes, many of these processes generate large effluents of contaminated
wastewater, whose safe disposal into receiving water bodies is of great environmental and health
concern worldwide. For instance, competing demands on limited water resources coupled with

Int. J. Environ. Res. Public Health 2020, 17, 1096; doi:10.3390/ijerph17031096             www.mdpi.com/journal/ijerph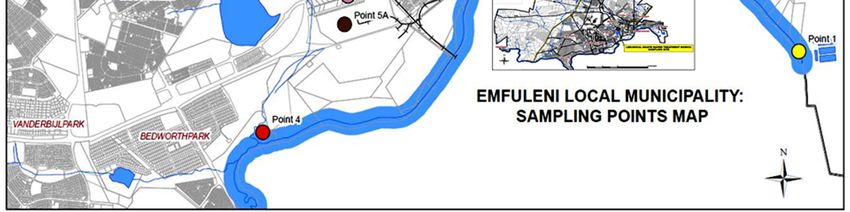
Int. J. Environ. Res. Public Health 2020, 17, 1096                                                   2 of 18

awareness of the issues relating to water pollution, has led to considerable public debate about
the environmental effects of industrial effluents discharged into the aquatic environments in South
Africa [3,4].
      Over the last two decades, there have been increased concerns on the potential adverse
effects of industrial wastewater laden with high content of toxic heavy metal (HM) pollutants
such as cadmium (Cd), nickel (Ni), lead (Pb), chromium (Cr), thallium (Tl) and mercury (Hg) [5,6].
More recently, contaminants of emerging concern (CECs) or micro-pollutants such as pharmaceuticals,
personal care products (PCPs), pesticides, veterinary products, industrial compounds/by-products,
food additives, and engineered nano-materials are posing a major threat to available water
sources [7,8]. Among the pollutants, non-biogenic HMs such as Hg, Cd, Ar, Cr, Tl and Pb are
highly hazardous and can have potentially toxic effects on living organisms [9]. These HMs are
also generally persistent in wastewater treatment system because of their non-biodegradable and
recalcitrant nature. Consequently, their presence in wastewater effluents and subsequent release to the
environment may result in detrimental effect to both human health and aquatic ecosystems [2,10,11].
Therefore, continuous monitoring of wastewater and treatment plants before discharge into the
environment is highly significant [12].
      Industrial wastewater pollution is a notable problem in South Africa, a rapidly developing country
where freshwater resources are short in supply. With just over 1200 m3 /person/year of fresh water
available for a population of around 50 million, the country is currently classified as water stressed [13].
Effluents generated from both industrial and domestic activities occupy the second position with
respect to sources of water and presently constitute a major source of chemical and microbial pollution
of South Africa’s water sources [3,11]. The Vaal Triangle is notably a major industrial hub of South
Africa with diverse industries such as iron and steel, petroleum and coal oil companies, including gold
mine industries. All these industries use hazardous and toxic chemicals in their industrial processes
that can be considered as persistent and non-biodegradable. The Vaal River which passes through
the Vaal Triangle is one of South Africa’s most important river, being the backbone of the country’s
economy as it provides water to about 60% of South Africa, and 20 million people, representing
approximately 45% of its population [4]. However, the water quality in the Vaal River as well as some
of its tributaries is seriously affected because of adjacent mining, farming, urbanisation, and industrial
activities. In the past two decades, it has become apparent that the Vaal River is increasingly under
threat of pollution attributed to the aforementioned anthropogenic activities [14].
      Several research studies indicate that most municipal WWTPs in South Africa rarely treat their
wastewater to acceptable standards [15–17], while some engage in direct discharge of industrial
effluents [18], thereby polluting receiving surface water sources. Furthermore, some of the WWTPs
facilities are generally ill-equipped to remove large quantities of non-biodegradable waste and
recalcitrant heavy metals that are eventually discharged onto the surface water sources [19].
However, there are no sufficient systematic studies that have been conducted to demonstrate a
direct link and correlation between heavy metal pollution in water and the location of the industries
within the Vaal catchment. Therefore, this study aims to: (1) investigate the correlation between
heavy metal pollution in water and the location of industries in the Vaal triangle; and (2) ascertain the
effectiveness of the Leeuwkuil WWTP in the treatment of industrial wastewater from the catchment
before being discharge into the Vaal River.

2. Materials and Methods

2.1. Description of the Study Site
    Vereeniging is a city located in the southern part of the Gauteng province in South Africa,
very close to Vanderbijlpark (west), Three Rivers (east), Meyerton (north) and Sasolburg (south) as
shown in Figure 1. Vereeniging is strategically located on the border of three provinces, consisting of
Mpumalanga, Gauteng and Free State (Sedibeng District Municipality 2010). Leeuwkuil wastewater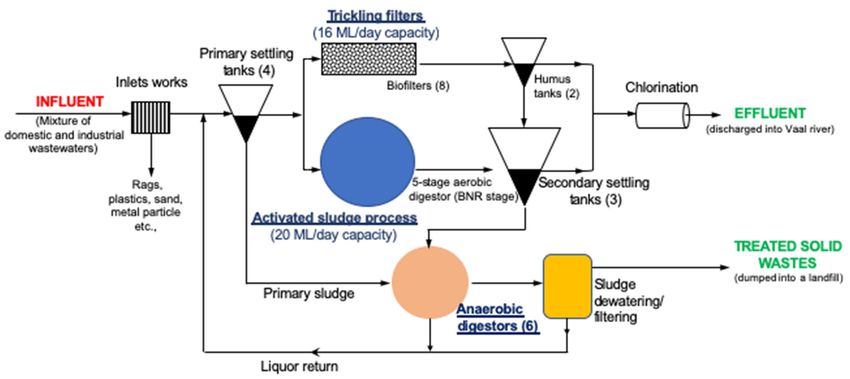
Int.
Int. J.J. Environ.
Environ. Res.
Res. Public
PublicHealth
Health2019,
2020,16,
17,x1096 33 of
of 19
18
treatment works (WWTW) is located in Vereeniging within Emfuleni Local Municipality, which falls
treatment
under works (WWTW)
Sedibeng is located in Vereeniging
District Municipality, and it offerswithin Emfuleni
effluent Local Municipality,
treatment services towhich falls
the local
under Sedibeng
communities. District Municipality, and it offers effluent treatment services to the local communities.
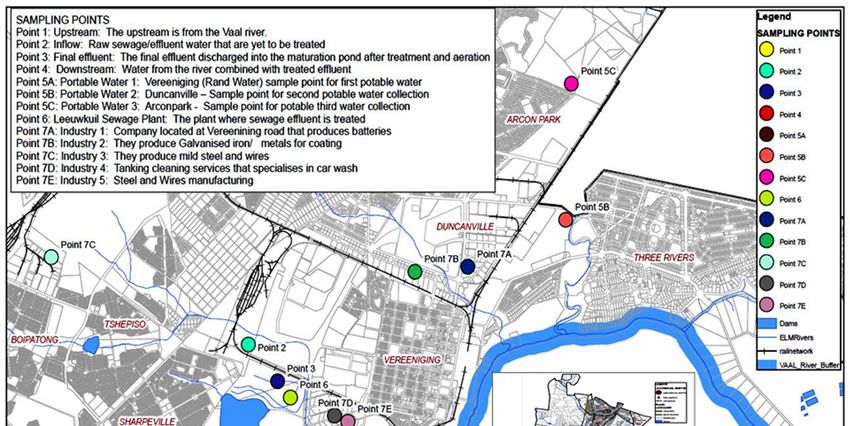
Figure 1. Map
Figure 1. Map showing
showing the
the study
study area
area and
and sampling
sampling points
points within
within Emfuleni
Emfuleni Local
Local Municipality,
Municipality,
Gauteng Province, South Africa.
Gauteng Province, South Africa.
Built inin1958
1958toto handle
handle 83,050
83,050 PE (population
PE (population equivalent),
equivalent), Leeuwkuil
Leeuwkuil WWTPWWTP has acapacity
has a design design
of 36,000 m /day; with an installed 20,000 and 16,000 m /day activated sludge plant and trickling
capacity of 3
36,000 m 3/day; with an installed 20,000 and 316,000 m3/day activated sludge plant and
trickling filters, respectively
filters, respectively [20]. influent
[20]. In the plant, In the wastes
plant, undergoes:
influent wastes undergoes:(screening,
(1) pre-treatment (1) pre-treatment
grit, fats,
(screening,
oil and grease grit, fats, oil and
separation grease large
to remove separation to remove
particles); large treatment
(2) primary particles); to
(2)remove
primary treatment
small to
particles
remove small
(primary particles
settling tanks,(primary settling flotation);
sedimentation, tanks, sedimentation,
(3) secondary flotation); (3) (a
treatment secondary
multistagetreatment
activated(a
multistage
sludge process activated sludge process
with integrated withnutrient
biological integrated biological
removal (BNR) nutrient
for BOD, removal (BNR)
nitrates and for BOD,
phosphorous
nitrates
removal,and phosphorous
trickling removal, trickling
filters, anaerobic filters,
digestion); and anaerobic
(4) tertiarydigestion);
treatment and
(only (4)chlorination
tertiary treatment
done),
(only
beforechlorination
discharge into done),
Vaalbefore discharge
river (Figure 2). into Vaal river (Figure 2).
Because of increased population and industrial development pressure in the area, the existing
Leeuwkuil WWTW receives approximately 42,000 m3 /d average daily waste flow (ADWF), which is
116% beyond the design capacity of the plant. By 2016, several of the biofilters were out of operation
because of ageing infrastructure and poor maintenance. For example, the bio-filter plant with capacity
of 16,000 m3 /d were receiving on average approximately 2000 m3 /d of the influence flow, with the
excess hydraulic capacity of 40,000 m3 /d being handled by activated sludge plant with built capacity of
20,000 m3 /d [20]. In addition, extraneous flow (storm water and water ingress into the sewer system
through leaking pipes or household fixtures) is estimated to be responsible for 40% of the current
inflow into the plant. According to Sedibeng District Municipality [21], there are nine large water users
(wet industries) ranging from battery industries, chemical manufacturing, ferrous and non-ferrous
industries, tanking and car wash and food processing industries, and various small-to-mediumInt. J. Environ. Res. Public Health 2020, 17, 1096 4 of 18
industries discharging their effluent to Leeuwkuil WWTP, whose contribution to the hydraulic load on
the
Int. J.WWTP
Environ. is approximated
Res. at16,
Public Health 2019, 10%x (~4000 m3 /d average daily waste flow). 4 of 19
Figure 2. Flow diagram of the Leeuwkuil wastewater treatment plant (WWTP) showing stages of
wastewater treatment,
treatment, the
the capacity
capacity and
and the
the number
number of
of facilities
facilities within
within the
the plant
plant (in
(inbrackets).
brackets).
2.2. Sample
Because Collection
of increased population and industrial development pressure in the area, the existing
Leeuwkuil
Triplicate waterreceives
WWTW samplesapproximately 42,000 m3effluents,
consisting of industrial /d averagetreated
daily waste
water flow
from (ADWF), which is
WWTP, upstream
116%downstream
and beyond the design capacityfrom
water samples of theVaal
plant. By 2016,
River several water
and potable of the were
biofilters were out
collected from ofthe
operation
eleven
sampling points using sterile sampling bottles. The sampling points (upstream and downstream ofwith
because of ageing infrastructure and poor maintenance. For example, the bio-filter plant the
capacity of WWTP)
Leeuwkuil 16,000 m 3/d were receiving on average approximately 2000 m3/d of the influence flow,
are located along the Vaal River, while the inflow and final effluent were collected
with thethe
within excess hydraulic
premises capacity of
of Leeuwkuil 40,000as
WWTP m3shown
/d being inhandled
Figure 1.byFor
activated sludge
industrial plant with
effluents, built
samples
capacity of 20,000 m 3 /d [20]. In addition, extraneous flow (storm water and water
were collected at the discharge points of each industry to the municipal sewer lines. These included: ingress into the
sewer system through leaking pipes or household fixtures) is estimated to be responsible
Industry 1 (Battery (lead acid) manufacturer); Industry 2 (Iron and steel—galvanize coating); Industry for 40% of
3the current
(Iron and inflow into products);
steel wire the plant. According
Industry 4 to Sedibeng
(Tanking andDistrict Municipality
car wash); [21], there
and Industry are wire
5 (Steel nine
large water users (wet industries) ranging from battery industries, chemical manufacturing,
manufacture). To understand the temporal effects, the samples were collected over a period of nine ferrous
and non-ferrous
months between industries,
January and tanking and car
September wash
2017, and food processing
representing industries,
the seasonal changes and various
prevalent in small-
South
to-medium industries discharging their effluent to Leeuwkuil WWTP, whose
Africa (summer, autumn, winter, and spring). All the collected samples were preserved following contribution to the
hydraulic load on the WWTP is approximated at 10% (~4000
APHA standards [22] and transported to the UNISA laboratory for analyses. m 3/d average daily waste flow).
2.2. Sample
2.3. Collection
Determination of Physico-Chemical Parameters
Triplicate
During water samples
sampling, consisting
water samples wereof analysed
industrialon-site
effluents, treated water
in triplicate from
readings forWWTP, upstream
temperature, pH,
and downstream
electrical watersalinity,
conductivity, samplestotal
from Vaal River
dissolved and(TDS),
solids potable water were
dissolved collected
oxygen from the
(DO) using eleven
calibrated
sampling points using
multi-parameter probessterile
(Hanna sampling bottles.version
Instruments, The sampling
HI9828,points (upstream
SN 08334776, and downstream
Woonsocket, of
RI, USA).
the Leeuwkuil
The WWTP)
levels of chemical are located
oxygen demand along
(COD)theand
Vaalbiological
River, while
oxygenthedemand
inflow and(BOD final effluent
5 ) were were
evaluated
collected
in within the
the laboratory premises
following of Leeuwkuil
standard methods WWTP as shown
as described byinAPHA
Figure(APHA
1. For industrial effluents,
1995). Photometric
samples were was
measurement collected
used at
to the discharge
measure CODpoints of each
using COD industry
broad rangetokit
the municipal
(Hanna sewer lines.
Instruments, These
HI839800,
included: Industry
Woonsocket, RI, USA)1 performed
(Battery (lead acid) to
according manufacturer); Industry
the manufacturer’s 2 (Iron and steel—galvanize
protocol.
coating); Industry 3 (Iron and steel wire products); Industry 4 (Tanking and car wash); and Industry
2.4. Heavy
5 (Steel Metal
wire Analysis
manufacture). To understand the temporal effects, the samples were collected over a
period of nine months
Elemental betweenofJanuary
concentrations collectedand Septemberand
wastewater 2017, representing
water samples werethe seasonal
analysed changes
using
inductively coupled plasma optical emission spectrometry (ICP-OES, PerkinElmer Optima 5300were
prevalent in South Africa (summer, autumn, winter, and spring). All the collected samples DV,
preserved following
Waltham, MA, USA) APHA standards
according to [22]
EPAand transported
Method 200.7toasthedescribed
UNISA laboratory
by Martin for analyses.
et al. [23].
Briefly, water samples were digested using 30 mL of HCl and 10 mL of HNO3 in a 3:1 ratio maintained at
2.3. ◦Determination
100 of Physico-Chemical
C until the samples were dissolvedParameters
completely. The samples were then evaporated to a volume of
During sampling, water samples were analysed on-site in triplicate readings for temperature,
pH, electrical conductivity, salinity, total dissolved solids (TDS), dissolved oxygen (DO) using
calibrated multi-parameter probes (Hanna Instruments, version HI9828, SN 08334776, Woonsocket,
RI, USA). The levels of chemical oxygen demand (COD) and biological oxygen demand (BOD5) were
evaluated in the laboratory following standard methods as described by APHA (APHA 1995).Int. J. Environ. Res. Public Health 2020, 17, 1096 5 of 18
5–10 mL at room temperature after which they were transferred into 25 mL volumetric flasks containing
2.5 mL of Indium (internal standard) for metal analysis. All digested samples were filtered using
0.45 µm filter paper, prior to ICP-OES analysis. A calibration blank and an independent calibration
and verification standards were analysed together with all samples to confirm the calibration status of
the ICP-OES. The calibration curves with r2 > 0.999 were accepted for quantification resolution and
the results were reported as the averages of triple measurements.
2.5. Statistical Analysis
Using statistical analysis software (SAS v 9.4, SAS Institute, Cary, NC, USA), analysis of variance
(ANOVA) was used to compare the mean values of the tested parameters for all the different
sampling sites, months and seasons at 0.05 level of significance using Tukey’s HSD as the post hoc
test. The relationship between the physicochemical parameters and heavy metal constituents of the
industrial wastewater and WWTP effluents was determined using two-tailed Pearson correlation
analysis. Descriptive statistics was used to generate the means and standard deviation for the data sets.
3. Results and Discussion
3.1. Industrial Wastewater Physicochemical Characteristics
The on-site physicochemical parameters recorded from different industrial and WWTP wastewater
samples across all seasons sampled are presented in Table 1. The overall temperature ranged between
15.8–27.7 ◦ C, the values being lower during winter (15–17 ◦ C) than other seasons (20–29 ◦ C). In summer,
the highest sample temperature was recorded for Industry 3 compared to WWTP influent. A similar
pattern was also noted during each of the other seasons (Table 1). However, no significant difference in
temperatures was observed for the different sites (ANOVA, p = 0.879), consistent with the findings
that temperature of wastewater generally mirrors the local prevailing ambient conditions [14,24,25].
According to Mahgoub et al. [26], a rise in the WWTP influent temperature above 35 ◦ C is associated
with negative effects on biological activity during the treatment process, that may reduce the waste
treatment efficiency. Higher temperatures of the WWTP effluent is also undesirable as it can lead to
the imbalance of aquatic organisms and its activities in the receiving water bodies.
Other physicochemical variables such as pH, BOD, DO, COD, TDS and EC exhibited both temporal
and spatial variation. The pH values of Industry 2, WWTP influent and effluent discharges were
in accordance with the acceptable limit set by Department of Water Affairs and Forestry [27], while,
Industry 3, 4 and 5 had significantly higher pH values >9.5 (ANOVA, p < 0.0001), indicative of highly
alkaline wastewater; the only exception was Industry 1 (battery industry), which was acidic (pH 4.6
± 0.8). Consistent with our results, Howell et al. [28] reported that variations in wastewater pH is
dependent on the main industrial activity and seasonality. On the other hand, a trend was observed
albeit with significant differences for EC, TDS and salinity in the order Industry 5 > Industry 2 >
Industry 4 > Industry 1 > industry 3 (p < 0.010, p < 0.0001 and p < 0.0001 for EC, TDS and salinity,
respectively). Different industrial processes use an array of organic and inorganic compounds and
release diverse end products that can influence effluents pH, EC, TDS and salinity. For instance,
battery industry is associated with discharges of waste high in sulphuric acid leading to low pH (up to
1.6), heavy metals like lead and different inorganic salts that may elevate the TDS, EC and salinity
contents [29].
Generally, carwash effluent (Industry 4 ) contains a number of contaminants such as sand/dust,
salt, oils, grease, organic matter and metal ions that may also influence the resultant wastewater pH,
TDS, EC, salinity and heavy metal composition [30,31]. Similar to our finding, other studies have
reported that significantly higher EC, TDS and salinity occur during months of low precipitation
(such as winter in South Africa), as increased evaporation leads to a more concentrated effluent [32–34].
Conversely, the dilution effect on the wastewater milieu during high precipitation months (summer)
influences the resultant effluent composition (Supplementary Material, Table S1). Higher values of ECInt. J. Environ. Res. Public Health 2020, 17, 1096 6 of 18
and TDS in wastewater may be attributed to the presence of contaminants such as Na+ , Ca2+ , Mg2+ ,
K+ , Cl− , SO4 2− and HCO3 − and other metal salts [35]. Despite the final WWTP effluent, EC and TDS
levels being lower than other sampling sites across all the seasons, the recorded levels did not meet the
South Africa Green drop standard and permissible limits [27]. Therefore, our results imply that the
Leeuwkuil WWTP is not effective in abstracting contaminants high in the aforementioned soluble salts,
thus contributing to the observed high EC and TDS beyond the legal limits for final WWTP effluent.
In this study, values of DO in the industrial, WWTP inflow and effluents were observed to be
between 1.0–2.7 mg/L, but varied significantly across the sampling points and seasons. Comparatively,
the final WWTP effluent had significantly higher DO compared with other wastewater streams
(ANOVA, p < 0.0056). The reported levels were still lower than the required standard of 8–10 mg/L
before discharge into surface water [17,19]. Consistent with our studies, Momba et al. [16] and
Edokpayi [37] recorded DO levels in the range of 3.26–4.57 mg/L in their investigation of the impact of
inadequately treated effluents of four wastewater treatment facilities in Buffalo City and Nkonkobe
Municipality of Eastern Cape and Limpopo Province, respectively, of South Africa. Similar to DO, the
mean COD levels of the industrial effluents and WWTP inflow were significantly higher (ANOVA, p <
0.0001) than WWTP outflow. The South African guideline value for COD in wastewater is 75 mg/L,
which exceeded in some of the sampling months in the WWTPs (Table 1).
It is estimated that the Leeuwkuil WWTP handles 42,000 m3 /d average daily waste flow that is
116% beyond the design capacity of 36,000 m3 /d [20]. In addition, reported constant breakdown of the
trickling filter plants because of ageing infrastructure, imply that the bulk of wastewater (approximately
40,000 m3 /d average daily waste flow) are processed through activated sludge plant (ASP) having
design capacity 20,000 m3 /d average daily waste flow. The operation efficiency of an ASP is mainly
dependent on organic loading rates (in terms of BOD) and hydraulic loading, which affects the
dissolved oxygen (DO) demand in the aeration tank, biosolids wasting rate, optimal return activated
sludge (RAS) rate, and solids settling and compaction characteristics [38]. In general, organic loading
rates of 0.5–1.5 kg BOD/m3 /day with hydraulic retention times of 5–14 h depending on the nature of
the wastewater, is capable of giving BOD reductions of 90–95% in a conventional activated sludge
process [39]. Based on the maximum hydraulic load of 40,000 m3 /d average daily waste flow, the
organic loading of the influent is 132 ± 4.2 kg BOD/m3 /day. However, the calculated organic loading
was not statistically different (p < 0.05) from that of WWTP effluent. This illustrates the inefficiency in
treating wastewaters probably related to delivery of pollution loads that exceeds the treatment capacity
of a municipal WWTP.
The BOD: COD ratios can also be used for the characterization of wastewaters. Typically, municipal
wastewaters have BOD: COD ratios between 0.2:1 and 0.5:1, with ratio being fairly steady for domestic
sewage [38]. However, discharge of industrial effluents of variable composition and loading may
fluctuate the ratio considerably. In this study, the calculated average BOD: COD ratio for WWTP
influent was 0.02:1. Such very low BOD: COD ratios indicate high concentrations of nonbiodegradable
organic matter in the influent that may be inefficiently degraded by the biological effluent treatment
processes [25,38]. Overall, the aforementioned factors, process limitations and challenges within
the Leeuwkuil WWTP account for the inefficiency to treat the wastewaters to acceptable South
African Green Drop standards [36]. The organic load of wastewater and the treated effluent contributes
significantly to oxygen demand level of the receiving water in terms of DO, COD and BOD. High organic
load in untreated wastewater is associated with high BOD and COD leading to increased depletion
of dissolved oxygen (DO). DO level below 5 mg/L would adversely affect aquatic ecosystem in the
receiving surface water, and, therefore, the reported DO, COD and BOD levels of the final effluents is
an environmental concern that needs addressing.Int. J. Environ. Res. Public Health 2020, 17, 1096 7 of 18
Table 1. Summary of physicochemical characteristics (mg/L) in the different industrial wastewater and Leeuwkuil WWTP effluents of the Vaal triangle η .
Temp BOD DO COD TDS EC Salinity
Sampling Site pH
(◦ C) (mg/L) (mg/L) (mg/L) (mg/L) (mS/cm) (psu)
Industry 1: 22.2 ± 4.7 4.6 ± 0.8 a 6.0 ± 0.6 a 1.6 ± 0.3 a 256 ± 62 a 1868 ± 463 b 258 ± 21 a 3.0 ± 2.5 ab
Battery (16.4–27.4) (3.1–6.2) (5.6–6.8) (1.2–1.9) (184–320) (1301–2434) (232–281) (1.4–6.8)
Industry 2:
21.8 ± 4.6 8.0 ± 1.1 a 6.0 ± 0.7 a 1.7 ± 0.7 ab 460 ± 476 abc 1827 ± 489 b 2969 ± 834 ab 1.9 ± 0.5 ab
Iron/metal
(15.7–26.6) (6.4–8.7) (5.4–7.0) (0.7–2.1) (174–1172) (1138–2223) (2223–3782) (1.2–2.4)
galvanizing
Industry 3: 22.3 ± 5.2 9.7 ± 0.5 ab 5.4 ± 1.0 ac 1.6 ± 0.5 a 1038 ± 304 c 16.8 ± 4.6 a 30.8 ± 14.0 a 20.2 ± 4.9 c
Iron/steel (16.2–28.2) (9.2–10.2) (4.2–6.6) ((1.0–2.2) (872–1493) (12–22) (14–45) (14.4–24.8)
Industry 4:
22.2 ± 5.1 10.9 ± 2.2 b 5.9 ± 0.8 a 2.0 ± 0.2 ab 918 ± 294 bc 2330 ± 700 b 2460 ± 1492 ab 1.4 ± 0.4 ab
Tanking/car
(15.8–27.7) (7.7–12.5) (5.1–6.9) (1.8–2.1) (620–1209) (1417–3117) (1417–4673) (0.9–2.5)
wash
Industry 5: 22.3 ± 5.1 11.1 ± 0.9 b 5.9 ± 0.8 a 1.2 ± 0.5 a 310 ± 251 a 3654 ± 891 c 3849 ± 3756 b 5.8 ± 0.5 b
Iron/steel (16.0–27.9) (10.3–12.2) (5.2–6.7) (0.8–1.9) (95–670) (2468–4611) (1109–9224) (5.2–6.2)
21.6 ± 4.0 8.3 ± 0.6 a 3.3 ± 1.2 b 1.4 ± 0.3 a 434 ± 50 ab 335 ± 14 a 590 ± 171 ab 0.34 ± 0 a
WWTP influent
(16.6–26.3) (7.8–9.0) (2.1–4.9) (1.0–1.7) (360–468) (321–354) (337–710) (0.33–0.35)
22.7 ± 5.0 8.0 ± 0.3 a 3.8 ± 0.7 bc 2.7 ± 0.4 b 36 ± 67 a 258 ± 21 a 469 ± 143 ab 0.26 ± 0.02 a
WWTP effluent
(16.7–27.0) (7.7–8.4) (3.1–4.4) (2.2–3.0) (0–136) (232–281) (281–627) (0.2–0.3)
F-statistic τ 0.02 8.06 *** 7.32 ** 5.05 ** 7.61 *** 28.63 *** 3.88 ** 44.38 ***
Green drop
30 5.5–9.5 - - 75 25 150 -
Standards #
DWAF 2013 § - 5.5–9.5 - - 75 25 70–150 -
ηMean ± SD values followed by different letters with a column are statistically different (ANOVA; Tukey’s t test, p < 0.05). Range values is provided in bracket. Significance difference is
τ
denoted by *** p < 0.001, ** p < 0.01. # South Africa Department of Water and Sanitation (DWS) wastewater quality management limits to be achieved by Water Service Authorities and
wastewater treatment facilities for certification [36]. § Legal permissible limits set by Department of Water Affairs and Forestry in South African Government Gazette No.36820, 2013 [27].
BOD, biological oxygen demand; DO, dissolved oxygen; COD, chemical oxygen demand; TDS, total dissolved solids; and EC, electrical conductivity.Int. J. Environ. Res. Public Health 2020, 17, 1096 8 of 18
3.2. Heavy Metal Composition of Industrial Wastewaters
In this study, samples collected from five industrial effluents and Leeuwkuil WWTP (Inflow and
final effluent) were analysed for the identification and determination of heavy metal concentrations.
In total, 24 elements were detected at different concentrations (Supplementary Material, Table S2).
The results for Cd, Li, Mo, Te, Sb and V were not shown because of their very low detection in the
samples. The total concentration of major heavy metals that are commonly found in the industrial
wastewater, WWTP inflow and effluents samples and their corresponding discharge standards are
presented in Table 2.
Table 2. Concentrations of major heavy metals (mg/L) in the different industrial wastewater and
Leeuwkuil WWTP effluents of the Vaal triangle.
Sampling Asite Al Zn Cu Pb
11.8 ± 1.16 a 7.41 ± 2.04 0.72 ± 0.04 a 4.64 ± 0.17 a
Industry 1: Battery
(10.3–15.2) (0.5–28.5) (0.62–0.81) (4.3–5.0)
Industry 2: Iron/metal 0.28 ± 0.05 b 56.7 ± 19.03 a 0.24 ± 0.04 0.18 ± 0.02
galvanizing (0.2–0.37) (0.2–81.1) (0.15–0.35) (0.15–0.23)
1.95 ± 1.05 b 1.47 ± 0.74 0.19 ± 0.02 0.18 ± 0.03
Industry 3: Iron/steel
(0.2–4.41) (0.2–2.97) (0.12–0.25) (0.1–0.26)
Industry 4: Tanking/car 14.0 ± 2.34 a 4.07 ± 0.21 0.18 ± 0.02 0.19 ± 0.03
wash (7.85–18.7) (3.55–4.49) (0.13–0.24) (0.13–0.25)
2.56 ± 1.59 b 0.26 ± 0.05 0.19 ± 0.02 0.21 ± 0.00
Industry 5: Iron/steel
(0.12–6.92) (0.20–0.41) (0.14–0.23) (0.2–0.21)
0.18 ± 0.03 b 0.20 ± 0.01 0.22 ± 0.02 0.20 ± 0.03
WWTP influent
(0.15–0.24) (0.18–0.23) (0.18–0.26) (0.12–0.23)
0.20 ± 0.02 b 0.16 ± 0.03 0.18 ± 0.02 0.19 ± 0.03
WWTP effluent
(0.15–0.24) (0.09–0.23) (0.14–0.24) (0.12–0.23)
F–statisticτ 23.42 *** 7.31 *** 46.58 *** 584.45 ***
DWAF 2013 § - 0.1 0.01 0.01
ηMeans followed by different letters (a, b) with columns are statistically different (ANOVA; Tukey’s t test, p < 0.05).
τSignificance difference is denoted by *** p < 0.001. § Legal permissible limits set by South African Government
Gazette No.36820, 2013 [36].
Wastewater from Industry 1 had significantly higher levels of Al, Cu and Pb, followed by Industry 4,
5, 3 and 2, which could be ascribed to the main processes related to these industries. Physicochemical and
elemental characterisation of the automotive battery industry effluent indicates that it is complex and
strongly acidic in nature containing a variety of heavy metals above the legislated limits for discharge [40,41].
Heavy metal contents of Industry 1 were of the magnitude in the order of Al > Zn > Pb> Cu > Ni >
Cr, with all metal content being consistently above legal permissible limits. However, significant season
variability was only observed for Zn (ANOVA, p < 0.0001) and Al content (ANOVA, p = 0.042) (Figure 2).
Consistent with our results, Vu et al. [40] reported an average concentration of Pb in battery wastewater
of about 3–15 mg/L. Similarly, Ribeiro et al. [41], also reported higher concentration values for Fe (344
± 96 mg/L), Zn (60 ± 17 mg/L) and Pb (22 ± 15 mg/L) and other heavy metals (Cr, Cu and Ni < 2 mg/L)
in lead acid battery industry wastewaters. In contrast, metal industry effluents (Industry 2, 3 and 5)
exhibited varying levels of heavy metals contamination above the permissible legal limits, with Industry 2
(galvanized iron coating industry) having characteristic higher Zn (56.7 ± 19.03 mg/L; ANOVA, p < 0.0001)
and Cr content (0.80 ± 0.18 mg/mL). Ferrous and non-ferrous metal industry often undertake process such
as acid pickling of metal surfaces to remove the oxide layer, rust, encrustations, inorganic contaminants
or other impurities from ferrous metals, copper, or precious metals, resulting in wastewater high in
heavy metals such as Cu, Ni, Zn, Cr among others [6]. On the other hand, Industry 4 (tanking/car wash)
wastewater had an appreciable high content of Al, Zn and Ni compared to other industrial effluents.Int. J. Environ. Res. Public Health 2020, 17, 1096 9 of 18
Several studies have also reported that carwash effluents are rich in pollutants of concern such as heavy
metals [42,43]. Tekere et al. [30] also reported higher average Cu and Zn contents in carwash effluents
in Gauteng Province of South Africa, mainly derived from brake pads and tyres. Because of their high
polluting nature, wastewater from carwash should be pre-treated before disposal into municipal sewers.
However, Tekere et al. [30] revealed that different carwash differ in the efficiency of their pre-treatment
systems in terms of pollutant removal from effluents and the quality of their effluents significantly differs
in the concentrations of most key parameters. Comparatively, the values reported in the study were much
higher in terms of Cu content, but lower Zn level was reported in this study. Findings in this research
seem to concur with the observations that carwash wastewater is predominantly characterised by heavy
metal pollutants such as Zn, Cu in addition to other compounds of environmental concerns.
In general, heavy metal composition of WWTP inflow and final effluents were comparatively
lower than those of industrial effluents across all seasons (Figure 3). In Leeuwkuil WWTP, different
industrial wastewater streams from the industrial catchment area are mixed with domestic sewage
discharges and storm-water runoff before it reaches the treatment system. This practice may have a
diluting effect, accounting for the low heavy metal composition of the influent wastewater observed
in the study. However, a distinct reduction of the heavy metal concentrations between influent and
effluent streams during a treatment process should be a good indicator of the WWTP efficiency in their
removal. Unfortunately, results showed that there were no significant differences between the heavy
metal content of the influent and effluent samples (Table 2).
Industrial water demand and wastewater production are sector-specific. Thus, the concentration and
composition of the waste flows (mass/time) can vary significantly depending on the industrial process.
In Leeuwkuil WWTP, it is estimated that industrial wastewater contribute to approximately 10% of
influent hydraulic load [21]. Though not significant in capacity, such industrial wastewater may have
high loads of a wide variety of microcontaminants such as heavy metals and non-biodegradable organics
that may add to the complexity of wastewater treatment. Comparatively, heavy metals are not easily
removed in a standard WWTP configuration, and often requires an additional tertiary treatment such as
chemical precipitation, oxidation or coagulation techniques for their removal [6]. Similar to other urban
WWTPs designed to cope mainly with the content of organic matter and nutrients typical of domestic
effluents, Leeuwkuil plant has only chlorination (disinfection) step as only tertiary treatment before
effluent are discharged into the Vaal River (Figure 2). Because of their recalcitrant nature, industrial
effluent contaminants can affect the performance of the plants by hindering their biological functioning,
particularly in cases where the WWTP was not designed to accept particular types of industrial effluent
and/or where the characteristics of industrial effluents have changed over time [18]. Furthermore, toxicity,
a higher nutrient content and a higher concentration of organic matter can induce changes in the balance
of bacteria in various steps of the treatment leading to inefficiency of the biological treatment process [39].
A common issue also faced by Leeuwkuil and other urban WWTPs in South Africa relates to
capacity overloads due to extraneous flow (storm water and water ingress into the sewer system
through leaking pipes or household fixtures, broken pump stations due to ageing infrastructure),
which has been reported to account up to 40% hydraulic load [19,20]. In addition to increasing the
hydraulic load, such indirect effluents entering the WWTPs during storms initially increase pollutant
concentrations that are then diluted. Some pollutants that are likely to increase in concentration during
storm events include heavy metals, nitrogen and phosphorus which may affect the WWTP efficiency.
The final treated wastewater from Leeuwkuil WWTP had heavy metal content (Zn, Cu and Pb) above
the permissible limits [27,36]. These effluents are finally discharged into the Vaal River, and thus
constitute a major point source of pollution to the river ecosystem. Hence the findings from this study
indicate the limitation and/or inefficiency of Leeuwkuil WWTP in treating industrial wastewater high
in both organic and inorganic loads, despite improving the DO, COD, BOD and heavy metal levels
within the final effluent vis-à-vis the untreated industrial wastewater. Furthermore, in agreement with
our findings, industrial activities were reported to influence the concentrations of heavy metals suchin addition to other compounds of environmental concerns.
In general, heavy metal composition of WWTP inflow and final effluents were comparatively
lower than those of industrial effluents across all seasons (Figure 3). In Leeuwkuil WWTP, different
industrial wastewater streams from the industrial catchment area are mixed with domestic sewage
discharges and storm-water runoff before it reaches the treatment system. This practice may have a
Int. J. Environ. Res. Public Health 2020, 17, 1096 10 of 18
diluting effect, accounting for the low heavy metal composition of the influent wastewater observed
in the study. However, a distinct reduction of the heavy metal concentrations between influent and
effluent streams during a treatment process should be a good indicator of the WWTP efficiency in
as Pb, Cu, Mn, Zn, Fe and Cd above permissible limits by WHO, USEPA, EUC and EPA in rivers
their removal. Unfortunately, results showed that there were no significant differences between the
impacted by industrial wastewater in Nigeria [44], Ethiopia [45] and India [34].
heavy metal content of the influent and effluent samples (Table 2).
Figure 3. Seasonal variability of toxic heavy metal compositions in the industrial and Leeuwkuil
Figure 3. Seasonal variability of toxic heavy metal compositions in the industrial and Leeuwkuil
WWTP discharges. Mean values followed by different letters (a and b) within a sampling point are
WWTP discharges. Mean values followed by different letters (a and b) within a sampling point are
statistically different (ANOVA; Tukey’s test, p < 0.05). p-Values of the waste streams showing
statistically different (ANOVA; Tukey’s test, p < 0.05). p-Values of the waste streams showing significant
significant differences between seasons are provided.
differences between seasons are provided.
Industrial water demand and wastewater production are sector-specific. Thus, the concentration
The
and analysis of theofinterrelationship
composition between physical
the waste flows (mass/time) can varyparameters
significantlyand heavy metals
depending on the also gave an
industrial
insightprocess.
about the influence of the industrial effluents on the wastewater treatment plant. The
In Leeuwkuil WWTP, it is estimated that industrial wastewater contribute to approximately results
of bivariate
10% oftwo-tailed Pearsonload
influent hydraulic correlation analysis
[21]. Though are presented
not significant in Table
in capacity, such3.industrial
Overall,wastewater
there was a
may have between
poor correlation high loadsphysicochemical
of a wide varietyparameters
of microcontaminants
and the heavysuch metal
as heavy metals and non-
compositional quality
biodegradable
of wastewater. organicssubtle
However, that may add to the complexity
observations of wastewater
could be discerned fromtreatment. Comparatively,
the results. Among the
heavy metals
physicochemical are not easily
parameters, only removed
pH had ainmoderate
a standard WWTPcorrelation
negative configuration,
withand
Cu often requires
(r = −0.61, pInt. J. Environ. Res. Public Health 2020, 17, 1096 11 of 18
Table 3. Two-tailed Pearson’s correlation coefficients for the physicochemical parameters and toxic heavy contents in the industrial and Leeuwkuil WWTP effluents § .
Parameter pH BOD COD DO TDS EC Salinity Al Zn Cu Pb
pH 1
BOD 0.12 1
DO −0.02 −0.47 * 1
COD 0.19 0.00 −0.06 1
TDS 0.25 0.10 0.16 −0.51 * 1
EC 0.41 0.04 0.13 −0.29 0.66 ** 1
Salinity 0.14 −0.31 −0.13 0.36 −0.60 ** −0.36 1
Al −0.03 0.25 0.17 0.10 0.08 −0.20 −0.35 1
Zn −0.24 0.10 −0.01 −0.05 0.05 0.22 −0.25 −0.32 1
Cu −0.61 ** 0.09 −0.10 −0.35 −0.03 −0.37 −0.26 0.41 0.02 1
Pb −0.57 ** 0.10 −0.04 −0.41 −0.02 −0.37 −0.23 0.46 * −0.12 0.96 *** 1
§Correlations are defined as weak (0 < |r| < 0.3), moderate (0.3 < |r| < 0.7) or strong (|r | > 0.7). Significant correlations (at p < 0.001 ‘***’, p < 0.01 ‘**’, p < 0.05 ‘*’) are bolded. BOD,
biological oxygen demand; DO, dissolved oxygen; COD, chemical oxygen demand; TDS, total dissolved solids; and EC, electrical conductivity.
Table 4. Two-tailed Pearson’s correlation coefficients for the physicochemical parameters and toxic heavy contents in the Leeuwkuil WWTP influent and effluent § .
Parameter pH BOD DO COD TDS EC Salinity Al Zn Cu Pb
pH 1
BOD 0.43 1
DO −0.26 0.31 1
COD 0.45 −0.19 −0.95 *** 1
TDS 0.35 −0.17 −0.87 ** 0.92 ** 1
EC −0.21 −0.05 −0.12 0.23 0.66 ** 1
Salinity 0.36 −0.22 −0.90 ** −0.95 *** 0.99 *** 0.31 1
Al −0.36 −0.03 0.53 −0.45 −0.14 0.20 −0.21 1
Zn −0.07 0.24 −0.55 0.44 0.39 −0.05 0.40 −0.29 1
Cu 0.22 0.16 −0.67 0.56 0.35 0.00 0.40 −0.88 ** 0.63 1
Pb 0.56 −0.24 −0.11 0.20 0.08 −0.23 0.09 −0.37 0.64 0.01 1
§Correlations are defined as weak (0 < |r| < 0.3), moderate (0.3 < |r| < 0.7) or strong (|r | > 0.7). Significant correlations (at p < 0.001 ‘***’, p < 0.01 ‘**’, p < 0.05 ‘*’) are bolded. BOD, biological
oxygen demand; DO, dissolved oxygen; COD, chemical oxygen demand; TDS, total dissolved solids; and EC, electrical conductivity.Int. J. Environ. Res. Public Health 2020, 17, 1096 12 of 18
3.3. Impact of Industrial Wastewater and WWTP Effluents on Vaal River
To determine the changes in the Vaal River due to the discharge of wastewater, physicochemical
parameters and heavy metal composition were investigated upstream and downstream of WWTP
during the sampling period. These values were compared with background levels in potable water
collected in two locations within the study (Table 5). The pH values of the Vaal River remained
constant between 7.7–9.2 across all seasons, and did not show significant difference with potable water
samples (ANOVA, p = 0.3521). As a consequence of different seasons, water temperature showed
temporal differences, but was not significantly different between sampling sites. At the same time
river water samples had significantly elevated levels of BOD, COD, TDS, EC, salinity, Al, Cu and
Pb vis-à-vis background values in potable water (Table 5). Specifically, downstream river samples
had significant higher levels of COD, TDS and Pb contents compared to upstream samples (p = 0.05),
that are above the permissible levels by SANS 241-1 2015 standards [46]. There was ~two-fold increase
in the level of mean COD (88 ± 57.2 mg/L vs. 162 ± 54.6 mg/L) and Pb content (0.098 ± 0.033 mg/L vs.
0.183 ± 0.041mg/L) in upstream and downstream samples, respectively. Interestingly, the background
levels of Cu and Pb in potable water from the study site were below the detectable limits of the
ICP-EOS, indicating WWTP effluent as the source of elevated Pb downstream. Our result is consistent
with the findings of Osman and Kloas [47] who observed Pb concentrations to be higher in Nile River
as a result of urban effluent draining into the river. On the other hand, the values of Zn, Cu and Al,
though higher in downstream samples in contrast to upstream samples, were not significantly different.
This suggests that the sewage treatment plant is not a major source of these trace metals. The Cu
and Zn levels fell within the SANS [46] guidelines for potable water and irrigation water, which are
between 0.2 and 5 mg/L, respectively. The EC values for downstream and upstream and potable water
samples ranged from 368 to 763 µS/cm (Table 5). These values are higher compared to those reported
by Jordan and Bezuidenhout [48] for the Vaal River in 2012. This implies that the rate of pollution
has increased over the years possibly because of increased anthropogenic influences. Du Plessis [49]
recently reported that there is increasing evidence that industrial effluents is associated with an
increase in BOD, total dissolved solid and total suspended solid levels, toxic metals such as cadmium,
chromium, nickel and lead, and faecal coliforms in the Vaal Barrage. Chigor et al. [50], also reported
higher EC values than the current study which they attributed to the influence of pollution from land
use activities within the Buffalo River Catchment in the Eastern Cape Province of South Africa.
Overall, the heavy metal levels reported in this study were very low compared with those reported
in polluted rivers linked to industrial and WWTP effluents [3,32–34,45,51]. One limitation of the study
is that heavy metal composition was only done on water samples that generally gives lower heavy
metal composition, particularly at higher pH condition. At higher pH, most heavy metals are removed
from solution by precipitation process and get adsorbed onto the bottom sediment because of the
production of hydroxide [52]. Although there was no significant difference in the pH of upstream and
downstream samples, higher level of heavy metals downstream is a pointer that the concentration of
the heavy metal may be higher in river sediments downstream, giving a better indication of the impact
of the WWTP on the pollution of the river. Heavy metal pore-analysis of the river sediment would
have helped to better define the ecotoxicological risk of the river [53].Int. J. Environ. Res. Public Health 2020, 17, 1096 13 of 18
Table 5. Physicochemical characteristics and mean concentrations of major heavy metals (mg/L) in Vaal River samples upstream and downstream of WWTP effluent
discharge and potable water around the Vaal Area.
Upstream Downstream Potable Water 1 Potable Water 2 SANS 241-1
Parameter * p-Value
Mean ± SD Range Mean ± SD Range Mean ± SD Range Mean ± SD Range 2015 §
pH 8.4 ± 0.45 7.8–8.8 8.5 ± 0.57 7.8–9.2 8.8 ± 0.36 8.5–9.2 8.9 ± 0.25 8.7–9.2 0.3521 5.0–9.7
BOD (mg/L) 4.497 ± 0.334 a 4.1–4.9 4.305 ± 0.258 a 4.–4.7 1.01 ± 0.142 b 0.9–1.2 1.09 ± 0.553 b 0.6–1.8Int. J. Environ. Res. Public Health 2020, 17, 1096 14 of 18
Results from this study show that industrial wastewater and WWTP effluent are evidently
burdened with toxic heavy metals like Pb that the municipal WWTPs are unable to treat efficiently,
therefore constituting as pollutant in the Vaal River. Disposal of inadequately treated effluents from an
array of industries is leading to the degradation in the quality of the Vaal River ecosystem, making
the water unsuitable for drinking purposes, irrigation and aquatic life [2,54–56]. Hence, better control
of the industrial sources is needed to help minimize the quantity of contaminated wastewater into
already overburdened or inefficient municipal WWTPs. Currently, all industries are required by law to
have pre-treatment system for their wastewater, accompanied with proper monitoring of the industries
for compliance. Adherence to this law by industries would reduce the burden of treatment being
placed on WWTPs. The improvement in the operations and maintenance of municipal wastewater
and upgrading sewage treatment infrastructure, taking into account the complexity and recalcitrant
nature of the emerging pollutants from industrial wastewaters, is urgently needed in South Africa to
efficiently deal with the ever increasing demand of industrial development and associated wastewater.
Finally, there is also a need to establish total maximum daily loads (TMDLs) for the common pollutants
originating from the WWTPs to the Vaal river. According to EPA, TMDLs are critical to determine
wastewater pollutant reduction target (maximum amount of a pollutant allowed into waterbody)
and allocation of load reductions for WWTPs, that will ensure the receiving waterbody can meet
water quality standards for that particular pollutant [57,58]. In South Africa, only annual TMDLs
for phosphorus loadings to certain South African dams have been provisionally estimated [59,60],
indicating the need for TMDLs to control the discharge of pollutants by the various point sources such
as WWTPs.
4. Conclusions
In this study, it was evident that there is a correlation between the effluent from industries within
the Vaal River Catchment and the outflow from the Leeuwkuil WWTP, an indication that the industrial
effluent significantly influenced the quality of the WWTP outflow being discharged into the Vaal
River. Analysis of the results from the study indicate that the type of industry and activity undertaken
therein influence the pH and elemental composition of the effluent. The seasonal variation of all
parameters analysed for each sample location were not significant except for Zn and Al. It was also
established in the study that the Leeuwkuil WWTP could not treat the inflow of wastewater received to
acceptable quality, especially in lowering the concentration of Cu, Zn, Pb and BOD before discharging
it into the Vaal River. Findings from this study indicate that heavy metal content in the industrial
effluent contributed to the inefficiency of the WWTP. This is because (1) the current capacity of the
WWTP was unable to handle the influent pollutant load and (2) the very low BOD/COD ratios of the
influent—an indication of a high non-biodegradable content—could have influenced the biological
effluent treatment processes. Adequate pre-treatment of effluents by industries before discharge would
reduce the treatment burden and the cost involved as indicated in this study. A continuous monitoring
of the diverse industrial effluents and river quality in the study area would help to identify the major
contributing source of pollutants in the Vaal River. We therefore recommend continuous monitoring
and maintenance of the WWTPs infrastructure in the study area. Further studies involving an analysis
of heavy and trace metals in the sediment and pore-water sediment would help to understand the
level of eco-toxicological risk inherent in the area.
Supplementary Materials: The following are available online at http://www.mdpi.com/1660-4601/17/3/1096/s1,
Table S1: Variations of physico-chemical parameters (Mean ± SD) of industrial wastewater, Leeuwkuil WWTP
inflow and final effluents across different seasons. Table S2: Mean (±SD) elemental composition (mg/L) of different
industrial wastewater, Leeuwkuil WWTP inflow and final effluents samples (n = 27).
Author Contributions: Conceptualization, E.I., R.S. and O.O.O.; methodology, E.I. and R.S.; formal analysis, E.I.,
R.S. and H.J.O.O.; writing—original draft preparation, E.I.; writing—review and editing, R.S., O.O.O. and H.J.O.O.;
supervision, O.O.O. and R.S. All authors have read and agreed to the published version of the manuscript.Int. J. Environ. Res. Public Health 2020, 17, 1096 15 of 18
Funding: This research was funded by University of South Africa under the Emerging Researchers
Support Programme.
Conflicts of Interest: The authors declare no conflict of interest.
References
1. Meyer, A.M.; Klein, C.; Fünfrocken, E.; Kautenburger, R.; Beck, H.P. Real-time monitoring of water quality
to identify pollution pathways in small and middle scale rivers. Sci. Total Environ. 2019, 651, 2323–2333.
[CrossRef] [PubMed]
2. Kamika, I.; Momba, M.N.B. Assessing the resistance and bioremediation ability of selected bacterial and
protozoan species to heavy metals in metal-rich industrial wastewater. BMC Microbiol. 2013, 13, 28. [CrossRef]
[PubMed]
3. Chetty, S.; Pillay, L. Assessing the influence of human activities on river health: A case for two South African
rivers with differing pollutant sources. Environ. Monit. Assess. 2019, 191, 168. [CrossRef] [PubMed]
4. Ololade, O.O. Understanding the nexus between energy and water: A basis for human survival in South
Africa. Dev. S. Afr. 2018, 35, 194–209. [CrossRef]
5. Oruko, R.O.; Selvarajan, R.; Ogola, H.J.O.; Edokpayi, J.N.; Odiyo, J.O. Contemporary and future direction
of chromium tanning and management in sub Saharan Africa tanneries. Process Saf. Environ. Prot. 2019.
[CrossRef]
6. Collivignarelli, M.C.; Abbà, A.; Bestetti, M.; Crotti, B.M.; Carnevale Miino, M. Electrolytic Recovery of Nickel
and Copper from Acid Pickling Solutions Used to Treat Metal Surfaces. Water Air Soil Pollut. 2019, 230, 101.
[CrossRef]
7. Sorensen, J.P.R.; Lapworth, D.J.; Nkhuwa, D.C.W.; Stuart, M.E.; Gooddy, D.C.; Bell, R.A.; Chirwa, M.;
Kabika, J.; Liemisa, M.; Chibesa, M.; et al. Emerging contaminants in urban groundwater sources in Africa.
Water Res. 2015, 72, 51–63. [CrossRef]
8. Assress, H.A.; Nyoni, H.; Mamba, B.B.; Msagati, T.A.M. Target quantification of azole antifungals and
retrospective screening of other emerging pollutants in wastewater effluent using UHPLC –QTOF-MS.
Environ. Pollut. 2019, 253, 655–666. [CrossRef]
9. Rehman, K.; Fatima, F.; Waheed, I.; Akash, M.S.H. Prevalence of exposure of heavy metals and their impact
on health consequences. J. Cell. Biochem. 2018, 119, 157–184. [CrossRef]
10. Whitehead, P.; Bussi, G.; Hossain, M.A.; Dolk, M.; Das, P.; Comber, S.; Peters, R.; Charles, K.J.; Hope, R.;
Hossain, M.S. Restoring water quality in the polluted Turag-Tongi-Balu river system, Dhaka: Modelling
nutrient and total coliform intervention strategies. Sci. Total Environ. 2018, 631, 223–232. [CrossRef]
11. Sibanda, T.; Selvarajan, R.; Tekere, M. Urban effluent discharges as causes of public and environmental
health concerns in South Africa’s aquatic milieu. Environ. Sci. Pollut. Res. 2015, 22, 18301–18317. [CrossRef]
[PubMed]
12. Vareda, J.P.; Valente, A.J.M.; Durães, L. Assessment of heavy metal pollution from anthropogenic activities
and remediation strategies: A review. J. Environ. Manag. 2019, 246, 101–118. [CrossRef] [PubMed]
13. DWS. Directorate Water Resource Planning Systems: Water Quality Planning. Resource Directed Management of
Water Quality. Planning Level Review of Water Quality in South Africa. Sub-series No.WQP 2.0; Department of
Water Affairs: Pretoria, South Africa, 2011.
14. Chokwe, T.B.; Magubane, M.N.; Abafe, O.A.; Okonkwo, J.O.; Sibiya, I.V. Levels, distributions, and ecological
risk assessments of polybrominated diphenyl ethers and alternative flame retardants in river sediments from
Vaal River, South Africa. Environ. Sci. Pollut. Res. 2019, 26, 7156–7163. [CrossRef] [PubMed]
15. Morrison, G.; Fatoki, O.S.; Persson, L.; Ekberg, A. Assessment of the impact of point source pollution
from the Keiskammahoek Sewage Treatment Plant on the Keiskamma River-pH, electrical conductivity,
oxygen-demanding substance (COD) and nutrients. Water SA 2001, 27, 475–480. [CrossRef]
16. Momba, M.; Osode, A.; Sibewu, M. The impact of inadequate wastewater treatment on the receiving water
bodies–Case study: Buffalo City and Nkokonbe Municipalities of the Eastern Cape Province. Water SA 2006, 32.
[CrossRef]
17. Edokpayi, J.N.; Odiyo, J.O.; Durowoju, O.S. Impact of Wastewater on Surface Water Quality in Developing
Countries: A Case Study of South Africa; Water Quality INTECH: Vienna, Austria, 2017; pp. 401–416.You can also read