Northeast Business Park - Golf Course Demand - September 2007 - Department of State Development
←
→
Page content transcription
If your browser does not render page correctly, please read the page content below
Northeast Business
 Park - Golf Course
           Demand
          September 2007
Golf Course
Demand
Northeast Business
Park

Prepared for Northeast Business
Park Pty Ltd
292 Water Street
Spring Hill QLD 4000
August 2007
DISCLAIMER
This report is prepared on the instructions of the party to whom or which it is addressed and is thus not suitable for
use other than by that party. As the report involves future forecasts, it can be affected by a number of unforeseen
variables. It represents for the party to whom or which it is addressed the best estimates of Urbis Pty Ltd, but no
assurance is able to be given by Urbis Pty Ltd that the forecasts will be achieved.

URBIS STAFF RESPONSIBLE FOR THIS REPORT WERE:

Director                     Malcolm Aikman
Senior Consultant            Mark Courtney
Support Staff                JP Then
Job Code                     BPE0076
Report Number                B0701

© URBIS 2007

This publication is subject to copyright. Except as
permitted under the Copyright Act 1968, no part of it
may in any form or by any means (electronic, mechanical,
photocopying, recording or otherwise) be reproduced,
stored in a retrieval system or transmitted without prior
written permission. Enquiries should be addressed to the
publishers.

URBIS
Australia Asia Middle East
www.urbis.com.au
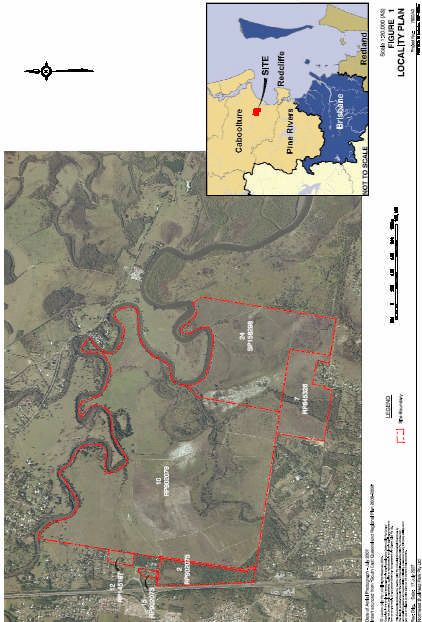
TABLE OF CONTENTS

Executive Summary ..................................................................................................................................i
    Introduction.........................................................................................................................................1
    Background and approach .................................................................................................................1
    Key findings ........................................................................................................................................2

1      Introduction.......................................................................................................................................1
       1.1   Proponent ................................................................................................................................1
       1.2   Project Description ..................................................................................................................1
       1.3   Project Location Description....................................................................................................2
       1.4   Project Area Description..........................................................................................................3
       1.5   Key Development Themes ......................................................................................................3
       1.6   Purpose ...................................................................................................................................4
       1.7   Approach .................................................................................................................................4
       1.8   Golf Course Viability ................................................................................................................4
       1.8.1 Key assumptions .....................................................................................................................5
       1.9   Proposed North East Business Park Golf Course...................................................................5

2      Demand Analysis .............................................................................................................................7
       2.1   Demand Drivers.......................................................................................................................7
       2.2   Population................................................................................................................................7
       2.2.1 A Macro Analysis.....................................................................................................................7
       2.2.2 Micro Analysis - Residential Development and Golf Membership ........................................10
       2.3   Tourist Visitation ....................................................................................................................11
       2.4   Other factors..........................................................................................................................14

3      Supply Analysis..............................................................................................................................15
       3.1   Brisbane Golf Market.............................................................................................................15
       3.2   The Local Region ..................................................................................................................15
       3.2.1 Caboolture Golf Course.........................................................................................................15
       3.2.2 Woodford Golf Course...........................................................................................................15
       3.3   Impact of Proposed Golf Course ...........................................................................................17
       3.4   Comparable Developments ...................................................................................................17
       3.4.1 Pacific Harbour ......................................................................................................................17
       3.4.2 North Lakes ...........................................................................................................................17
       3.4.3 Brookwater ............................................................................................................................17
       3.4.4 Sanctuary Cove .....................................................................................................................18

4      Demand Assessment .....................................................................................................................20
       4.1 Net Demand ..........................................................................................................................20
       4.2 Conclusion .............................................................................................................................22

APPENDICES: . .......................................................................................................................................23
   Appendix A        National Overview
   Appendix B        Values Statement

Rep-BPE0076-B0701A-13.09.07-Golf Course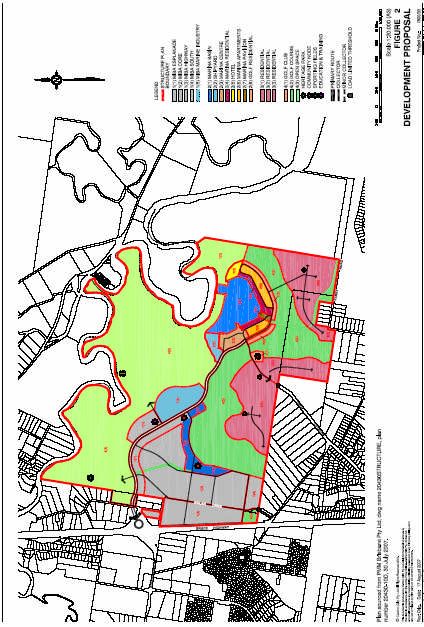
TABLE OF CONTENTS CONTINUED

Rep-BPE0076-B0701A-13.09.07-Golf Course
EXECUTIVE SUMMARY
Executive Summary
Introduction
Northeast Business Park Pty Ltd has requested Urbis to undertake a golf course assessment as part of
their development investigations.
The proponent for the development is Northeast Business Park Pty Ltd, a Queensland registered
company with shares held by the shareholders of Port Binnli Pty Ltd, Laing O’Rourke Caboolture
Developments Pty Ltd and a number of smaller shareholders.
Northeast Business Park (NEBP) is a multi-use marina and business park concept that will integrate
marina facilities, appropriate business, industry, commercial, residential, heritage and recreational
greenspace precincts providing a place to live, to work and to play in a master planned riverside
precinct on the Caboolture River.
Situated on the southern bank of the Caboolture River approximately 8km inland from the coastline,
adjacent to the Bruce Highway and 43km north of Brisbane CBD, the NEBP site encompasses 793
hectares of property which includes the following six land parcels (“the project area”).
Lot 2 on RP902075
Lot 10 on RP902079
Lot 24 on SP158298
Lot 7 on RP845326
Lot 15 on RP902073
Lot 12 on RP145197
The following components are incorporated into the NEBP development.
Marina basin.
Marine industry.
Industrial.
Commercial/mixed use.
Residential.
Apartments.
Townhouses.
Hotels.
Golf residential.
Environmental open space.
Golf course.
Recreational areas and sporting fields.
Heritage park.
Background and approach
This is a high level demand assessment for the golf course component of the Northeast Business Park
mixed use development. It draws on a range of data sources including the Australian Bureau of
Statistics Sport and Participation in Sports and Physical Recreation Activities publications and the
Australian Golf Union.
The approach to this demand assessment proceeds through a series of logical steps including the
following:
This introduction which includes a section on golf course viability and the proposed golf course
development;
Rep-BPE0076-B0701A-13.09.07-Golf Course Page iEXECUTIVE SUMMARY
A demand analysis which will incorporate sections on demand drivers, population, tourist visitation
and other factors;
A supply analysis including a high level overview of Brisbane, the local region and comparable
developments; and
The demand assessment which will calculate net demand by segment and estimate overall
demand.
Key findings
The demand assessment shows that the number of rounds is highly dependent upon the staging of
residential product. Hence, on the basis of the assumed 2011 commencement date of residential
product sales, it is considered the demand for rounds of golf at the proposed for the Northeast Business
Park will be sufficient to support viability from 2014.
The proposed golf course will contribute significantly to the amenity and attractiveness of the overall
Northeast Business Park development. It adds a further complimentary recreational dimension to the
other industrial, commercial, retail, and residential land uses.
In addition, given anticipated differences in price points and marketing approaches, the impacts of the
proposed golf course at Northeast Business Park on the existing courses at Caboolture and Woodford
are anticipated to be negligible. There is some prospect that the additional course may through the
creation of a golf node enhance the number of rounds played on the existing courses in the region.
Rep-BPE0076-B0701A-13.09.07-Golf Course Page iiINTRODUCTION
1 Introduction
Northeast Business Park Pty Ltd has requested Urbis to undertake a golf course assessment as part of
their development investigations.
1.1 Proponent
The proponent for the development is Northeast Business Park Pty Ltd, a Queensland registered
company with shares held by the shareholders of Port Binnli Pty Ltd, Laing O’Rourke Caboolture
Developments Pty Ltd and a number of smaller shareholders.
1.2 Project Description
Northeast Business Park (NEBP) is a multi-use marina and business park concept that will integrate
marina facilities, appropriate business, industry, commercial, residential, heritage and recreational
greenspace precincts providing a place to live, to work and to play in a master planned riverside
precinct on the Caboolture River.
The Northeast Business Park’s Values Statement together with diagrams which depict the locality and
the development proposal are provided in the Appendices.
Situated on the southern bank of the Caboolture River approximately 8km inland from the coastline,
adjacent to the Bruce Highway and 43km north of Brisbane CBD, the NEBP site encompasses 793
hectares of property which includes the following six land parcels (“the project area”).
Lot 2 on RP902075
Lot 10 on RP902079
Lot 24 on SP158298
Lot 7 on RP845326
Lot 15 on RP902073
Lot 12 on RP145197
The following components are incorporated into the NEBP development.
Marina basin.
Marine industry.
Industrial.
Commercial/mixed use.
Residential.
Apartments.
Townhouses.
Hotels.
Golf residential.
Environmental open space.
Golf course.
Recreational areas and sporting fields.
Heritage park.
Of the 793 hectares, 44% (350 ha) will be developed. The remaining area (443 ha) will be set aside for
open space, and active and passive recreational uses, including a heritage park. The project area is
located on 9 kilometres of river frontage which will provide public access to parts of the Caboolture
River.
Rep-BPE0076-B0701A-13.09.07-Golf Course Page 1INTRODUCTION
The development provides an integrated mixed-used business park and marine precinct which
combines land uses making the development more viable and sustainable. The business park will be
capable of attracting local, national and international businesses, incorporating clusters of mixed and
complementary industry and businesses, underpinned by a high quality residential development, and a
state of the art marina and marine industries precinct.
The development will provide an important community and business focus for Caboolture and help to
address a significant undersupply of marine facilities and associated uses. There is an identified lack of
marina berths within Queensland, Southeast Queensland and particularly the immediate area.
Major landform adjustments that will occur to establish the NEBP will involve excavation of the marina
basin to 3.5 metres below AHD. This will be undertaken using dry excavation techniques followed by
inundation of the marina area. Fill obtained from the excavation of the marina basin and additional cuts
within the property bounds will be used to raise ground levels within residential precincts to protect
against flooding and storm surge. Additional flooding mitigation strategies include channels (grass
managed) and diversion banks with no changes to flow velocities within the Caboolture River expected.
Following excavation of the marina basin, a lock will be established to connect the marina basin to the
Caboolture River. Some dredging of the Caboolture River will be required with dredging occurring within
the defined navigation channel.
The majority of the project area previously supported exotic pine plantations and was utilised for
forestry purposes, however it does contain some areas of ecological value, including remnant terrestrial
vegetation, marine vegetation, Caboolture River frontage and tidal creeks. Environmental
considerations incorporated into the design, construction and operation of the development to protect
environmentally sensitive areas within and surrounding the project area will be analysed as part of the
EIS process, with particular emphasis on marina design, construction and operation. Overall the
development will be designed, constructed and operated with a net benefit to the environment and
community through the implementation of sustainable development principles and practices.
Supporting infrastructure, such as wastewater, electricity, telecommunications and roads, associated
with the NEBP development will require upgrading and in some cases extensions to existing
infrastructure will be necessary. Proposed improvements to infrastructure include additional sewerage
and electricity provisions to be incorporated into NEBP and internal roads through the development to
service industrial and commercial precincts.
1.3 Project Location Description
The NEBP project area is vacant privately owned land that is bound:
to the north by 9km of Caboolture River frontage, with land on the opposite side of
the river being primarily rural and used for forestry activity;
to the west by the Bruce Highway, with land on the opposite side of Bruce Highway
developed with residential and open space areas; and
to the south and east by privately owned rural residential properties with lot sizes
ranging from 1-20 ha, bushland, open grassland areas and limited agricultural and
recreational land uses.
The project area is surrounded by areas of conservation significance as follows.
The Deception Bay Declared Fish Habitat area, which extends along the entire
length of the northern boundary, within the bounds of the Caboolture River. This
area is protected by the Fisheries Act 1995 due to the estuarine habitats that
support commercial and recreational fisheries in close proximity to developing
communities.
Rep-BPE0076-B0701A-13.09.07-Golf Course Page 2INTRODUCTION
The Habitat Protection Zone of the Moreton Bay Marine Park which is located
within the Caboolture River and begins at the mid-northern boundary of the site
then extends eastward along the Caboolture River. This area is protected by the
Marine Parks Act 2004 in order to:
(a) conserve significant habitats, cultural heritage and amenity values of the
marine park;
(b) maintain the productivity and diversity of the ecological communities that occur
within the marine park; and
(c) provide for reasonable public use and enjoyment of the zone consistent with
the conservation of the marine park.
The Moreton Bay RAMSAR wetlands which traverse the same area within the
Caboolture River as the Moreton Bay Marine Park. The Moreton Bay RAMSAR
wetlands are protected pursuant to international conventions as they are one of
only three extensive intertidal areas of seagrass, mangroves and saltmarsh on the
eastern coast of Australia that provide habitat for water birds.
South East Queensland Wader Bird Sites are mapped approximately 500m to the
east of the site. This area is protected via the JAMBA and CAMBA convention to
protect habitats of Migratory Birds.
1.4 Project Area Description
The NEBP project area is relatively flat ranging in elevation from 3m AHD at the northern boundary to a
knoll at 16.5m AHD towards the southern area of the site. Tidal levels of the Caboolture River, adjacent
to the site are approximately 1.34m AHD for Highest Astronomical Tide and 0.81m AHD for Mean High
Water Springs.
Raff Creek traverses the site and flows from the north east to the southwest boundary.
The site previously supported exotic pine plantations and was utilised for forestry purposes. As such,
with the exception of a 1.3 ha area of endangered remnant vegetation located at the south west corner
of the site, the majority of the site is devoid of native vegetation. The site is characterised by large
expanses of disturbed grassland, some scattered trees, Paperbark (Melaleuca quinquenervia)
communities, Eucalypt open forest and areas of marine vegetation which fringe the Caboolture River
and associated waterways and constructed drainage channels that are tidally influenced.
The northern parts of the project area are mapped under the Caboolture Shire Plan 2005-2026 as
containing the following areas of conservation significance.
Catchment Protection Areas for the Protection of Waterways and Declared Fish Habitat
Areas.
Ecological Corridors to strengthen and improve links between areas of state, regional,
local and other conservation significance and areas of conservation significance that may
be degraded.
Regional and State Conservation areas.
Scenic Amenity Areas in which development is to be regulated such that adverse impacts
on the scenic qualities of the area are minimised.
1.5 Key Development Themes
Rep-BPE0076-B0701A-13.09.07-Golf Course Page 3INTRODUCTION
The development will provide the Caboolture community with access to natural watercourses, bushland
and parklands whilst developing much needed marina berths and vessel maintenance facilities north of
the Brisbane River in an ecologically sustainable manner by:
commissioning technical studies to inform the design, construction and operation of the
development to minimise adverse impacts on surrounding environmentally sensitive
areas;
providing managed mooring and boat maintenance facilities;
restoring degraded river banks and wetlands;
rediscovering historic cultural elements and providing access to the public;
attracting tourism and multinational operators; and
satisfying government agendas for environmental rehabilitation, marine industry reform,
increased local employment, and balanced environmental, social and economic
objectives.
1.6 Purpose
Northeast Business Park Pty Ltd has requested Urbis to undertake a golf course demand assessment
as part of their requirements which assist their completion of an environmental impact assessment.
1.7 Approach
This is a high level demand assessment for the golf course component of the Northeast Business Park
mixed use development. It draws on a range of data sources including the Australian Bureau of
Statistics Sport and Participation in Sports and Physical Recreation Activities publications and the
Australian Golf Union.
It is noted that the success of a golf course is strongly related to the associated demand and supply
conditions, its positioning in the market and the quality of management.
The approach to this demand assessment proceeds through a series of logical steps including the
following:
This introduction which includes a section on golf course viability and the proposed golf course
development;
A demand analysis which will incorporate sections on demand drivers, population, tourist visitation
and other factors;
A supply analysis including a high level overview of Brisbane, the local region and comparable
developments; and
The demand assessment which will calculate net demand by segment and estimate overall
demand.
1.8 Golf Course Viability
This sub - section on golf course viability presents benchmarks developed through research into Urbis
databases and investigations with experienced golf industry professionals. While the assumptions for
golf course viability are not inconsistent with the operational parameters of the proposed golf course,
they are indicative of a typical golf course. It is noted that this is a high level generic assessment of the
viability of a typical golf course. Joining fees are assumed to be quarantined out of consideration for
other purposes including the paying down of development expenses. This approach should be
considered in the context of the current state of the Australian golf industry as outlined in the
appendices.
Rep-BPE0076-B0701A-13.09.07-Golf Course Page 4INTRODUCTION
1.8.1 Key assumptions
The viability of the golf course is predicated on the following key assumptions:
1. Annual Maintenance fees of $1.2 million;
2. Annual Administrative Expenses of $700,000;
3. Food and beverage operations perform at break even; and
4. The typical number of rounds required on an annual basis is assumed to be in the range of
30,000 to 36,000.
Using the above assumptions, total expenses and maintenance sum to $1,900,000. On a weekly basis,
this is approximately $36,500.
The number of rounds considered necessary to cover expenses on a weekly basis would be between
575 and 690.
At an average of these, (630 rounds) an average price per round required to cover expenses and
maintenance would be approximately $60.
Applying these commercial parameters to the proposed Northeast Business Park golf course provides
insights into the required performance measures.
Key variables for the proposed golf course include the number of members and visitors that the
proposed golf club is likely to attract. In addition, the average cost and the number of rounds would
need to be estimated.
1.9 Proposed North East Business Park Golf Course
According to the Vision prepared for the Northeast Business Park, the golf course will be designed as a
major recreational open space system for the site, providing opportunities to develop valuable frontage
for a range of residential and business park sites.
It is the intention of Northeast Business Park to establish a premium quality golf course, of a similar
standard to that of Brookwater, Sanctuary Cove, Pacific Pines and Pacific Harbour.
The golf course’s western or back nine holes will be integrated with the Raft Creek wetland reserve,
promoting the unique local character of the site.
Rep-BPE0076-B0701A-13.09.07-Golf Course Page 5INTRODUCTION Rep-BPE0076-B0701A-13.09.07-Golf Course Page 6
DEMAND ANALYSIS

2            Demand Analysis
The demand drivers include the set of factors which will support growth in the number of rounds played
at the proposed Northeast Business Park golf course.

2.1          Demand Drivers
Key drivers include population and tourist visitation. Other factors that drive demand which are more
qualitative are also considered.

2.2          Population
The following provides an analysis of the present and future demand for golf rounds by the application
of participation rates to population estimates over the period 2006 to 2026.

2.2.1        A Macro Analysis
The application of participation rates to the estimates of residential population of the Caboolture East
Statistical Local Area (SLA), Caboolture Local Government Area (LGA) and Brisbane Statistical District
(SD) provides an estimate of the total market for golf in those areas.
The following table presents the estimated resident population for those people aged 15 years and over
and the projections for these areas up until 2026. It should be noted that the proposed development is
situated in the Caboolture East SLA which is a part of Caboolture LGA, which inturn is a subset of
Brisbane SD.

      Northeast Business Park Golf Club Analysis                                                           Table 2.2.1
      Population forecasts 1991 - 2026 aged 15 years and over

                                                              Estimated Resident Population (aged 15 +)
                                            Actual                                     Forecast
      Area                                   2006                   2011        2016              2021     2026

      Caboolture (S) - East                 12,776                 14,425      16,118         17,984       19,528
      Caboolture (S)                       106,072                123,382     141,632         160,027     175,177
                                 1
      Cab - East % of LGA                   12.0%                  11.7%       11.4%          11.2%        11.1%
      Brisbane SD                         1,479,582              1,633,646    1,789,915      1,803,850    2,096,321

      LGA % of SD                            7.2%                   7.6%        7.9%              8.9%      8.4%

      1 Caboolture (S) - East SLA as a proportion of Caboolture (S) LGA.
      2 Caboolture (S) LGA as a proportion of Brisbane SD
      Source: Urbis

Although the estimated resident population for Caboolture East SLA increases from approximately
12,800 in 2006 to a projected 19,500 in 2026, the SLA’s share of the Caboolture LGA falls from 12.0%
to 11.1% over the same period. Caboolture Shire’s population is projected to rise from approximately
106,100 to 175,200 while its share of the Brisbane SD increases from 7.2% to 8.4% over the period.

Rep-BPE0076-B0701A-13.09.07-Golf Course                                                                                  Page 7
DEMAND ANALYSIS
In terms of participation rates, Queensland’s rate of 5.6% referred to in section 1.1 Golf Industry Review
is comparable to the National rate of 5.5%. The following table presents this rate.
Northeast Business Park Golf Club Analysis Table 2.2.1(B)
Golf Particapation rate 2005-06
Region Male % Female % Average %
QLD 8.8% 2.4% 5.6%
Australia 8.8% 2.2% 5.5%
Source: Participation in Sport and Recreation, ABS cat number 41770. Urbis
The number of golf games played by participants on a weekly basis varies. Data from the Australian
Sports Commission which is presented in the following table provides some keys insights which include;
75% of golfers play less than once per week;
35% play less than once per month;
25% play more than once per week; and
Only 7% play twice per week.
Northeast Business Park Golf Club Analysis
Table 2.2.1(C)
1
Golf Participation Rate 2003
Participation Avg rounds
Golf games per year rates % per week
1-6 19% 0.1
7-12 16% 0.2
13-26 17% 0.4
27-52 23% 0.8
53-104 18% 1.5
105+ 7% 2.0
1 Average rounds per week calculated as the midpoint score of golf games per year
Source: Australian Sports Commission 2003. Urbis
These participation rates can be applied to the estimate of the proportion of the population that plays
golf within the various regions. Hence, an estimate of number of rounds on an annual basis can be
determined. This is presented in the following table.
Rep-BPE0076-B0701A-13.09.07-Golf Course Page 8DEMAND ANALYSIS
Northeast Business Park Golf Club Analysis Table 2.2.1 (D)
1
Estimated Golf Participation per year per area 2006 - 2026
Forecast
2
Golf games per year 2006 2011 2016 2021 2026
1-6 136 153 171 191 208
7-12 114 129 144 161 175
13-26 122 137 153 171 186
27-52 165 186 208 232 252
53-104 129 145 162 181 197
105+ 50 57 63 70 77
Caboolture (S) - East 715 808 903 1,007 1,094
1-6 1,129 1,313 1,507 1,703 1,864
7-12 950 1,105 1,269 1,434 1,570
13-26 1,010 1,175 1,348 1,523 1,668
27-52 1,366 1,589 1,824 2,061 2,256
53-104 1,069 1,244 1,428 1,613 1,766
105+ 416 484 555 627 687
Caboolture (S) 5,940 6,909 7,931 8,962 9,810
1-6 15,743 17,382 19,045 19,193 22,305
7-12 13,257 14,637 16,038 16,162 18,783
13-26 14,086 15,552 17,040 17,173 19,957
27-52 19,057 21,041 23,054 23,234 27,001
53-104 14,914 16,467 18,042 18,183 21,131
105+ 5,800 6,404 7,016 7,071 8,218
Brisbane SD 82,857 91,484 100,235 101,016 117,394
1 Participation rate derived from the Queensland average rate
2 Golf games per year calculated from breakdown of participation rates per year
Source: Australian Sports Commission 2003, Urbis
By establishing the amount of golf played a year, an estimation of the amount of rounds played per
week for each area can be established. This is shown in the following table.
Rep-BPE0076-B0701A-13.09.07-Golf Course Page 9DEMAND ANALYSIS
Northeast Business Park Golf Club Analysis Table 2.2.1 (E)
Estimated Rounds Per Week1
Area 2006 2011 2016 2021 2026
Caboolture (S) - East 496 560 626 698 758
Caboolture (S) 4,120 4,792 5,501 6,215 6,804
Brisbane SD 57,466 63,450 69,519 70,060 81,419
1. Calculated using the average rounds per week of golf participants
Source : Urbis
Hence, it is estimated that in 2006, in the Caboolture East SLA there was demand for approximately
500 rounds of golf on a weekly basis. This is projected to increase to approximately 630 rounds over
the ten years to 2016 and to almost 760 by 2026. This is an average annual growth of 2.1% over the
twenty years from 2006 to 2026.
Similarly, for the Caboolture LGA, the total number of rounds was approximately 4,100 which increased
to 5,500 in 2016 and to over 6,800 by 2026. This is an average annual growth of 2.5% over the twenty
years from 2006 to 2026.
The number of golf rounds played by residents in Brisbane SD will increase from approximately 57,500
rounds per week to approximately 69,500 by 2016 and to approximately 81,400 by 2026. This is an
average annual growth of 1.8% over the twenty years from 2006 to 2026.
It is considered that 630 rounds per week, which is regarded as the average number rounds required
for the viability of a typical golf course, would represent a market share of approximately 1% of the total
rounds of golf played in Brisbane (SD) on a weekly basis over the period 2011-2021.
2.2.2 Micro Analysis - Residential Development and Golf Membership
The proportion of residents of the Northeast Business Park who elect to become members of the
course will be a variable which is dependant upon the relationship between the golf course and the
residential development. For instance, the design of the course will create a sense of certainty about of
the plan of the residential development. This certainty incorporated with the other attractors of the
development (the marina, the Caboolture River, the mix of industrial, commercial, retail employment
opportunities and recreational land uses) will combine to promote residential ownership. Additionally,
ownership of residential title can be linked to golf club membership. These types of relationships and
the standards of development are unique to each course and hence there is a range of proportions of
the number of residents who opt to become members. This varies from course to course from 15% to
50%. Our experience with these types of developments indicates that a benchmark of 30% is an
appropriate measure.
The master plan which at the time of preparation of this assessment suggests a total of 1,132 attached
dwellings will be included as part of the Northeast Business Park. These 1,132 attached dwellings are
comprised of 927 medium and low rise apartments, 85 water villas and 120 resort apartments. The
Urbis Attached Dwelling Demand estimates that this quantity will be taken up over a period of 13.6
years. Assuming that sales commence in 2112, this figure of 1,132 will be taken up by the year 2023.
Rep-BPE0076-B0701A-13.09.07-Golf Course Page 10DEMAND ANALYSIS
In addition, a total number of 1,272 residential lots are proposed according to the Northeast Business
Park Staging Plan provided Northeast Business Park. It is assumed that there would be a lag of
approximately one year between the purchase of the lots and occupation of the dwelling constructed
upon the lot.
The 30% benchmark can then be applied to the total number of dwellings. Assuming that an extra level
of membership would be derived from beyond the Northeast Business Park gives an additional level of
membership. This is estimated to be 10% of the membership derived from the residents of the
Northeast Business Park.
By 2013, it is estimated that there would be approximately 100 members at the proposed Northeast
Business Park. This is comprised mostly of members who are residents and a small number of
members who would come from beyond the residential development of the North East Business Park.
It is considered that membership would rise as the number of dwellings increase and the number of
members from beyond grows. It is considered that at some point a cap on membership will be
introduced. In the table below, this point occurs in 2019 at 515 members.
Northeast Business Park Table2.2.2
Golf Course Membership , 2008-2016
2008 2009 2010 2011 2012 2013 2014 2015 2016 2017 2018 2019 2020 2021 2022 2023 2024 2025
Total Attached Dwellings (apartments)0 0 0 0 36 76 126 181 248 317 407 525 667 824 940 1,033 1,093 1,154
Total Detached Dwellings (houses) 0 0 0 0 120 240 360 480 603 726 896 1,037 1,037 1,201 1,201 1,201 1,201 1,201
1
Total Dwellings 0 0 0 0 156 316 486 661 851 1,043 1,303 1,562 1,704 2,025 2,141 2,234 2,294 2,355
2
Number of resident members 0 0 0 0 47 95 146 198 255 313 391 469 511 608 642 670 688 707
(30% of residential dwellings)
Number of members from beyond 0 0 0 0 5 9 15 20 26 31 39 47 51 61 64 67 69 71
(10% of residential membership)
Total Members 0 0 0 0 51 104 160 218 281 344 430 515 515 515 515 515 515 515
1. Assumes dwellings arrive 12 months after the detached lots are supplied ie a 12 month lag
2. Members derived at the rate of 30% of all dwellings of the development
Source : Urbis
2.3 Tourist Visitation
This section provides an analysis of overnight (international and domestic) visitors and day trippers.
Investigations into tourism data sources show the total amount of day trippers and domestic and
international overnight visitors to Brisbane (SD) in the year ended march 2007 was approximately
263,300 per week. The following table shows projections of the total number of visitor numbers to 2026
using the appropriate industry based growth rates relevant to the type of visitor (Day Trip, Domestic
Overnight and International Overnight).
Rep-BPE0076-B0701A-13.09.07-Golf Course Page 11DEMAND ANALYSIS
Northeast Business Park Golf Club Analysis Table 2.3
Total Visitors to Brisbane and Sunshine Coast
Year Brisbane (SD1)
5 4
Day Trip Domestic International Total per Total per
3
(Domestic) Overnight Overnight year week
2
2007 8,162,000 4,610,000 919,884 13,691,884 263,305
2011 8,219,134 4,633,050 959,439 13,811,623 265,608
2016 8,276,668 4,656,215 1,000,695 13,933,578 267,953
2021 8,334,605 4,679,496 1,043,725 14,057,826 270,343
2026 8,392,947 4,702,894 1,088,605 14,184,446 272,778
1 Brisbane defined as Brisbane Statistical District containing 219 Statistical Local Areas (SLAs)
2 Actual Data Year ended March 2007, Tourism Queensland
3 Growth rate of 4.3% applied as forecasted by Tourism Forecasting Committee 2006
4 Growth rate of 0.5% applied as forecasted by Tourism Forecasting Committee 2006
5 Growth rate of 0.7% applied by average annual growth recorded from 2000 to 2005.
Source : National Visitor Survey, International Visitor Survey, TRA: Urbis
By applying the appropriate participation rates to the various categories of visitors, the number of
visitors that play golf can be derived. The following table presents these estimates of the number of
visitors that play golf in Brisbane on a weekly basis. These figures are also projected forward to 2026.
Rep-BPE0076-B0701A-13.09.07-Golf Course Page 12DEMAND ANALYSIS
Northeast Business Park Golf Club Analysis Table 2.3(B)
Annual Visitor projected golf participation rates5
Brisbane (SD1)
4 3
Day Trip Domestic International Total per Total per
2
(Domestic) Overnight Overnight year Week
2007 326,480 184,400 27,597 538,477 10,355
2011 328,765 185,322 28,783 542,871 10,440
2016 331,067 186,249 30,021 547,336 10,526
2021 333,384 187,180 31,312 551,876 10,613
2026 335,718 188,116 32,658 556,492 10,702
1 Brisbane defined as Brisbane Statistical District containing 219 Statistical Local Areas (SLAs)
2 Growth rate of 3% applied as calculated by Tourism Queensland Brisbane Visitor Survey 2004
3 Growth rate of 4% applied as calculated by Tourism Queensland Brisbane Visitor Survey 2004
4 Growth rate of 4% applied by average anaul growth recorded from 2000 to 2005.
5 Participation rates of 4% for domestic, 3% for international visitors from the Brisbane Visitor Survey 2004.
Source : National Visitor Survey, International Visitor Survey, Tourism Research Australi; Urbis
The above table shows that in any given week, there are currently approximately 10,400 visitors to
Brisbane who play golf. It is considered that visitors to Brisbane who choose to play golf would do so
predominantly at Brisbane’s better golf courses.
For the purpose of this analysis it is assumed that the 10,400 visitors would play only one round during
that week. In reality, it is likely that they would play at least once. Hence, our estimate that visitors to
Brisbane, during any average week, would play approximately 10,400 rounds of golf may be regarded
as conservative.
It also considered that these 10,400 rounds would be spread over the set of higher quality clubs in
Brisbane and its immediate surrounds which fit in to the $80 to $120 per round and include North
Lakes, Pacific Harbour Royal Queensland, Brookwater, Brisbane and Indooroopilly. It is pointed out
that some of these courses only permit members and member’s guests to play. Other clubs in a lower
price range may also be considered as potentially attracting golf playing visitors. Such clubs would
include Pacific, Keperra, Victoria Park, Nudgee, Redcliffe and Caboolture.
A market share approach has been adopted to determine the number of rounds that visitors would play
at the proposed Northeast Business Park golf course. To estimate a visitor market share the following
important factors are considered:
the existing competition considered above;
the level of attraction that the proposed course will offer in terms of quality of design and proximity
to other courses (North Lakes and Pacific Harbour);
price point in relation to competition; and
Rep-BPE0076-B0701A-13.09.07-Golf Course Page 13DEMAND ANALYSIS ancillary and other related facilities offered as part of the “golf experience”. An exact market share estimate is beyond the scope of this study. However, it is considered that approximately a range of 2% to 4% of all visitors to the Brisbane area who will play a round of golf will do so at the proposed Northeast Business Park golf course. It is considered that this rate will be closer to 2% in 2011 and that this market share will rise to 3% by time the course is more established from 2013. This rate will represent about 4% or approximately 420 rounds per week by 2015-2106. 2.4 Other factors There may be some benefit derived from the location of the proposed golf course. This relates to the potential for a golf hub or node concept which would be facilitated by the location of the proposed course which is situated between two of the better golf courses located to Brisbane’s north, Pacific Harbour and North Lakes. However, it is an important point that given the competitive nature of the golf club industry, and the current broader national environment of declining membership and participation, that there exists a strong imperative to adopt sustainable business practices for the viability of the proposed golf course. This is considered to incorporate appropriate price points for visitor rounds and practices such as the selling of membership packages to support commercially viable capital and recurrent revenue targets which would more than offset corresponding expenses and liabilities. Rep-BPE0076-B0701A-13.09.07-Golf Course Page 14
SUPPLY ANALYSIS

3            Supply Analysis
To determine the demand for the proposed Northeast Business Park golf course it is necessary to
consider the existing supply within the study area.

3.1          Brisbane Golf Market
There exists a variety of quality and a range of green fees within the greater Brisbane golf course
market. Some of the higher quality and more prominent courses include Royal Queensland, Brisbane
and Indooroopilly and Brookwater (note that Brookwater is located in the Ipswich LGA).

3.2          The Local Region
The Caboolture, Woodford, Pacific Harbour and North Lakes Golf Courses are those clubs in closest
proximity to the proposed Northeast Business Park golf course (see the following map).

3.2.1        Caboolture Golf Course
The Caboolture golf course has a membership of approximately 500 people, with membership fees of
$635 per year and a joining fee of $300. It is however not considered to be comparable with the
proposed Northeast Business Park golf course. In terms of the price of a round of golf the Caboolture
course ranges from $12.50 mid week to $25.00 on weekends with cart hire at $32.00.

3.2.2        Woodford Golf Course
Similarly, Woodford Golf course which is located approximately 25 minutes drive time from Caboolture
is not considered as being comparable. Membership fees are $75 to $385 and the price of a round
ranges from $23 mid-week to $28 on weekends. There are currently approximately 800 members at the
Woodford Golf Club.

Rep-BPE0076-B0701A-13.09.07-Golf Course                                                                 Page 15
SUPPLY ANALYSIS

Rep-BPE0076-B0701A-13.09.07-Golf Course   Page 16
SUPPLY ANALYSIS

3.3          Impact of Proposed Golf Course
Although the proposed golf course would be open to all players, it is expected to target different
segments of the broad golfing market compared to those market segments targeted by Woodford and
Caboolture courses. Given these differences in price points and marketing approaches, the impact of
the proposed golf course at Northeast Business Park upon the courses at Caboolture and Woodford is
anticipated to be negligible. There is some prospect that the additional course may through the creation
of a golf node enhance the number of rounds played on the existing courses in the region.

3.4          Comparable Developments
Of the three courses referred to above, Pacific Harbour and North Lakes golf courses are considered as
being the most comparable to the proposed course. This is largely to do with their relatively close
proximity to the North East Business Park and their inclusion as part of a residential master planned
community. It is envisaged that the proposed Northeast Business Park will share similarities with North
Lakes and Pacific Harbour in regards to the cost of a round, the quality of the course, its location and its
relationship to residential development. In addition, it is considered that the style of membership offered
by the proposed club will reflect that of North lakes and Pacific Harbour.

3.4.1        Pacific Harbour
There are approximately 170 members who have fully transferable club membership. This is valued at
$8,250 and currently is on offer at a 10% discount ($7,500). This offers membership a suite of services
including gym membership and access to other services. Members pay an additional $1,690 per annum
as an annual membership fee which can be paid on a weekly basis of $32.50. There are other levels of
membership and in total there are approximately 250 members.
Visitors pay $75 per round on week days and $85 on weekends for green fees.

3.4.2        North Lakes
North lakes Golf Club has approximately 100 members. Membership costs $2,200 per person per
annum and there is a $500 joining fee. Designed by renowned Australian golfer Graham Marsh, the
North Lakes Resort Golf Club layout is a 6,455 metre par 72 Championship resort course. Considered
one of the best new courses in Australia, North Lakes was opened for play in 2002. It is set amongst
North Lakes' residential estate and features 18 holes of championship golf with 4 sets of tees for
players of all abilities. It features a gently rolling terrain. It is notable that the golf course was built before
the development was finished. Golf frontage lots are still being offered to the market.
Visitors pay $90 per round on week days and weekends.
In 1998 the Pine Rivers Shire Council approved the development of the site. In November 1999, Lake
Eden was completed and the development on the first residential precinct commenced. In April 2000,
North Lakes was officially opened. In April 2001, the first commercial sites were offered for sale and in
June 2001 the Golf course was approved and construction started.

3.4.3        Brookwater
Brookwater is the first championship course to be developed in the Brisbane area for the past thirty
years. Currently rated as one of Australia’s and Queensland’s better golf courses, the par 72 layout
comprises two nine-hole loops and measures 6,505m. It is a tournament standard layout which is fully
integrated with the residential development. Brookwater Golf Club is managed by Troon Golf, an
international golf course management company.
Visitors pay $110 to $130 for a round.
Membership is only provided to residents of Brookwater. Currently, there are only 100 members of the
Brookwater course.

Rep-BPE0076-B0701A-13.09.07-Golf Course                                                                           Page 17
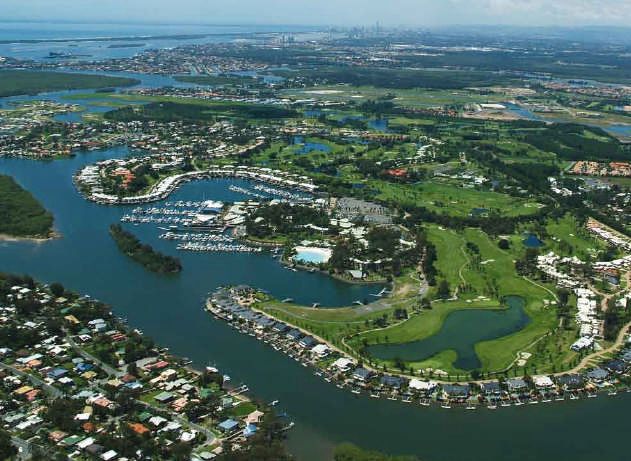
SUPPLY ANALYSIS

3.4.4        Sanctuary Cove
Sanctuary Cove’s golf courses are not located in the study area however they represent qualities in
design and overall standard which would be consistent with the proposed course at the Northeast
Business Park. Sanctuary Cove is located at the Gold Coast and features two courses, the Pines and
the Palms.
The Palms Golf Course is an award winning course set around century-old groves of cabbage palms.
Considered one of the leading resort courses in Queensland, the 5,833 metre course has a par of 71
and a course rating of 70. The Palms Golf Course provides a high level of enjoyment and challenge to
all golfers. Golf course architect Ross Watson has developed a Palms Golf Course masterplan under
which The Palms Golf Course is to be upgraded and remodelled in three stages with stage one to
commence this year.
The Pines is the only Arnold Palmer signature course in Australia and is rated by the Australian Golf
Union as one of the nation's most challenging courses. With an AGU rating of 76, the course has been
home to two SKINS tournaments. Set within 100 hectares of established pine forest, the course
features corridor approaches to several holes, with lakes guarding others. Fourteen of the holes are
designed around six man-made lakes. An abundance of wildlife features on The Pines including rare
birdlife and kangaroos. As an indication of the quality of the Pines, leading golfers to have played the
course include Adam Scott, John Daly, Laura Davies, Tom Watson and Peter Senior.
The 6,681metre course is exclusive to Sanctuary Cove Country Club members and Hyatt Regency
Sanctuary Cove hotel guests
The current price for a round on the Palms is $97 while the Pines is $160. Currently there are 1,135
members and this is considered to be capped at around 1,750 members.
The new layout will create an improved golfing experience for all levels of player. New playing surfaces
will be delivered on all tees, greens and fairways as each stage progresses, lifting course presentation
and consistency. According to the January 2007 prospectus which was fully subscribed, present
membership joining fees range from $28,000 to $37,000 with annual membership subscription at
around $3,700 per single equity member and $5,225 for equity membership with family status.
Corporate Access is also available at the rate of $30,000 for three persons per annum.
A new future release is being considered for early 2008 with a new membership fee anticipated to be in
the order of $45,000 per single equity member.
Aerial View of Sanctuary Cove with the Pines and the Palms Golf Courses.

Rep-BPE0076-B0701A-13.09.07-Golf Course                                                                    Page 18
SUPPLY ANALYSIS

(Source: Sanctuary Cove Golf and Country Club Holdings Prospectus January 2007)

Rep-BPE0076-B0701A-13.09.07-Golf Course                                           Page 19
DEMAND ASSESSMENT

4            Demand Assessment
This section provides the demand assessment for the proposed Northeast Business Park.

4.1          Net Demand
By incorporating the demand for membership from Section 2.2 and applying the assumptions regarding
golf course viability presented in Section 1.2, it is possible to determine a net demand for the proposed
golf course at the Northeast Business Park. The total number of visitors is arrived at by adopting a
market share approach as presented in Section 2.3.
The appropriate member’s rate of $37.50 per round and the visitor’s rate of $85.00, which were arrived
at on the basis of positioning the proposed golf course using Pacific Harbour and North Lakes' rates as
benchmarks can be applied to the estimated number of weekly rounds by members and visitors. In
addition, revenue form joining fees are now included as part of the revenue for the proposed golf
course. These are calculated on the basis of being levied at $5,000 per member, annualised over
twenty years and converted into a weekly figure. Hence, the demand assessment presented in the
following table shows that the total number of weekly rounds demanded increase from approximately
100 in 2008 to approximately 530 by 2014.
The table overleaf shows that prior to 2014, expenditures exceed revenues. It is not until 2014 that the
viability is demonstrated. In that year, the total number of weekly rounds of golf is approximately 530
which is comprised of 160 members’ rounds and 370 visitor’s rounds.
In the outer years, it is considered that membership will level off. In the above table this is considered to
occur at 2019 at a membership level of approximately 515. It is also considered that visitation will
continue to increase to a certain point beyond which growth will be constrained and visitor numbers will
level off. This is also expected to occur at the same time as the membership levels off.

Rep-BPE0076-B0701A-13.09.07-Golf Course                                                                     Page 20
DEMAND ASSESSMENT

            Northeast Business Park                                                                                                                                                                                                   Table 4.1
            Golf Demand by Weekly Rounds, 2008-2016

                                                      2008       2009        2010       2011       2012       2013       2014      2015      2016      2017      2018      2019      2020      2021      2022      2023      2024       2025

            Total Attached Dwellings                    0          0           0          0         36          76        126      181       248       317       407       525       667       824       940       1,033     1,093      1,154
            Total Detached Dwellings                    0          0           0          0         120        240        360      480       603       726       896       1,037     1,037      1,201    1,201     1,201     1,201      1,201
            Total Dwellings7                            0          0           0          0         156        316        486      661       851       1,043     1,303     1,562     1,704     2,025     2,141     2,234     2,294      2,355
            Number of resident members1                 0          0           0          0         47          95        146      198       255       313       391       469       511       608       642       670       688         707
            (30% of residential dwellings)

            Number of members from beyond               0          0           0          0          5          9          15       20        26        31        39        47        51        61        64        67        69         71
            (10% of residential membership)
            Total Members                               0          0           0          0         51         104        160      218       281       344       430       515       515       515       515       515       515         515
            Total Visitors2                           103         155        183         209        262        314        368      420       421       314       368       420       421       421       421       421       421         421
            Total Rounds 3                            103         155        183         209        313        419        528      638       702       659       797       936       936       936       936       936       936         936

            Weekly Revenue
            Members Rounds4 @ $37.5                    $0          $0         $0         $0       $1,931     $3,911     $6,014    $8,180    $10,531   $12,907   $16,125   $19,330   $19,313   $19,313   $19,313   $19,313   $19,313    $19,313
            Visitor Rounds5 @ $85                    $8,793     $13,203    $15,530    $17,748    $22,228     $26,724    $31,238   $35,717   $35,788   $26,724   $31,238   $35,717   $35,788   $35,788   $35,785   $35,785   $35,785    $35,785
            Membership Joining fees6                   $0          $0         $0         $0        $248       $501       $771     $1,049    $1,350    $1,655    $2,067    $2,478    $2,476    $2,476    $2,476    $2,476    $2,476     $2,476
            Total Revenue                            $8,793     $13,203    $15,530    $17,748    $24,406     $31,136    $38,023   $44,946   $47,670   $41,286   $49,429   $57,525   $57,577   $57,577   $57,573   $57,573   $57,573    $57,573
            Weekly Expenditure                      $36,500     $36,500    $36,500    $36,500    $36,500     $36,500    $36,500   $36,500   $36,500   $36,500   $36,500   $36,500   $36,500   $36,500   $36,500   $36,500   $36,500    $36,500
            Revenue less Expenses                   -$27,707 -$23,297 -$20,971 -$18,752 -$12,095             -$5,364    $1,523    $8,446    $11,170   $4,786    $12,929   $21,025   $21,077   $21,077   $21,073   $21,073   $21,073    $21,073

            1. Members derived at the rate of 30% of all dwellings of the development
            2. Visitors derived from the application of maket share 1% in 2007 of total visistor numbers rising to 4% by 2015
            3. Assumes members and vistors lpay one round per week
            4. Assumes membership of $1,950 divided by one round per week
            5. Assumes round of golf a the mid point in the prices between Pacific Harbour ($80) and North Lakes ($90)
            6.Membership Joining Fee estimated at $5000 annualised over twenty years
            7. Assumes dwellings arrive 12 months after the lots are supplied ie a 12 month lag
            Source : Urbis

Rep-BPE0076-B0701A-13.09.07-Golf Course                                                                                                                                                                                                           Page 21
DEMAND ASSESSMENT 4.2 Conclusion The demand assessment shows that the number of rounds is highly dependent upon the staging of residential product. Hence, on the basis of the assumed 2011 commencement date of residential product sales, it is considered the demand for rounds of golf at the proposed for the Northeast Business Park will be sufficient to support viability from 2014. The proposed golf course will contribute significantly to the amenity and attractiveness of the overall Northeast Business Park development. It adds a further complimentary recreational dimension to the other industrial, commercial, retail, and residential land uses. In addition, given anticipated differences in price points and marketing approaches, the impacts of the proposed golf course at Northeast Business Park on the existing courses at Caboolture and Woodford are anticipated to be negligible. There is some prospect that the additional course may through the creation of a golf node enhance the number of rounds played on the existing courses in the region. Rep-BPE0076-B0701A-13.09.07-Golf Course Page 22
Appendix A National Overview

Rep-BPE0076-B0701A-13.09.07-Golf Course   Page 23
A.1 National Overview.
Although golf remains a very popular sport and recreational activity, participation and
membership are both down from the highs recorded in the late 1990's.
Declining Participation
The ABS undertakes regular surveys of Australian’s participation in Sport (ABS, Participation in
Sport and Physical Activities). Over the past few years there has been a decline in the
participation in golf down from a peak in 1999 of 1.3 million participants.
The Australian Bureau of Statistics’ publication Participation in Sport and Physical Recreation
(ABS Cat. No 4177.0) shows that in 2005-06 this decline has continued and that there were
875,500 or 5.5% of Australians aged 15 years and over who participated in golf in the 12 months
prior to interview. Almost four times as many males (695,600) as females (179,900) played golf in
the same period.
In Queensland there were 134,800 males (8.8%) and 36,700 females (2.4%) and 171, 500
people (5.6%) in total who participated in golf in the 12 months prior to interview. Other
observations include;
New South Wales and Victoria recorded the highest number of participants (277,000 or 5.2%
and 236,900 or 5.9% respectively);
Those aged 55–64 years had the highest participation rate (9%) and the highest number of
participants (190,100);
More than half (54%) of people who played golf in the 12 months prior to interview
participated only in a non-organised capacity while 26% of golfers were involved only as
participants through a club or association; and
Of the 875,500 people aged 15 years or over who played golf, 61% (535,900) participated 53
times or more, 16% (137,000) for 27 to 52 times, 13% (117,700) for 1 to 12 times and 10%
(85,000) for 13 to 26 times.
Declining Membership
This decline in participation has been mirrored by the decline in registered golf club members.
The Australian Golf Union (AGU) collects statistics on AGU members across all states and
territories. Member numbers have declined across Australia in recent years to 454,800 members
(2005) from a peak of over 500,000 in 1998. This decline has occurred across all Australian
states and territories except Victoria and Western Australia where numbers have stayed relatively
stable.
However, golf remains a popular sport and physical recreation activity. In Queensland in 2005-06,
its participation rate of (5.6% and 171,500 participants) placed it fifth out of the thirty activities
identified by the Participation in Sport and Physical Recreation publication. The four activities
which recorded higher numbers of participants included walking for exercise (785,000 or 25.5%),
aerobics/fitness (416,500 or 13.5%), swimming (285,800 or 9.3%) and cycling at (183,300 or
5.9%).
According to Australian Golf Union data compiled in 2004, of the three major golfing states (NSW,
Vic, Qld), NSW (17,641) had the highest proportion of persons per club/course with Queensland
next (15,059) compared with Victoria with the lowest proportion of persons per club/course
(13,482). However, in terms of members per course, Queensland is at the lowest end (311) while
NSW (482) is at the high end followed by Victoria (347).
Rep-BPE0076-B0701A-13.09.07-Golf Course Page 24You can also read