ESR
FY2020 Results Presentation

26 March 2021
←
→
Page content transcription
If your browser does not render page correctly, please read the page content below
ESR FY2020 Results Presentation 26 March 2021
Disclaimer
The presentation may contain projections and forward-looking statements that reflect the Company’s current views with respect
to future events and financial performance and are subject to certain risks, uncertainties and assumptions. In some cases,
these forward-looking statements can be identified by the use of forward-looking terminology, including the terms “believe”,
“continue”, “could”, “estimate”, “forecast”, “plan”, “prepare”, “project”, “anticipate”, “expect”, “intend”, “may”, “will” or “should” or,
in each case, their negative or other variations or comparable terminology, or by discussions of strategy, plans, objectives,
goals, future events or intentions. These forward-looking statements include all matters that are not historical facts. By their
nature, forward-looking statements involve known and unknown risk and uncertainty because they relate to future events and
circumstances. Forward-looking statements are not guarantees of future performance and involve risks and uncertainties, and
actual results may differ materially from those in the forward-looking statements as a result of various factors and assumptions,
many of which are beyond the Company’s control. Prospective investors are cautioned not to rely on such forward-looking
statements. Neither the Company nor any of its affiliates, advisors, representatives or underwriters has any obligation to, nor do
any of them undertake to, revise or update the forward-looking statements contained in this presentation to reflect future events
or circumstances, except where they would be required to do so under applicable law.

This presentation material includes measures of financial performance which are not a measure of financial performance under
International Financial Reporting Standards (“IFRS”), such as Adjusted EBITDA and Adjusted Net Profit. These measures are
presented because the Company believes they are useful measures to determine the Company's financial condition and
historical ability to provide investment returns. Adjusted EBITDA and Adjusted Net Profit and any other measures of financial
performance in this presentation material should not be considered as an alternative to cash flows from operating activities, a
measure of liquidity or an alternative to net profit or indicators of the Company's operating performance on any other measure
of performance derived in accordance with IFRS. Because Adjusted EBITDA and Adjusted Net Profit are not IFRS measures,
Adjusted EBITDA and Adjusted Net Profit may not be comparable to similarly titled measures presented by other companies.

Data or information compiled by JLL has been reproduced in this presentation. While the ESR has taken reasonable care to
ensure that any data compiled by JLL and used in this presentation has been accurately reproduced, such data has not been
independently verified by the ESR, and JLL does not accept any liability in negligence or otherwise for any loss or damage
suffered by any party resulting from reliance on the information herein contained.

                                                                                                                                     1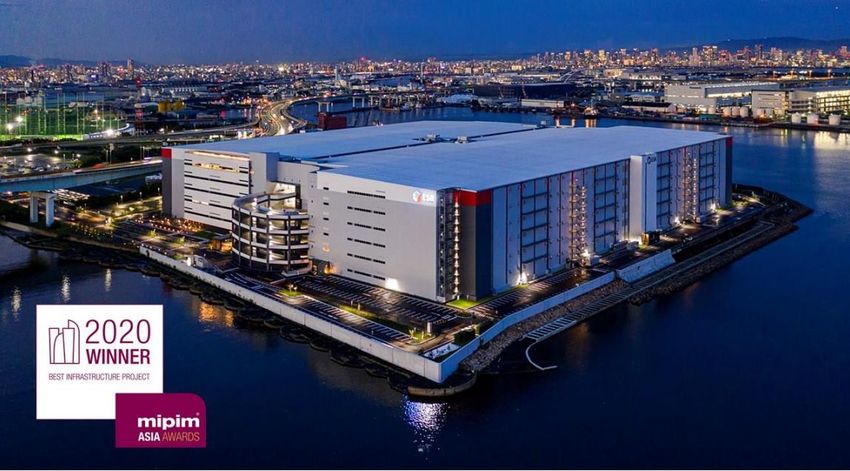
Contents
• FY2020 Key Highlights

• FY2020 Financial Highlights

• Industry Update

• New Growth Area: Data Centres

• FY2020 Operations Overview

• FY2020 Financial Overview

• Outlook

• Appendix

                                  2
FY2020 Key Highlights
ESR’s record achievements in FY2020:
▪ AUM grew by 35.3% to an all-time high of US$30 billion
▪ Record capital raising with seven new funds raising US$3.5 billion
▪ Record leasing of over 2.3 million sqm
▪ Record new completions of US$3.4 billion and record new development starts of
US$3.2 billion
▪ PATMI up 16.8% to a record high of US$286 million
▪ Strong balance sheet with US$1.5 billion in cash and net debt/total assets of 23.2%
Capital Management Quality Portfolio Capital Markets ESG Roadmap
• Robust cash position • Healthy portfolio • ESR Cayman became • Launched Five-year
of US$1.5 billion and occupancy of 90% a constituent of MSCI ESG Roadmap
balance sheet strength Hong Kong, Hang aligned with the UN
• Commenced US$3.2 Seng Composite Sustainable
• Well-diversified debt billion worth of Index and joined the Development Goals in
profile with improved projects and Work In Stock Connect Nov 2020
gearing ratio of 23.2% Progress grew 21%
y-o-y to US$4.7 billion • Successfully raised • Named ‘Sector Leader
• Recycled close to US$650 million with in Asia’ in GRESB
US$1 billion of capital • Completed US$3.4 listing of ESR Kendall 2020 rankings
from assets on balance billion of Square REIT on KRX
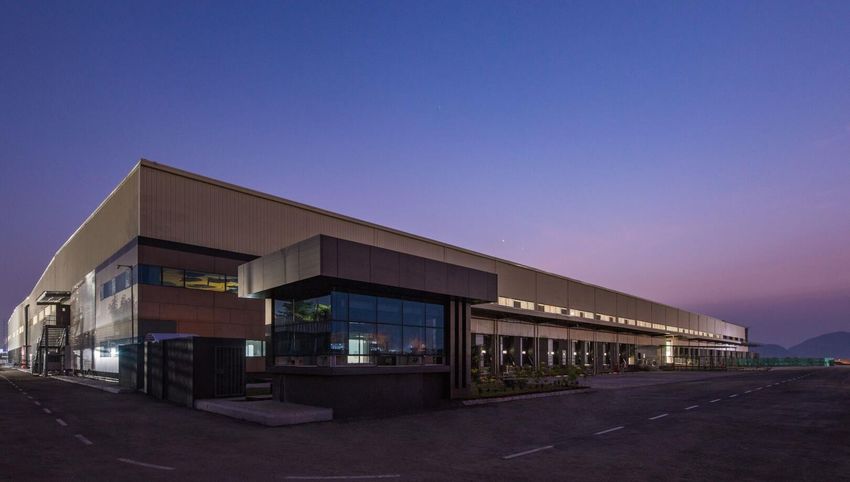
sheet to ESR managed developments KOSPI in Dec 2020 • MIPIM Asia Awards
funds 2020, Best
Infrastructure,
• Weighted average Community & Civic
interest cost was 4.6% Building (Gold Award)
3
as of 31 Dec 2020 - ESR Amagasaki DC
FY2020 Financial Highlights

    Total Segmental                                              Total                                                 Core
                   +4.7%                                                                         +16.8%                         +14.7%
    EBITDA                                                       PATMI                                                 PATMI1

  US$663m                                                     US$286m                                                  US$260m
    Total                                                        Net Debt/
    AUM                              +35.3%                      Total Assets
                                                                                                  -3.4pp               Cash     +71.4%

  US$29.9b                                                     23.2%                                                   US$1.5b
  ▪ Strong operating performance continues through COVID-19 through key business
    segments

  ▪ Further cemented market leading position and achieved AUM of US$30 billion
    well-ahead of end-2021 target

  ▪ Disciplined capital management with strong cash position, diversified and lower cost
    funding and improved gearing ratio

  ▪ Well-positioned to capture future acquisition and investment opportunities

Note:
(1)     Excludes fair value on completed investment properties, pre-IPO ESOP expenses and tax effects of adjustments                     4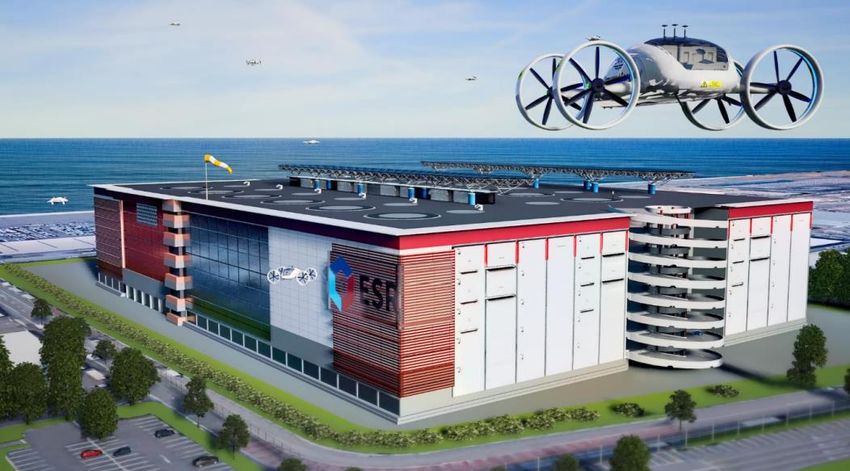
Section 1                        Industry Update

  Kunshan Friend Park I, China

                                              5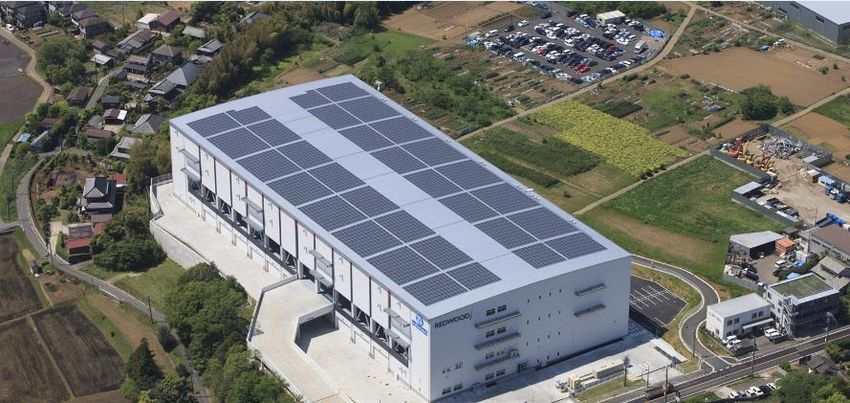
APAC Logistics – Largest Secular Growth Opportunity
In Asia

                                                                    Superior Risk /
                       Manufacturers and
E-commerce adoption                         Paradigm Shift in   Reward Proposition of
                       Retailers Adapting
  continues to grow                         Capital Flows For   Logistics to Drive Cap
                       Supply Chains to
   post COVID-19                            Region and Sector   Rate Compression and
                      COVID-19 Challenges
                                                                 Capital Value Growth

    ESR has and will continue to uniquely leverage the largest secular trends to
            further solidify its market leading position in Asia Pacific

                                                                                         6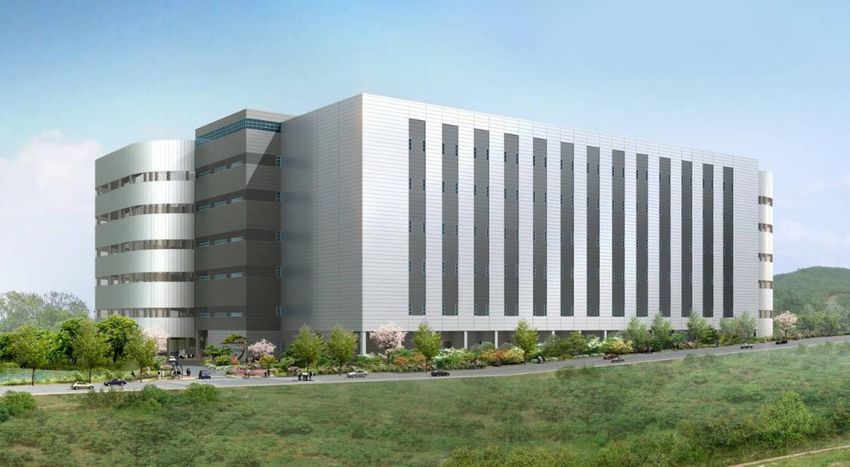
Post COVID-19, APAC Logistics Market Growth Continues
To Be Underpinned By E-commerce Across The Region
 E-commerce penetration across Asia
    1    The PRC                                                                2   South Korea
              40.4%        40.4%                                                         38.2%    39.4%
                                                                                35.8%
     27.3%

     2020         2024E    2024E                                                2020     2024E    2024E
                  before    after                                                        before    after
                  COVID    COVID                                                         COVID    COVID
     4    India
                           11.2%                                                3   Japan
                  8.5%                                                                            12.7%
                                                                                         11.6%
     6.5%                                                                       10.4%

     2020         2024E    2024E                                                2020     2024E    2024E
                  before    after                                                        before    after
                  COVID    COVID                                                         COVID    COVID
    5    Singapore                     7    Indonesia                           6   Australia
                                                        33.5%
                           17.5%                                                         14.0%    15.0%
     15.6%        14.5%                    19.9%                                12.5%

     2020         2024E    2024E           2020         2024E                   2020     2024E    2024E
                  before    after                                                        before    after
                  COVID    COVID                                                         COVID    COVID

                             Increasing e-commerce penetration will continue to
                           support long-term demand for modern logistics facilities
 Source: Euromonitor                                                                                       7
E-Commerce Accelerated During COVID-19 And It Is
 Here To Stay
Higher frequency for e-commerce platform                                                       Average spending per order continued to
over the past 12 months(1)                                                                     Increase(2)
Shopping frequency for e-commerce platforms per year                                           Average spending per order on the platform (RMB)

            Mogujie                    20                                                               Pinduoduo                            177
                                                 30                                                                                          177
            Vipshop                              31                                                        Mogujie                                   249
                                                   34                                                                                              221
       Xiaohongshu                                32                                                   Xiaohongshu                                     270
                                                   34                                                                                                 257
Tmall Global/ Kaola                         25                                                             Vipshop                                           316
                                                        44                                                                                                      353
                  JD                                    43                                     Tmall Global/ Kaola                                           317
                                                          49                                                                                                      375
         Pinduoduo                                       46                                         Taobao/ Tmall                                                362
                                                            51                                                                                                       406
     Taobao/ Tmall                                                                 84                             JD                                                   425
                                                                                         95                                                                                                 571
                       0          20               40          60           80           100                           0        100      200          300           400          500     600
                                            2019        2020                                                                            2019           2020
 Source: Euromonitor                                                                           Source: Euromonitor

Low online retail penetration in Chinese fresh                                                 Chinese fresh food online retailing is
food relative to other categories                                                              expanding at a CAGR of 49% over 2014-19
Online penetration by categories (2019)                                                        China - food retail sales by distribution channel
     Toys and games                                                                     72%    100%          1              2            3              4                  5            6
Consumer Electronics                                                46%
     Small Appliances                                               46%                         80%
     Major Appliances                                  39%                                                   62            61            60             59                57
                                                                                                60%                                                                                    56
  Apparel & Footwear                                34%
Beauty a& Personal…                               30%
    Consumer Health                                                                             40%
                                                26%
  Tissue and Hygiene                          22%
                                                                                                20%          35            35            36             36                36           36
          Home Care                          20%
      Packaged Food                   11%
                                                                                                  0%
          Fresh Food            6%
                                                                                                           2014            2015        2016            2017               2018         2019
                           0%   10%    20%        30%    40%     50%      60%    70%     80%       Hyper/ Supermarket        Traditional grocery retailers         Online retailing    Others
 Source: Euromonitor                                                                           Source: Euromonitor

Notes:
(1) 2019 does not include Tmall Global
(2) All respondents who purchased on the platform at least once every 2-3 months
                                                                                                                                                                                              8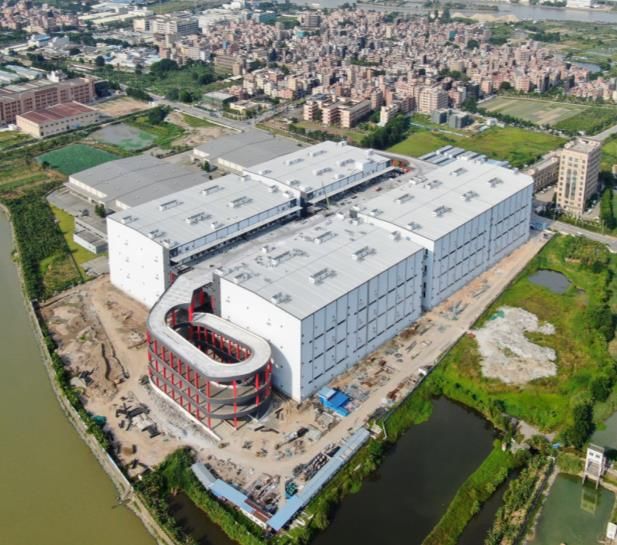
Manufacturers Are Shifting From “Just In Time
Inventory” To “Just In Case Inventory”

   “Think of it as “just in time plus.” The “plus” stands for “just in case,” meaning more sophisticated risk management.
   The COVID-19 pandemic revealed vulnerabilities in the long, complicated supply chains of many companies. When a
   single country or even a single factory went dark, the lack of critical components shut down production. Never again,
   executives vowed. So the great rebalancing began. As much as a quarter of global goods exports, or $4.5 trillion, could
   shift by 2025.”
                                                                                         —— McKinsey & Co, January, 2021

   “As the situation began to unfold, we built inventory in both raw materials and finished goods to mitigate risk and to help us to continue
   meeting demand… This proactive approach coupled with our experienced and dedicated team, has enabled us to consistently deliver strong
   customer service levels.”
                                                                   —— Michele G. Buck, President and CEO, The Hershey Co., April, 23, 2020

   “We believe that the focus of the government on infrastructure, on encouraging manufacturing, the trend of localization in supply chains
   after the covid-19 crisis—all of these will create opportunities for us in the medium- to long-term. We are bullish about these prospects.”
                                                                             —— T.V. Narendran, CEO and MD at Tata Steel Ltd., April 27, 2020

   “The downward trend in inventory-to-sales ratios since the early 1990s could reverse as manufacturers, wholesalers and retailers store
   materials and products closer to manufacturing centers and consumers…The COVID-19 crisis has underscored the fragility of just-in-time
   (JIT) production networks... These JIT systems are now susceptible to closed manufacturing facilities, ports and borders due to the COVID-
   19 crisis. A March survey by the Institute for Supply Management found that nearly 75% of business respondents have experienced supply
   chain disruptions and more than 80% believe they will in the future. As a result, many businesses are planning major restructuring of their
   supply chain processes.”
                                                                                                                    —— CBRE, May 14, 2020

   “There’s a diversification in supply chains going on for security reasons, after recent events disrupted the supply chain…The move from the
   just in time to just in case supply chain model is taking root and people look at Vietnam as one of the options.”

                                                                     —— Frederick Burke, partner at law firm Baker McKenzie, July 28, 2020

                                                                                                                                                 9
Capital Allocation Increasingly Skewed Towards Funds
Focused On Logistics Due To E-commerce
As investors have shifted focus in favour of logistics, investments in logistics sector have surpassed retail
% of global investment
30
21.3%
20 c.25% of investment
volume
11.7%
10 Logistics deal activity in
2020 continued to surpass
retail, evidencing
investors’ unwavering
interest in the sector
0
Q1 Q1 Q1 Q1 Q1 Q1 Q1 Q4
2008 2010 2012 2014 2016 2018 2020 2020
Retail Industrial
Investors will continue to cycle out of retail and into logistics given the
transformative impact of e-commerce
Source: Real Capital Analytics 10Global Funds Are Under Allocated To APAC With Over
75% Investors Indicating Plans To Boost Allocation To The
Region
Superior growth prospects coupled with strong
Capital flows are already starting to pivot towards demographic and urbanisation trends are fuelling
APAC, but APAC still remains under-penetrated demand for APAC
Expected change by capital allocators in funds flow into Asian markets
Total cross-border investment transaction breakdown by region over the next five years
24% 21%
27% APAC 6.4
31%
Capital Origin
52% Americas 6.2
57%
60% 51%
Europe 5.9
27%
18% 19%
13%
2017 2018 2019 2020 0 1 2 3 4 5 6 7 8 9
APAC EMEA Americas Large Stay Large
decline the same increase
Source: Real Capital Analytics Source: PwC, Emerging Trends in Real Estate, 2021
11“New Economy” Real Estate Has Significantly
Outperformed “Old Economy” In Public Markets
LTM share price performance (%)(1)
Europe Japan
15.7%
20.6%
(22.7%) (19.9%)
(46.6%) (11.1%)
Office Retail Hotel Logistics (16.4%)
(23.5%)
Office Retail Hotel Logistics
Hong Kong
57.5%
(14.5%)
(22.8%)
(37.6%)
Office Hotel Retail Logistics
US Singapore 22.9%
Australia
18.9% 15.3% 52.8%
9.1%
(24.5%) (32.7%) 12.8%
(13.1%) (12.6%)
(18.6%)
(48.0%) 0.7%
Office Retail Hotel Data Logistics Office Retail Hotel Data Logistics
Center Center Office Retail Logistics
Notes:
(1) Market data as of December 31, 2020, each sector performance based on market cap weighted share price performance
(2) Excluding Jinmao Hotel due to privatisation
12Risk/Reward For Logistics Will Continue To Transform
Capital Values
Potential for meaningful cap rate compression in the APAC logistics real estate sector
Spreads between logistics & office cap rates1
2.9%
1.7%
1.3% 1.2% 1.2% 1.2%
0.4%
0.2%
0.0%
(0.4%)
Singapore Beijing Tokyo Seoul Shanghai Hong Kong Sydney Melbourne London US average
Cap rate tightening and differential shrinking will drive higher logistics asset values, generating outsized returns for the asset class
Key logistics hubs in APAC offer more attractive premia
Logistics gross rental yields over costs of debt2
(Basis points)
365
350 333 310
300 255 225 180 175 188
130
Singapore Osaka Tokyo Guangzhou Seoul Sydney Melbourne Shanghai Beijing US average London
APAC offers more attractive valuation premium spreads compared to more mature markets in the US and UK
Source: Real Capital Analytics, NCREIF, JLL
Notes:
(1) As of 2Q2020
(2) As of 2019. Debt costs are based on investment grade borrowers, core stabilized assets fixed pricing on typical market maturi ties. In the calculation of the market yield, the transaction costs of purchasing or leasing of space are 13
not included. The market yield therefore reflects the returns to investment before transaction costs, assuming full occupancy and that the current income being paid is the market effective rentSection 2 New Growth Area:
Data Centres
RW NankoNaka DC, Japan
14Data Centers – A Growing Asset Class
Market drivers for data centres further accelerated by COVID-19
Growing need for • Increasing computing and storage needs
data creation and
storage • From video, online retail, gaming and corporate data processing
• Rising needs for data storage & processing
Internet of Things
• Stakeholders install +40bn IoT devices globally through 2023
Adoption of cloud • Introduction of 5G mobile network infrastructure results in faster
services by and denser stream of mobile data
businesses and
consumers • Increasing artificial intelligence utilization
• Corporates continue outsourcing data center needs
Data protection • Drive cost efficiencies and outsource to specialists
acts • Increasing compliance and regulatory requirements on data
security
• Increased short-term demand from telecommuting, online
Demand education and increased e-commerce consumption
accelerated by
COVID-19 • Expected sharp increase for demand for processing and storage of
information
15APAC Is Leading The Growth In Data Centers
APAC data traffic expected to grow exponentially due to demographic tailwinds
41.0% c.34%
50.7% 2019-2023E mobile data traffic
of global hyperscale data centers
of global millennials live in APAC(1) expected to be located in Asia-Pacific by
CAGR in APAC
2021E(2)
Rapid growth in APAC data center Rapid growth in APAC emerging APAC EMs(3) outgrows all other
market markets(3)’ public cloud service market regions in data center capacity
Overall market size of carrier-neutral data Public cloud service market size (US$billion) 2019-2023E CAGR in data center capacity(4)
centers (MW(2))
30%
27%
13,279
61.1
CAGR: 12.8% 18%
16%
CAGR: 34.6%
13%
12%
8,189 10%
18.6 6%
5% 5%
3% 2%
2019 2023E 2019 2023E Hyperscale Wholesale Retail
APAC Emerging Markets LATAM
Notes: EMEA North America
(1) Population aged 23-38
(2) Includes all carrier-neutral data centers, including retail, wholesale, and hyperscale data centers; market size is calculated by total capacity, which is the maximum capacity as designed
(3) Including China, India and Southeast Asia 16
(4) The percentages represent the 2019-2023E CAGR of the market size of carrier-neutral data centers (in terms of MW) across operating models and regions; market size is calculated by total
capacity, which is the maximum capacity as designedAPAC Is World’s Second Largest DC Region
ESR has a competitive advantage in APAC given our leading presence
across seven markets
Denotes ESR’s pipeline projects
APAC data centre spending to surpass US$35b Asia Pacific to grow to a power capacity of 9,800
by 2024 to account for >35% of global market MW by 2025
Source: Synergy Research Dec 2020 17A Natural Progression From Logistics To Digital
Infrastructure
Similar Product Type: Modern Logistics Facility & Data Centre
✓ Require large amounts of space near population hubs with easy access to
power and infrastructure
✓ Sustained growth driven by changing habits and increased online activity
Leverage on expertise of similar product type
ESR’s role as Property ESR’s Distinct Advantages
Company to deliver core
and shell ▪ Hyper-local presence provides unparalleled access
to unique un-brokered land/ zoning / power
approvals / development expertise.
▪ Ability to speculatively acquire and create landbank
+ thereby reducing “ready-for-service” timelines
Work closely with
hyperscale cloud ▪ Identify assets from our existing portfolio of
and colocation warehouses for redevelopment or repurpose
Operator Company with
dedicated experience in ▪ Flexibility to allocate land to warehousing and data
operating data centres centres in land parcel acquisitions
18The ESR Advantage:
Extension Of Customer Relationships
Repeat business Increasing requirement by
“Go-to” provider for Strong network effect e-commerce tenants for
e-commerce and 3PL and multiple-fund
with APAC focused data space and by capital
companies investments from capital
tenants partners for exposure to
partners
the asset class
Build-to-Suit Logistics
Landlord of E-Commerce Collaborations with 3PLs Blue chip Institutional
Solutions Provider &
Companies & Retailers / Logistic Operators Capital Providers
Reliable Landlord
◼ Major landlord of leading ◼ Strategic alliance with ◼ Developing build-to-suit ◼ Synergistic alignment
e-commerce companies major 3PLs and modern facilities for between operating
in China reputable logistics leading global e- network and capital
◼ Major provider of service providers commerce companies providers’ investment
warehouse facilities for and manufacturers mandates to attract
offline retailers repeat investors
Leverage ESR’s Synergistic Network of Blue-Chip Capital Partners and Customers
19Section 3 FY2020
Operations
Overview
Chibakita Distribution Center, Japan
20#1 APAC Focused Logistics Real Estate Platform
With Top Positions In Its Respective Markets
◼ ESR has over 20.1 million sqm GFA in operation and under development1 and a further c7.2 million
sqm GFA of development pipeline with MOUs2 signed across top tier markets with a high quality tenant base
1. China Platform 4. India Platform
Quickly emerged as one of the
leading logistics developers in
#1 e-commerce landlord4 India
1 China Established US$750
#1 development pipelines5 million JV with GIC to be
seeded with a ~2.2 million sq ft
#2 largest portfolio of logistic build-to-core asset
2 South Korea properties6 2 million sqm GFA in
development pipeline8
2. South Korea Platform 5. Singapore Platform
3 Japan
#1 largest owner of logistics
stock7
4 India #1 development pipeline in #1 non-Temasek affiliated
the Seoul Metropolitan Area7 industrial REIT platform9 of 75
properties10
AUM 1st publicly listed institutional
(US$ billion) 5 Singapore quality logistics asset focused
3 REIT in Korea
29.9
3. Japan Platform 6. Australia Platform
22.1
6 Australia US$3.4 billion of AUM with
#1 development pipeline in
the Greater Tokyo and Greater a development pipeline of
Osaka regions7 US$694 million
7 Indonesia
US$1.7 billion of Largest shareholder of
FY2019 FY2020 development starts in FY2020 Centuria11 (AUM: A$10.2 billion)
Notes:
(1) Consisting of approximately 11.8 million sqm of GFA of completed properties, approximately 4.6 (6) As of 4Q 2019, in Greater Shanghai, Greater Beijing and Greater Guangzhou as measured by GFA
million sqm of GFA of properties under construction and approximately 3.7 million sqm of GFA to (7) By GFA from 2019 to 2020
be built on land held for future development as of 31 December 2020 (8) Development pipeline including MOU as of 30 January 2021
(2) MOUs as of January 2021 (9) In terms of number of assets
(3) As of 31 December 2020 (10) Including 57 properties in ESR REIT and 18 properties in Sabana REIT as of 31 December 2020
(4) In terms of proportion of total area occupied in China in comparison to only GLP as of September (11) 17% stake in Centuria as of 31 December 2020
2017 when GLP was privatised
21
(5) In Greater Shanghai, Greater Beijing and Greater Guangzhou from 2020 to 2021Strategic Achievements In 2020
Strengthening presence in our core markets with strong fundraising efforts
through the year Secured JPY15b 3-year
unsecured senior term
loan at JPY TIBOR +2%
Plans to build Acquired ESR (Stock Code: 1821)
76.84-acre US$368m included as a constituent
logistics park in ESR Kuki DC of MSCI Hong Kong
Sohna, New from RJLF II Index from 30 Nov
Delhi in JV with
Plans to Launched Five-year ESG
Plans to develop AXA
develop Roadmap, reaffirming
JPY27b ESR modern
Yatomi Kisosaki Plans to ESR’s commitment to best
logistics facility, practices in ESG
DC develop a
ESR Ukishima
36-acre
US$22.1b Issued Distribution US$26.5b US$29.9b
industrial & ESR named a Sector
Dec 2019 S$225m 5.1% Centre in Jun 2020 Dec 2020
logistics park Leader in Asia by
AUM five-year notes Greater Tokyo AUM AUM
in Chennai GRESB
Bay Area
Jan Feb Mar Apr May Jun Jul Aug Sep Oct Nov Dec
2020 2021
US$500m JV Launched A$1b Launched US$1b Completion of Issued EADP Commenced construction
with GIC for ESR Australia South Korea acquisition of US$350m acquired on Phase 1 of ESR
development Logistics development JV PGGM's real 1.50% 18ha Higashi Ogishima DC
fund in China Partnership (ESR-KS II) with estate portfolio for convertible infill site which will house the
(EALP) APG and CPPIB RMB1.7b in JV bond due 2025 in QLD, world’s first cargo drone
with Manulife Australia logistics facility
Drawdown of Launched A$1b Signed new full
US$250m develop-to-hold Completion of building 81,391 Listing of ESR Kendall
three-year ESR Australia ESR Amagasaki sqm lease with Square REIT (Stock Code:
unsecured Development DC, APAC’s Nakano Shokai 365550.KS) on KOSPI
senior term loan Partnership largest logistics at ESR Toda DC,
at Libor +3% (EADP) warehousing Tokyo
project
Acquisition GIC and ESR established
of 3 prime Purchase of US$750m JV to develop
properties in 79ha site in and acquire assets in India
Jiangsu, Southeast
Melbourne to be 22
East China
held in EADPStrong Operational Performance
Testament To Resilience and Strength of Portfolio Fundamentals
▪ High portfolio occupancy of 90%1
▪ Well-staggered WALE of 4.2 years2 by leased area
Investment ▪ Record leasing with 2.3 million sqm of space leased across portfolio
on the back of demand from e-commerce related customers
▪ Achieved 4% rental reversion on renewed leases1
▪ Total AUM rose 35% y-o-y to US$29.9 billion3
Fund
▪ Fund AUM grew 41% y-o-y to US$27.1 billion3
Management ▪ Fund management fees increased 14% y-o-y to US$189 million
▪ Commenced US$3.2 billion worth of developments in FY2020 and
Work In Progress grew 21% y-o-y to US$4.7 billion
▪ Achieved US$3.4 billion of development completions
Development ▪ Robust landbank of over 3.7 million sqm across portfolio
▪ Close to US$1 billion of capital recycled from assets on balance sheet
to ESR managed funds
Notes:
(1) Based on stabilised assets on balance sheet as at 31 December 2020
(2) Based on assets on balance sheet and portfolio assets in funds and investment vehicles by leased area as at 31 December 2020 23
(3) As at 31 December 2020Record Leasing Of 2.3 million sqm Across Portfolio
Top five leases by area
E-commerce E-commerce E-commerce E-commerce
Retail
& 3PL & 3PL & 3PL & 3PL
Coupang Amazon Nitori Market Kurly Nakano Shokai
Tenant
Market Cap: US$79b1 Market Cap: US$1.6t1 Market Cap: US$22b1 Market Cap: US$1b1
Japan, China
Market Korea Japan Korea Japan
and India
Area leased in
FY2020 235 149 120 87 82
(‘000 sqm)
Lease term
2–5 5 – 20 2–6 10 10
(years)
Robust demand for logistics space across platform from quality creditworthy tenant base
Note:
(1) As of 24 March 2021 24Strategically Diversified In 7 Key APAC Markets
Resilient to market changes and disruptions
Revenue Contribution AUM By Region1 GFA By Region1
By Region1,2
India/Others India/Others
2% 4% India/Others
7%
Australia
Australia
Australia 11% China
China 7%
17% 23%
32%
Singapore
10% Singapore China
9% 42%
Singapore
8%
Japan
18%
Japan South Korea Japan South Korea
25% 16% 26% 26%
South Korea
17%
As of 31 December 2020
Notes:
(1) GFA includes completed properties, properties under construction and GFA on land held for future development. AUM includes portfolio assets owned directly by ESR and portfolio assets held in
the funds and investment vehicles
(2) Revenue excludes contribution from construction income
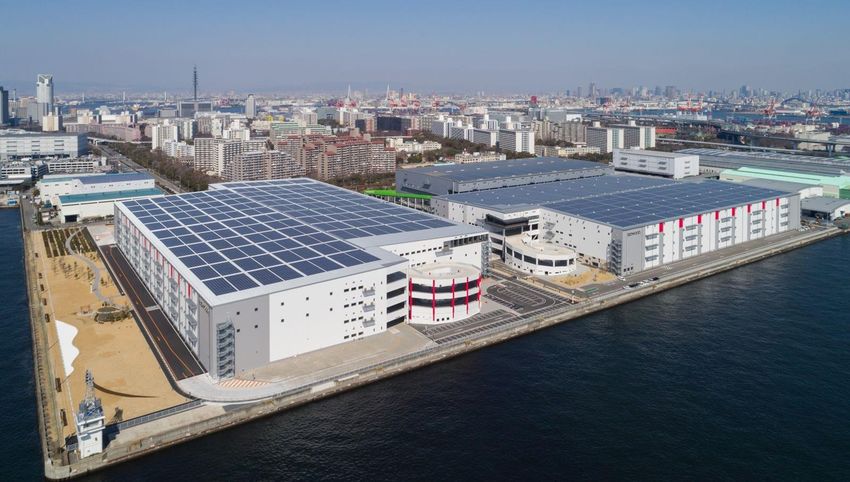
25Key Project Achievements In Japan
ESR AMAGASAKI DISTRIBUTION CENTRE ESR HIGASHI OGISHIMA DISTRIBUTION CENTRE - I
▪ Recipient of “Gold Award – Best Infrastructure, ▪ Commenced construction with expected completed
Community & Civic Building” at the MIPIM Asia in March 2023
Awards 2020
▪ Set to be one of Japan’s tallest distribution centres
▪ Largest domestic consumption logistics with a double-ramped, high-throughput facility
warehousing project (GFA: 388,570 sqm) in Japan (GFA: 365,385 sqm)
as well as in APAC1 – completed in July 2020
▪ Human centric features including a child day-care
▪ Boasts a suite of human-centric features including centre (BARNKLÜBB), a private lounge (KLÜBB
a child day-care centre (BARNKLÜBB), a private Lounge), as well as other lifestyle amenities
lounge (KLÜBB Lounge) and communal amenities
▪ Ground-breaking collaboration with VRCO to
design and demonstrate the world’s first cargo
drone logistics facility – use of electric vertical take-
off and landing (eVTOL) airframes to revolutionise
the movement of commercial cargo from ESR
distribution facilities of the future
BARNKLÜBB KLÜBB Lounge
Note:
(1) The largest single-phase, single-asset logistics warehousing project in terms of GFA, as of July 2020. Sources: CBRE data and ESR research 26Strengthening Our Leadership Position In Korea
Successfully listed ESR Kendall Square REIT and launched
US$1 billion development fund in 2020
▪ Raised ~US$650 million through pre-IPO investments and
global offering in December 2020
▪ Portfolio is seeded by assets sold down from two of ESR’s
private real estate funds, while the injection of the committed
dropdown asset, Anseong Logistics Park, is expected to be
completed by June 2021
▪ Continues to see strong investor appetite with unit price up
19% year-to-date1
▪ Further cements ESR Kendall Square as the dominant
logistics real estate platform in Korea with over US$7.7
billion of AUM
▪ JV with longstanding capital partners APG and CPP
Investments
ESR-KS II
▪ ESR KS-II marks APG’s fourth development collaboration,
US$1 billion development JV and CPPIB’ third joint venture with ESR
with APG and CPP Investments
▪ Fund will be seeded with a prime land site in Incheon City
which will be developed into a modern, large-scale multi-
tenant facility with a GFA of >150,000 sqm
Note: 27
(1) As at 24 March 2021Key Project Achievements In China
XIEXIN JURONG AND XIEXIN XUZHOU ESR SHANGHAI YURUN – I AND II
▪ Prime properties in East China’s Jiangsu province, ▪ Phase I is to be developed into a high standard
strategically located in prominent hubs of the warehouse logistics facility which includes cold
country’s last mile logistics networks storage (Planned GFA: >340,000 sqm)
▪ Acquired 100% stake in June 2020 ▪ Construction of Phase I commenced in 2019 and is
expected to be completed in 2022
Xiexin Jurong Xiexin Xuzhou
Occupancy 100% 100% ▪ Construction of Phase II commenced in end 2020
GFA 165,292 sqm 36,551
Status Stabilised Construction in
progress
Leased Fully leased to Fully pre-leased
Tenant JD.com to SF Express
28Section 4 FY2020
Financial &
Operational
Overview
ESR Chakan 1 Industrial & Logistics
Park, India
29FY2020 Financials Key Highlights
Revenue Adjusted EBITDA1 Profit After Tax / PATMI
(US$ million) (US$ million) (US$ million)
Profit After
Tax
PATMI
388
+8.7% +2.0%
359 366 PAT:
357
+13.0%
PATMI:
+16.8%
315
278 286
245
FY2019 FY2020 FY2019 FY2020 FY2019 FY2020
▪ Delivered strong earnings across key business segments
▪ Well-diversified contributions from ESR’s six markets
Note:
(1) Adjusted EBITDA is calculated as profit before tax, adding back depreciation and amortization, exchange loss/(gain), finance costs, equity-settled share option, the listing expenses, and
eliminating the effect of interest income, and fair value gains on completed investment properties and investment properties under construction
30Well-Equipped With Strong Balance Sheet
Proactive and disciplined debt management
Net Debt Finance Costs
(US$ million) (US$ million)
184 156
1,687 1,908 1,780 2 2
3,805 38 3
3,251 3,189 3,295 1
2,855 38 Redeemed
2,571 or repaid 60
18 77
4 5-
1
1,515 29
947 85 3- 85
884
44
FY2019 1H 2020 FY2020
FY2019 1H 2020 FY2020 Interest expense on bank loans Interest expense on other borrowings
Total equity Total debt and other borrowings Cash and bank balances Net debt Interest expense on Hana Interest expense on RCPS
Interest expense on bonds Interest epxenses on convertible bonds
Interest accretion on convertible bonds Interest expense on lease liabilities
Net Debt / Total Assets Net Debt / Equity Weighted Average Interest Cost
(%) (%) 59.8% (%)
28.6% 51.9%
26.6% 46.8% 5.0% 5.0%
23.2% 4.6%
31 Dec 2019 30 Jun 2020 31 Dec 2020 FY2019 1H 2020 FY2020 31 Dec 2019 30 Jun 2020 31 Dec 2020
Weighted average interest cost was 4.6% as at 31 December 2020
31Capital Recycling Initiatives In FY2020
Close to US$1 billion of capital recycled from assets on balance sheet to
ESR managed funds – double annual target of US$400 to US$500 million
Transactions from Balance Sheet to ESR Managed Gross Divestment
Funds in FY2020 Value
Divestment of six on-balance assets in China to ESR-
US$103 million
GIC JV
Divestment of 20 assets in Australia as part of the
Propertylink acquisition and a land parcel seeded into US$514 million
ESR Australia Logistics Partnership (EALP) 71-91 Whiteside Rd, Clayton, Victoria
Divestment of 2 assets in Australia into ESR Australia
US$35 million
Development Partnership (EADP)
Divestment of RW Kawajima DC into private REIT US$86 million
Divestment of Higashi Ogishima Site A into
US$255 million
RJLF III
Total US$993 million ESR Higashi Ogishima Distribution
Centre, Japan
Received net cash recycled back of approx. US$0.7 billion
Disciplined strategy to enhance financial flexibility to seize potential opportunities
Note:
(1) Cash recycled back (net of cash deconsolidated) are as follows:
- US$105 million from the divestment of China assets
- US$179 million from the divestment of Australia assets to EALP
- US$7 million from the divestment of Australia assets to EADP
- US$84 million received on the divestment of RW Kawajima DC 32
- US$275 million from the divestment of Higashi Ogishima Site AKey Drivers Of Our Three Pillars Of Business
A B C
Investment Fund Management Development
– Completed B/S properties
– Base / Asset management fees – B/S development profits
➢ Rental income + revaluation gains
– Development fees ➢ Revaluation gains on U/C properties +
– Fund co-investments(1)
disposal gain on sale
Income ➢ Pro rata earnings – Acquisition fees
– Leasing fees – Funds’ development profits(1)
– Listed securities
➢ Dividend income – Promote fees – Construction income
– Solar energy income
– Direct costs for rental and solar energy income – Construction costs
Expenses – Allocated administrative expenses
– Allocated administrative expense – Allocated administrative expenses
✓ Rental growth and high occupancy ✓ Strong Fund AUM growth ✓ Significant development pipeline (B/S, funds)
✓ Cap rate compression ✓ Significant development pipeline in funds ✓ Track record of strong development profit
Key drivers margins
✓ High dividend payout from listed ✓ Promote Fee opportunity
securities ✓ Asset recycling from B/S or development
funds into core funds / REITs
FY2020
Segmental US$226 million US$148 million US$289 million
result2
% contribution % contribution % contribution
34.1% 22.3% 43.6%
Combined segmental EBITDA: US$663 million
D US$75 million corporate and other unallocated costs
Total Segmental Result: US$588 million
Notes:
(1) Based on allocated share of profits from FVTPL funds and JV funds to each of Investment and Development segments 33
(2) FY2019 Segmental result: Investment: 40.5%, Fund Management: 20.8%, Development: 38.7%A Investment Segment
Healthy broad-based demand with strong occupancy maintained
Portfolio Lease Expiry Profile By Area1 Investment Segmental Result
Assets held on Balance Sheet Assets held in Funds (US$ million)
28%
27%
256
226
17% 17%
15%
11% 11% 13%
13%
11% 10%
8%
6% 6%
2% 2% 2% 1%
2021 2022 2023 2024 2025 2026 and
beyond
As at 31 Dec 2020 Assets held
Assets held
on Balance Portfolio
in Funds
Sheet
WALE (by leased area) 2.2 years 4.6 years 4.2 years FY2019 FY2020
WALE (by income) 2.1 years 3.7 years 3.5 years
▪ Decline in investment segment results due to reduced portfolio on balance sheet, following
full sell-down of Propertylink assets to EALP in FY2020
▪ Well-staggered WALE of 4.2 years2 by leased area and 3.5 years2 by income
▪ Maintained high occupancy of 90%3 across portfolio
▪ Achieved positive rental reversion of 4% on renewed leases 3
Notes:
(1) As at 31 December 2020
(2) Based on assets on balance sheet and portfolio assets held in the funds and investment vehicles
34
(3) Based on assets on balance sheet and stabilised assetsA Investment Segment
Strong demand from digital economy supports leasing growth
Portfolio Top 10 Tenants By Income1,2 Lease Profile By End User Industry
(%)
Others
JD.com 9.8% 9%
Coupang 8.4% Retail
12%
SoftBank Group Corp 5.8%
Lease
Zeny 3.6% Profile
Manufacturing by Income1
Amazon 3.2% 10%
Mitsubishi Fuso Trucks and Buses 2.3%
Cold Chain
5%
Cainiao 2.1%
The State of Queensland 1.6%
64%
Market Kurly 1.5%
>Two-thirds E-commerce and
of Top 10 Tenants 3PL companies
are e-commerce related
Askul Corporation 1.5%
E-commerce related
▪ Leasing transactions remains strong across portfolio with 2.3 million sqm of space 2 leased
across portfolio
▪ Leasing demand largely driven by e-commerce and 3PLs
Notes:
(1) Based on income for FY2020 35
(2) Based on assets on balance sheet and portfolio assets held in the funds and investment vehiclesB Fund Management Segment
Fund AUM rose 41% y-o-y to US$27.1 billion
Evolution in Total Assets Under Management (Jun 2019 to Dec 2020)
(US$ billion)
29.9
17.3
26.5
16.9
22.1
20.2 12.4
11.2
9.8
6.7 6.8
6.3
2.7 2.9 2.8 2.8
30 Jun 2019 31 Dec 2019 30 Jun 2020 31 Dec 2020
Balance Sheet Core Funds Development Funds Fund AUM
Accelerating growth of fund management business demonstrates strong investor confidence
36B Fund Management Segment
Strong fundraising support with US$3.7b of committed but uncalled capital
Fund Income Fund Management Segmental Result
(US$ million) (US$ million)
189
148
167 132
FY2019 FY2020 FY2019 FY2020
Fund Income FY2019 FY2020 Capital Raised (US$ billion) FY2019 FY2020
% of Fund AUM 0.9%1 0.7% Equity committed 6.5 10.2
% of Adjusted Fund AUM2 1.2% 1.0% Undrawn capital 1.8 3.7
% of invested capital 3.4% 2.8% Capital raised 1.3 3.5
Strong recurring income base from fees collected from blue chip investors
Notes: 37
(1) The figure has been updated to align to prior years’ and current comparative purposes.
(2) Excludes uncalled capital.B ESR’s Capital Raising By Market
Continuous platform expansion underpinned by strong fundraising
Japan
AUM (US$ billion)
7.7 7.9
US$3.5b
New capital committed
in FY2020 Dec 19 Dec 20
South Korea
US$3.7b
AUM (US$ billion)
7.7 Listed in Dec 2020
Uncalled capital 4.6
to be deployed New LPs in FY2020
Strong Network of
Blue Chip Institutional Dec 19 Dec 20
Capital Providers India China
AUM (US$ billion) New LP in FY2020 AUM (US$ billion)
1.2 New LPs in FY2020
CPPIB APG 6.7
0.5 4.8
Ping An CPIC
NCI Dec 19 Dec 20
GIC
Australia Dec 19 Dec 20
AXA Manulife AUM (US$ billion)
3.4 New LP in FY2020 Singapore (2 Listed REITs)
AUM (US$ billion)
PGGM Allianz 1.5 3.0 3.0
Dec 19 Dec 20
38
*AUM details as of 31 December 2020 Dec 19 Dec 20B Investment Vehicles Under Management
Continue to attract best-in-class capital partners across multiple-fund
investments Fund AUM
Capital Uncalled
Interest Held GFA
Inception Date Category Commitments1 Capital
By ESR (%)
(US$ million) (US$ million) (US$ million) ('000 sqm)
e-Shang Star Cayman Limited May-14 Development 1,999 863 113 25.6 2,250
RCLF I Jul-12 Development 793 440 - 2.3 1,009
China
China Invesco Core Fund Oct-17 Core 350 190 - 16.3 371
NCI Core Fund Jan-19 Core 300 159 - 10.0 325
GIC Dec-19 Development 821 500 308 51.0 902
Manulife Mar-20 Core 276 265 0 1.5 270
South Korea
South Korea Development Fund I Nov-15 Development 2,981 1,150 288 20.0 2,199
South Korea Core Fund Jul-18 Core/Core Plus 992 500 118 10.0 377
South Korea Development Fund JV 2 Jun-20 Development 2,346 1,000 902 20.0 150
AMC Projects - Core 289 NA NA NA 186
ESR Kendall Square REIT Dec-20 REIT 1,125 NA NA 9.9 589
RJLF II Apr-18 Development 1,566 588 86 0.0 587
Japan
ESR Japan Core Fund Dec-18 Core 1,057 408 - 17.0 414
RJLF III Jun-19 Development 1,555 724 344 20.0 617
Other investment vehicles Various Development 3,247 1,352 366 Various 1,055
Singapore
ESR-REIT 2006 REIT 2,342 NA NA 9.7 1,403
Sabana REIT 2010 REIT 632 NA NA 20.9 383
50 Ann PEP May-17 Core Plus 151 68 0 25.0 26
POP III Feb-19 Core Plus 99 45 0 11.2 20
Australia
PACT Dec-17 Core Plus 248 59 0 15.0 19
EALT Nov-19 Core Plus 143 73 0 20.0 94
EOP IV Dec-19 Core Plus 114 49 0 11.2 22
EALP Jun-20 Core Plus 942 456 54 20.0 655
EADP Jul-20 Development 1,674 759 702 60.0 405
India
ESR India Logistics Fund Nov-18 Development 403 244 85 50.0 694
ESR Mumbai 3 Dec-20 Development 667 300 300
TOTAL OF ALL FUNDS 27,113 10,191 3,665 15,023
Notes:
(1) The commitment represents the aggregate capital commitments to the fund or investment vehicle, as applicable, including capital commitments by third-party investors and the general partner or investment manager. Foreign
currency commitments have been converted into U.S. dollars based on: (i) the foreign exchange rate at the date of purchase for each investment; and (ii) the exchange rate that prevailed on 31 December 2020, in the case of
uncalled commitments. 39C Development Segment
Increased development workbook boosted by strong demand across
portfolio
Work In Progress
Estimated Total Cost (US$ billion) Work In Progress (Estimated Total Cost) (US$ billion) FY2019 FY2020
42 42 WIP End Value as at December 3.2 3.9
Development Completions 1.2 2.2
4.7
Development Starts 2.0 3.2
3.9 FX and other (0.1) (0.2)
WIP End Value as at December 2020 3.9 4.7
No. of WIP developments (as at year end) 42 42
FY2019 FY2020
No. of WIP developments
Project rendering of the 153,092 sqm four-storey ESR Yatomi Kisosaki Distribution
Centre, which is set to be the largest modern logistics facility in Greater Nagoya
▪ Strong growth in WIP to US$4.7 billion in FY2020 on the back of strong demand
particularly e-commerce related customers
▪ Current developments are higher-value projects with increased scale and higher quality
40C Development Segment
Continue to leverage third party capital for development starts
Development Starts Development Completions
Estimated Total Cost (US$ billion) Completion Fair Value (US$ billion)
3.4
3.2 3.2
2.8
2.0 1.9
1.8 1.8
ESR Amagasaki DC, Japan
0.4
0.2 0.1 0.2
FY2019 FY2020 FY2019 FY2020
Assets held on Balance Sheet Assets held in Funds & Investment Vehicles
GFA (million sqm) FY2019 FY2020 GFA (million sqm) FY2019 FY2020
Assets held on Balance 16% 28% Assets held on Balance 16% 15%
Sheet Sheet
Assets held in Funds & 84% 72% Assets held in Funds & 84% 85%
Investment Vehicles Investment Vehicles
ESR Hongmei II, China
41C Development Segment
Strong landbank for sustainable and recurring development profits
Development
Land Bank Development Pipeline Segmental Result
GFA (million sqm) GFA (million sqm) China
(US$ million)
Japan
US$2.4 bil US$3.2 bil 15.5 South Korea
Australia
3.7 2.1
India
289
3.3 1.0
2.4
1.7 245
2.1
3.9
7.2
0.9
0.3
1.6 6.3 0.7 4.6
2.2 0.8
0.1 3.7
1.3 0.6 0.5
3.0 1.2 0.5
0.8
1.9 0.5
1.4
FY2019 FY2020 Development MOU1 Under Land
Pipeline Development
Land held on Land held in Funds
Balance Sheet & Investment Vehicles
Estimated Total Cost GFA (million sqm) FY2019 FY2020
GFA (million sqm) FY2019 FY2020 MOU1 43% 46% FY2019 FY2020
Land held on Balance Sheet 49% 36% Under Development 33% 30%
Land held in Funds & 51% 64%
Investment Vehicles Land 24% 24%
Note:
(1) MOUs as of January 2021 42Summary Of FY2020 Financial Performance
US$ million FY2019 FY2020 Variance
Revenue 357 388 8.7%
Investment 121 107 (11.5%)
Fund Management 167 189 13.5%
Development 69 92 31.9%
Segmental Results (EBITDA) 633 663 4.7%
Investment 256 226 (11.8%)
Fund Management 132 148 12.0%
Development 245 289 18.1%
Corporate and other unallocated expenses (75) (75) (0.9%)
Total EBITDA 549 571 4.0%
PATMI 245 286 16.8%
Core PATMI
227 260 14.7%
(ex. revaluation from completed properties)
▪ Revenue increased by 8.7% y-o-y to US$388 million mainly due to higher fees from fund
management segment. The increase was offset by lower income from investment segment following
full sell-down of Propertylink assets to EALP
▪ Increase in segmental results (EBITDA) driven by increase in fee income, as well as gains realised
through investment properties and properties under development
▪ Growth in Core PATMI continues to be supported by strong recurring income such as fees collected
from fund management
43Summary Of FY2020 Balance Sheet
US$ million FY2019 FY2020 Variance
Total Assets 6,352 7,687 21.0%
Cash 884 1,515 71.4%
Total debt and other borrowings 2,571 3,295 28.2%
Net Debt 1,687 1,780 5.5%
Net Debt / Total Assets 26.6% 23.2% (3.4pp)
▪ Robust cash position of US$1.5 billion as at December 2020, an increase of 71.4% from
Dec 2019
▪ Total debt and borrowings were higher in FY2020 to fund the Group’ investments and
ongoing developments
▪ Improved gearing ratio of 23.2%, allowing substantial headroom to capture future
acquisition and investment opportunities
44Disciplined Capital Management
Well-managed debt maturity profile of 3 years
Debt Maturity Profile Debt Currency Profile
(US$ million) As at 31 December 2020
AUD
1,248 SGD 2%
1,149 16%
38%
35%
734
22% USD
51%
JPY
16%
164
5%
RMB
Within one year In the second year In the third to fifth Beyond five years 15%
year, inclusive
▪ Well-spread debt maturity profile of 3 years with diversified funding sources
▪ Continued interest cost management with weighted interest cost of 4.6% as at 31 Dec. 2020
(vs. 5% as at end June 2020)
- Feb 2020: Issued S$225 million five-year notes at 5.1%
- Mar 2020: Drawdown of US$250 million three-year unsecured senior term loan at Libor +3%
- Sep 2020: Issued US$350 million five-year convertible bonds at 1.5%
- Nov 2020: Drawdown of JPY15 billion unsecured senior term loan at TIBOR +2%
- Feb 2021: Issued S$200 million perpetual step-up subordinated securities at 5.65% 45Section 6 Outlook
74-84 Main Road, Clayton, Victoria,
Australia
46Going Forward
Acceleration in e-commerce and digital economy
driving structural changes to consumption patterns
1 Deepen Penetration 2 Expansion Into 3 Growth Of Data 4 Strengthen Fund
In Existing Markets Southeast Asia Centre Business Management Efforts
▪ Largest APAC ▪ Growth of SEA’s ▪ Strong growth ▪ Continued strong
focused logistics digital economy prospects and demand from best-
real estate platform surpassed its 2025 vibrant demand for in-class institutional
forecast in 2020 data centres across
▪ Healthy investors
alone to 310 million APAC
development ▪ Agile and strategic in
digital consumers1
pipeline going ▪ Broadens ESR long- sourcing capital
forward, strong ▪ SEA’s e-commerce term relationships
landbank and an GMV up 23% from with customers, ▪ Launch of
active capital 2018 to 2020 – tenants and capital discretionary capital
recycling model faster than China’s partners vehicles including
GMV CAGR growth1 public-listed REITs
▪ Integrated ▪ A natural
development ▪ Actively exploring progression for ESR
platform to meet opportunities in key to leverage its own
tenants’ growing markets and growth strengths, expertise
demand locations and leading
presence in APAC
Well-positioned to participate in M&A and partnership opportunities
across the Asia Pacific region
Note:
(1) Facebook/Bain & Company, Digital Consumers of Tomorrow, Here Today, A SYNC Southeast Asia Report, August 2020
47Sustainability Supports Operational Resilience
ESG Framework provides strong process of materiality assessment
We believe the following key focus areas are impactful to our business and we have made
headway with mapping and identifying baseline data for the most critical areas.
2020 GRESB (Global Real
Human Centric Property Portfolio Corporate Performance
Estate Sustainability
Benchmark) Rankings
We aim to develop and manage We embrace “long-termism” and
As we strive to create a positive
and supportive environment for modern, state-of-the-art logistics believe a culture and practice of South Korea
facilities for the new economy. We strong year-on-year corporate Ranked first in the following
our employees, customers,
see ourselves playing a clear role in performance cements the
suppliers and communities, the
foundation for sustained and
category:
idea of “human centricity” is modern-day commerce, driving the
region beyond doing less harm and balanced growth, resulting in stable Overall GRESB score within
integral to our business. Basic
human needs are universal, and seizing opportunities to create a and dependable returns. Industrial/Asia
meeting those needs today positive impact – doing good for the
while ensuring they can be met planet, people and business. Ranked first in the following
in the future is the cornerstone category: Distribution
of sustainable development.
Warehouse within
Focus Areas include: Focus areas include: Focus areas include: Industrial/Eastern Asia
• Climate Change Resilience • Financial Results
• Safety, Health & Wellbeing
• Sustainable & Efficient Operations • Responsible Investing/Financing
• Diversity & Inclusion Japan
• Biodiversity & Habitat Protection • Corporate Governance
• Community Investment Ranked first in the following
• Human-Centric Design, Flexible & • Risk Management
• Talent Attraction, Retention &
Adaptable Properties, Strategic • Disclosure & Reporting category: Development score
Training
Locations • Investor Relations within Industrial/Asia
• Stakeholder Engagement
• Sustainable Building
Ranked second in the following
category: Developer, East Asia
48The End
Goyang Logistic Park, Korea
49Section 5 Appendix
ESR Chakan 1 Industrial & Logistics
Park, India
50Statements Of Profit Or Loss
Year ended 31 December
US$ million 2019 2020
Revenue 357 388
Cost of sales (81) (103)
Gross profit 276 285
Other income and gains, net 370 370
Administrative expenses (199) (202)
Finance costs (180) (147)
Share of profits and losses of joint ventures, net 93 105
Profit before tax 360 411
Income tax expense (82) (96)
Profit for the year 278 315
Attributable to:
Owners of the parent 245 286
Non-controlling interests 33 28
278 315
51Statements Of Financial Position
As at 31 December
US$ million 2019 2020
Non-current assets
Property, plant and equipment 31 32
Right-of-use assets 12 12
Investments in joint ventures 698 1,082
Financial assets at fair value through profit or loss 589 679
Financial assets at fair value through other comprehensive income 543 878
Investment properties 2,786 2,664
Goodwill and other intangibles 433 427
Other non-current assets 64 87
Total non-current assets 5,156 5,861
Current assets
Trade receivables 89 95
Prepayments, other receivables and other assets 129 209
Cash and bank balances 884 1,515
Assets held for sale 94 7
Total current assets 1,196 1,826
Current liabilities
Bank loans and other borrowings 232 734
Lease liabilities 6 7
Trade payables, accruals and other payables 230 244
Liabilities held for sale 21 -
Total current liabilities 489 985
Net current assets 707 841
Total assets less current liabilities 5,863 6,702
52Statements Of Financial Position (Cont’d)
As at 31 December
US$ million 2019 2020
Non-current liabilities
Deferred tax liabilities 211 281
Bank loans and other borrowings 2,339 2,562
Lease liabilities 17 7
Other non-current liabilities 45 47
Total non-current liabilities 2,612 2,897
Net assets 3,251 3,805
Equity
Equity attributable to owners of the parent
Issued capital 3 3
Perpetual capital securities 97 -
Equity components of convertible bond - 48
Other reserves 2,926 3,545
Non-controlling interests 225 209
Total equity 3,251 3,805
53Five-year ESG Roadmap
Pursuit towards excellence in sustainability
Develop and Embed
Increase Engagement
Consistent Reporting Systems and Foster A Culture of Plan and Adapt for
with the people that
with Transparency Processes for the Active Learning Change
Matter Most
Long-term
Plan to progress in our Integrate ESG Implement engagement Encourage employees Conduct regular ESG
reporting each year, considerations into programmes to promote to progress on risk assessments in
with honesty and all stages of the health & well-being to continuous learning with building safety, energy
ESG STRATEGY
transparency. business cycle which provide all our annual ESG training for efficiency, indoor
include establishing stakeholders with a all employees. environmental quality
We will look to produce data management positive and supportive and waste and water
a GRI adopted ESG systems, streamlining environment. This will pave the way management.
report by 2022, improve ESG data collection for streamlined systems
our GRESB score and processes and We will measure our and efficient processes, In Australia, we use a
participate at a developing policies impact with the hopes of creating a more resilient climate risk model to
corporate level and while setting annual creating a culture of workforce for the future. inform our buy or sell
become a signatory of performance targets community service and decisions and for the
the Principles of and reviews. promote harmony with rest of the region, we
Responsible Investment the community. are embarking on a
(PRI) by 2024. climate impact study to
shape the Group’s
approach to climate
adaptation.
5-YEAR ESG TARGETS
Human Centric Property Portfolio Corporate Performance
Safe working environment targeting 50% increase in solar power generation Achieve a 3 Star GRESB rating average
Zero Workplace Fatalities (from base year 2019)
Maintain a culture of strong corporate
Gender ratio of 40/60 women/men Sustainable building certification for 50% of performance
(from base year 2019) ESR’s portfolio
US$15 million in Social Investment
Development of community 20% reduction in energy consumption Programme to our local community
engagement/foundation programme across the Group (from base year 2019) foundation by 2030
54You can also read