Taxing Banks: An Evaluation of the German Bank Levy - Claudia M. Buch, Björn Hilberg and Lena Tönzer
←
→
Page content transcription
If your browser does not render page correctly, please read the page content below

Taxing Banks: An Evaluation of the German
Bank Levy
Claudia M. Buch, Björn Hilberg and Lena Tönzer

Taxing Banks:
                           An Evaluation of the German Bank Levy*

                  Claudia M. Buch (University of Tuebingen, CESifo, and IAW)
                                 Björn Hilberg (Deutsche Bundesbank)
                              Lena Tonzer (European University Institute)

                                               December 2013

                                                   Abstract
       Bank distress can have severe negative consequences for the stability of the
       financial system, the real economy, and public finances. Regimes for restructuring
       and restoring banks financed by bank levies and fiscal backstops seek to reduce
       these costs. Bank levies attempt to internalize systemic risk and increase the costs
       of leverage. This paper evaluates the effects of the German bank levy
       implemented in 2011 as part of the German bank restructuring law. Our analysis
       offers three main insights. First, revenues raised through the bank levy are
       minimal, because of low tax rates and high thresholds for tax exemptions. Second,
       the bulk of the payments were contributed by large commercial banks and the
       head institutes of savings banks and credit unions. Third, the levy had no effect on
       the volume of loans or interest rates for the average German bank. For the banks
       affected most by the levy, we find evidence of fewer loans, higher lending rates,
       and lower deposit rates.
       Keywords:            Bank levy, bank lending, interest rates, German banks
       JEL codes:           G21, G28, C21

*
 Corresponding author: Claudia Buch, Halle Institute for Economic Research (IWH), Kleine Maerkerstraße 8,
06108 Halle (Saale), Germany, Phone: +49 345 7753 700. E-mail: claudia.buch@iwh-halle.de.
This paper was written within the context of the Priority Programme SPP1578, “Financial Market Imperfections
and Macroeconomic Performance,” of the German National Science Foundation (DFG). Its development also
occurred partly during visits of the authors to the research centre of the Deutsche Bundesbank. The hospitality of
the Bundesbank and access to its bank-level data are gratefully acknowledged. The authors also thank Elena
Carletti, Tommaso Oliviero and participants of a PhD workshop at the Frankfurt School of Finance and
Management for helpful comments. They further thank participants in the seminar series at Deutsche
Bundesbank. All errors and inconsistencies are solely our own.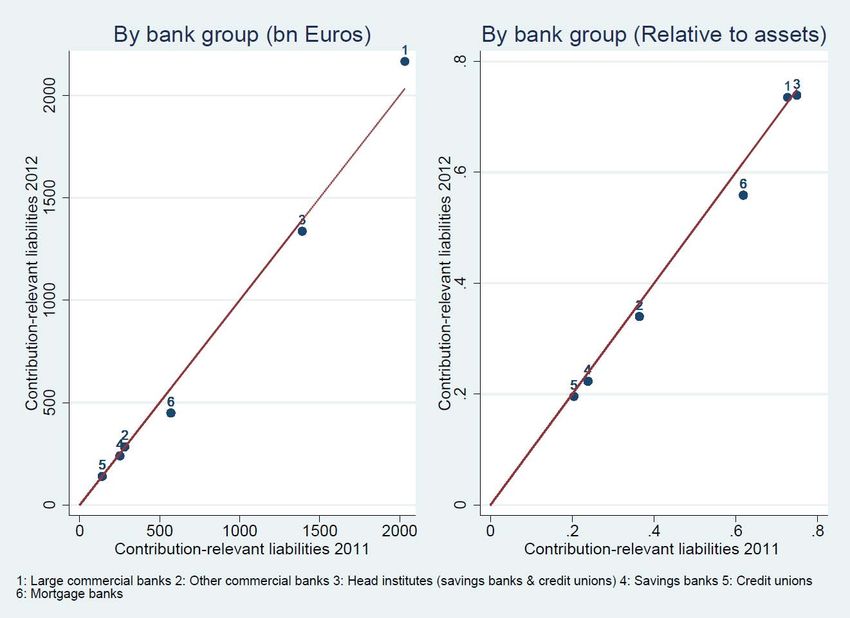
2

1   Motivation

Bank distress can have severe negative consequences not just for the stability of the financial
system but also for the real economy and public finances. Systemic banking crises have
imposed fiscal costs of up to 6.8% of a country’s gross domestic product (GDP) and output
has fallen by 23% compared with long-run trends (Laeven and Valencia 2012). Crises
increase public debt significantly, aggravating the risk of public sector default (Reinhart and
Rogoff 2011, 2013). Furthermore, recessions triggered by debt crises are particularly severe
and long-lasting (Taylor 2012).

To lower the probability of banking crises and internalize the costs of bank distress, policy
makers have chosen two main instruments. First, the new Basel III regulations impose higher
capital requirements for banks (and thus lower leverage), demand better quality of regulatory
bank capital, and implement capital buffers to account for systemic risk. Second, regimes for
restructuring and restoring banks have been established. They rely on fiscal backstops and
bank levies, which seek to both internalize systemic risk and increase the costs of leverage
(International Monetary Fund [IMF] 2010; Perotti and Suarez 2011; Shin 2010).

In this paper, we evaluate the effects of the German bank levy implemented in 2011 as part of
the German bank restructuring law. We combine several data sets provided by the Deutsche
Bundesbank to analyze whether the bank levy affected bank behavior. In particular, we
consider responses in terms of lending volume, pricing of new loans, and deposits. By using a
difference-in-difference approach, our study exploits two features of the levy design. First, its
specific terms were uncertain until the restructuring fund regulation actually passed. Second,
the levy was applied in retrospect to banks’ balance sheets. Because the levy thus was
imposed exogenously, we can distinguish the behavior of banks that paid the tax (treated
banks) from those that did not (control group). We focus on differences in the banks’ behavior
before (2003–2010) versus after (2011) the introduction of the levy, which enables us to
isolate the effect of the levy cleanly. However, we cannot assess longer-term adjustments of
the banks’ business models.

The German bank levy is designed to increase with banks’ total liabilities (and thus bank
leverage), from which selected positions (e.g., equity, retail deposits) are deducted, as well as
the amount of derivative exposures. Banks are exempt from paying the tax if their total
contribution-relevant liabilities are less than €300 million. Tax payments are capped at 20%
of profits; special purpose banks, which do not pay corporate income taxes, are not addressed
by this tax. With this financial stability contribution, the government aimed to correct the
adverse effects of high leverage. In contrast, a financial transaction tax imposes penalties on
certain kinds of financial transactions, and financial activity taxes invoke levies for financial
sector profits and remuneration. Of the 14 European countries that have imposed variants of
3

these taxes in the past five years, most of them (like Germany) opted for financial stability
contributions (Gottlieb et al. 2012). The revenues from these bank levies have been highest in
Hungary (0.7% of GDP) but only 0.02% of GDP in Germany. Thus the revenues are
consistently well below the 2–3% estimated costs of banking crises relative to GDP. In
addition, the German version differs in two main respects from other European bank levies:
First, the German levy applies to foreign branches of German banks but not foreign
subsidiaries. In most other countries, foreign affiliates are exempted from the levy. Second,
Germany (and France) exempts small banks and development banks from the levy.

In analyzing the effects of the German bank levy, we focus on two main questions. First, what
is the tax burden for different types of banks? The bank levy intends to provide incentives for
banks to internalize their contributions to systemic risk. Large, and thus presumably
systemically more important, banks pay higher levies. The design of the bank levy further
implies that banks with riskier business models make higher contributions. Those with a
market-based funding strategy and those involved in derivative trading are charged higher
levies, whereas banks that adopt traditional business models, such as retail deposits and
lending, are charged less. We find that the contributed bank levies correlate strongly with the
size of banks. The largest commercial banks and head institutes of savings banks and credit
unions account for the bulk of the payments, whereas smaller banks (77% of the total) do not
contribute to the levy at all. Other bank-specific features, such as the structure of assets and
liabilities or the profitability of banks, are virtually uncorrelated with the levy.

Second, how does the levy affect bank behavior? In the short run, banks could adjust by
reducing their lending activities, increasing their loan rates, and/or lowering deposit rates to
compensate for the increase in their funding costs due to the levy. The extent of this
adjustment depends on the pricing power in loan markets. We focus on a subsample of banks
for which we have information about new loans, the lending rates of these new loans, and the
interest rates paid for new deposits. We find no effects of the levy for the banking system as a
whole. This seems not surprising given that most banks are not affected by the levy or, if they
are, provide only very minor contributions. If we account for the size of the banks’
contribution-relevant liabilities though, we find that banks affected by the levy more tend to
lower their lending, increase the interest rates charged on new loans, and reduce interest rates
paid for new deposits. In the long run, a bank levy might also affect banks’ risk-taking
behavior. If the levy fails to internalize risk sufficiently, its introduction could induce moral
hazard effects, similar to those of deposit insurance systems. However, in the relatively short
time since the introduction of the German bank levy, we cannot test for such longer-run
adjustments in bank behavior or business models. The comparison of the distribution of taxed
balance sheet components before (2010) and after (2011) the introduction of the levy offered
no evidence of significant short-run changes in banks’ business models.
4

Our research contributes to two strands of literature. One stream indicates that banks pass
higher taxes on to borrowers. Demirguç-Kunt and Huizinga (1999, 2001) use bank-level data
for 80 countries, both developing and industrialized markets, to show that higher taxes lead to
higher pre-tax profitability of banks. That is, banks pass their corporate income taxes on to
customers, though this effect is stronger among local than foreign banks. Albertazzi and
Gamabcorta (2010) investigate similar issues using data for 10 industrialized countries during
1981–2003. They also find that corporate income taxes get passed on to borrowers, through
increased interest rates and reduced lending. This high pass-through rate is confirmed by
Chiorazzo and Milani (2011) with data on European banks over the period 1990–2005.
However, their result contrasts with Capelle-Blancard and Havrylchyk’s (2013) sample of
European banks for 1992–2008, for which they uncover no evidence of significant pass-
through. These latter authors are the only ones to account for endogeneity and they focus on
implicit taxes on banks. Our findings contribute to this literature by revealing a negative
impact of the bank levy on bank loans and a positive impact on loan rates, though only for the
banks significantly affected by the levy.

Another strand of literature focuses on regulatory measures designed to internalize banks’
contributions to systemic risk. Concrete policy proposals by the IMF (2010), in its report to
the G20, describe possible schemes of financial sector taxation. A proposal for liquidity
charges is given by Perotti and Suarez (2009). They argue that liquidity charges increasing in
the amount of short-term wholesale liabilities and weighted by the maturity mismatch
between assets and liabilities might discourage excessive reliance on short-term funding and
generate emergency liquidity funds for crisis times. Shin (2010) raises the idea of a tax on
banks’ non-core liabilities, which might lower their reliance on short-term wholesale funding
as a means to finance excessive balance sheet expansions during booms. Recent evidence on
the positive relationship between the use of wholesale funding and procyclicality of leverage
is provided by Damar et al. (2013) for the Canadian banking sector. Thus and in contrast to
capital requirements under Basel II, bank taxes should mitigate procyclicality in the financial
sector. Behn et al. (2013), for example, document for the German banking system a reduction
in lending to non-financial firms during the recent crisis due to procyclical capital charges
under the Basel II internal ratings-based approach. Although the time since the introduction of
the German bank levy (2011) is too short to analyze these long-run effects, Schweikhard and
Wahrenburg (2013) show that within the German tax scheme banks that contribute more to
systemic risk pay higher taxes. Using a sample of 41 large banks, they compare the
effectiveness of the French, German, and U.K. bank levies for internalizing systemic risk.
Specifically, they compare the levies these banks would have paid in 2007–2010 with their
“too-big-to-fail” premium (i.e., the funding cost advantage of being so large) and find that
none of the tax schemes fully internalize the negative externality; nevertheless, levies in all
tax schemes correlate positively with banks’ contributions to systemic risk. Unlike our
research, their analysis focuses on a selected sample of large banks and the link between
5

systemic risk measures and hypothetical tax payments in different regulatory regimes. Our
objective instead is to evaluate the immediate effects of actual levies paid according to the
German regulation on the interest rate setting and lending behavior of German banks. We
calculate tax payments using confidential balance sheet data from the Deutsche Bundesbank,
which are available for both large commercial banks but also smaller savings banks and credit
unions.

Theoretically, De Nicolò et al. (2012) use a dynamic model to study the effects of taxation,
capital, and liquidity requirements on bank lending, efficiency, and welfare. Their results
suggest that corporate income taxes dominate a tax on non-deposit liabilities, because the
former generates higher tax revenues but mitigates the negative effects on lending and social
welfare compared with a tax on non-deposit liabilities. Perotti and Suarez (2011) compare the
effectiveness of Pigovian taxes on short-term funding with the impact of liquidity ratios for
reducing systemic externalities. In their model, an optimal allocation results from introducing
Pigovian taxes on short-term funding, given that banks differ only in their investment
possibilities. This result disappears with the introduction of heterogeneity in banks’ risk-
taking. In this scenario, bank taxes are no longer sufficient to align gambling incentives and
excessive credit expansion. If we compare the design of the German bank levy with taxes
proposed in theoretical models and policy proposals, it becomes obvious that they all share
the idea of targeting the liability side of banks’ balance sheet and internalizing systemic risk
due to excessive reliance on short-term wholesale funding.

The paper is structured as follows. In the next section, we describe the design and legal
background of the German bank levy. In Section 3, we introduce our data and provide some
descriptive statistics. Section 4 contains the empirical model and the baseline regression
results. We conclude in Section 5.

2     German Bank Levy: Design and Legal Background

2.1    Timing of the Legislation
The German bank levy was charged for the first time in 2011, as part of the changes to the
regulatory framework of the banking system following the financial crisis that began in 2007.
The levy applies to all credit institutions with a banking license, as specified in the German
Banking Act (Kreditwesengesetz; KWG). The levy finances the Restructuring Fund
(Restrukturierungsfonds), which has a target size of €70 billion. Thus far though, only €1.28
billion have been collected from the banks over two years.1 These funds are earmarked to
rescue banks in distress if their failure would endanger the systemic stability of the banking

1
 According to information published by the German Bundestag in Drucksache 17/12339,
http://dipbt.bundestag.de/dip21/btd/17/123/1712339.pdf.
6

system. The Restructuring Fund is managed by the Federal Agency for Financial Market
Stability (Bundesanstalt für Finanzmarktstabilisierung; FMSA), in association with the
German Federal Ministry of Finance (Bundesministerium der Finanzen). The FMSA can use
these funds for public guarantees, recapitalizations, and financing bridge banks.

The annual bank levy reflects the statement from the immediately preceding accounting year;
our empirical approach thus exploits the fact that banks could not adjust their annual
statements when the levy had been introduced for the first time. That is, the levy was an
exogenous tax, applied retrospectively. Annual payments are calculated on the basis of
contribution-relevant liabilities, which are subject to a progressive rate, plus a second
component resulting from derivative exposures multiplied by a constant factor, as defined in
the Restructuring Fund Regulation (Restrukturierungsfonds-Verordnung; RStruktFV). The
accounting rules follow the German Commercial Code (Handelsgesetzbuch) rather than
international financial reporting standards.

The Restructuring Fund Act (Restrukturierungsfondsgesetz; RStruktFG) came into force in
December 2010, as part of the German Restructuring Act (Restrukturierungsgesetz). Whereas
the latter focuses on the reorganization of banks in distress (through recapitalizations,
guarantees, or bridge banks), the former determines the establishment of a restructuring fund
financed by bank levies. Concrete details about the design of the bank levy are available in
the Restructuring Fund Regulation, which passed in July 2011.

The legislation process featured controversial debates about how the regulation should be
implemented, which created substantial uncertainty about the concrete implementation of the
bank levy. This uncertainty implied that each individual bank could not adjust its activities ex
ante and thus would be affected by the levy exogenously. For example, one argument
suggested that smaller banks did not trigger the crisis but accounted for a notable share of
loans to small and mid-sized enterprises. Therefore, there was intense discussion about
providing an exemption to savings banks; the minimum threshold was lowered from €500 to
€300 million, and the acceptability limit was raised from 15% to 20% of annual earnings.
Furthermore, some discussion focused on whether the regulation should be based on quantity
alone or also impose risk weights.

2.2   Calculating the Bank Levy
The bank levy reflects the specific liability positions of banks and their derivative exposures.
The contribution-relevant liabilities are those defined in section 340a of the German
Commercial Code, less the (1) liabilities toward customers excluding liabilities issued as
bearer securities (Passivposten 2), (2) profit participation rights with a maturity of more than
two years (Passivposten 10), (3) reserve funds for general banking risk (Passivposten 11), and
(4) equity (Passivposten 12). The calculation of the contribution-relevant liabilities can be
summarized as follows:
7

All liabilities according to the annual statement of the immediately preceding accounting year
ending before March 1 of the contribution year
   - liabilities toward customers, excluding liabilities issued as bearer securities
       (Passivposten 2)
   - profit participation rights with a maturity of more than two years (Passivposten 10)
   - reserve funds for general banking risk (Passivposten 11)
   - equity (Passivposten 12)
= contribution-relevant liabilities (L).

The levy imposes a tax on funding sources other than customer deposits and bank equity. It
increases progressively with the volume of a bank’s contribution-relevant liabilities. In this
regard, the German system differs from those established in most other European countries,
which impose a flat tax rate on banks of different sizes. If the resulting contribution-relevant
sum is smaller than or equal to €300 million, no levy applies to this component of the tax.
Contribution-relevant liabilities (L) exceeding this value are subject to a progressive tax rate,
according to the scheme in Figure 1.

However, two liability positions are treated differently: those toward other credit institutes
that reflect development loans transactions (Passivposten 1) and trust liabilities counting as
development loans (Passivposten 4), both of which are multiplied by 0.0001. After 2012,
these positions were no longer subject to the levy and get subtracted from the contribution-
relevant liabilities.

The tax payment resulting from derivatives, or the second component on which the levy is
based, is calculated as follows: Contribution-relevant derivatives refer to the aggregate
notional volume of derivatives listed in the appendix of the last annual account and specified
in section 36 of the Credit Institution Accounting Regulation (Kreditinstituts-
Rechnungslegungsverordnung; RechKredV). The accrued levy results from the multiplication
of this amount by a factor of 0.000003.

The final contribution is the sum of the contribution-relevant liability positions, multiplied by
the respective factors, and the amount referring to derivative exposures. In special cases, the
levy can be capped if an upper bound is reached, or additional charges might be added. By
imposing a cap on payments, Germany differs from most other European countries.

2.3   Upper Bounds and Minimum Contributions
The regulatory design of the German bank levy allows for both lower and upper bounds on
the contribution a bank must pay. The maximum levy to be paid is limited to 20% of the
bank’s annual earnings, which corresponds to an acceptability limit (Zumutbarkeitsgrenze).
Annual earnings are adjusted for transfers due to profit-and-loss transfer agreements. An
additional adjustment takes place if the annual account of a legally non-independent institute,
which is not subject to the levy (Restructuring Fund Act, Section 2(2)), becomes part of the
8 annual account of a credit institute. If the acceptability limit is reached, the difference between the regularly calculated levy and the actually charged levy can be collected in subsequent years, added to the annual contribution. However, the annual payment resulting as the sum of these two positions must never exceed the acceptability limit of 20% of annual earnings. In addition to the annual levy, the FMSA can charge special contributions if the total amount of the levy obtained from all banks is insufficient to finance the rescue fund. The special contribution is proportional to the annual contribution of a bank relative to the total amount of collected levies, both averaged over the previous three years. It cannot be higher than three times the average of a credit institute’s annual contributions due during the previous three years. The total amount of special contributions and annual payments is limited to 50% of the average of the three preceding annual earnings, which corresponds to the so-called capacity limit (Belastungsgrenze). The ultimate upper bound of the annual payment is thus determined by the lower limit of either the acceptability or the capacity limit. The lower bound or minimum contribution (Mindestbeitrag) corresponds to a minimum of 5% of the calculated annual contribution. The minimum contribution is paid even if a credit institute has no annual surplus and irrespective of the upper bound. 2.4 Banks Affected All credit institutions that hold a German banking license and are subject to the Credit Institution Accounting Regulation must pay the bank levy. Bridge banks, defined as banks established by the FMSA to resolve banks in distress, and development banks (Förderbanken) such as the Reconstruction Loan Corporation (KfW) are excluded from the levy. In 2011, the banks exempted from the levy accounted for 5.6% of total assets and 1.9% of total customer deposits of the German market. Because the levy is computed on the basis of non-consolidated, single-entity accounts, domestic and foreign branches of German banks are subject to it.2 The levy also applies to any subsidiary of foreign banks located in Germany with a German banking license. Foreign subsidiaries of German banks are excluded from the regulation, unless they fall under the classification of the KWG and hold a German banking license. Branches of non-German banks are exempted from the regulation if they belong to credit institutions in the European Economic Area (KWG section 53b). In contrast, branches and subsidiaries of non-German, non-EU banks pursuant to the KWG section 53c are charged. 2 To avoid double taxation of foreign branches of German banks abroad, Germany signed bilateral agreements with individual countries (e.g., the United Kingdom). Bank levy payments made in Germany thus are deductible from similar payments made abroad.
9

2.5      Implications of the Design of the Bank Levy
The design of the German bank levy gives rise to several considerations. First, it is not a tax
in the strict sense but rather a mandatory fee charged to finance the rescue fund.3 In contrast
with a deposit insurance fund that insures depositors of all banks, the rescue fund is designed
to intervene only if systemically important banks are in distress. Although all banks are
obliged to pay the levy (unless they fall under the €300 million liability limit), smaller
institutions contribute to the fund but are unlikely to benefit from it directly.

Second, liabilities toward customers and equity are excluded from contribution-relevant
positions. This avoids the possibility that banks make contributions twice, with respect to both
deposit insurance and the bank levy, and mitigates conflicts with capital regulation. It also
provides incentives for banks to switch to more retail-based funding. With our short time
window for analysis, we do not expect to find significant effects of the levy on structural
adjustments in banks’ business models though.

Third, contribution-relevant liabilities are subject to a progressive rate: Larger institutions
contribute relatively more. This design imposes higher charges on banks that are more likely
to be systemically important, due to their size (too-big-to-fail) or interconnectedness (too-
connected-to-fail). Hence, we expect stronger effects of the levy on banks that are taxed more.

Fourth, the levy increases with the notional value of derivatives. This presumes that banks
with a higher volume of derivative trading are more risky; the potential beneficial effects of
derivatives are disregarded.

In summary, credit institutes with a market- rather than a retail-based funding strategy and
credit institutes involved in derivative trading should be more powerfully affected by the bank
levy. Smaller banks, focused on traditional business models, instead may be relatively less
affected.

3      Data and Descriptive Statistics

Our empirical analysis seeks to answer two main questions. First, which banks have paid the
bank levy, and how do these payments relate to bank-specific features? Second, has the levy
affected the behavior of banks? We analyze whether banks increased interest rates on new
loans, lowered deposits rates, or cut back on lending to compensate for their higher funding
costs.

To do so, we use supervisory data provided by the Deutsche Bundesbank on banks’ balance
sheets, income statements, and prudential indicators for the years 2003–2011. This time
window enables us to analyze the behavior of banks preceding the introduction of the levy

3
    We use the terms “levy” and “tax” as synonyms to refer to the German bank levy.
10 (2003–2010) versus their subsequent behavior (2011). All the results are based on annual data as we suspect that changes in banks’ behavior take place rather gradually. Furthermore, most of our results are robust to a shorter pre-levy time window (2008–2010). To focus on banks’ adjustments in immediate response to the introduction of the levy, we base our main regression results on a subsample of banks reporting to the MFI interest rate statistics. For these approximately 200 banks, this data set provides information about the quantity of new loans, the interest rate charged across new loans, and interest rates paid for new deposits.4 To detect possible differences between the MFI banks and the German banking system as a whole, we provide the descriptive statistics separately for each group. 3.1 Data Used to Calculate the Bank Levy An evaluation of the German bank levy in principle can draw on three data sources. First, we could use the annual reports of the credit institutions, which would provide information about the actual payments of each bank and key banking indicators. However, not all German banks publish annual reports such that the data set would be restricted to publicly listed banks. Confidential regulatory information, collected by supervisors, also would not be available. Second, the FMSA collects bank levies and therefore has original data about payments by each bank. However, these data are not available to external researchers; they also do not contain additional information about the banks’ balance sheets and prudential indicators. Third, the data collection strategy we use gathered confidential data from the Deutsche Bundesbank pertaining to banks’ balance sheets, income statements, and prudential indicators. In Germany, banking supervision is a cooperative effort between the banking supervisor BaFin (Bundesanstalt für Finanzdienstleistungsaufsicht) and the Bundesbank, in which the Bundesbank collects the relevant data. In terms of coverage, quality, and depth, the Bundesbank data thus are the most comprehensive available, including information about the smaller savings banks and credit unions that dominate the retail market. However, these data lack direct information about the levies actually paid by banks. By combining information on the legal rules of how to calculate the levy with high-quality information on banks’ balance sheets and income statements, we can calculate the contributions of banks with a sufficient degree of precision though. The amount actually paid by the bank and the amount we calculate may differ for three reasons. First, instead of development loans, which do not have a direct counterpart in the Bundesbank’s reporting scheme, we use the amount of trust liabilities as a proxy. Second, 4 The regression results reflect a balanced sample of banks reporting to the MFI interest rate statistics since 2003. Hence, the sample of banks is constant over time, and we cannot model a possible selection effect. The results are robust to the addition of approximately 40 banks, required to report only since 2010. For a detailed description of the bank selection procedure and the changes introduced to the MFI interest rate statistics in June 2010, see the Deutsche Bundesbank Monthly Reports (January 2004, pp. 47–62; June 2011, pp. 49–62).
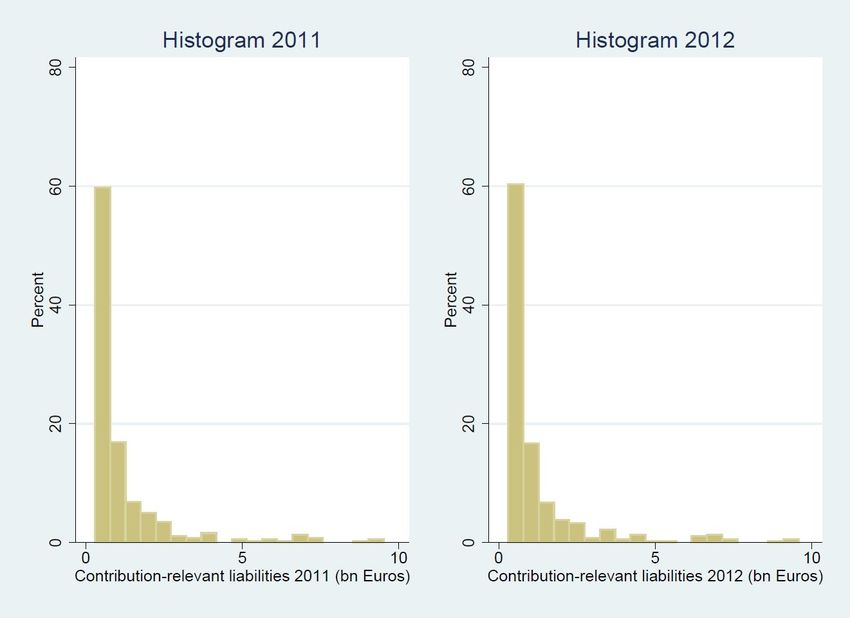
11

data on derivatives held by banks is not available for all banks within the sample. Instead we
resort to the over-the-counter (OTC) derivatives statistics, which contain information about
banks with derivative exposures of more than €1,000 billion. Third, to avoid double taxation
of banks in the same group, annual earnings are subject to adjustments that cannot be retraced
with the available balance sheet and income statement data. Despite these potential deviations,
our calculations are very similar to the publicly available information on bank levies (which
we present subsequently in Table 3), which increases confidence in the validity of our
approach.

3.1.1. Contribution-Relevant Liabilities
Contribution-relevant liabilities can be calculated directly from the balance sheets reported to
the Bundesbank. These liabilities sum up to €4.7 trillion across all banks at the end of 2010,
which provides the basis for calculating the 2011 bank levy. Table 1 depicts the distribution
of contribution-relevant liabilities across banking groups (Panel a includes the full sample,
and Panel b features the sub-sample of MFI banks). We define bank groups such that head
institutes of savings banks (Landesbanken) and credit unions (Genossenschaftszentralbanken)
combine in one group. Neither mortgage banks nor building societies individually is a focus
of our analysis, so we group them together.

The last two columns of Table 1, Panel a, show that the majority of banks have less than €300
million of contribution-relevant liabilities. More than 77% of all German banks, and in
particular the credit unions, fall below this threshold. The large commercial banks and head
institutes of savings banks and credit unions account for more than 73% of total contribution-
relevant liabilities (Column 2). The banks reporting to the MFI interest rate statistics represent
the bulk of the contribution-relevant liabilities (€4.3 out of €4.7 trillion). Column 3 indicates
the ratio of contribution-relevant to total liabilities; reflecting their weaker retail depositor
base, the large commercial banks (60%) and head institutes of savings banks and credit
unions (75%) display the largest ratios of taxable liabilities. These ratios are again similar
when comparing the two groups for the MFI and the full sample.

To find any indications that banks adjusted the structure of their liabilities in response to the
introduction of the levy, in Figures 2 and 3, we compare the amount of contribution-relevant
liabilities for 2011 and 2012. Figure 2 plots the contribution-relevant liabilities for 2011
against those of 2012, by bank group. In the left panel, we find that the amount of
contribution-relevant liabilities barely changed across years indicating that the banks did not
adjust their balance sheets significantly. Inspecting the contribution-relevant liabilities relative
to total assets in the right panel of Figure 2 yields similar results. This is not surprising,
considering that most banks had contribution-relevant liabilities below €300 million, which
excluded them from payments. However, even for large commercial banks (bank group 1) or
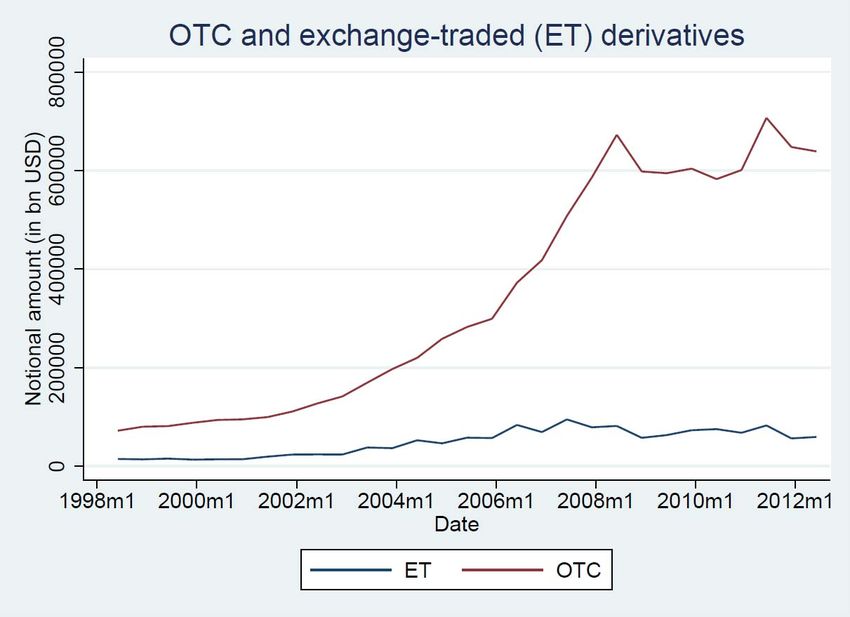
12

head institutes of savings banks and credit unions (bank group 3), no significant adjustments
arose.

The distribution of contribution-relevant liabilities in the second interval (€300 million < L ≤
€10 billion) confirms this finding. Had there been a significant effect of the bank levy, banks
would have tried to reduce their contribution-relevant liabilities to below the €300 million
threshold. Yet Figure 3 shows that the share of banks coming close to the threshold did not
change substantively between 2011 and 2012. Therefore, in the short time window since the
introduction of the tax, no significant changes in banks’ business models seem to have taken
place. In addition, we performed Kolmogorov-Smirnov tests to compare the distribution of
each non-contribution relevant position (e.g., customer deposits or equity) underlying the
computation of the bank levy for 2011 and 2012. We do not report these results, for the sake
of brevity, but they showed that the bank levy had no significant effect on the balance sheet
structure of banks; banks did not actively change their business model to reduce the size of
their levy.

3.1.2. Development Loans and Trust Liabilities
Development loans (positions 1 and 4) have no direct counterpart in the Bundesbank’s
reporting scheme. As a proxy, we use the amount of trust liabilities.5 Even though this proxy
might not be perfect, it should not affect our results much. Column 4 of Table 1 shows that
trust liabilities account for only 0.35% of total liabilities. The impact on the final tax payment
is thus negligible.

3.1.3. Derivative Positions
Data about the derivatives of banks are not directly available. The year 2008 is the last year in
which derivatives data were reported, according to §36 of the accounting regulation for all
banks. To obtain derivative positions, we resort instead to the OTC derivatives statistics,
which reveal the derivative positions of banks, as reported to the Bank for International
Settlements (BIS). Only banks with nominal derivative exposures of more than €1,000 billion
must report their exposures to the BIS. In 2010 and 2011, five German banks fell into this
category and we refer to them as BIS banks.

The OTC derivative positions provide a useful approximation for calculating the bank levy,
for three reasons. First, in 2008, more than 90% of the overall derivative exposure was
accounted for by the BIS banks. Second, among the BIS banks, the OTC derivatives
accounted for almost 80% of total derivative exposures. Third, the OTC derivative exposure

5
  Development loans are not restricted to the “trust liabilities” position considered here. Instead, they could be
included in the “liabilities vis-à-vis banks” or “other liabilities vis-à-vis non-banks” positions; the trust liabilities
position might also contain positions that do not count as development loans.
13

of the BIS banks was almost unchanged between 2008 and 2010 (Figure 4). Assuming that
these results represent the general pattern of banks’ derivative exposures, and applying the tax
rate to the derivative exposure of non-BIS banks in 2008, we find that the effect on the size of
the bank levy of a non-BIS bank would have been negligible.

3.1.4. Results from the Calculation of the Bank Levy
Table 2 shows the results from calculating the bank levy. We distinguish the total payments
by bank group, the average payments per bank, and the number of contributing banks. We
present this information for both the full sample and the sample of MFI banks. As these
results reveal, the large commercial banks and head institutes of savings banks and credit
unions are the largest contributors. Together, their contributions account for more than 79%
of total revenues from the bank levy; the share increases to more than 82% for the subsample
of banks reporting within the scope of the MFI interest rate statistics. This result is consistent
with the finding that these banks had the largest share of contribution-relevant liabilities.

According to Column 1, the total revenue of the bank levy in 2011 across all contributing
banks summed to €529 million. The average contributing bank pays about €1.3 million. The
majority of German banks pay no levy at all though, and in 2011, overall proceeds from the
tax were small, accounting for only 3.7% of the banking system’s profits. Of the 1,803 banks
in our data set in 2011, only 81 were subject to the acceptability limit, according to our
calculations. This limit constitutes the upper bound for a bank’s contribution. If we were to
ignore the acceptability limit, the total contribution across all banks would have been €1.9
billion, or more than four times higher. Of the 81 contributing banks, 61 paid the minimum
contribution of at least 5% of the computed annual contribution. Considering the sample of
MFI banks only, the revenues are similar (€504 million), with higher average contributions
for each bank (€3.4 million), because the MFI banks are above-average in size (see Table 6).

Because we calculate, rather than observe, the payments by each bank, the quality of our
approximation method is crucial. In Table 3 we compare the results from our calculation of
the bank levy with numbers from official government sources. There are some deviations in
the absolute contributions for the group of commercial banks and head institutes of the
savings bank sector. Yet the relative contributions of each bank group to the total revenues of
the bank levy are close to the numbers published by the government. The deviations in the
absolute values might arise because we lack data about the derivative exposures of all banks.
Especially within the commercial banking sector and among head institutes of the savings
banks and credit unions, some derivative exposures might fall below the threshold of the OTC
derivatives statistics.

On average though, the derivative exposures of a bank play only minor roles in determining
the individual bank levy. Ignoring the bounds affecting the payments and considering only
banks reporting to the BIS, we find that almost 90% of the total bank levy is attributable to
14

contribution-relevant liabilities. Using 2008 data on the nominal derivative exposure of non-
BIS banks to approximate derivative positions in 2010, we determine that approximately 35%
of the bank levy would have been attributable to contribution-relevant liabilities and 65% to
the nominal derivative exposure. The reason is that non-BIS banks are mostly small banks
that do not have contribution-relevant liabilities of more than €300 million. Their obligation
to pay the bank levy thus would be based solely on their derivative positions. If we consider
only those non-BIS banks with contribution-relevant liabilities of more than €300 million, the
fraction of tax payments due to nominal derivatives declines to less than 4%. Quantitatively,
the average effect of the contribution arising from derivatives is of minor importance for the
average German bank.

3.1.5. How Does the Bank Levy Relate to Bank Characteristics?
One of the objectives behind the introduction of the bank levy is to charge higher levies on
banks that impose negative externalities on systemic stability. Larger banks and more
interconnected banks tend to be systemically more important (e.g., Altunbas et al. 2011;
Arinaminpathy et al. 2012; Drehmann and Tarashev 2011, 2013; Haldane 2012).

Table 4 relates the bank levy to bank sizes and other characteristics that might influence bank
stability. The design of the tax makes it unsurprising to observe a positive relationship
between bank size and tax payments. This is in line with the finding of Schweikhard and
Wahrenburg (2013). If we assume bank size is a reasonable indicator of the risk of a bank and
its contribution to systemic risk, this result supports the design of the levy. The correlations
by bank group in Table 4 reveal that the high correlation with bank size is driven by savings
banks and credit unions; the correlations are lower for large commercial banks or head
institutes of savings banks and credit unions, for which the levy is more likely to be capped by
the acceptability limit. Considering the share of funding through customer deposits, we find a
negative relationship with tax payments. This arises because customer deposits constitute a
non-contribution-relevant balance sheet position and the objective of the bank levy is to tax
market-based funding and implicitly leverage. For all other variables, the correlations are
small. Again, the patterns in the data are similar for both the full sample and the subsample of
MFI banks.

3.2   Data on Bank Loans and Interest Rates
In the short run, the most important channel of adjustment to the introduction of the bank levy
is an increase in lending rates or a reduction in loans. Figures 2 and 3 already showed that
there was little evidence of a structural adjustment of funding sources, which is reasonable,
considering the short time period. Yet even in the short run, banks might react by changing
deposit rates, even if the net effect is not clear. On the one hand, higher deposit rates might
15

attract new customer deposits and funds exempted from the tax. On the other hand, lower
deposit rates would compensate for higher funding costs through the levy.

To obtain information on banks’ interest rates on new loans and new deposits, we resort to the
Bundesbank’s MFI interest rate statistics. These statistics cover lending to and borrowing
from the private non-financial sector such that we can analyze the effects of the bank levy on
interest rates and new loans. We complement these data with balance sheet information on
loans and assets. To assess the impact of the levy on loans, we use four variables: (1) log of
new loans from the MFI interest rate statistics, (2) log of total loans (stocks from the balance
sheet statistics), (3) total loans scaled by a bank’s total assets, and (4) log changes in the stock
of loans. Interest rate data on new loans are available for all new loans issued by banks, as
well as for loans with short-term (less than 1 year), medium-term (1-5 years), and long-term
(over 5 years) maturity. In addition, we have interest rate data on new deposits for all newly
received deposits, disaggregated by maturity (i.e., overnight, short-term (less than 1 year) or
medium-term (over 1 year) deposits).

Table 5 contains summary statistics for these variables, for all banks and for only the banks
reporting to the MFI interest rate statistics. The latter set shows significantly higher mean
loans of €20,000 million, versus €2,193 million for the full sample. The results obtained from
the MFI interest rate statistics thus are representative of larger banks in the market. Smaller
banks (exempted from the levy anyway) are underrepresented in this sample. Nevertheless,
the two groups of banks are similar in their other structural characteristics: The ratio of loans
to total assets is almost identical (70%), as is the average annual growth rate of loans (Table
5). Table 6 also contains a comparison of key bank characteristics, such as capital and
liquidity ratios or profitability, and affirms their similarity.

3.3     Bank-Level Control Variables
We calculate the bank-level control variables on the basis of the CAMEL rating system, as
employed by regulators in the United States to assess the overall state of a bank. We use data
on individual banks’ balance sheets, income statements, and supervisory information to
construct variables that proxy for capital adequacy (C), asset quality (A), management quality
(M), earnings (E), and liquidity (L).

Because we have access to supervisory information, we obtain high quality data about a
bank’s level of Tier 1 capital relative to risk-weighted assets which constitutes our capital
adequacy variable (Tier 1 capital ratio).6 To proxy for the quality of a bank’s asset portfolio,

6
  Before 2007, a bank’s Tier 1 capital ratio was calculated as the ratio between Tier 1 capital and risk-weighted
assets. Since 2008, it has been calculated relative to the own funds requirements (Eigenmittelanforderungen) of a
bank. During the transition period in 2007, banks could choose to report either risk-weighted assets or own funds
requirements. Ex-post, we cannot differentiate whether a bank reported according to the pre-2007 or post-2007
reporting standard. Therefore, we chose not to calculate a Tier 1 capital ratio for 2007.
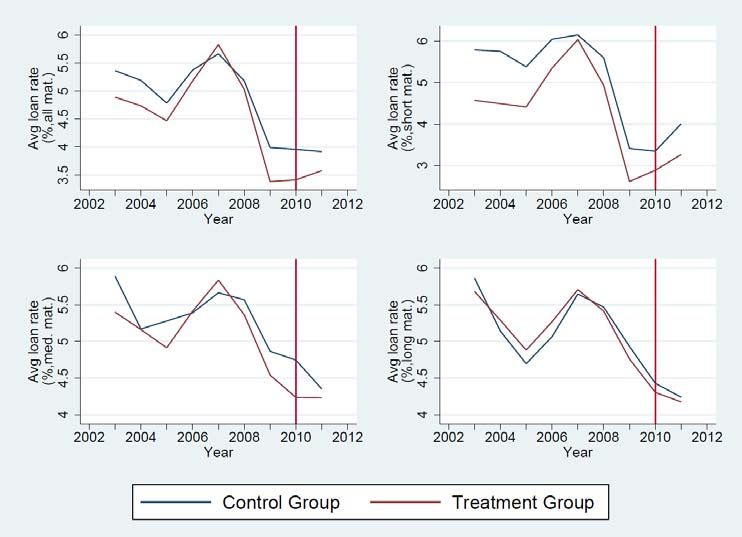
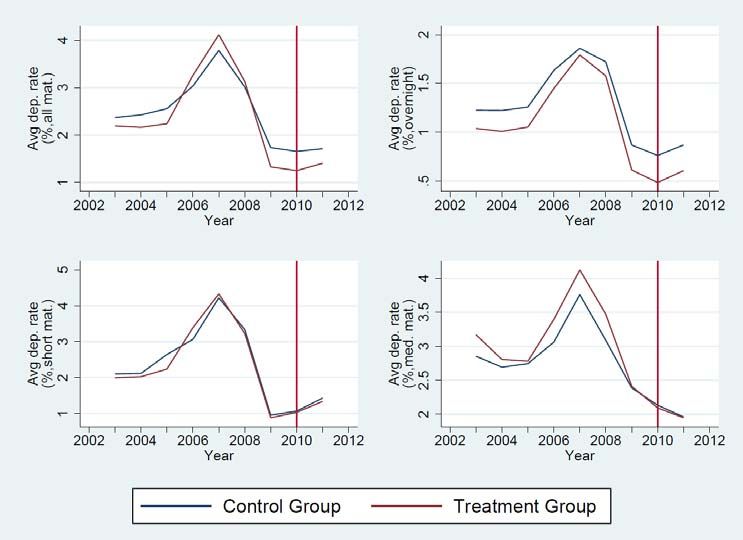
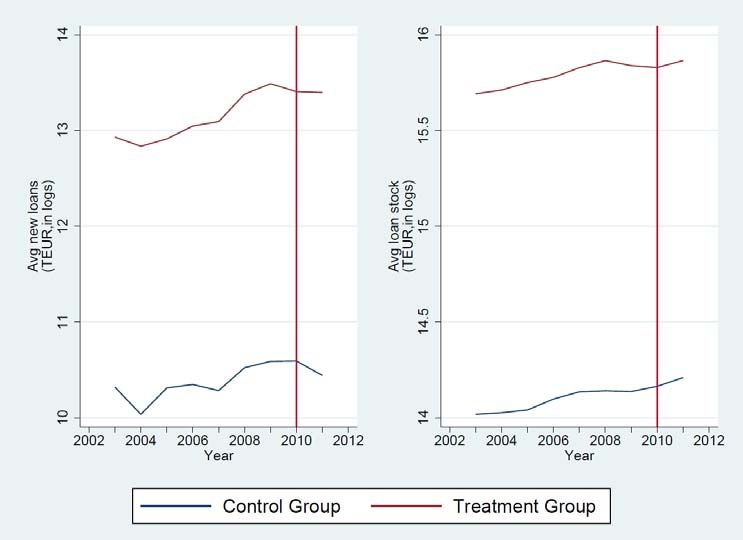
16

we resort to a bank’s write-offs relative to the size of its overall loan portfolio (non-
performing loans [NPL] ratio).7 To measure the quality of a bank’s management team, we
use the cost-to-income ratio. Return on assets (RoA) serves to measure the profitability of the
bank. Finally, the sum of cash, deposits with the central bank, and overnight deposits relative
to total assets provides a proxy of the liquid resources of a bank (liquidity ratio). In addition,
we control for bank size by including the logarithm of total assets.

Table 6 contains summary statistics for these variables for all banks in the sample, from 2003
to 2011. To winsorize the CAMEL variables, we replace the highest and lowest 1% of
observations with the respective thresholds. For the cost-to-income ratio, only the highest 1%
of all observations is replaced. Banks with missing values for total assets are excluded from
the sample.

Information on the subset of banks in the MFI interest rate statistics appear in the right panel
of Table 6. The main difference between the two samples of banks is that the MFI banks are
larger, with mean assets of €34.80 billion, compared with €3.66 billion for the full sample.

4     Regression Results

Did German banks reduce the amount of (newly issued) loans to the private sector after the
introduction of the bank levy? Did treated and non-treated banks adjust loan and deposit rates
differently? To answer these questions, we analyze whether key activities of banks changed
after the implementation of the levy in 2011, and we compare treated and non-treated banks.
We employ a difference-in-difference approach to exploit the variation over two dimensions:
the times before and after the introduction of the bank levy and banks that had to pay and
those that did not.

4.1    Baseline Empirical Model
A difference-in-difference approach requires two conditions. First, the introduction of the
bank levy should not have been anticipated by the banks; otherwise, they could have adjusted
their balance sheets before the introduction of the tax to pay smaller contributions or evade
the tax entirely. In this case, the effects on banks’ activities resulting from the imposition of
the levy could not be identified. We exploit the substantial uncertainty surrounding the
implementation of the tax, in terms of the banks that would be covered and the precise
specification of the tax payments. In addition, the levy was applied in retrospect to banks’
balance sheets. As discussed in detail in Section 2.1, the German bank restructuring law
passed in December 2010, the regulation was approved in July 2011, and by August 2011,

7
  Before 2009, only loans to the non-financial private sector with specific provisions were considered; after 2009,
loans to both the financial and non-financial private sectors were included.
17 banks had to deliver, for the first time, information about their tax base, according to their 2010 balance sheet data. Second, we must assume that differences in the means between the control and the treatment group would have remained constant, without this change in regulation. In the absence of the treatment, the trend between the two groups should have remained the same. Hence, any differences in the behavior of banks in the control versus treatment group should be due solely to the tax. This common trends assumption cannot be tested; ideally, banks in the control and the treatment group show similar characteristics. To control for confounding factors and remaining differences across banks in the two groups, our empirical model allows for time and bank-fixed effects, as well as bank-specific controls. Furthermore, according to Figure 5, before the introduction of the levy, the loan volumes and interest rates of banks in both control and treatment group evolved similarly. With these assumptions, our baseline regression equation thus is: yit i t * ChargedBank * After 2010 ' xit -1 it (1) where the dependent variable yit refers to bank loans or bank interest rates. We include time- invariant bank fixed effects (αi); γt captures time effects common to all banks. Charged Bank is an indicator variable, equal to 1 if the bank is subject to the tax (i.e., has contribution- relevant liabilities higher than €300 million) and 0 otherwise. After 2010 is an indicator variable taking a value of 1 after the regulatory change (2011) and 0 otherwise (2003–2010). We define xit-1 as a vector of controls for time-varying bank characteristics, lagged by one period to avoid simultaneity. The coefficient of interest is δ, which reveals whether banks subject to the tax changed their behavior significantly after the change in regulation compared with banks that fall below the contribution threshold. Tables 7–9 show the results for estimating Equation (1) and pooling the data across all banks reporting to the MFI interest rate statistics. We distinguish results for loans (Table 7), interest rates on new loans (Table 8), and interest rates on new deposits (Table 9). For the interest rates, we also analyze different maturities. For the sample of MFI banks, there is no significant effect of the bank levy on loans or interest rates. Banks that must pay the levy did not change their behavior significantly compared with banks in the control group. These results are robust to considering only post-crisis observations since 2008 or simply testing differences in means across banks in the control and treatment group and the years 2010 (before the introduction of the bank levy) and 2011. With regard to the impact of the control variables, lending increases with bank size. This effect is non-linear and levels off as banks grow larger. Larger banks also charge lower loan rates and pay higher deposit rates. Again, the effect is non-linear and reverses for larger banks. Most CAMEL variables are insignificant, suggesting that differences across banks are absorbed largely by the bank fixed effects. If anything, more profitable banks lend more. The
18
higher the share of non-performing loans in the portfolio and the less efficiently a bank is
managed, which implies a higher cost-to-income ratio, the lower are loans.
The result that the bank levy has no significant impact on bank behavior is not very surprising.
After all, only a few banks actually pay the levy, and the final payments are small. We
therefore explore whether banks that are affected more by the levy—because they have higher
market shares or pay higher levies—change their behavior. For the former, we measure the
pricing power of banks simply by asking whether banks with a higher market share (and thus
presumably greater pricing power) react more to the levy (Section 4.2). We then employ a
similar difference-in-difference model as above but distinguish banks with high versus low
contribution-relevant liabilities (Section 4.3).
4.2 Impact of Banks’ Market Shares
The response of banks to the levy may depend not only on whether they pay levies but also on
their market power and their ability to roll over higher funding costs. Banks with higher
market shares might find it easier to maintain loan supplies, despite increased funding costs.
These banks might also be able to shift higher costs to their customers by increasing loan rates
and/or lowering deposit rates. To identify whether the relative asset position of a bank in the
market affects its behavior in response to the bank levy, we run the following regression:
yit i t * ChargedBank * After 2010 * ChargedBank * After 2010 *
MarketSharei,mean03-10 ' xit -1 it (2)
which includes an additional interaction term between the indicator variable for being treated
after 2010 and the market share averaged over the period 2003–2010.8 We deliberately choose
a long time window to calculate the market shares of banks, because we want to avoid
capturing the short-run impact of the crisis. A bank’s market share is the total assets ait of
bank i relative to the sum of total assets of all banks in the data set at time t, that is,
MarketShareit=ait/Σi=[1,…,N] ait.
Table 10 displays the regression results using the loans as the dependent variable. Consistent
with previous results, banks subject to the levy do not differ significantly in their lending
decisions compared with non-treated banks. However, the interaction term between a bank’s
market share and the bank levy dummy is significant: Banks subject to the bank levy in 2011
and with a higher market share provide fewer loans relative to banks that did not pay the tax.
The significance of this finding is limited to regressions that focus on the level of the loan
stock, whether the total lending volume (Column 2) or the size of the loan portfolio relative to
a bank’s assets (Column 3) is used as the dependent variable. This result might suggest the
cancellation of old, non-profitable loans. In unreported regressions, we split the sample by
8
We did not include market shares in the previous regressions, because they are highly correlated with total
assets.19
bank group and find that the result is driven mainly by the savings banks and credit unions, as
well as their head institutes. Focusing on this group of banks, we find a significant, negative
effect for both the total loan portfolio and the lending decision with respect to newly issued
loans.9
Table 11 reveals that banks subject to the levy and with a higher market share charge higher
loan rates than banks in the control group. The result holds in particular in cases in which we
do not differentiate between maturities and for short-term loans. Focusing on deposit rates, we
can see from Table 12 that banks paying the tax and that are larger in relative size offer lower
interest rates for new overnight deposits and deposits with a maturity of up to one year,
relative to banks in the control group.
4.3 Impacts of the Size of the Bank Levy
A larger market share correlates positively with bank size such that the results in Section 4.2
might capture not only the effects of the greater pricing power of banks but also higher tax
payments. In this section, we thus test whether differences in the responses of banks to the
levy are linked to the absolute size of the payment. We compare differences in the adjustment
across banks that meet different thresholds for contribution-relevant positions. We again use a
difference-in-difference approach but focus only on banks with contribution-relevant
liabilities higher than €300 million. Thus, we can compare banks that represent higher
intervals with banks that fall under lower thresholds, implying lower tax rates. Otherwise, the
identification is identical: We compare the times before and after the introduction of the bank
levy. The regression equation also is similar:
yit i t * ChargedBank high * After 2010 ' xit -1 it (3)
Here though, our interest is in the coefficient δ of the interaction term Charged Bank high *
After 2010, where Charged Bank high is an indicator variable that takes a value of 1 if the bank
meets the contribution threshold above €10 billion or 0 if the bank’s contribution-relevant
liabilities are higher than €300 million but smaller than or equal to €10 billion. Alternatively,
we could control directly for the size of the tax payment. However, as we lack full
information on the relevant positions to be taxed, doing so might cause a measurement bias.
In contrast, we have all necessary data to compute contribution-relevant liabilities such that
constructing a dummy based on this component eliminates such concerns.
In Tables 13–15, we present the regressions, as specified in Equation (3). This sample
includes only those banks with contribution-relevant liabilities greater than €300 million,
based on December 2010 balance sheet data. Within this sample, we analyze whether the
effect of the bank levy changes with the size of contribution-relevant liabilities. Finding a
significant coefficient for the term Charged Bank high * After 2010 for example would suggest
9
For brevity, these results are not reported here but can be obtained on request.You can also read