Debt Investor Presentation - August 2020 John Stilmar, Investor Relations (678) 538 1983
←
→
Page content transcription
If your browser does not render page correctly, please read the page content below
Contact:
       Debt Investor Presentation                                John Stilmar, Investor Relations
                                                                 jstilmar@aresmgmt.com
       August 2020                                               (678) 538 - 1983

Ares Capital Corporation - Not for Publication or Distribution
Disclaimer
IMPORTANT NOTICE:
Statements included herein may constitute “forward-looking statements,” which may relate to future events or the future performance or financial condition of Ares Capital Corporation
(“ARCC”), its investment adviser Ares Capital Management LLC (“ACM”), a subsidiary of Ares Management Corporation (“Ares Management”), or of Ares Management. These statements are
not guarantees of future results or financial condition and involve a number of risks and uncertainties. Actual results and conditions may differ materially from those in the forward-looking
statements as a result of a number of factors, including those described from time to time in the filings of ARCC and Ares Management with the Securities and Exchange Commission (“SEC”).
These factors include, but are not limited to the effects of the COVID-19 global pandemic.
The information contained in this presentation is summary information that is intended to be considered in the context of the SEC filings of ARCC and Ares Management and other public
announcements that ARCC or Ares Management may make, by press release or otherwise, from time to time. Neither ARCC nor Ares Management undertakes any duty or obligation to
publicly update or revise the forward-looking statements or other information contained in this presentation. These materials contain information about ARCC, ACM and Ares Management,
and certain of their respective personnel and affiliates, information about their respective historical performance and general information about the market. You should not view information
related to the past performance of ARCC, ACM or Ares Management or information about the market, as indicative of future results, the achievement of which cannot be assured.
Nothing in these materials should be construed as a recommendation to invest in any securities that may be issued by ARCC or Ares Management or as legal, accounting or tax advice. None
of ARCC, ACM, Ares Management or any affiliate of ARCC, ACM or Ares Management makes any representation or warranty, express or implied, as to the accuracy or completeness of the
information contained herein and nothing contained herein shall be relied upon as a promise or representation whether as to the past or future performance. Certain information set forth
herein includes estimates and projections and involves significant elements of subjective judgment and analysis. Further, such information, unless otherwise stated, is before giving effect to
management and incentive fees and deductions for taxes. No representations are made as to the accuracy of such estimates or projections or that all assumptions relating to such estimates
or projections have been considered or stated or that such estimates or projections will be realized.
These materials may contain confidential and proprietary information, and their distribution or the divulgence of any of their contents to any person, other than the person to whom they
were originally delivered and such person’s advisers, without the prior consent of ARCC, ACM or Ares Management, as applicable, is prohibited. You are advised that United States securities
laws restrict any person who has material, non-public information about a company from purchasing or selling securities of such company (and options, warrants and rights relating thereto)
and from communicating such information to any other person under circumstances in which it is reasonably foreseeable that such person is likely to purchase or sell such securities. You
agree not to purchase or sell such securities in violation of any such laws.
These materials are not intended as an offer to sell, or the solicitation of an offer to purchase, any security, the offer and/or sale of which can only be made by definitive offering
documentation. Any offer or solicitation with respect to any securities that may be issued by ARCC, Ares Management or any of their affiliates will be made only by means of definitive
offering memoranda or an effective registration statement, which will be provided to prospective investors and will contain material information that is not set forth herein, including risk
factors relating to any such investment.
S&P Disclaimer Notice
This may contain information obtained from third parties, including ratings from credit ratings agencies such as Standard & Poor’s. Reproduction and distribution of third party content in any
form is prohibited except with the prior written permission of the related third party. Third party content providers do not guarantee the accuracy, completeness, timeliness or availability of
any information, including ratings, and are not responsible for any errors or omissions (negligent or otherwise), regardless of the cause, or for the results obtained from the use of such
content. THIRD PARTY CONTENT PROVIDERS GIVE NO EXPRESS OR IMPLIED WARRANTIES, INCLUDING, BUT NOT LIMITED TO, ANY WARRANTIES OF MERCHANTABILITY OR FITNESS FOR A
PARTICULAR PURPOSE OR USE. THIRD PARTY CONTENT PROVIDERS SHALL NOT BE LIABLE FOR ANY DIRECT, INDIRECT, INCIDENTAL, EXEMPLARY, COMPENSATORY, PUNITIVE, SPECIAL OR
CONSEQUENTIAL DAMAGES, COSTS, EXPENSES, LEGAL FEES, OR LOSSES (INCLUDING LOST INCOME OR PROFITS AND OPPORTUNITY COSTS OR LOSSES CAUSED BY NEGLIGENCE) IN
CONNECTION WITH ANY USE OF THEIR CONTENT, INCLUDING RATINGS. Credit ratings are statements of opinions and are not statements of fact or recommendations to purchase, hold or sell
securities. They do not address the suitability of securities or the suitability of securities for investment purposes, and should not be relied on as investment advice.
Bank of America Disclaimer Notice
This may contain information sourced from Bank of America, used with permission. BANK OF AMERICA IS LICENSING THE ICE BOFA INDICES AND RELATED DATA “AS IS,” MAKES NO
WARRANTIES REGARDING SAME, DOES NOT GUARANTEE THE SUITABILITY, QUALITY, ACCURACY, TIMELINESS, AND/OR COMPLETENESS OF THE ICE BOFA INDICES OR ANY DATA INCLUDED IN,
RELATED TO, OR DERIVED THEREFROM, ASSUMES NO LIABILITY IN CONNECTION WITH THEIR USE, AND DOES NOT SPONSOR, ENDORSE, OR RECOMMEND ARES MANAGEMENT, OR ANY OF ITS
PRODUCTS OR SERVICES.
REF: DLUS-00780
Ares Capital Corporation - Not for Publication or Distribution 2ARCC is a Leader in Middle Market Lending
ARCC is one of the largest direct lenders with the scale and capabilities necessary to successfully invest
across a variety of market environments, including a downcycle
• Externally managed by Ares Management
• Large U.S. direct lender with $13.8 billion portfolio(1)
• Highly experienced and tenured team with 24 years average investing experience(2)
Scale, Team &
• Sizeable portfolio management team with extensive restructuring capabilities that seek to enhance
Capabilities
investment performance
• Disciplined underwriting process supports highly selective approach
• Incumbency creates differentiated investment opportunities
• Diversified, high quality, senior-oriented portfolio
Attractive Portfolio & • Less cyclically positioned investment portfolio focused on upper middle market
Robust Investment Track • Invested approximately $60 billion(3) with realized asset level gross IRR of 14%(4) since IPO
Record • 1.1% average annual net realized gains in excess of losses since IPO(5)
• 83% of portfolio companies are controlled by PE sponsors that we believe have significant resources to
support these businesses(6)
• Deep sources of liquidity and committed capital with $4.2 billion of available liquidity*
Strong Balance Sheet & • Fortified balance sheet with significant unsecured, long dated financing and low leverage
Liquidity • Leverage long-term capital to target attractive risk-adjusted returns
• Well-laddered debt maturities with no maturities until 2022
• Track record of generating strong returns to shareholders
Potential for Long Term
• Compelling historical investment and credit performance during periods of volatility
Shareholder Value
• 50% higher returns than the S&P 500 since IPO in 2004(7)
As of June 30, 2020, unless otherwise stated. Past performance is not indicative of future results. Please see notes at the end of this presentation for additional important information.
*Proforma for issuance of $750 million aggregate principal amount of 3.875% notes and associated repayments of outstanding revolving credit facilities with net
proceeds in July 2020.
Ares Capital Corporation - Not for Publication or Distribution 3Our Approach to Today’s Environment
How we invest and manage our portfolio in the current environment
Key Differentiators in the • Significant Scale and Dry Powder • Flexible Capital • Large and Experienced Restructuring Team
COVID-19 Environment • Defensive Investment Posture • Use Lead Position to Drive Outcomes • Information Advantages Across Global Platform
• We fundamentally believe that credit selection, sector avoidance and maintaining lead positions are paramount to help
Remain Selective and mitigate risk and construct investment portfolios that can withstand market shocks
Prudent • Leverage experience and approach through prior cycles to drive long-term outperformance
• Remain patient, constructive and prudent
• Incumbency allows for greater visibility into a company’s earnings profile and transparency as we re-underwrite risks
Supporting Our Existing • Re-underwrite investments to assess risk of further deterioration
Borrowers • Address liquidity needs/ confirm capitalization
• Monitor revolver and DDTL drawings
• Identify areas to strengthen documentation and adjust pricing where possible
Identify Opportunities to • Ask financial sponsors to support their investments with additional equity capital for liquidity if needed
Reprice / Reduce Risk • If prudent, provide additional capital to protect investment
• Be flexible -- different situations require different solutions
• Engage across the entire Ares platform to enhance our view on relative value across capital structures
Collaborate Across the • Share intellectual capital across strategies to inform market views and generate deep business insights
Ares Platform • Utilize cross platform resources for industry knowledge and operational expertise
• Overcommunicate and remain collaborative
Ares Capital Corporation - Not for Publication or Distribution 4ARCC’s Positioning and Team Advantages Ares Capital Corporation - Not for Publication or Distribution
Overview of Ares Management
       With approximately $165 billion1 in assets under management, Ares Management Corporation is a
       global alternative investment manager operating integrated businesses across Credit, Private
       Equity, Real Estate and Strategic Initiatives

        Profile                                                                                    Global Footprint3
        Founded:                                                               1997
        AUM:                                                              $165bn1
        Employees:                                                          1,410+
        Investment Professionals:                                              ~495
        Global Offices:                                                         25+
        Direct Institutional Relationships:                                    1,020+
        Listing: NYSE – Market Capitalization2:                          ~$10.6bn

         The Ares Edge                                                                                          Credit                 Private                 Real Estate                Strategic
                                                                                                                                       Equity                                            Initiatives
          Founded with consistent                 Deep management team
          credit based approach to                with integrated and                                        $117.4bn                 $26.6bn                   $14.4bn                   $6.9bn
          investments                             collaborative approach
                                                                                                                                   Corporate Private
                                                                                                             Direct Lending                                   Real Estate Equity           Ares SSG
                                                                                                                                        Equity
                                                                                                                                       Special
                                                                                               Strategies

          20+ year track record of                Pioneer and a leader in                                     Liquid Credit
                                                                                                                                     Opportunities
                                                                                                                                                               Real Estate Debt
          compelling risk adjusted                leveraged finance and
          returns through market                  private credit                                                                       Energy
                                                                                                            Alternative Credit
                                                                                                                                     Opportunities
          cycles
                                                                                                                                     Infrastructure
                                                                                                                                       and Power

Note: As of June 30, 2020. AUM amounts include funds managed by Ivy Hill Asset Management, L.P., a wholly owned portfolio company of Ares Capital Corporation and registered
investment adviser. Information provided is as of June 30, 2020 and pro forma for Ares Management’s acquisition of SSG Capital Holdings Limited (“SSG”), which closed on July 1, 2020.
Past performance is not indicative of future results.
(1) Includes approximately $6.9 billion of AUM as of June 30, 2020 pro forma for the acquisition of SSG, which closed on July 1, 2020.
(2) As of August 3, 2020.
(3) Ares has a presence in Sydney, Australia through its joint venture, Ares Australia Management Pty Ltd (AAM), with Fidante Partners Limited, a wholly owned subsidiary of
      Challenger Limited.
Ares Capital Corporation - Not for Publication or Distribution                                              6
Leading Investment Team
We believe ARCC benefits from a large, long tenured and highly experienced team with significant
experience in direct lending and extensive middle market knowledge
• ARCC’s Team Brings • Members of the Investment Committee
Invested ~$60 billion across ~1,300+ transactions
since 2004 (1)
Knowledge Experience
24 years average investing experience (2)
Investment Committee members
average tenure at Ares of 15 years
Cycle-tested team
Tenure Consistency
• Investment Team
~140 Investment Professionals
Largest Industry Investment Team(3)
Scale Accountability
Responsibility and accountability over
the entire life of an investment
As of June 30, 2020. Past performance is not indicative of future results.
(1) Includes invested capital from inception on October 8, 2004 through June 30, 2020. Includes investments made through Ares Capital Corporation, the Senior Secured
Loan Program and the Senior Direct Lending Program. Excludes sales within one year of origination, $1.8 billion of investments acquired from Allied Capital on April 1,
2010 and $2.5 billion of investments acquired from American Capital on January 3, 2017.
(2) Average number of years investing for all Investment Committee members.
(3) Based on Ares’ observation of the market.
Ares Capital Corporation - Not for Publication or Distribution 7Experience Managing Through Multiple Cycles
Consistent and rigorous investment approach through both benign investment environments as well as
prolonged cycles
Key Success Factors During • Distressed Investment Expertise • Defensive Investment Posture • Long Dated, Locked up Capital
the Great Financial Crisis • Opportunistic Acquisitions • Flexible Strategies • Insulated from Outflows
Net Realized Gain/(Loss) of ARCC (1) and BDC Peers (2)
Investing to Drive Differentiated Performance ARCC Outperformance vs. Peers
• ARCC is one of few BDCs with experience through CY2008 CY2009 CY2010 CY2011 CY2012 CY2013
multiple cycles +0.5% +5.7% +5.3% +3.6% +1.3% +1.2%
• Leveraged our flexible capital to drive long-term
outperformance by (i) protecting and supporting our 1.3%
2.1%
0.9% 1.0%
existing portfolios and (ii) selectively targeting attractive 0.3%
risk-adjusted opportunities in high quality companies -0.2% -0.2%
-0.4%
-2.0% -1.5%
• Generated attractive returns through the last downturn
-4.0%
with minimal losses ARCC
-7.7% BDC Peers
Opportunistic Platform and Portfolio Acquisitions are
Supported by Our Deep Available Liquidity ARCC Track Record for Companies
Allied Capital Acquisition(3) Where We Took Control(6)
• Successful acquisition of Allied Capital (“ALD”) highlights Ares’
history of closing opportunistic transactions during periods of
$5 $196 MM gain at closing
market volatility Realized 18% IRR (4,5) $4.4 30% 2.0x
1.6x
$4
Asset Size ($ in B)
• Our patient capital and strong balance sheet allowed us 1.5x
$3 20%
to complete the Allied acquisition during volatile $2.4 13%
1.0x
markets and drive strong returns from the acquired $2
10%
investments $1 0.5x
• Leveraged our information advantages and capital to $0 0% 0.0x
(3)
acquire a $2 billion portfolio at a discount to fair value, ARCC Legacy ARCC/ALD Proforma Asset Level IRR MOIC
generating a realized IRR of 18% (4,5)
• Leveraged strong in-house restructuring capabilities and liquidity
position to take over companies when needed
Past performance is not indicative of future results. Please see notes at the end of this presentation for additional important information.
Ares Capital Corporation - Not for Publication or Distribution 8Differentiated Portfolio Management Capabilities and Focus
• No comparable sized portfolio management team amongst any other direct lending manager in U.S.(1)
• 25 person dedicated portfolio management • Ares has spent a significant amount of
team is enhanced by Ares firm wide time and effort creating a web based
resources such as legal, industry experts, etc. platform which enhances access, speed
• 8 have restructuring experience and quality of information
• Team has deep capabilities:
• System architecture provides
• Restructuring Large Portfolio Proprietary extensive reporting capabilities and
• Valuation Management Technology data to support investment and
portfolio management decisions
• Due diligence Team
• Investment teams work • Be early, be smart, be flexible
alongside portfolio Active Extensive Workout
• Led by two senior professionals
management team once loan is Management Restructuring with average 29 years direct
originated – life of loan approach Approach Experience restructuring experience,
including average 13 years at Ares
• Ongoing dialogue with company and
sponsors/owners • Deep ability to protect capital while
avoiding unnecessary damage to sponsor
• Ares Management provides operational and relationships
informational advantages to maximize value • Generated net positive realized gains vs. losses since
inception
As of June 30, 2020, unless otherwise noted. Past performance is not indicative of future results.
(1) Based on Ares’ observation of the market.
Ares Capital Corporation - Not for Publication or Distribution 9ARCC Has an Attractive Profile for
All Stakeholders
Ares Capital Corporation - Not for Publication or DistributionKey Elements to Our Investment Approach
We believe a credit-focused investment approach supports our 15 years of leading performance
Fundamentally Strong
Attractive Industries
Companies
• Resilient, non-cyclical industries
• Leading market share positions
• Strong entry barriers
• Companies with long-term staying power
Upper Middle Market Focus Highly Selective
• Enhanced stability of borrowers • Wide funnel with high selectivity
• Average EBITDA of $83.9 million(1,2) • Average ~4% closing rate(3)
Acute Risk Management Benefits of Scale
• Highly diversified portfolio • Benefits of incumbency
• Seek control / lead positions • Ability to be a meaningful financing
partner
As of June 30, 2020. Past performance is not indicative of future results
Please see notes at the end of this presentation for additional important information.
Ares Capital Corporation - Not for Publication or Distribution 11Highly Diversified and Predominately Senior Secured Portfolio
Attractively positioned $13.8 billion(1) highly diverse portfolio with significant downside protection
80% Senior Secured Loans(2) Average Position Size 0.3%(3) Largest investment is 3%(4)
Portfolio by Asset Class(1) Issuer Concentration(1)
8% 6%
5% 5%
3%
7% 2%
2%
2%
2%
44% 2%
6% 2%
1%
73%
30%
(5)
First Lien Senior Secured Loans - 44% Senior Direct Lending Program, LLC - 6% Ivy Hill Asset Management, L.P. - 5%
Second Lien Senior Secured Loans - 30% Athenahealth, Inc. - 3% GHX Ultimate Parent Company - 2%
Senior Direct Lending Program, LLC - 6% (5) Singer Sewing Company - 2% The Ultimate Software Group, Inc. - 2%
Senior Subordinated Loans - 7% Mac Lean-Fogg Company - 2% Ministry Brands, LLC - 2%
Preferred Equity - 5% IRI Holdings, Inc. - 2% Air Medical Group Holdings, Inc. - 1%
Other Equity - 8% Remaining Investments - 73%
Diversification does not assure profit or protect against market loss.
Please see the notes at the end of this presentation for additional important information.
Ares Capital Corporation - Not for Publication or Distribution 12Industry Selection Supports High Quality Credit Portfolio
Focus on selecting defensively positioned companies in less cyclical industries
High Yield and Leveraged Loan Industry Exposure to Cyclical
ARCC Portfolio by Industry (1) vs. Industries
6%
2% Hotel & Gaming Oil & Gas
2% 19%
2%
3% 13%
3%
4% 8%
7%
5% 3%
14% 3%
< 1%
6%
ARCC(2) High Leveraged ARCC(2) High Leveraged
Yield(3) Loans (4) Yield(3) Loans (4)
6% 8%
6%
7% 7%
Retailing & Distribution Media & Entertainment
7%
4% 4%
Healthcare Services - 19% Software & Services - 14%
2% 3%
Commercial & Professional Services - 8% Diversified Financials - 7%
Power Generation - 7% Senior Direct Lending Program - 6% (5) 1%
Consumer Services - 6% Consumer Durables & Apparel - 6%
Automobiles & Components - 5% Capital Goods - 4%
ARCC(2) High Leveraged ARCC(2) High Leveraged
Insurance Services - 3% Energy - 3% Yield(3) Loans (4) Yield(3) Loans (4)
Food & Beverage - 2% Retailing & Distribution - 2%
Materials - 2% Other - 6%
As of June 30, 2020, unless otherwise stated in Endnotes.
Please see the notes at the end of this presentation for additional important information.
Ares Capital Corporation - Not for Publication or Distribution 13Conservative Portfolio Company Credit Statistics
On average, our portfolio companies use moderate leverage and have strong interest coverage
Moderate portfolio company
Strong portfolio company
leverage with loan-to-values of Investing in larger companies
interest coverage
~50-55%(1)
8.0x $160.0
$138.9 $141.0
$135.1 $136.7 $135.0
7.0x $140.0
$121.8
5.7x 5.7x 5.7x 5.7x
6.0x 5.4x 5.5x $120.0
5.4x 5.4x
$99.0
5.0x $92.9 $100.0
$83.9
$75.4 $80.6
4.0x $70.9 $72.8 $80.0
$66.0
$61.3 2.9x
3.0x $54.1 2.7x $60.0
2.3x 2.3x
2.2x 2.1x 2.1x 2.2x
2.0x $40.0
1.0x $20.0
0.0x $0.0
Q3-18 Q4-18 Q1-19 Q2-19 Q3-19 Q4-19 Q1-20 Q2-20*
Portfolio Weighted Average EBITDA (2)(3)(4)
Portfolio Average EBITDA (2)(4)
Portfolio Weighted Average Total Net Leverage Multiple (2)(4)(5)
Portfolio Weighted Average Interest Coverage Ratio (2)(4)(6)
* For the portfolio companies included in the portfolio weighted average EBITDA data above (subject to additional exclusions described in the following sentence), the
weighted average EBITDA growth rate as of Q2-20 was approximately 1% on a comparable basis for the most recently reported LTM period versus prior year LTM period.
In addition to those portfolio companies excluded as noted, this calculation excludes 13 companies where prior year comparable data was not available. (7)
Please see the notes at the end of this presentation for additional important information.
Ares Capital Corporation - Not for Publication or Distribution 14ARCC’s Strong Historical Financial Results Ares Capital Corporation - Not for Publication or Distribution
ARCC Has Delivered Compelling Long Term Performance
       ARCC has a high quality portfolio and leading track record

              ~15 YEARS                              • ~15 year track record with cumulative net realized gains on ~$60 billion of capital invested,
         Length of Track Record                        resulting in strong interest and attractive dividend coverage (1)

                   +1.1%                             • ~$1.0 billion in cumulative net realized gains (our gains minus our losses) on investments (+1.1%
       Annual Net Realized Gains                       average annual net realized gains) with a consistent track record of generating net realized gains in
           Since Inception                             13 out of 15 years (2)

                 14% IRR
        On Realized Investments                      • 14% asset level gross IRR on $37 billion of realized investments since inception in 2004 (3)
            Since Inception

       430 bps Greater Net                           • Attractive 5 year net return on equity 430bps greater than the peer average (4)
             ROE than Peers

            50% HIGHER                               • 50% higher returns than the S&P 500 since IPO in 2004 (5)
              RETURN                                     ◦ Outperformed the S&P 500, BDC peers and representative bank index* (6)
     than the S&P500 since IPO

 As of June 30, 2020, unless otherwise stated.
 Note: Past performance is not indicative of future results.
 *Performance to indices and peers is shown for illustrative purposes only and may not be directly comparable. Please refer to Index Definitions for further information.
 Please see the notes at the end of this presentation for additional important information.

Ares Capital Corporation - Not for Publication or Distribution                                      16
Consistent Core Earnings and Return on Equity
ARCC has generated strong core earnings(1) and stable core ROE(2) since its IPO
Long standing track record of stable core ROE ranging We have out-earned our dividend with cumulative core
from ~8% to ~12% annually over the past 10 years earnings plus net realized gains since our IPO
Consistent Core Cumulative Core Earnings Plus Net Realized Gains vs.
Return on Equity (2) Cumulative Dividends (1)
14%
$8,000
12% $7,000
10% $6,000
8% $5,000
$ Millions
$4,000
6%
$3,000
4% $2,000
2% $1,000
0% $0
*
2004
2005
2006
2007
2008
2009
2010
2011
2012
2013
2014
2015
2016
2017
2018
2019
Q2-20 YTD
Cumulative Core Earnings Plus Net Realized Gains
Core Earnings ROE 10 Yr US T-Note Cumulative Dividends Declared
Note: All data as of June 30, 2020. There can be no assurance that dividends will continue to be paid at historic levels or at all. Past performance is not indicative of
future results. Please see notes at the end of this presentation for additional important information.
* Acquired ACAS on January 1, 2017.
Ares Capital Corporation - Not for Publication or Distribution 17Strong Credit and Investment Performance
ARCC’s net realized gain/(loss) rates have consistently outperformed BDC peers and banks
Since IPO in October 2004 through June 30, 2020: ARCC generated nearly 240 bps of average annual
incremental gain differential
vs. Peers(3) since 2004(4)
$1.0 billion
Cumulative realized gains generated in
Net Realized 1.20%
excess of losses
Gains(1)
Net realized gain/(loss) rate
0.80%
ARCC
0.40%
0.00%
Banks (5)
-0.40%
Average annualized net realized gain rate BDC (3)
1.1% Net Realized -0.80% Peers
on the principal amount of its
Gain Rate%(2)
investments -1.20%
-1.60%
ARCC Banks BDC Peers
Sources of Cumulative Net Realized Gains Since Inception(1)
Source Nature of Gains / Losses $ in mm
Restructuring Gains Primarily equity received in workouts ~$275
Acquired Portfolio Net Gains Effective monetization of controlled buyouts, CLOs and other investments ~$575
ARCC Equity Net Gains Primarily equity tags and minority equity investments ~$370
ARCC Other Debt Gains Primarily call protection and discount accretion ~$290
ARCC Debt Losses Relatively minimal losses through credit selection and loss avoidance ~($550)
Cumulative Net Realized Gains ~$960
Data as of June 30, 2020, unless otherwise noted in Endnotes.
Note: Past performance is not indicative of future results. Please see notes at the end of this presentation for additional important information.
Ares Capital Corporation - Not for Publication or Distribution 18ARCC Has a Compelling Track Record of Credit Performance
ARCC’s annual loss rate has been significantly better than the industry averages
ARCC Credit Experience Since Inception (1) First Lien Second Lien & Subordinated
Period Measured (1) 2004 – Q1-20 2004 – Q1-20
Significant Capital Deployed (1) $44 billion $13 billion
Meaningful Realizations 68% Realized 59% Realized
Long History of Investments 1,250+ Investments 300+ Investments
Leading Loss Performance < 10 bps (2) < 20 bps (3)
ARCC’s loss rates are well below industry averages
Subordinated Unsecured
3.0% Loans – 2.7%(6)
2.5%
2.0%
Loss Rate %
Broadly Syndicated
1.5% Middle Market Market Senior Loans -
Senior Loans - 0.9% (5)
1.0%
0.6% (4)
0.5% ARCC < 0.1%
ARCC < 0.2%
0.0%
First Lien Second Lien & Subordinated
As of March 31, 2020, unless otherwise stated.
Note: Past performance is not indicative of future results. Please see notes at the end of this presentation for additional important information.
Ares Capital Corporation - Not for Publication or Distribution 19Capital & Liquidity Ares Capital Corporation - Not for Publication or Distribution
ARCC Has Stable and Broad Sources of Financing
               Conservative balance sheet with a longstanding track record of accessing diverse sources of financing

                      Simple Balance Sheet with Significant Liquidity                                                  Strong Liability and Funding Construction
                           Q2-2020, Pro-Forma for July 2020 Activity
         $20,000                                                                                                                                            Available liquidity more
                                                                                                     $4.2 billion of available                              than 2.5x greater than
                                            $260                    Cash
         $18,000
                            $4.2b                                                                    liquidity(2)                                           unfunded investment
                            Total                    (2)
                                                                                                                                                            commitments
         $16,000                          $3,963                    Excess Borrowing
                        Available
                                                                    Capacity
                       Liquidity(2)
         $14,000
                                            $791                    Convertible Notes
         $12,000
                                          $4,580
                                                      (2)                                            ~80% of our assets are                                 Asset coverage for
                                                                    Unsecured Notes
$ Millions

         $10,000                                                                                     supported by unsecured                                 unsecured notes of
                                                                                                     debt and equity                                        2.4x(3)
             $8,000                                   (2)
                                          $2,127                    Secured Revolvers
             $6,000

             $4,000
                                          $6,583                     Equity                           Significant cushion to
                                                                                                                                                            No debt maturities until
                                                                                                      our regulatory and bank
             $2,000                                                                                                                                         2022
                                                                                                      leverage covenants
                 $-
                                      Outstanding (1)

  As of June 30, 2020, unless otherwise stated.
  (1) Represents the total aggregate principal amount outstanding as of June 30, 2020 and proforma for the unsecured note issuance and associated revolver paydowns in
        July 2020.
  (2) Proforma for issuance of $750 million aggregate principal amount of 3.875% notes and associated repayments of outstanding revolving credit facilities with net
        proceeds in July 2020.
  (3) Calculated as cash and cash equivalents plus investments at fair value pledged to secured facilities plus unencumbered investments at fair value less debt
        outstanding in secured facilities, all divided by unsecured notes outstanding.
   Ares Capital Corporation - Not for Publication or Distribution                                   21
Deep and Diverse Access to Debt Financing
Our deep bank and capital market relationships enhance our access to capital supported by our
investment grade ratings
Aggregate
Principal Weighted
ARCC Has Long Standing Investment Grade Ratings
Principal
($ in millions) Amount of Average Stated
Outstanding
Commitments Interest Rate (2) Current Rating
Outstanding (1)
Secured Revolving Facilities (3)
BBB
Revolving Credit Facility (4) $3,617 $1,651 L + 1.75%
Revolving Funding Facility(5) 1,525 763 L + 2.00%
SMBC Funding Facility (6) 725 453 L + 1.75%
Baa3
BNP Funding Facility(7) 300 - L + 2.75%
Subtotal $6,167 $2,867 BBB-
Unsecured Notes Payable
2022 Notes $600 $600 3.625%
2022 Convertible Notes 388 388 3.750% Banks Capital Markets
2023 Notes 750 750 3.500%
2024 Convertible Notes 403 403 4.625% Over 100 investors
2024 Notes 900 900 4.200% 40 banks across 4 have invested in our
March 2025 Notes 600 600 4.250% revolving facilities unsecured and
July 2025 Notes 750 750 3.250% convertible notes
2047 Notes 230 230 6.875%
Subtotal $4,621 $4,621 Raised $7.8 billion in
Efficient revolving debt
Total Debt $10,788 $7,488 unsecured and
facilities with up to 5
convertible notes since
Weighted Average Stated Interest Rate 3.27%(8) 3.372% year committed terms
2011
Debt / Equity Ratio, Net of Available
1.08x
Cash(9) Repaid $3.4 billion of
Bank facilities nearly 2x unsecured and
July 2020 Financing Activity: overcollateralized convertible notes since
*Issued $750 million 3.875% unsecured notes due in January 2026 2011
All data as of June 30, 2020, unless otherwise noted. Aggregate commitment and principal amounts are shown as of June 30, 2020 and do not reflect the $750
million aggregate principal amount of 3.875% Notes and associated Revolving Credit Facility and Revolving Funding Facility paydown with net proceeds in July
2020. The ratings noted herein may not be representative of any given investor’s experience. All investments involve risk, including loss of principal.
Please see the notes at the end of this presentation for additional important information.
Ares Capital Corporation - Not for Publication or Distribution 22Deep Sources of Liquidity and Well Laddered Maturities
Investment portfolio provides ample cash flows to support debt maturities
Sales & Repayments Sources of Liquidity
60% as a % of Portfolio at Amortized Cost $14,000
~$4.2 billion of
available borrowing
$11,720
50% $12,000 capacity(3)*
40% $10,000
*
30% $7,497 $6,090
$ Millions
$8,000
20% $2,127
$6,000
10%
$4,000
0% $4,580 $4,580 *
$2,000
$791
$- $791 $260
Outstanding (1) Committed Capacity (2)
Exits as % of Portfolio at Amortized Cost Average
Cash Convertible Unsecured Notes
Other Unsecured Notes Secured Revolving Facilities (3)
Contractual Maturities (4)
$3,500 Convertible Unsecured Notes (5)
$3,000 Other Unsecured Notes (6)(7)
$2,500 Secured Revolving Credit Facilities (8)(9)(10)
$1,674 *
$ Millions
$2,000
$1,500 No debt maturities * $453
until 2022
$1,000 *
$900
$600 $1,350
$500 $750 $980*
$388 $403
$-
2020 2021 2022 2023 2024 2025 Thereafter
Note: As of June 30, 2020, unless otherwise stated. Please see notes at the end of this presentation for additional important information.
*Proforma for July capital markets activity, including (i) issuance of $750 million aggregate principal amount of 3.875% notes and associated Revolving Credit Facility and
Revolving Funding Facility paydowns from net proceeds.
Ares Capital Corporation - Not for Publication or Distribution 23Strong Coverage Ratios
ARCC noteholders benefit from conservative liability structure and significant unencumbered assets
Strong Asset Coverage for Unsecured Notes (1) Significant Fixed Charge Coverage from Earnings (2)
4.5x 4.5x
4.1x
4.0x 4.0x 3.7x 3.8x
3.5x
3.5x 3.2x 3.5x 3.2x 3.2x 3.2x
2.9x 3.0x
3.0x 3.0x
2.5x 2.6x 2.6x
2.4x
2.5x 2.5x
2.0x 2.0x
1.5x 1.5x
1.0x 1.0x
0.5x 0.5x
0.0x 0.0x
2014 2015 2016 2017 2018 2019 Q2-20 2014 2015 2016 2017 2018 2019 Q2-20
Note: The use of leverage magnifies the potential for gain or loss on the amount invested and may increase the risk of investments.
(1) Calculated as cash and cash equivalents plus investments at fair value pledged to secured facilities and SBA debentures plus unencumbered investments at fair value less debt outstanding in
secured facilities, all divided by unsecured notes outstanding. As of the end of each given period.
(2) Calculated as the ratio of earnings to fixed charges where earnings represent net investment income excluding interest and facility fees, income taxes and capital gains incentive fees accrued in
accordance with GAAP, and fixed charges represent interest and facility fees. As of the end of each given period.
Ares Capital Corporation - Not for Publication or Distribution 24Conclusion Ares Capital Corporation - Not for Publication or Distribution
Conclusion
       We believe ARCC is well positioned to navigate the current environment

                                Defensively positioned portfolio
                                      Highly diverse portfolio with significant downside protection

                                Large and highly experienced team
                                      Significant experience managing through challenging times

                                 Robust portfolio management and restructuring infrastructure
                                      Large, experienced and specialized portfolio management and restructuring teams

                                 Strong balance sheet
                                        Deep sources of liquidity and significant overcollateralization

                                 No near-term debt maturities
                                       Able to focus our capital investing to support portfolio companies and opportunistically
                                       invest in new companies

                                 Track record
                                        Track record of successfully managing through volatile times to build value

 Past performance is not indicative of future results.
Ares Capital Corporation - Not for Publication or Distribution                      26
Appendix:
Additional Investment and Financial Considerations
Ares Capital Corporation - Not for Publication or DistributionWhy is Direct Origination Important?
1
Widens the Funnel to Provide For a Larger Deal Universe Selectivity
2
Primary Diligence on Thousands of Deals Reviewed Since Inception Potential for Better
Investing
3
Differentiated and
Increased Control Over Structures and Better Economics
Diversified Portfolios
4
Incumbency and Relationships Long-Term Annuity
Broad, direct origination is the core foundation of our disciplined investment strategy
Diversification does not assure profit or protect against market loss.
Ares Capital Corporation - Not for Publication or Distribution 28ARCC’s Portfolio Has Generated Higher Returns with Less Risk
Our investment strategy and competitive advantages have led to attractive returns with lower
volatility
Annualized Returns (Dividends & Change in NAV)(1)(2)
3 Years 5 Years Since IPO (2004)
11.0%
8.5% 8.5%
6.2%
5.4%
4.2% 3.7%
2.8% 3.2%
1.5% 1.6%
ARCC BDC Peers High Yield Loan Index ARCC BDC Peers High Yield Loan Index ARCC BDC Peers High Yield Loan Index
Index Index Index
Volatility of Annualized Returns (Standard Deviation of Dividends & Change in NAV)(1)(2)
3 Years 5 Years Since IPO (2004)
11.3% 10.9%
10.1%
9.4%
8.0% 8.1% 8.6%
7.8%
6.9% 6.9%
5.9%
4.7%
ARCC BDC Peers High Yield Loan Index ARCC BDC Peers High Yield Loan Index ARCC BDC Peers High Yield Loan Index
Index Index Index
As of March 31, 2020, unless otherwise stated. Past performance is not indicative of future results.
Please see the notes at the end of this presentation for additional important information. Please refer to Index Definitions for further information.
Ares Capital Corporation - Not for Publication or Distribution 29Cycle Tested with Differentiated Approach
ARCC’s team has deep experience and a leading track record in managing underperforming companies
Historical Core Non – Accruals(1)
Differentiated Approach
Percentage of Total Core Investment Portfolio
8% Pro-active portfolio management approach allows
us to seek most favorable outcomes that we
7% believe ultimately leads to stronger returns
6% Focus on larger, franchise businesses that we
believe will return to normal levels of profitability
5% post COVID
4%
Focus on lead agent positions allows us the ability
3% to positively influence outcomes
2%
In-house restructuring capabilities with strong
1% track record and limited loss rates
0%
Deep sources of liquidity provide ability to be
Q4 2004
Q3 2005
Q2 2006
Q1 2007
Q4 2007
Q3 2008
Q2 2009
Q1 2010
Q4 2010
Q3 2011
Q2 2012
Q1 2013
Q4 2013
Q3 2014
Q2 2015
Q1 2016
Q4 2016
Q3 2017
Q2 2018
Q1 2019
Q4 2019
Q2 2020
patient which we believe leads to better
recoveries
Non-Accrual at FV (exclud. ALD) Non-Accrual at Cost (exclud. ALD)
Since inception, we have realized total proceeds on non-accrual investments equal to more than 90% of the capital extended (2)
Past performance is not indicative of future results.
(1) As of period end. Excludes investments purchased in the Allied Acquisition.
(2) Includes all realized loans on non-accrual, as well as one loan that was on non-accrual and has a partial realized gain, recognized in accordance with U.S. GAAP.
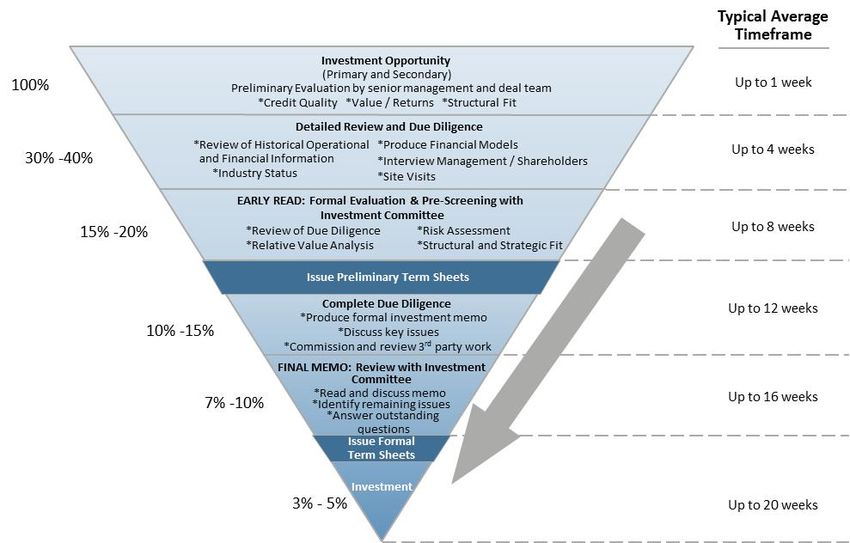
Ares Capital Corporation - Not for Publication or Distribution 30Rigorous Underwriting and Credit Management
Our in-depth process often spans several months, allowing for thoughtful decision making
Key Attributes of ARCC Borrowers (1)
Defensive oriented franchise businesses
High free cash flow
Above market growth prospects
Diverse sources of profitability
Premier financial sponsors with
meaningful “skin in the game”
Leading management teams
Appropriate capital structure
ARCC has lead role
Ares’ Approach:
• Seek to invest in leading, non-cyclical businesses with attractive growth prospects and high free cash flows
• Use direct origination and scale to provide greater influence on loan structures to maintain high selectivity
• Seek to be the lead lender with voting control to have the ability to impact outcomes
• Use incumbent positions to support growth of leading portfolio companies and to help enhance credit quality
• Be proactive managing investments and use our robust process to preserve capital and create value
(1) Not every investment meets each of the criteria.
Ares Capital Corporation - Not for Publication or Distribution 31ARCC’s Robust Valuation Process and Approach
Disciplined, Longstanding Process for Determining Portfolio Values
• 25 person dedicated portfolio management team provides portfolio monitoring and is responsible for managing the
quarterly valuation process
Valuation • Perspective is enhanced by the larger Ares platform including broader industry and deal data and capital markets
Team trends
• Our view of the market, based upon the ~1,600 middle market deals reviewed during 2019, provides further
insight on valuations
• Deal team and portfolio management team complete a valuation analysis and write-up on each portfolio company
on a quarterly basis
Internal • Initial recommendations for valuations are produced using widely recognized and utilized valuation
Valuation approaches and methodologies, including market approach, income approach, and / or cost approach
• Each valuation package is presented to the Investment Committee for approval with members of the investment
team and portfolio management team present
• Each portfolio investment is reviewed by one of our four independent valuation providers engaged by the Board of
Directors at least once during a trailing 12-month period (with certain de minimis exceptions)
• SDLP & IHAM are reviewed each quarter
• Some other portfolio companies may be selected to be reviewed more frequently(1)
Third Party
• At June 30, 2020, 69% of the portfolio was reviewed by an independent third party(2)
Valuation
• The independent valuation providers provide positive assurance with independent range of values on each
investment valuation reviewed
• In addition, our independent registered public accounting firm performs select procedures relating to our valuation
process within the context of performing the integrated audit
Final • All valuations are presented to the Board of Directors for review and final determination of fair value
Determination
As of June 30, 2020, unless otherwise noted.
(1) Companies that had an unrealized change greater than $10 million quarter-over-quarter.
(2) At fair value.
Ares Capital Corporation - Not for Publication or Distribution 32BDC Structure Offers Benefits to Creditors
We believe creditors benefit from the leverage restrictions and diversification requirements of the
BDC/RIC structure
BDCs are closed-end investment companies The BDC/RIC structure provides limitation on
regulated by the SEC leverage and requires portfolio diversification
• Created to encourage investment in small and middle market • Portfolio must be well diversified
companies
o No single investment can account for more than 25% of
total assets
• As of December 31, 2019, there were 53 publicly listed/active
BDCs with a total combined market capitalization of $33.7 o At least 50% of total assets must be comprised of
billion(1) individual holdings of less than 5% of total assets each
• ARCC has an asset coverage ratio requirement of at least 150%
• Make debt and equity investments with ability to invest across
(maximum debt to equity of approximately 2:1) in order to
a company’s capital structure
borrow or pay dividends
• Must generally invest at least 70% of assets in U.S. private • Required to pay at least 90% of annual taxable income as
companies or U.S. public companies with market dividends to shareholders to qualify as a Registered Investment
capitalizations under $250 million Company
o Portfolio must generate sufficient cash flows to pay
interest as well as dividends to equity investors junior to
debt holders
Ares Capital Corporation is the Largest BDC(2)
Diversification does not assure profit or protect against market loss.
(1) Source: SNL Financial and Wells Fargo securities.
(2) By total assets as of March 31, 2020 as not all BDCs have filed June 30, 2020 financial results as of August 5, 2020.
Ares Capital Corporation - Not for Publication or Distribution 33Reconciliation of Core Earnings
Reconciliations of Core Earnings to GAAP Earnings
For the years ended YTD
(in millions) 2012 2013 2014 2015 2016 2017 2018 2019 Q2-19 Q2-20
Core Earnings (1) $ 381 $ 442 $ 473 $ 486 $ 504 $ 592 $ 718 $ 807 $ 410 $ 341
Professional fees and other costs related to the — — — — (12) (40) (3 ) — — —
American Capital Acquisition (2)
Ares Reimbursement (3) — — — — — — 12 — — —
Net realized and unrealized gains (losses) 159 58 153 (129) (20) 156 164 (18) 5 (734)
Incentive fees attributable to net realized and (32) (11) (29) 27 5 (41) (33 ) 4 (1) 58
unrealized gains and losses
Income tax and other expenses related to net realized — — (6) (5) (3) — — —
and unrealized gains and losses — —
GAAP Earnings $ 508 $ 489 $ 591 $ 379 $ 474 $ 667 $ 858 $ 793 $ 414 $ (335)
(1) Core Earnings is a non-GAAP financial measure. Core Earnings is the net increase (decrease) in stockholders’ equity resulting from operations less professional fees and other costs related to the
American Capital Acquisition, expense reimbursement from Ares Capital Management LLC (the “Ares Reimbursement”), net realized and unrealized gains and losses, any capital gains incentive fees
attributable to such net realized and unrealized gains and losses and any income taxes related to such net realized gains and losses. Net increase (decrease) in stockholders’ equity is the most directly
comparable GAAP financial measure. Ares Capital believes that Core Earnings provides useful information to investors regarding financial performance because it is one method Ares Capital uses to
measure its financial condition and results of operations. The presentation of this additional information is not meant to be considered in isolation or as a substitute for financial results prepared in
accordance with GAAP.
(2) See Note 16 to Ares Capital's consolidated financial statements included in the annual report on Form 10-K for the year ended December 31, 2019 for information regarding the American Capital
Acquisition.
(3) See Note 13 to Ares Capital's consolidated financial statements included in the annual report on Form 10-K for the year ended December 31, 2019 for information regarding the Ares Reimbursement.
Ares Capital Corporation - Not for Publication or Distribution 34Index & ETF Definitions Ares Capital Corporation - Not for Publication or Distribution
Index Definitions
  Indices are provided for illustrative purposes only and not indicative of any investment. They have not been selected to represent appropriate benchmarks or targets for ARCC. Rather, the indices
  shown are provided solely to illustrate the performance of well known and widely recognized indices. Any comparisons herein of the investment performance of ARCC to an index are qualified as
  follows: (i) the volatility of such index will likely be materially different from that of ARCC; (ii) such index will, in many cases, employ different investment guidelines and criteria than ARCC and,
  therefore, holdings in ARCC will differ significantly from holdings of the securities that comprise such index and ARCC may invest in different asset classes altogether from the illustrative index,
  which may materially impact the performance of ARCC relative to the index; and (iii) the performance of such index is disclosed solely to allow for comparison on ARCC’s performance to that of a
  well known index. Comparisons to indices have limitations because indices have risk profiles, volatility, asset composition and other material characteristics that will differ from ARCC. The indices
  do not reflect the deduction of fees or expenses. You cannot invest directly in an index. No representation is being made as to the risk profile of any benchmark or index relative to the risk profile
  of ARCC. There can be no assurance that the future performance of any specific investment, or product will be profitable, equal any corresponding indicated historical performance, or be suitable
  for a portfolio.

  1.   The ICE BofA US High Yield Master II Index (“H0A0”) tracks the performance of US dollar denominated below investment grade corporate debt publicly issued in the US domestic market.
       Qualifying securities must have a below investment grade rating (based on an average of Moody’s, S&P and Fitch), at least 18 months to final maturity at the time of issuance, at least one
       year remaining term to final maturity as of the rebalancing date, a fixed coupon schedule and a minimum amount outstanding of $100 million. Index constituents are capitalization-
       weighted based on their current amount outstanding times the market price plus accrued interest. Accrued interest is calculated assuming next-day settlement. Cash flows from bond
       payments that are received during the month are retained in the index until the end of the month and then are removed as part of the rebalancing. Cash does not earn any reinvestment
       income while it is held in the index. The index is rebalanced on the last calendar day of the month, based on information available up to and including the third business day before the last
       business day of the month. No changes are made to constituent holdings other than on month end rebalancing dates. Inception date: August 31, 1986.
  2.   The Credit Suisse Institutional Leveraged Loan Index (“CSLLI”) is designed to mirror the investable universe of the $US-denominated leveraged loan market. The index inception is January
       1992. The index frequency is daily, weekly and monthly. New loans are added to the index on their effective date if they qualify according to the following criteria: 1) Loan facilities must be
       rated “5B” or lower. That is, the highest Moody’s/S&P ratings are Baa1/BB+ or Ba1/BBB+. If unrated, the initial spread level must be Libor plus 125 basis points or higher. 2) Only fully-
       funded term loan facilities are included. 3) The tenor must be at least one year. 4) Issuers must be domiciled in developed countries; issuers from developing countries are excluded.
  3.   The Standard & Poor’s 500 Index (“S&P 500”) is a market capitalization-weighted index of the 500 largest U.S. publicly traded companies. The S&P 500 is a float-weighted index, meaning
       company market capitalizations are adjusted by the number of shares available for public trading. The S&P 500 is considered to be a proxy of the U.S. equity market.
  4.   The SNL U.S. Registered Investment Companies Index includes all publicly traded (NYSE, NYSE American, Nasdaq, OTC) Regulated Investment Companies in SNL’s coverage universe. As of
       December 31, 2018, the index included 55 companies, including ARCC.
  5.   The KBW Nasdaq Bank Index (“BKX”) is designed to track the performance of the leading banks and thrifts that are publicly traded in the U.S. The Index includes banking stocks representing
       the largest U.S. national money centers, regional banks and thrift institutions.
  6.   The S&P/LSTA Leveraged Loan Index (“S&P LSTA LLI”) reflect the market-weighted performance of institutional leveraged loans in the U.S. loan market based upon real-time market
       weightings, spreads and interest payments. Facilities are eligible for inclusion in the index if they are senior secured institutional term loans with a minimum initial spread of 125 and term of
       one year. They are retired from the index when there is no bid posted on the facility for at least 12 successive weeks or when the loan is repaid.

Ares Capital Corporation - Not for Publication or Distribution                                           36
Endnotes Ares Capital Corporation - Not for Publication or Distribution
Endnotes
  Slide 3: ARCC is a Leader in Middle Market Lending
  1.   At fair value.
  2.   Average number of years investing for all Investment Committee members.
  3.   Includes invested capital from inception on October 8, 2004 through June 30, 2020. Includes investments made through Ares Capital Corporation, the Senior Secured Loan Program and the Senior
       Direct Lending Program. Excludes syndications within one year of origination, $1.8 billion of investments acquired from Allied Capital on April 1, 2010 and $2.5 billion of investments acquired from
       American Capital on January 3, 2017.
  4.   Based on original cash invested, net of syndications, of approximately $29.0 billion and total proceeds from such exited investments of approximately $36.9 billion from inception on October 8,
       2004 through June 30, 2020. Internal rate of return ("IRR") is the discount rate that makes the net present value of all cash flows related to a particular investment equal to zero. Internal rate of
       return is gross of expenses related to investments as these fees and expenses are not allocable to specific investments. The effect of such expenses may reduce, maybe materially, the IRR’s shown
       herein. Investments are considered to be exited when the original investment objective has been achieved through the receipt of cash and/or non-cash consideration upon the repayment of Ares
       Capital Corporation’s debt investment or sale of an investment, or through the determination that no further consideration was collectible and, thus, a loss may have been realized. These IRR
       results are historical results relating to Ares Capital Corporation’s past performance and are not necessarily indicative of future results, the achievement of which cannot be assured.
  5.   Calculated as an average of the historical annual net realized gain/loss rates (where annual net realized gain/loss rate is calculated as the amount of net realized gains/losses for a particular period
       from Ares Capital IPO in October 2004 to June 30, 2020 divided by the average quarterly investments at amortized cost in such period). Excludes $196 million one‐time gain on the acquisition of
       Allied Capital Corporation in Q2‐10 and gains/losses from extinguishment of debt and sale of other assets.
  6.   Based on the number of portfolio companies as of June 30, 2020.
  7.   Source: SNL Financial. As of June 30, 2020. Ares Capital Corporation’s stock price-based total return is calculated assuming dividends are reinvested at the end of the day stock price on the relevant
       quarterly ex-dividend dates. Total return is calculated assuming investors did not participate in Ares Capital Corporation’s rights offering issuance as of March 20, 2008. S&P 500 returns measured
       by the S&P 500 Index, which measures the performance of the large-cap segment of the market. The S&P 500 is considered to be a proxy of the U.S. equity market and is composed of 500
       constituent companies.

Ares Capital Corporation - Not for Publication or Distribution                                          38
Endnotes
Slide 8: Experience Managing Through Multiple Cycles
1. Calculated as an average of the historical annual net realized gain/loss rates (where annual net realized gain/loss rate is calculated as the amount of net realized gains/losses for a particular period
divided by the average quarterly investments at amortized cost in such periods). Excludes $196 million one-time gain on the acquisition of Allied Capital Corporation in Q2-10 and gains/losses from
extinguishment of debt and sale of other assets.
2. BDC peer group consists of all BDCs that were publicly traded as of each period end date. Peers include: ACAS, AINV, BKCC, FDUS, GAIN, GBDC, GLAD, HTGC, MAIN, MCC, NMFC, OCSL, PFLT, PNNT,
PSEC, SLRC, SUNS, TCAP, TCPC, TCRD, TICC and TSLX. Net realized gain/(loss) rate calculated as an average of a BDC’s historical net realized gain/loss rates, where annual net realized gain/loss rate is
calculated as the amount of net realized gains/losses for a particular period divided by the average quarterly investments at amortized cost in such period.
3. March 31, 2010 ARCC total assets at fair value plus acquired assets from Allied Capital at April 1, 2010 per company filing.
4. For realized securities only. The annual weighted average realized gross asset‐level IRR is calculated from acquisition through March 31, 2020 by vintage and includes all cash flows related to all
realized investment within each vintage. Internal rate of return is the discount rate that makes the net present value of all cash flows related to a particular investment equal to zero. Internal rate
of return is gross of expenses related to investments as these expenses are not allocable to specific investments. Returns to investors will be net of such fees and expenses, which may be
significant. Investments are considered to be exited when the original investment objective has been achieved through the receipt of cash and/or non‐cash consideration upon the repayment of a
debt investment or sale of an investment or through the determination that no further consideration was collectible and, thus, a loss may have been realized. Past performance is not indicative of
future results. The returns shown are based on assumptions and therefore do not reflect actual returns for any Ares-sponsored vehicle. Accordingly, no reliance should be placed on the
information set forth herein.
5. Includes only fully realized investments, Excludes $196 million one-time unallocated gain on the acquisition of Allied Capital in Q2-10.
6. As of December 31, 2019. Includes all realized loans placed on non-accrual, as well as one loan that was on non-accrual and has a partial realized gain, recognized in accordance with U.S. GAAP
where we exited the company by taking control or ownership of the company. Includes Ares Capital Corporation (“ARCC”), investments made through the Senior Secured Loan Program and the
Senior Direct Lending Program and legacy investments from portfolio acquisitions. Represents 7 realized RCC Primary Deals and 4 realized Portfolio Acquisitions where ARCC took greater control
and/or ownership of an investment that was placed on non-accrual from inception through December 31, 2019. The asset level IRR represents a gross realized IRR that includes all asset level cash
flows related to realized investments placed on non-accrual where we exited the company by taking control or ownership of the company. The internal rate of return is the discount rate that
makes the net present value of all cash flows related to a particular investment equal to zero. Internal rate of return is gross of fees and expenses related to investments as these fees and expenses
are not allocable to specific investments. Returns to investors will be net of such fees and expenses, which may be significant. Investments are considered to be exited when the original investment
objective has been achieved through the receipt of cash and/or non-cash consideration upon the repayment of a debt investment or sale of an investment or through the determination that no
further consideration was collectible and, thus, a loss may have been realized. Past performance is not indicative of future results.
Slide 11: Key Elements to Our Investment Approach
1. The portfolio average EBITDA for the underlying borrowers includes information solely in respect of corporate investments in Ares Capital's portfolio. Excluded from the data above is information
in respect of the following: (i) the SDLP (and the underlying borrowers in the SDLP), (ii) portfolio companies that do not report EBITDA, including IHAM, (iii) investment funds/vehicles, (iv) discrete
projects in the project finance/power generation sector, (v) certain oil and gas companies, (vi) venture capital backed companies and (vii) commercial real estate finance companies. The portfolio
average EBITDA for the underlying borrowers in the SDLP was $45.1 million, $44.0 million, $45.4 million, $46.4 million and $47.1 million as of 6/30/19, 9/30/19, 12/31/19, 3/31/20 and 6/30/20,
respectively.
2. EBITDA is a non-GAAP financial measure. For a particular portfolio company, EBITDA is generally defined as net income before net interest expense, income tax expense, depreciation and
amortization. EBITDA amounts are estimated from the most recent portfolio company financial statements, have not been independently verified by Ares Capital and may reflect a normalized or
adjusted amount. Accordingly, Ares Capital makes no representation or warranty in respect of this information.
3. Calculation based on ARCC’s reviewed and closed transactions with new portfolio companies (excludes any investments in existing portfolio companies) in each calendar year or twelve month
period and excludes equity-only investments and legacy investments from portfolio acquisitions.
Ares Capital Corporation - Not for Publication or Distribution 39You can also read