US-China Financial Investment: Current Scope and Future Potential - Adam Lysenko, Mark Witzke, Thilo Hanemann, and Daniel H. Rosen January 2021
←
→
Page content transcription
If your browser does not render page correctly, please read the page content below

US-China Financial Investment:
Current Scope and Future Potential
Adam Lysenko, Mark Witzke, Thilo Hanemann, and Daniel H. Rosen

 A Report by the US-China Investment Project                     January 2021
EXECUTIVE SUMMARY
While direct investment and venture capital flows between the United States and China have declined since 2016, “passive” invest-
ment in equity and debt has grown. The inclusion of Chinese securities in international bond and equity indices points to additional
growth, but policy headwinds are blowing hard from both sides of the Pacific. Recent decisions by the US administration, including
an executive order banning American investment in firms with ties to China’s military and the forced delisting of certain Chinese
firms from US stock exchanges, demonstrate that US policymakers view financial investment restrictions as part of their toolbox
for resetting US-China economic relations. Beijing is allowing more foreign participation in domestic financial markets but only
within tightly controlled parameters, and it maintains heavy controls on outflows. The abrupt decision to cancel the initial public
offering of Ant Group in Hong Kong shows that political interventions extend to offshore financial markets. As policymakers navi-
gate the complex questions around two-way financial investments, it is important for them to have reliable, comprehensive data
on cross-border holdings. This report clarifies the scope and patterns of two-way financial investment in equity and debt securities
and discusses key policy questions on both sides.

The findings are:

•   China is a latecomer to financial globalization, but cross-border holdings of bonds and equities are growing faster than
    traditional capital flows. Beijing lags major economies when it comes to global financial integration due to its reluctance to
    liberalize short-term capital flows. However, China’s financial ties with the world have grown rapidly from a low base over the
    past decade as investors have found creative ways around capital controls and Beijing has started to gradually liberalize cer-
    tain channels. Official statistics do not accurately capture the full scope of China’s external financial investment.

•   The United States is China’s most important financial counterpart, save for Hong Kong. US markets have been critical to
    Chinese company fundraising, and America is where government and household savers seek to reinvest surpluses and
    savings. We estimate there was as much as $3.3 trillion in US-China two-way equity and bond holdings (including securities
    held by central banks as reserves) at the end of 2020—nearly double the official figure of $1.8 trillion. Official underreporting
    reflects the complex, multi-modal structures that are often used for international securities investments and the challenges
    statistical agencies have determining securities issuers’ and owners’ nationalities.

•   US holdings of Chinese securities neared $1.2 trillion at the end of 2020. We estimate that US investors held $1.1 trillion
    in equity and $100 billion in debt securities issued by Chinese entities at the end 2020. That is about five times the holdings
    captured in official US data, which shows $211 billion in equity and $29 billion in debt holdings as of September 2020. Most of
    the disparity is accounted for by firms from China using complex legal structures to issue shares out of tax havens that trade
    on US exchanges. These practices continue despite legal peril in China and US regulatory pressure: in 2020 Chinese equity
    issuance on US exchanges was higher than in any year except 2014. US holdings of Chinese debt securities are smaller but
    are growing rapidly thanks to China’s efforts to improve access to its onshore bond market and to widening US-China interest
    rate differentials.

•   Chinese holdings of US securities reached as much as $2.1 trillion. We estimate Chinese investors held $700 billion in
    equity and $1.4 trillion in debt securities issued by US entities at the end of 2020. In comparison, official US data report $240
    billion of equity and $1.3 trillion of debt holdings as of September 2020. Most of this difference is accounted for by equity
    investments misclassified in official sources due to investor efforts to circumvent Beijing’s capital controls or the use of Hong
    Kong as an investment intermediary. Debt securities account for the bulk of Chinese holdings. These are primarily US Treasury
    securities and agency bonds held by China’s central bank as reserves. While US investors have tended to prefer ownership of
    Chinese equities (and been rewarded with higher relative returns), Chinese investors in US securities have preferred lending
    to the US government and US corporations at relatively low interest rates. They account for a low share of foreign ownership
    of US equities.

                                                                                                                     2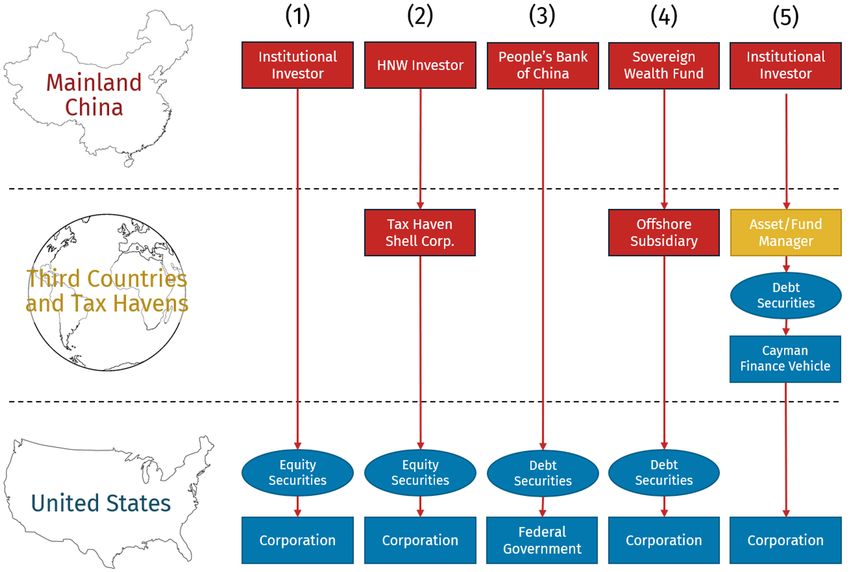
•     US-China financial integration is at an early stage but faces powerful policy headwinds. Under normal conditions, there
      would be room for trillions of dollars in additional US-China financial investment before balances reached levels typical of
      advanced economy pairs. A few years ago, such expansion seemed likely, but policy-related hurdles are rising. Measures
      have proliferated on both sides which, if current trends persist, could greatly diminish growth prospects. Beijing has stated
      its preference for greater financial opening to the world but needs to enact far-reaching reforms before it can truly open its
      capital account without guardrails. Washington has traditionally taken a very liberal approach to financial globalization but a
      new era of “strategic competition” with China has led to a redrawing of national security boundaries, including in the economic
      and financial space. A new US administration is unlikely to fully reverse this shift but may strike a better balance between
      mitigating national security risks, incentivizing good financial governance, and preserving the benefits from benign linkages.

Figure E1: Official and Rhodium Estimates for US-China Bilateral Holdings of Bond and Equity Securities
USD billions

Source: Rhodium Group estimates are based on the inclusion of holdings through offshore locations and other adjustments (see Appendix). Official figures taken from the
US Treasury TIC dataset as of December 31, 2020.

                 3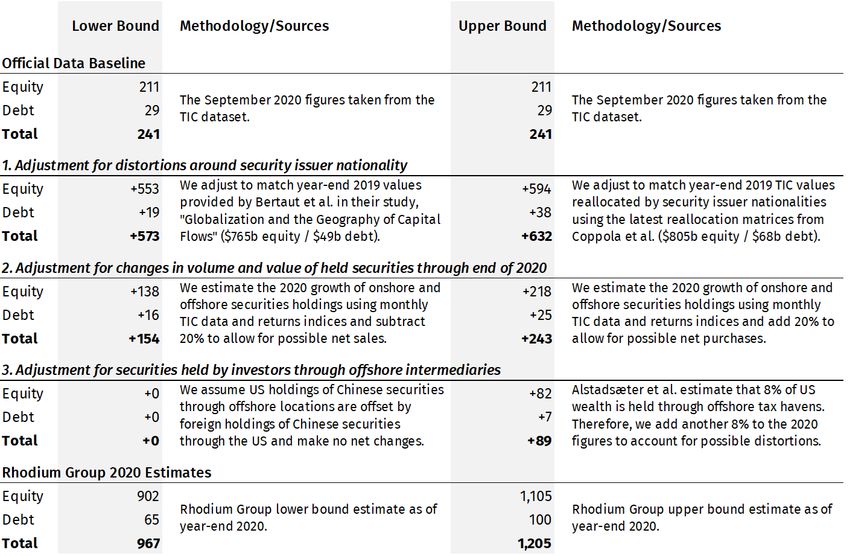
INTRODUCTION
The US-China Investment Project applies innovative approaches to data collection and analysis to document patterns in US-China
capital flows. In the past decade, foreign direct investment (FDI) and venture capital (VC) between the two nations soared but then
started slowing after 2016 due to Chinese capital controls, heightened scrutiny of Chinese investment in the United States, geopo-
litical tensions, and most recently, COVID-19 (Figure 1).

Figure 1: Completed Two-Way FDI and VC Investment Between the US and China
USD billions

Source: Rhodium Group. FDI data represents the combined value of direct investment transactions by mainland Chinese companies in the US, including greenfield projects
and acquisitions that result in significant ownership control (>10% of equity). VC data represents pro-rata values determined as the investor country’s proportional share of
each funding round’s value based on the number of participating investors. 1H 2020 data are preliminary only.

While “active” investments via FDI and VC between the United States and China have been declining in recent years, “passive” finan-
cial investment flows have been on the upswing. Since MSCI first added Chinese onshore shares to its emerging market indices in
2018, pension funds and other large institutional investors from the United States have increased their holdings of Chinese onshore
securities. More importantly, companies from China have accelerated their offshore fundraising activities, raising debt and equity
financing via securities issuance through tax havens and other external domiciles targeting investors from developed market econ-
omies like the United States.

This has given US retail and institutional investors multiple avenues for making securities investments in firms from China.
Increasing valuations for large technology companies like Alibaba and Tencent, and attractive bond yields compared to other econ-
omies, have made China an attractive market for passive investors. In the other direction, the deep and liquid US financial markets
have long been a favorite destination for securities investment by Chinese government entities and designated institutional inves-
tors, and a greater number of high-net-worth individuals and middle-class households are finding opportunities to diversify their
savings in a safe-haven market like the US.

                                                                                                                                                         4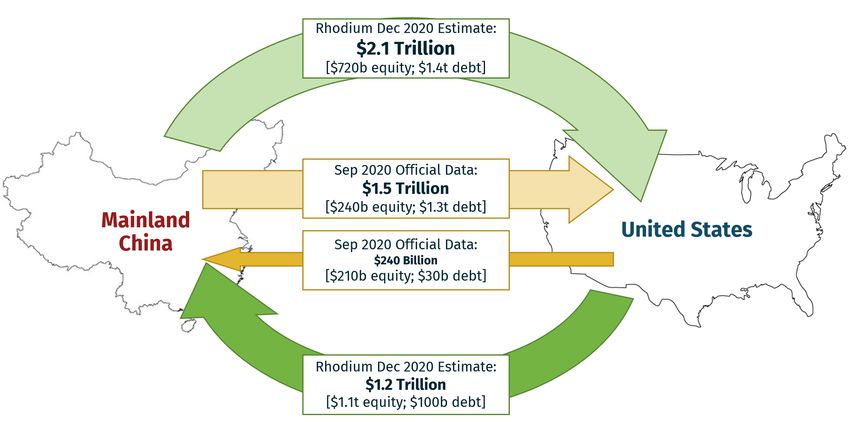
Commercial appetite for greater two-way holdings of securities is clearly there, but the policy environment remains fragile. China’s
leaders are aware of the fault lines in its domestic financial system and are anxious about short-term foreign capital flows injecting
instability. Beijing has also demonstrated that it is not willing to let independent regulators operate, instead continuing to actively
interfere in financial market dynamics and creating conflicts for fiduciary portfolio managers.

In the US, concerns over national and economic security, accounting frauds, and broader geopolitical leverage have led to increased
skepticism around financial integration with China. In a new era of US-China strategic competition, it is not surprising that bilateral
securities investment has been caught in the broader “decoupling” debate in Washington. For example, government pension funds
came under fierce scrutiny in the first half of 2020 as their prospective investment in Chinese companies was perceived to be
against US security interests. Then in November, a Trump administration executive order banned US investment in certain Chinese
firms linked to China’s military, including US-listed China Telecom, China Unicom, and China Mobile, which faced delisting from US
exchanges in early 2021. And in the waning days of 2020, US lawmakers passed the “Holding Foreign Companies Accountable Act”,
which would enforc stricter auditing compliance requirements on firms from China and force de-listings for companies unwilling to
meet standards.on firms from China and force de-listings for companies unwilling to meet standards.

Steps like these have the potential to significantly deter US investment in the securities of companies from China, which already
account for hundreds of billions of dollars of US investors’ global portfolios. And yet, debates around US-China passive securities
investment suffer from shortcomings similar to those inherent in the early debates about US-China bilateral FDI and VC: official
data do not provide a clear picture for policymakers to understand the scope and patterns of two-way investment flows and stocks.
This report aims to fill these gaps by offering a clearer picture of historical securities investment between China and the United
States. We first describe China’s financial investment integration with the world. Then we take a deeper dive into US-China securities
investment stocks and flows, offering a more complete picture than official data. Finally, we look to the future of China’s financial
integration with the world and relevant policy variables.

1. China as a Latecomer to Financial Globalization
In assessing cross-border securities investment trends in official data, the most relevant statistics relate to a component of the
balance of payments (BOP) framework called “portfolio investment.” IMF guidelines for national accounting statistics define port-
folio investment as investment in securities such as stocks, bonds, mutual funds, and real estate investment trusts (REITs) in
pursuit of financial returns through income generation and capital gains. Importantly, a few forms of securities investment such
as the purchase of foreign government bonds for foreign currency reserves are not considered to be portfolio investments under
IMF guidelines, but these data are still useful for understanding the broad historical development of global cross-border securities
investment flows and the role China has played in recent decades.

1.1 Financial Globalization is Driven by Portfolio Investment
Official data show that portfolio investment has been the main driver of financial globalization to date. Since deregulation in inter-
national banking practices and the creation of the European monetary union kickstarted the early growth in cross-border capital
flows in the 1980s and 1990s, the exchange of bonds, stocks, and other securities has been the most important component of
international investment. As of 2019, estimated cross-border ownership of gross portfolio assets and liabilities had reached over
$160 trillion, or almost half (45%) of total official cross-border financial stock (Figure 2).

The unique characteristics of portfolio investment help explain its popularity. It is not as “sticky” as FDI because investors can
usually invest and withdraw their money quickly in liquid markets, making portfolio investment highly dynamic. It is “passive”
because investors generally have no direct influence over management decisions at invested companies, thus requiring relatively
little continuing attention from investors. Finally, portfolio investment is also distinguished by its anonymity—granular public
disclosure requirements for investment positions are limited, minimizing investor administrative burdens.

              5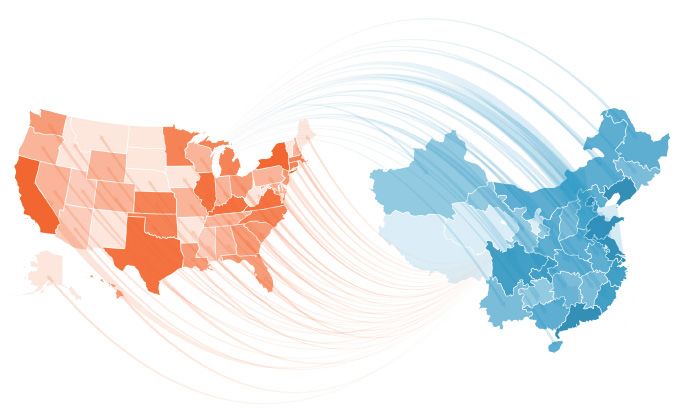
Figure 2: Financial Globalization by Type of Cross-Border Capital Flow (1990-2019)
USD trillions, gross external assets and liabilities of 211 nations and territories

Source: IMF External Wealth of Nations Dataset. Data after 2015 are partially estimated based on percent growth in gross external assets and liabilities from latest
available data. Portfolio flows include debt and equity securities as well as financial derivatives. The “Other” category includes reserves, loans, deposits, and other financial
investment.

While developing countries have come to capture a larger share of global GDP and international trade in the 21st century, they
have lagged far behind the developed world in measures of financial globalization such as cross-border securities investment.
This caution towards financial liberalization is driven by fears of volatility brought on by rapid capital withdrawals. China has
exemplified this trend, and like many other emerging economies it has not been a major participant in the financial globalization
story thus far (Figure 3). In 2019, China accounted for roughly 17% of global GDP but less than 4% of global cross-border invest-
ment assets and liabilities. If not for significant flows through FDI and other channels like reserves, loans, deposits, and insur-
ance, the gap would be even wider.

                                                                                                                                                             6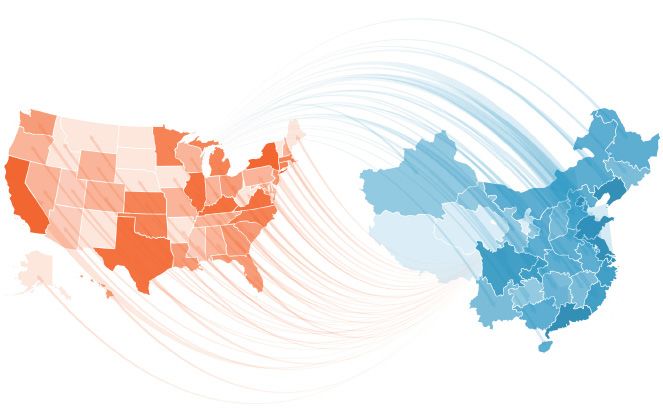
Figure 3: Financial Globalization by Geography, 1990-2019
USD trillions, gross external assets and liabilities of 46 countries and territories

Source: Data up to 2015 from “External Wealth of Nations” Dataset. Data for after 2015 are from the IMF where available; for aggregate categories data after 2015 are partially
estimated using overall growth percentage in gross external assets and liabilities.

1.2 China Lags Far Behind in Global Portfolio Flows
China’s slow historical financial integration with the world is primarily a by-product of its investment-led development model.
China has funded expansive infrastructure and other capital investments via cheap loans that were made possible by keeping
bank account interest rates artificially low. This implicit tax (also known as “financial repression”) required Beijing to impose
capital controls to prevent outflows of household savings. The Asian financial crisis starting in 1997 reinforced Beijing’s capital
flight anxiety. Fears that sudden large withdrawals could lead to a currency devaluation and spiral into further capital outflows,
external defaults, asset depreciation, and negative growth have guided China’s instinct to keep capital controls in place and
passive securities investment flows tightly regulated.

Given these capital formation and macroeconomic stability priorities, Beijing tightly limited portfolio investment flows in and
out of China in past decades. Only institutions with special mandates such as China’s sovereign wealth fund or the National
Social Security Fund, or those given special quotas through programs like the Qualified Domestic Institutional Investor (QDII) or
Qualified Foreign Institutional Investor (QFII) mechanisms, were legally allowed to invest across the border at scale. As a result,
China’s international investment position (claims on foreign assets) has been dominated by reserves held by the central bank
(42% as of the end of 2019) and lending and holdings by state-affiliated banks (captured under “other investment”) (23%). More
recently outbound FDI by Chinese companies has played a more prominent role in China’s global asset mix (27%), but portfolio
investment remains small at only 8% of total. China’s liabilities (foreigners’ claims on Chinese assets) have been mostly com-
prised of FDI (55%) and a smaller share of portfolio and other investment (24% and 23%, respectively) (Figure 4).

                   7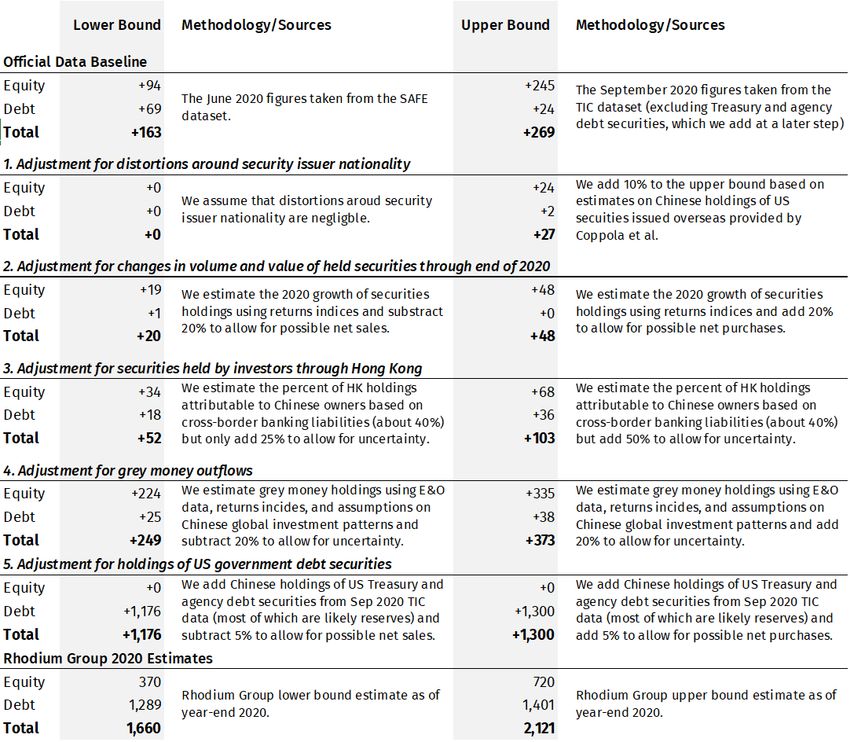
Figure 4: China’s International Investment Position 2001-2019
USD billions

Source: SAFE, IMF, Rhodium Group. *Denotes Chinese residents’ claims on overseas assets; **Denotes foreigners’ claims on assets in China.

But the air lock around China’s system has created new problems even as it has solved others, and China has changed
its thinking in recent years, especially on inbound portfolio investment. Since 2016, China has launched the Bond
Connect program and the China Interbank Market Direct (CIBM Direct) program to accommodate bond market inflows
from abroad. On the equities side, China has created the Stock Connect Program, which allows foreign and Chinese
investors to trade stocks in each other's markets. Encouraged by these reforms, global indexers have added China’s
equities and bonds to their trackers, and financial giants like State Street and Vanguard are stepping up their China
weightings.
These efforts have driven up inbound portfolio investment levels from a low base in the early 2010s (Figure 5). Official
data from Q3 2020 showed $773 billion in Chinese portfolio investment holdings abroad and $1.5 trillion in foreign
holdings of assets in China, up 250% compared to 2013. Chinese authorities hope to see these numbers rise, espe-
cially on the inbound investment side, and there is plenty of room for China-global portfolio investment expansion:
portfolio investment remains puny in China’s net international investment position (NIIP) even after a few strong
years, accounting for only 15% of all cross-border holdings between China and the world at the end of 2019. Based on
averages from developed economies, a “normal” global picture would see portfolio investment accounting for 40% or
more of total cross-border holdings.

                                                                                                                                            8
Figure 5: Gross Portfolio Investment Assets and Liabilities in China’s IIP, 2002-Q3 2020
USD billions
Source: SAFE, Rhodium Group. 2020 Data is up to end of Q3; *Denotes Chinese residents’ claims on overseas assets; **Denotes foreigners’ claims on assets in China.
These data tell an exciting story about the potential for greater Chinese financial integration with the world, but official figures do not
provide a full enough picture of China’s securities investment links. Official numbers are heavily distorted due to methodological
issues in recording the locality vs. nationality of securities issuers and investors that are compounded by the use of variable inter-
est entities (VIEs) and similar complex global business structures. In the case of China, concealed flows in the form of FDI retained
earnings and various other tricks to circumvent border controls further distort the picture.
A more accurate accounting of financial investment ties is necessary to correct for these distortions. Only with a better view of
the current scope of China’s international securities investment linkages can parties ascertain the best policies and strategies for
maximizing welfare and minimizing risks. In the following section we discuss these distortions in the context of US-China securities
investment and provide more accurate estimates of the true scope of current US-China financial investment ties.
92. The Scope of US-China Bilateral Securities Investment
Using the stock of bilateral securities investment between China and the United States as a proxy, in this section we seek to
quantify the scope of US-China financial investment integration to date. Details on the specific dimensions of US-China bilateral
securities investment are scant in both official and academic sources. This is not surprising given how difficult it is to gather accu-
rate, timely data on securities investment flows. This type of capital is highly mobile, lower transparency thresholds often exempt
small holdings from disclosure, and trading volumes are massive in liquid markets—for example, in 2019 the daily trading volume
of US treasury bills alone averaged more than $600 billion.
In the FDI and VC spaces where deal sizes are larger, transactions are fewer, and turnover is slow, constructing granular bottom-up
datasets that shed new light on investment patterns is possible. This is not the case in the securities investment space. Instead, we
use a top-down methodology based on a series of estimated adjustments to official data on securities holdings between the United
States and China to arrive at better measures of the true scope of two-way securities investment at the end of 2020. We incorporate
insights from academic research, examine various proxies for financial flows mapped in official data with known distortions, and
make some educated guesses to arrive at reasonable lower and upper bounds.
Our estimates cover bilateral holdings of equity securities (public and private) falling below the 10% ownership threshold as well
as debt securities (bonds, private placements, asset-backed securities, and others). Compared to official data, we include some
holdings that do not fall into the portfolio investment category in balance of payments frameworks. For example, according to IMF
national accounting statistical methods, purchases made with foreign exchange reserves are classified in a separate category
from portfolio investment flows. However, we include these holdings in our total estimates.
2.1 US Holdings of Equity and Debt Securities of Chinese Entities
The United States has played a major role in securities investment globalization, befitting its position as the world’s largest econ-
omy. The United States is a center of global finance, it has an open capital account, and its citizens transact in US dollars, the global
reserve currency that can be easily converted to buy foreign securities. According to official data from the US Treasury, US portfolio
holdings of foreign equity and debt securities amounted to nearly $13 trillion as of 2019.
China’s explosive economic growth in recent decades has made it an attractive target for US investors seeking high yields and
uncorrelated returns (investing in different assets with low correlations can smooth overall portfolio volatility). As a result,
numerous US corporations, individuals, and institutional investors (i.e., pensions, endowments, insurance companies, etc.) have
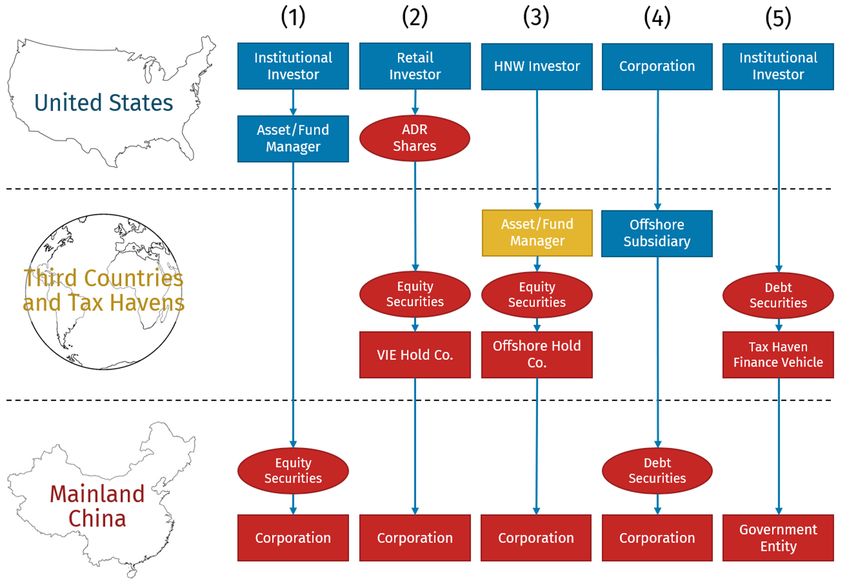
acquired securities issued by corporate and government entities from China. Figure 6 provides an overview of some of the most
common channels and parties for such transactions:
1. Direct purchase of China Onshore Equity Securities: A US institutional investor like a state pension fund places money with
a domestic asset manager such as JPMorgan, which in turn obtains Chinese regulatory approval to invest directly in the
onshore equity securities listed on the Shanghai or Shenzhen stock exchanges on the US investor’s behalf.
2. Purchase of American Depository Shares: A US retail investor purchases the US-listed American Depository Receipts (ADRs)
of a Chinese company like Pinduoduo. These ADRs confer ownership of the underlying equity shares of Pinduoduo’s Cayman
Island holding company, which in turn controls actual operations in mainland China through a variable interest entity (VIE)
structure involving a mixture of ownership claims and contractual arrangements.
3. Purchase of Hong Kong Listed Shares: A US high net worth (HNW) investor places money with an asset manager outside the
United States such as Sumitomo Mitsui Trust Asset Management, which in turn acquires the shares of a Hong Kong holding
company like Sino Biopharmaceutical Limited that controls a physical business in mainland China.
104. Direct purchase of China Onshore Debt Securities: A US financial institution like Wells Fargo Asset Management purchases
the onshore debt securities of a mainland China company through an international subsidiary using the China Interbank Bond
Market Direct (CIBM Direct) program.
5. Purchase of Debt Securities Issued via Offshore Financing Vehicles: A US institutional investor like Prudential purchases
dollar-denominated debt issued by a central state-owned enterprise such as State Grid Corporation of China through a financ-
ing vehicle domiciled in the British Virgin Islands.
Figure 6: Common Channels for US Purchases of Chinese Securities
Stylized illustration; not comprehensive
Source: Rhodium Group. Arrows indicate direction of control over or claim on mainland China entities. Color represents the nationality of the entity or security.
Official Figures
Official figures on US portfolio holdings of debt and equity securities issued by corporate and government entities from China
come from the US Treasury International Capital (TIC) dataset. The US Treasury collects the underlying data through surveys of
custodians, which report the geography of investor by legal domicile and the geography of the owned securities by the legal
domicile of the entities issuing securities. Therefore, the official TIC data cover investment structures like those described in
Channel 1 of Figure 6, but not those described in Channels 2 through 5. For example, Channels 2 and 3 would be classified as
US equity securities investment in firms from the Cayman Islands and Hong Kong, respectively, while Channel 4 would not be
considered US debt investment as the securities purchaser is not domiciled in the United States.
11TIC data show that US portfolio investment holdings of securities issued by Chinese entities in September 2020 stood at $211
billion for equity and $29 billion for debt, for a total of only $241 billion. This equates to less than 2% of total US international
portfolio investment holdings reported in the September 2020 TIC data and is roughly equivalent to US portfolio investment
holdings of securities from South Korea, a country that had only 12% of China’s GDP in 2018. However, the conduits of US securi-
ties investment in China that are obscured or ignored in the TIC data constitute a majority of all holdings, so these figures vastly
underestimate the true scope at the end of 2020.
Adjusted Year End 2020 Estimates
We adjust the official figures to arrive at reasonable lower- and upper- bounds for total securities holdings at the end of 2020,
addressing the following factors: (1) distortions around security issuer nationality (as in Channels 2, 3, and 5 of Figure 6); (2)
changes in volume and value of held securities through end of 2020; and (3) securities held by investors through offshore inter-
mediaries (as in Channel 4 of Figure 6).
Based on these steps, we estimate that US holdings of the equity and debt securities issued by entities from China stood
between a lower bound of almost $970 billion ($902 billion in equity and $65 billion in debt) and an upper bound of over $1.2
trillion ($1.1 trillion in equity and $100 billion in debt) at the end of 2020. Due to the opaque nature of international securities
flows and the uncertainties underlying our estimates, these should not be taken as exact figures. Still, our informed estimates
are as much as 400% higher than the $241 billion reported in the latest TIC data from September 2020 (Figure 7), showing the
massive scope of US securities investment flows to entities from China not accurately reported in official data.
Figure 7: Various Estimates of the Stock of US Holdings of Equity and Debt Securities Issued by Chinese Entities
USD billions
Source: Rhodium Group.
12The disparity between our estimates and official figures is mostly a result of firms from China using complex international struc-
tures to issue equity securities on US stock exchanges, which results in US holdings being attributed to tax havens instead of to
China in the official data. Despite uncertain legal treatment in China and regulatory pressure in the United States, this activity
continues apace: Chinese firms raised $19 billion in primary and secondary offerings on US exchanges in 2020, a total eclipsed
only in 2014 thanks to Alibaba’s $25 billion IPO. US investors own Chinese offshore equities at much higher rates than onshore
equities.
While US holdings of debt securities issued by entities from China are on an order of magnitude smaller than holdings of equity
securities, US investment in Chinese debt securities has grown more rapidly than investment in equity securities during the last
two years. This is a result of widening interest rate differentials between China and the United States and of China’s continued
efforts to improve access to its onshore bond market since 2016.
2.2 Chinese Holdings of Equity and Debt Securities of US Entities
China’s role in international securities investment has lagged far behind other measures of its global economic integration. Ac-
cording to official data, China’s portfolio holdings of foreign securities amounted to only $650 billion at the end of 2019—a small
fraction of the $13 trillion held by US investors. Even assuming the value of China’s foreign exchange reserves (about $3 trillion)
is fully invested in international securities, China still holds only a fraction of the value of international securities owned by US
investors.
This disparity is a result of China’s own controls over outbound capital flows. For most of the last decades, only China’s central
bank and a few other state actors have been permitted to purchase overseas securities, mostly to manage foreign exchange
reserves. And although Beijing has allowed some institutional investors and other private entities to start making foreign securi-
ties investments, China still tightly controls the flow of securities investment capital today.
For those Chinese entities that have been able to purchase foreign investment securities, the United States has always been an
important locale. It is home to the largest markets globally for investible liquid debt and equity instruments, including safe-ha-
ven government debt, and US assets are priced in the world’s reserve currency, which China has accumulated in significant
amounts. Thus, Chinese state-owned and private corporations, government entities, and individuals have purchased large
volumes of investment securities issued by US corporate and government entities via various investment structures in the last
decades. Figure 8 illustrates some of the most common parties and channels for this type of investment:
1. Direct Purchase of US Listed Equity Securities: A China onshore institutional investor with a Qualified Domestic Institutional
Investor (QDII) license such as China Asset Management Co. invests directly in the equity securities of a US corporation listed
on an exchange such as the NYSE.
2. Purchase of US Listed Equity Securities via a Third Country or Tax Haven: A Chinese HNW individual circumvents China’s cap-
ital controls and places capital in a tax haven shell company, which in turn invests in the equity securities of a US corporation
listed on an exchange such as NASDAQ.
3. Direct Purchase of Debt Securities: The People’s Bank of China directly purchases US Treasury bonds at auction or in the US
secondary market for the purpose of managing China’s foreign exchange reserves.
4. Purchase of Debt Securities via a Third Country or Tax Haven: China Investment Corporation purchases the debt securities of
a US corporation through an offshore subsidiary in Hong Kong.
135. Purchase of Debt Securities Issued via Offshore Financing Vehicles: An institutional investor like Ping An Insurance places
money with an international asset manager like Mitsubishi UFJ Financial Group, which in turn purchases debt issued by a US
corporation such as Marriott International through an offshore financing vehicle domiciled in the Cayman Islands
Figure 8: Common Channels for Chinese Purchases of US Securities
Stylized illustration; not comprehensive
Source: Rhodium Group. Arrows indicate direction of control over or claim on US entities. Color represents the nationality of the entity or security.
Official Figures
Official data from China on Chinese portfolio investment holdings of overseas securities come from the State Administration on
Foreign Exchange (SAFE), which also contributes to the IMF’s Coordinated Portfolio Investment Survey (CPIS) dataset. SAFE data
captures legally sanctioned direct holdings of US securities by entities domiciled in mainland China (which excludes holdings
by Chinese households). The latest SAFE figures report that Chinese portfolio investors held $94 billion of equity and $70 billion
of debt securities issued by US entities at the end of 2019. Notably, this does not include the value of Chinese foreign exchange
reserves invested in US securities—Chinese statistical agencies do not provide a breakdown of reserves holdings by country.
14US Treasury TIC data provide an alternative official source for Chinese portfolio investment in securities issued by US entities,
with differences in estimates due to different data collection sources and methodologies and the inclusion of at least some re-
serves. The TIC data suggest Chinese investors held $245 billion in equity securities and $24 billion in debt securities issued by
US corporations, plus another $1.2 trillion in US government securities at the end of September 2020. While these estimates are
larger than those from SAFE, TIC data still only cover long-term securities holdings, and securities investments involving offshore
routing and capital controls evasion such as those described in Channels 2, 4, and 5 of Figure 8 are not accurately captured in
either official dataset.
Adjusted Year End 2020 Estimates
Estimating the true extent of passive Chinese investment in US securities is more difficult than estimating US holdings of Chinese
securities. For example, it is widely known that China’s central bank purchases overseas securities in a non-transparent manner,
often involving state-owned commercial banks or through offshore locations such as Luxembourg or Belgium. Moreover, since
overseas securities investment by households and corporations remain largely prohibited, to the extent they occur these outflows
appear only in other channels in the official figures, for example as part of the foreign direct investment or errors and omissions
portions of China’s balance of payments. There is also less third-party research on China’s external portfolio investment position
that attempts to correct for distortions in official data.
With that in mind, we adjust the official figures to arrive at reasonable lower- and upper- bounds for total securities holdings at the
end of 2020, addressing the following factors: (1) distortions around security issuer nationality (as in Channel 5 of Figure 8); (2)
changes in volume and value of held securities through end of 2020; and (3) securities held by investors through offshore interme-
diaries (as in Channel 4 of Figure 8); grey money outflows (as in Channel 2 of Figure 8); and holdings of government debt securities
(as in Channel 3 of Figure 8).
Based on these steps, we arrive at a lower bound estimate of $1.7 trillion ($370 billion in equity and $1.3 trillion in debt) and an
upper bound estimate of $2.1 trillion ($720 billion in equity and $1.4 trillion in debt) in Chinese holdings of US securities at the end
of 2020 (Figure 9). Like our estimates of US holdings of Chinese securities, these are ballpark figures complicated by the opaque
and volatile nature of international securities investment and should not be treated as definitive values. But these totals are up
to 40% higher than the latest TIC figures that include government debt holdings, illustrating how a significant portion of securities
investment flows is not accurately reflected in official data.
15Figure 9: Various Estimates of the Stock of Chinese Holdings of Equity and Debt Securities Issued by US Entities
USD billions
Source: Rhodium Group. *SAFE and other Chinese government statistical agencies do not report reserves holdings by jurisdiction, which are not included in these totals.
Most of the difference between our estimates and official figures is accounted for by equity investments misclassified or
uncounted in official sources due to investor efforts to circumvent Beijing’s stringent outbound capital controls or to the use of
Hong Kong as an investment intermediary. These distortions are very difficult to measure, but we estimate the true value of Chi-
nese holdings of US equity securities may be twice as large as the numbers reported in official data. Meanwhile, debt securities
account for the bulk of Chinese holdings, with most consisting of investments in US Treasury securities and agency bonds.
3. Outlook: Policy Constrains Growth Potential
While our estimates illustrate that cross-border equity and bond holdings are significantly higher than what official numbers
show, financial integration between both nations is still low in the global context, suggesting a potential for trillions of
dollars in additional flows. From a macroeconomic perspective, China looks highly integrated with the rest of the world, but its
financial links to other major economies are comparatively limited. To match OECD averages, China would have to accumulate
more than $30 trillion in combined cross-border portfolio assets and liabilities (slightly more than twice its GDP). This is more
than 15 times the 2019 value of $2 trillion reported in official data. Were China to “catch up” with other advanced economies,
US-China portfolio investment would – all things being equal – triple in size, reaching more than $9 trillion compared to our
estimate of about $3 trillion at the end of 2020.
16The higher-than-recognized value of holdings we identify was built up by investors on both sides of the Pacific heeding strong
commercial incentives. Global portfolios are underweight China, and foreign investors are eager to increase their exposure because
of China’s relatively high economic growth trajectory, the persistent interest rate differentials between China and OECD countries,
and the opportunity to diversify into assets with returns that are not highly correlated with those of investors’ existing holdings.
Meanwhile, Chinese households and institutional investors want to expand beyond their “home only” portfolios into a broader mix
of financial assets.
However, rising US skepticism about closer economic engagement with China and a reluctance in Beijing to allow free capital
flows could limit the potential for deeper financial integration, even if there is a compelling commercial logic to it. In China, lead-
ers have stymied an expansion of financial links to the rest of the world out of stability concerns: they fear foreign capital flows that
they cannot control. There is no way to solve for both Communist Party control and maximum portfolio investment flows: this is
an either/or. In Washington, the concerns are not about financial stability but about national security. US policymakers were com-
fortable with greater investment flows as long as China was converging with liberal market norms. But as the state asserts greater
control over parts of China’s economy, and as financial investments remain politicized, members of both US parties have begun to
hedge. These hurdles to deeper financial engagement are formidable, and the outlook uncertain.
The data and analysis presented in this report shows that despite talk of greater financial openness, Beijing has so far not suc-
ceeded in resolving systemic challenges that stand in its way. China’s development model relies on external capital controls, and
true liberalization would require Beijing to surrender political control over key parameters of its domestic financial and economic
system, including interest and exchange rates. This seems unlikely at this point. The large-scale capital outflows China experienced
in 2015/2016 showed what the country could face if capital controls were lifted. It is likely that Beijing will continue to follow an
approach that limits the scale of short-term cross-border capital flows and maintains quotas and “trusted” investor schemes that
allow it to maintain control. For China to attract long-term financial investment from large global investors, Beijing will also need to
assure portfolio managers with fiduciary duties of its commitment to the rule of law and show that financial market regulators are
not subject to political whims.
In Washington, national security concerns won’t dissipate with a new administration, but we may see a more nuanced debate
on the risks and opportunities from financial integration with China. With the 2017 National Security Strategy, the US government
shifted to viewing China as a strategic competitor and threat. In subsequent years, US officials worked zealously to amplify the
darker dimensions of China’s behavior. This extended to capital flows and the Trump administration has put in place measures to
curb financial investment by US entities – especially public pension funds – in Chinese companies that directly or indirectly sup-
port China’s military advancement.
While national security concerns are unlikely to change, the extreme path of accelerated financial disengagement seems remote.
A far-reaching decoupling of the US and Chinese economies, including of financial ties, is not necessary from a rational national
security perspective, and the costs for both sides would be significant. A new US administration is likely to take a more nuanced
approach to US-China financial flows. We expect a set of policy actions that are more restrictive than standard OECD fare but more
permissive than the gratuitous steps entertained by Trump administration hardliners. US lawmakers could also bolster rules to
protect US investors from risks related to specific features of the Chinese system, including a lack of accounting transparency and
the use of problematic legal structures such as VIEs. Finally, we expect a discussion about new opportunities for US statecraft aris-
ing from China’s financial integration with the world. As the largest financial economy in the world, the US has tools at its disposal
to incentivize good financial governance by China at home and in third countries. Looking ahead, the United States would benefit
from a more considered examination of its financial ties to China than the one that has accompanied the financial decoupling push
of the past years.
17Methodology Appendix
In the FDI and VC spaces where deal sizes are larger, transactions are fewer, and turnover is slow, constructing granular bottom-up
datasets that shed new light on investment patterns is possible. This is not the case in the securities investment space. Instead, we
use a top-down methodology based on a series of estimated adjustments to official data on securities holdings between the United
States and China to arrive at better measures of the true scope of two-way securities investment at the end of 2020. We incorporate
insights from academic research, examine various proxies for financial flows mapped in official data with known distortions, and
make some educated guesses to arrive at reasonable lower and upper bounds.
Our estimates cover bilateral holdings of equity securities (public and private) falling below the 10% ownership threshold as well
as debt securities (bonds, private placements, asset-backed securities, and others). Compared to official data, we include some
holdings that do not fall into the portfolio investment category in balance of payments frameworks. For example, according to IMF
national accounting statistical methods, purchases made with foreign exchange reserves are classified in a separate category
from portfolio investment flows. However, we include these holdings in our total estimates.
2020 US Holdings of Chinese Securities
We make the following adjustment steps to official figures to arrive at Rhodium’s lower and upper bound estimates of US holdings
of Chinese securities at the end of 2020:
Step 1 – Distortions around security issuer nationality: We build in particular on the work of two of groups of academic researchers
– one composed of Federal Reserve staff (Bertaut et al.) and another composed of academics affiliated with the Capital Allocation
Project (Coppola et al.) – to construct more accurate estimates of the current scope of US holdings of Chinese securities. Using
securities-level information to adjust for distortions in official datasets stemming from differences in domicile and nationality of
security issuers (as inherent in Channels 2, 3, and 5 of Figure 6), Bertaut et al. estimate that US investors actually held $765 billion
of equity securities issued by firms from China and $49 billion of debt securities issued by corporate and government entities from
China at the end of 2019. Based on a similar methodology, the Capital Allocation Project (CAP) researchers peg these totals at $702
billion for equity securities and $63 billion for debt securities at the end of 2017. Replicating the underlying methodology using the
latest provided adjustment factors from Coppola et al. applied to TIC data from 2019 results in estimates of $805 billion for equity
securities and $68 billion for debt securities at the end of 2019.
Step 2 – Changes in volume and value of held securities through end of 2020: US investors have seen both asset price changes
and opportunities to purchase and sell securities issued by entities from China since 2019. 2020 was a particularly volatile year
with large swings in valuations and global capital flows. We account for these factors with adjustments derived from equity and
debt security index returns, monthly changes in underlying TIC figures on US securities holdings, academic research insights into
patterns of offshore security issuance and ownership, and other factors. After the addition of a 20% buffer in either direction to
account for unknown inflows and outflows, on net we add between about $150 billion and $240 billion to the external estimates
from previous years.
Step 3 – Securities held by investors through offshore intermediaries: Investments in foreign securities made through US-owned
offshore subsidiaries (as in Channel 4 of Figure 6) are not captured in the official data, nor are they included in the adjusted figures
provided by the academic researchers cited above. Based on patterns of US wealth held through offshore tax havens and other juris-
dictions reported in academic literature, we add an additional roughly $90 billion to the upper bound to account for possible missing
US securities investments made using complex offshore structures like these. On the lower bound we assume these effects are
balanced by non-US investors holding Chinese securities through intermediaries in the United States.
18Table A.1 summarizes these adjustments and the resulting changes to underlying figures.
Table A1: Rhodium Group Upper and Lower Bound Estimation Steps for US Holdings of Chinese Securities
USD billions
Source: Rhodium Group.
2020 Chinese Holdings of US Securities
We make the following adjustment steps to official figures to arrive at Rhodium’s lower and upper bound estimates of Chinese hold-
ings of US securities at the end of 2020:
Step 1 – Distortions around security issuer nationality: The impacts of security issuer nationality distortions on Chinese hold-
ings of securities issued by US entities are much less significant than flows in the other direction thanks to fewer US securities
issuers utilizing complex international structures. Still, figures provided by Coppola et al. show that some distortions have existed
for Chinese holders, so we add 10% (about $25 billion) to the upper bound official data baseline to account for possible missing
holdings.
Step 2 – Changes in volume and value of held securities through end of 2020: Chinese investors have seen both asset price
changes and opportunities to purchase and sell securities issued by entities from the United States since the most recent official
estimates. 2020 was a particularly volatile year with large swings in valuations and global capital flows. We account for these fac-
tors with adjustments derived from equity and debt security index returns. After the addition of a 20% buffer in either direction to
account for unknown inflows and outflows, on net we add between about $20 billion and $50 billion to the baselines taken from
official figures.
19Step 3 – Securities held by investors through Hong Kong: Securities investments made through Chinese-owned offshore sub-
sidiaries and other entities (as in Channel 5 of Figure 8) are not captured in official data. Most of this activity involves investment
through Hong Kong, which is China’s premier conduit for routing investment capital abroad. Based on patterns of cross-border
banking liabilities between China and Hong Kong, we estimate that 25% to 50% of investment from Hong Kong in the securities of US
entities is likely attributable to ultimately China-owned investors, adding between about $50 billion and $100 billion to the totals
for 2020.
Step 4 – Grey money outflows: A comprehensive estimate of all historical grey money outflows from China into US stocks and
bonds is impossible, but we offer an order of magnitude estimate by tabulating quarterly net errors and omissions in China’s bal-
ance of payments data since 2000. Making assumptions around the portions of these amounts that were invested in US equity
and debt instruments and the returns subsequently generated and assuming a 20% uncertainty buffer in either direction, we add
between $120 billion and $190 billion to the year-end 2020 value of US securities held by Chinese households.
Step 5 – Holdings of government debt securities: Official data from the United States show entities from China hold more than a
trillion dollars of US government debt securities, with most likely belonging to China’s foreign exchange reserves. These reserves
are not considered to be portfolio investments under balance of payments methodologies, so they are not included in the SAFE
data, for example. However, reserves constitute a major component of China’s external securities investment position, so we add
the value of Chinese holdings of US government and agency bonds as of September 2020 as reported by the US Treasury, with the
addition of a 5% buffer in either direction to allow for inflows and outflows that may have taken place during 4Q 2020. As a result, we
add another $1.2 to $1.3 trillion to the 2020 totals, all in debt securities.
Table A.2 summarizes these adjustment steps and the resulting changes to underlying figures.
20Table A2: Rhodium Group Upper and Lower Bound Estimation Steps for Chinese Holdings of US Securities
USD Billions
Source: Rhodium Group.
21References
Alstadsæter, Annette, N. Johannesen, and G. Zucman, “Who Owns the Wealth in Tax Havens? Macro Evidence and Implications for
Global Inequality” December 2017 https://gabriel-zucman.eu/files/AJZ2017b.pdf
“Balance of Payments and International Investment Position Manual [6th Edition]” International Monetary Fund, 2009. https://
www.imf.org/external/pubs/ft/bop/2007/pdf/bpm6.pdf
Brad Setser, “Chasing Shadows in China’s Balance of Payments Data”. Council on Foreign Relations, September 2020. https://www.
cfr.org/blog/chasing-shadows-chinas-balance-payments-data
Brad Setser, “The Chinese Conundrum: External Financial Strength, Domestic Financial Weakness”. CESifo Economic Studies, May
2006. https://academic.oup.com/cesifo/article-abstract/52/2/364/294027
Bertaut, Carol C., B Bressler, and S. Curcuru, “Globalization and the Geography of Capital Flows”. Board of Governors of the Federal
Reserve System, November 2020. https://www.federalreserve.gov/econres/notes/feds-notes/globalization-and-the-geogra-
phy-of-capital-flows-20190906.htm
Coppola, A., M. Maggiori, B. Neiman, and J. Schreger, “Redrawing the map of global capital flows: The role of cross-border financing
and tax havens.” Capital Allocation Project, December 2020 https://globalcapitalallocation.s3.us-east-2.amazonaws.com/CMNS-
Paper.pdf
Daniel H. Rosen, “Avoiding the Blind Alley: China’s Economic Overhaul and Its Global Implications.” Rhodium Group and Asia Society
Policy Institute, October 2014. https://asiasociety.org/files/pdf/AvoidingtheBlindAlley_FullReport.pdf
“Foreign Investment Pours Into China Despite Trade War, Pandemic” Bloomberg News, December 2020 https://www.bloomberg.
com/news/articles/2020-12-18/foreign-investment-pours-into-china-despite-trade-war-pandemic
Hudson Lockett and Thomas Hale “Global investors place Rmb1tn bet on China breakthrough” Financial Times, December 2020.
https://www.ft.com/content/d9ac222d-90d8-4570-b89e-a99f1bd4829b
Lingling Wei, Bob Davis and Dawn Lim, “China Has One Powerful Friend Left in the U.S.: Wall Street” Wall Street Journal, December
2020. https://www.wsj.com/articles/china-has-one-powerful-friend-left-in-the-u-s-wall-street-11606924454
Michael Mussa, “Factors Driving Global Economic Integration” International Monetary Fund, September 2015. https://www.imf.org/
en/News/Articles/2015/09/28/04/53/sp082500
Nicholas Lardy, “Financial Repression in China”. Peterson Institute of International Economics. September 2008. https://www.piie.
com/sites/default/files/publications/pb/pb08-8.pdf
Philip R. Lane and Gian Maria Milesi-Ferretti, “A Global Perspective on External Positions” NBER, May 2007, https://www.nber.org/
system/files/chapters/c0122/c0122.pdf
Philip R. Lane and Gian Maria Milesi-Ferretti, “The Drivers of Financial Globalization” The American Economic Review, May 2008.
https://www.jstor.org/stable/29730042?seq=1
Philip R. Lane, “Financial Globalisation and the Crisis”. July 2012. https://www.bis.org/events/conf120621/lane.pdf
22Philip R. Lane and Gian Maria Milesi-Ferretti, “The External Wealth of Nations Revisited: International Financial Integration
in the Aftermath of the Global Financial Crisis” IMF Economic Review, April 2018. https://papers.ssrn.com/sol3/papers.
cfm?abstract_id=3162104
Thilo Hanemann, Daniel H. Rosen and Cassie Gao, “Two-Way Street: 25 Years of US-China Direct Investment”, Rhodium Group and
the National Committee on US-China Relations, November 2016. https://publications-research.s3-us-west-2.amazonaws.com/
RhodiumGroup_FullReport_EN_20161111.pdf
Thilo Hanemann, Daniel H. Rosen, Cassie Gao and Adam Lysenko, “Two-Way Street: 2020 Update”, Rhodium Group and the
National Committee on US-China Relations, May 2020. https://publications-research.s3-us-west-2.amazonaws.com/TWS+2020_
Report_8May2020_Final.pdf
Thilo Hanemann, Daniel H. Rosen, Cassie Gao and Adam Lysenko, “Two-Way Street: 2020 1H Update”, Rhodium Group and the
National Committee on US-China Relations, September 2020. https://publications-research.s3-us-west-2amazonaws.com/RHG_
TWS+1H+2020+Report_25Sept2020.pdf
Thilo Hanemann, Daniel H. Rosen, Cassie Gao, and Adam Lysenko, “Two-Way Street: 2020 1H Update”, Rhodium Group and the
National Committee on US-China Relations, September 2020. https://publications-research.s3-us-west-2.amazonaws.com/RHG_
TWS+1H+2020+Report_25Sept2020.pdf
Tom Mitchell, Hudson Lockett, and Thomas Hale, “Beijing and Wall Street deepen ties despite geopolitical rivalry” Financial Times,
October 2020. https://www.ft.com/content/8cf19144-b493-4a3e-9308-183bbcc6e76e
Victor Shih, “Financial Instability in China: Possible Pathways and Their Likelihood”. Mercator Institute for China Studies. October
2017. https://merics.org/sites/default/files/2020-05/Financial%20instability%20in%20China.pdf
23You can also read