Realizing Our Potential - Website July 2021 Time to Grow Through the Drill Bit - Westbrick Energy Ltd.
←
→
Page content transcription
If your browser does not render page correctly, please read the page content below
Realizing Our Potential
  Time to Grow Through the Drill Bit

                   Website July 2021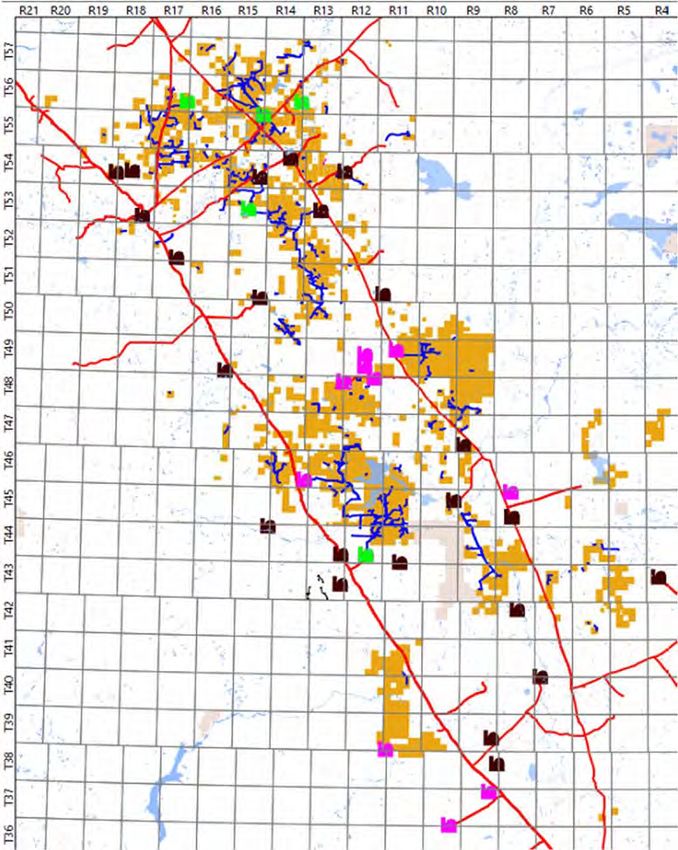
WESTBRICK IS IN THE ENERGY BUSINESS
          Focused on creating shareholder value
Private Company: Incorporated January 2011                                               Key Attributes
Capital Raised: $290M equity                                                             •   Top decile North American gas producer
Outstanding Shares: 47.4MM, (4.7MM options granted at $6.25/sh)                          •   Pristine balance sheet and no commitments
Major Shareholders: KKR ‐ 77.4%, Chernoff's – 12.4%, The Team – 6.8%, POU – 3.4%         •   Variable and low all‐in cost structure
Current Production: 36,000 BOED (73% gas)                                                •   Ability to grow and create FCF at current prices
              Planned Target ‐ 50,000 BOEPD by June 2022
                                                                                         •   Very experienced team with 10 year performance track record at the company
Forecasted 2021 Corporate Cash Flow : $ 215 MM
                                                                                         •   Focused on shareholder returns; have preserved capital for the investors
              Free Cash flow: in excess of $140 MM
                                                                                         •   Established and unique performance driven corporate culture
Current Net Debt: $ 207.0MM (end of June 2021)
                                                                                         •   ESG principles have been a key part of our business since inception
              2021 Year end Net Debt: $148 MM
RBL Capacity: $ 250 MM (redetermination Nov 2021)

Board of Directors:                          Management:
Doug Kay (Chairman) ‐ Independent            Ken McCagherty – President & CEO
M. Bruce Chernoff ‐ Caribou                  Moe Mangat – VP & Chief Operating Officer
David Rain ‐ Caribou                         Lloyd Heine – VP Finance & CFO
Jim Riddell ‐ Paramount                      Tom Collins – VP Exploration
Paul Workman ‐ KKR                           James O’Connor – VP Land
Brandon Freiman ‐ KKR                        Derek Jahns – VP Development
Ken McCagherty ‐ CEO                         Dean Jenkins – VP Production
                                                                                                                                                                          2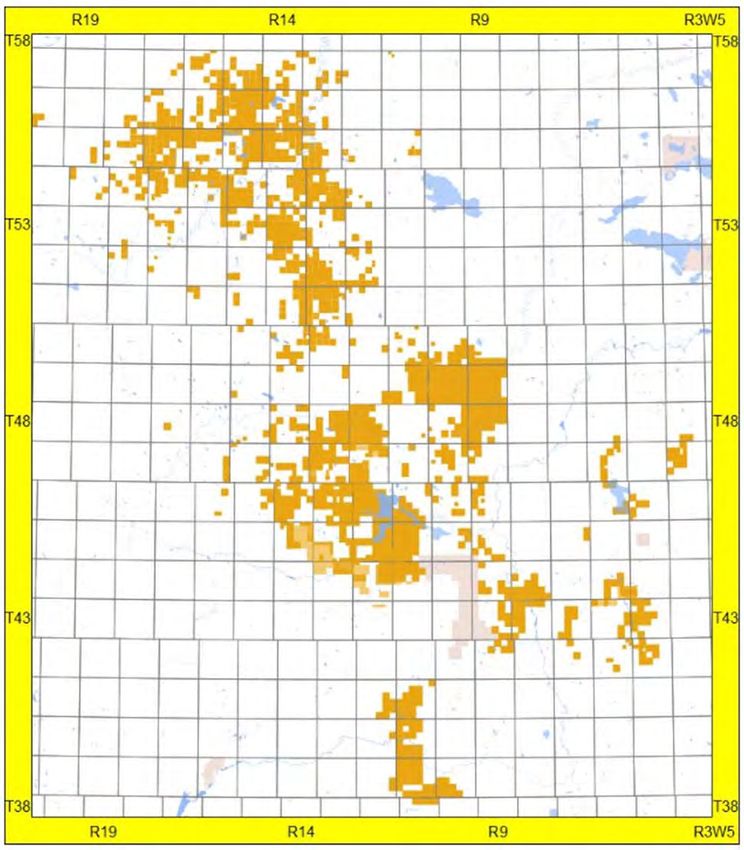
WESTBRICK ENERGY SNAPSHOT
            Strong growth platform for creating shareholder value
Demonstrated Track Record of Converting Resource to Cash Flow
                                                                                                               Westbrick Deep Basin Asset Base
•   Applying a resource development approach to a conventional asset base: focused on Spirit River
    liquids rich gas and light oil from the Rock Creek, Ellerslie, Cardium and Duvernay formations
•   On June 30, 2021 Westbrick acquired 7,600 boe/d and 500+ sections of land (78% WI) at Edson,
    extending our Deep Basin footprint by 65%
•   1,300 sections of land (avg. WI ~81%) with majority of rights between base of
    Cardium to base of Rock Creek, including 100 new sections of Duvernay resource
•   Ability to generate substantial growth while generating FCF by capitalizing on the inherent half cycle
    advantages of Pembina.
•   Almost all production prior to June 2021 was added from the drilling of 120 horizontal wells
•   1,500 net locations of mapped drilling inventory (GLJ booked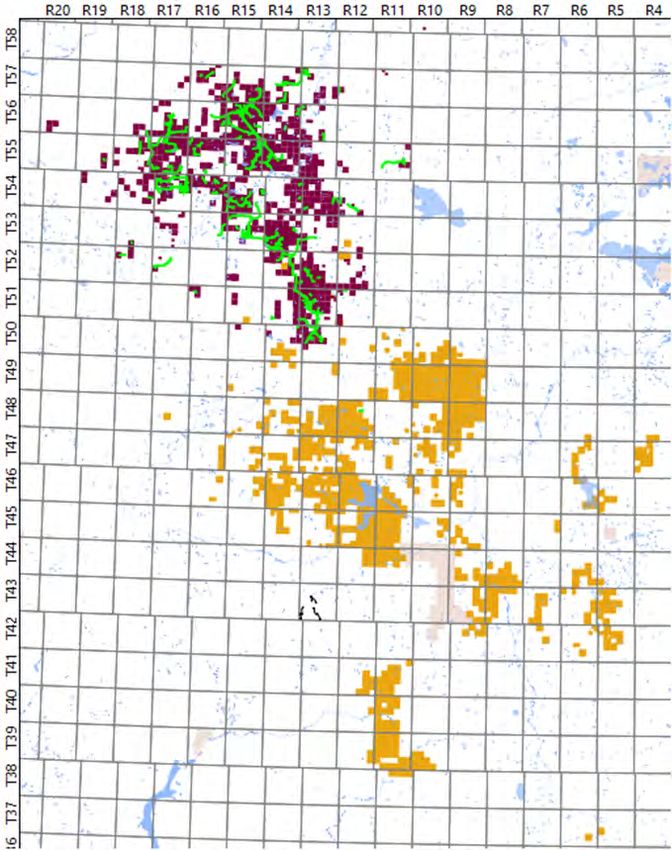
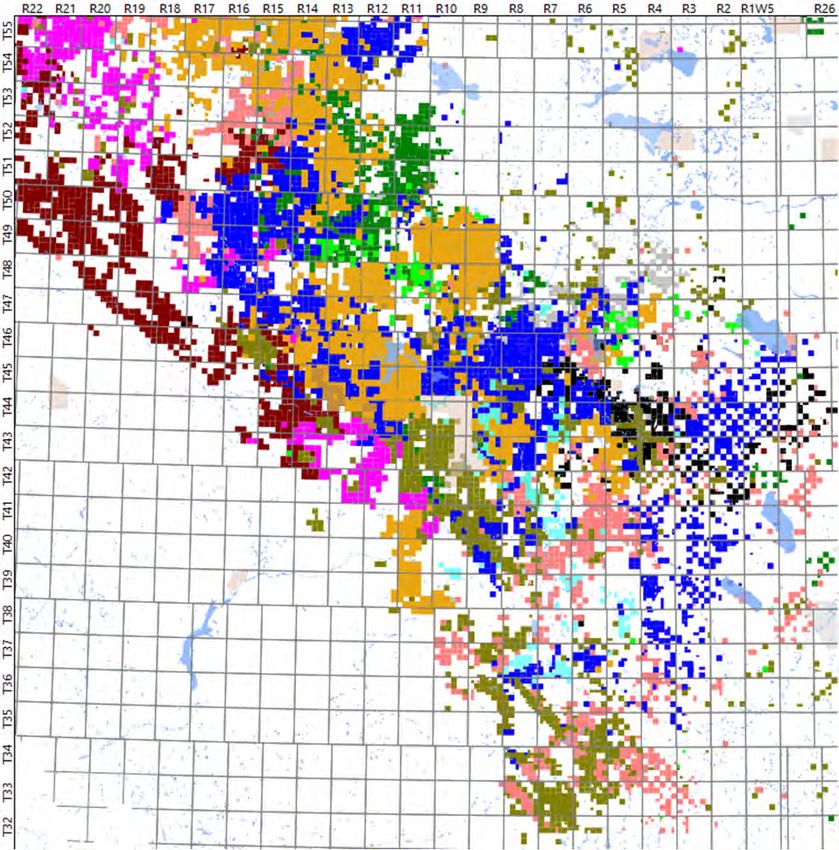
GREATER PEMBINA: RESOURCE-RICH AREA
           Active and highly coveted development area offers compelling returns across
           a variety of formations and commodity price environments
Multiple, World‐class Resource Plays Offer Numerous
Advantages
• Southeast portion of world‐class Deep Basin trend
• Operational efficiencies due to concentrated stacked plays that are
  easily exploited vertically or horizontally at low cost
• Cost efficiencies captured through proximity of legacy infrastructure,
  road and utilities
• Significant well control reduces execution, geological and timing risk
• Extensive market infrastructure with numerous low cost midstream
  options
• Access to numerous egress options, near local markets and in close
  proximity to service company hubs
• Numerous peers active in the area that are helping to prove the
  resource potential
• Strong local community presence, field staff live in area
                                                                                         4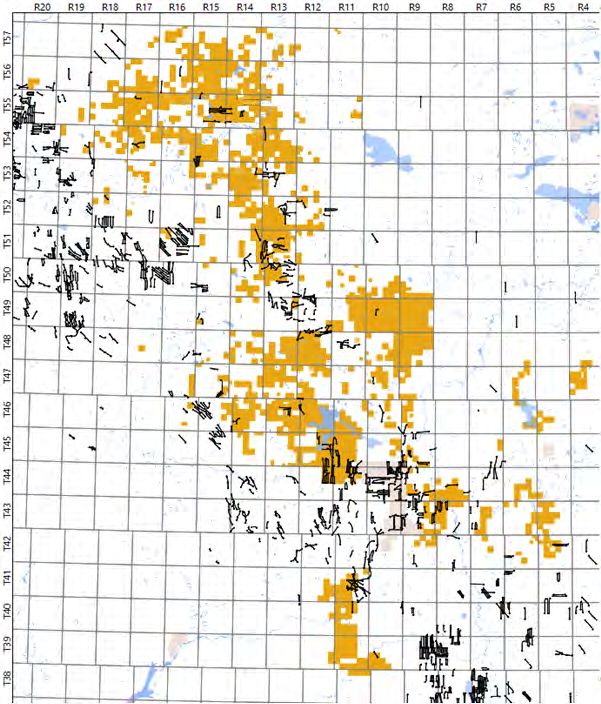
WESTBRICK FY 2020 + Q1 2021 RESULTS
           Westbrick continues to rise to the challenge
                                                    2020 Fiscal Year                          x   2021       Comments ‐ Financial results
                                  Q1         Q2           Q3            Q4        FY 2020          Q1        • Results are excerpts from audited 2020 year end and unaudited Q1 2021 interim
                                 ($MM)      ($MM)       ($MM)          ($MM)      ($MM)           ($MM)        financial statements (amounts may differ slightly due to rounding)
Revenue                                                                                                      • Revenue
                                                                                                                     • Westbrick remains well‐positioned to take advantage of stronger commodity
           Oil                       2.0        1.3           2.0          1.9         7.3            4.8
                                                                                                                         prices, increasing production to 28,311 boe/d in Q1 2021 and generating $65.2
           Natural gas              26.7       20.9          23.9         30.3       101.9           41.1
                                                                                                                         mm in petroleum and natural gas revenues
           Liquids                  12.1        6.3           9.1         12.4        39.9           19.3
                                                                                                             • Royalties
           Hedging gain (loss)       0.4       (2.1)         (3.2)        (2.2)       (7.1)          (2.4)
                                                                                                                     • Alberta crown royalties reduced by credits for gas cost allowance and Alberta
           3rd party fees            1.5        1.3           1.0          1.2         5.0            0.9                royalty incentive programs
Total revenue                       42.7       27.8          32.8         43.6       146.9           63.6            • Q1 2021 royalty rate of 6.5% (compared to 5.1% for FY 2020) reflects impact of
Royalties                           (3.2)      (1.0)         (0.9)        (2.6)       (7.6)          (4.2)               higher prices on royalties.
                                    39.5       26.8          31.9         41.0       139.3           59.4    • Operating expenses
Transportation                      (2.2)      (1.8)         (1.8)        (1.9)       (7.8)          (2.5)           • Includes costs to process third party volumes; processing fees charged to third
Operating                          (13.1)     (11.1)        (10.1)       (10.3)      (44.6)         (12.6)               parties are included in other revenue
Field Cash Flow                     24.2       13.9          20.0         28.8        87.0           44.3            • Net operating costs were $4.60/boe in Q1 2021, reflecting lower 3rd party
G&A (net of recoveries)             (2.1)      (1.9)         (1.8)        (1.9)       (7.7)          (2.1)               throughput volumes
Interest                            (1.0)      (0.9)         (1.1)        (1.1)       (4.2)          (1.0)   • Transportation – includes the cost of transporting natural gas from the wellhead to the
Corporate Cashflow                  21.1       11.1          17.1         25.9        75.1           41.2      AECO pricing reference point together with the costs associated with firm service
ARO capex                           (0.3)      (0.0)         (0.1)        (0.3)       (0.7)          (0.3)     transportation arrangements
Capex                              (21.0)      (0.2)        (11.2)       (26.8)      (59.3)         (40.3)   • G&A – 22 full time staff and 22 part time office consultants
Free Cashflow                       (0.2)      10.8           5.8         (1.2)       15.1            0.7    • Interest and finance costs – interest and bank fees have declined from 2019 due to lower
                                                                                                               bank debt and lower interest rates
Net Debt
                                                                                                             • Capex – Westbrick drilled through 2021 breakup, spending $40.3 mm in Q1
                                                                                                                     • Spudded 6.9 net wells and brought 8.4 net wells on production
Opening Net Debt                   (99.6)     (99.8)        (89.0)       (83.3)      (99.6)         (84.5)
                                                                                                             • Q1 2021 exit net debt is comprised of the bank loan of $63.0 mm and a working capital
Free cashflow                       (0.2)      10.8           5.8         (1.2)       15.1            0.7
                                                                                                               deficiency of $20.8 mm
Ending Net Debt                    (99.8)     (89.0)        (83.3)       (84.5)      (84.5)         (83.8)
                                                                                                             • The Company has $355 mm in tax pools at December 31, 2020

                                                                                                                                                                                                          5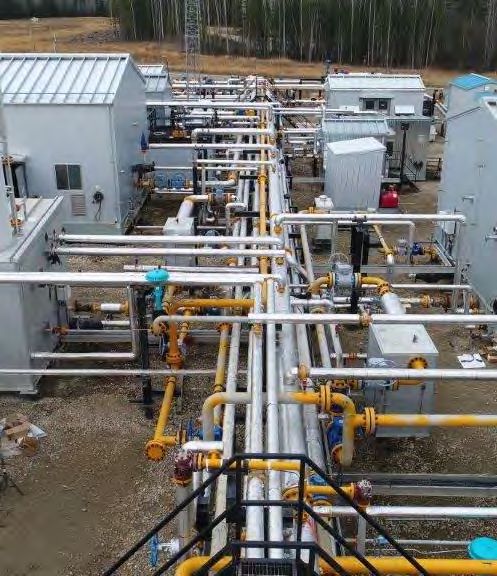
WESTBRICK FY 2020 + Q1 2021 RESULTS (CONT’D)
         Creating shareholder value
                                                    2020 Fiscal Year                         x     2021       Comments
                                    Q1         Q2         Q3           Q4        FY 2020            Q1        •  Production ‐ in response to stronger commodity prices, Westbrick was able to accelerate and
Production                                                                                                       optimize production, which increased from 24,618 boe/d in Q4 2020 to 28,311 boe/d in Q1 2021
          Oil ‐ Mbbls                   41         47         43           40        171                74
          Gas ‐ Mmcf                12,067      9,773      9,796       10,487     42,122            11,903
                                                                                                              •  Commodity prices have increased steadily since Q2 2020, strengthening cash flows and leading to
          NGLs ‐ Mbbls                 503        440        414          462      1,819               490       lower debt and reduced interest rates
          MBOE                       2,555      2,116      2,089        2,250      9,010             2,548    •  Royalties ‐ rates are affected by commodity price levels
Average Production ‐ BOEPD          28,077     23,253     22,709       24,456     24,618            28,311          •    royalties forecast to be 7% of revenues for 2021
                                                                                                              •  Opex
Realized Price/unit ‐ Unhedged
           Oil                       48.96      27.94      46.43        48.50       42.45            64.26
                                                                                                                    •    Continued focus on controlling costs
           Gas                        2.22       2.14       2.44         2.89        2.42             3.46          •    New processing agreement with third party mid‐streamer reduces processing fees by
           NGL's                     24.03      14.40      22.02        26.76       21.93            39.33               $0.17/mcf effective Jan 1, 2021
           Per BOE                   15.98      13.51      16.76        19.82       16.54            25.58          •    Q1 2021 opex of $4.60/boe affected by extreme cold and lower 3rd party throughput
                                                                                                                         volumes during the period
Realized Price/boe ‐ hedged          16.12      12.52      15.24        18.83       15.72            24.64
Royalties as a % of Revenue           7.8%       3.4%       2.6%         5.8%        5.1%             6.5%
                                                                                                              •  Q1 2021 field netback of $17.38/boe highest realized since 2014
Transportation/boe                    0.87       0.87       0.85         0.85        0.86             0.99    •  G&A for Q1 2021 was $0.82/boe, in line with expectations for FY 2021

Opex/BOE                              5.12       5.24        4.84        4.58        4.94             4.95
Third party facility fees            (0.59)     (0.61)      (0.47)      (0.55)      (0.55)           (0.35)
Net opex/BOE                          4.53       4.63        4.37        4.03        4.39             4.60
Field Netback/BOE                     9.48       6.57        9.58       12.81        9.62            17.38

Net G&A per boe                       0.81       0.91       0.85         0.84        0.85             0.82
Interest and financing per boe        0.40       0.43       0.53         0.49        0.46             0.38

Corporate cash flow/boe               8.26       5.22       8.20        11.49        8.32            16.17

Weighted average basic
 shares outstanding              47,352,572 47,352,572 47,352,572 47,352,572 47,352,572          47,352,572
Corporate cashflow per share          $0.45      $0.23      $0.36      $0.55      $1.59               $0.87

                                                                                                                                                                                                                   6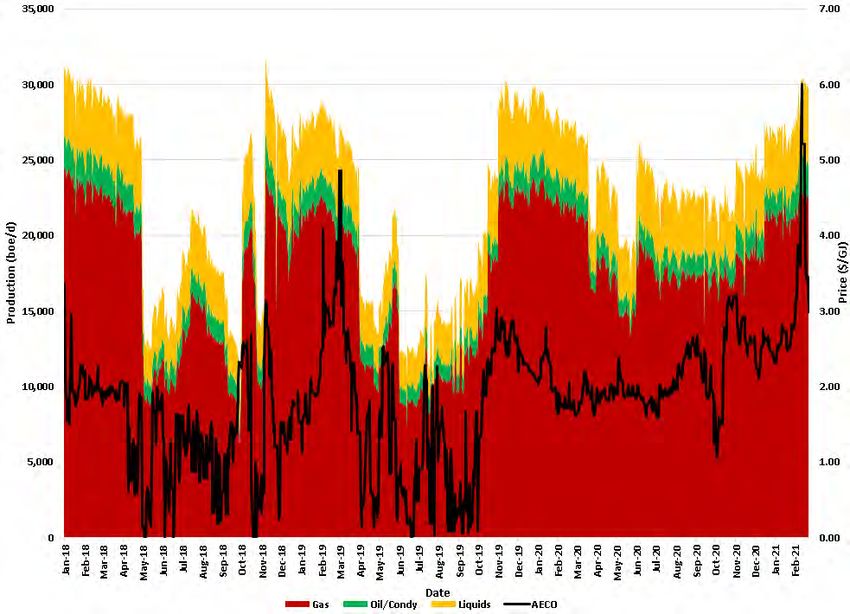
PERFORMANCE TRACK RECORD
Consistent year after year despite industry headwinds
35,000 32,020 800
250 4.00
Prod Per MM Share (Boe/MM sh)
Annual Avg Annual Per MM Shares 700 2P Reserves Debt Adj Per Share
30,000 3.50
Reserves Per share (Boe/sh)
24,618 600 200
P+P Reserves (MMboe)
25,000 22,591 23,299 21,867 3.00
Production (Boe/d)
500 2.50
20,000 150
14,551 400 2.00
15,000 13,159
300 100 1.50
10,501
10,000 134 145
200 124 1.00
5,578 50 110
89
5,000 100 62 70 0.50
798 15 43
0 0 0 0.00
2012 2013 2014 2015 2016 2017 2018 2019 2020 2021e 2012 2013 2014 2015 2016 2017 2018 2019 2020 2021e
180 40
Capex Cash Costs 250 5.50
Cash Flow Per Share
160 35
162
140 152
30 200 4.50
Cash Costs ($/boe)
141
Cashflow Per Share ($/sh)
120 129 25
Capex ($MM)
Cashflow ($MM)
100 150 3.50
20
80 215
143 15 100 110 2.50
60 72
61 10 86 74
40 50 1.50
59 57 52 75
54 5 72
20 33
21 (3)
0 0 0 0.50
2012 2013 2014 2015 2016 2017 2018 2019 2020 2021e 2012 2013 2014 2015 2016 2017 2018 2019 2020 2021e
(50) (0.50)
Note: 2021 Capex excludes Edson asset acquisition. 7
HOW DID WESTBRICK SURVIVE THE PAST 5 YEARS?
  Minimal commitments provides the flexibility needed to preserve value
   Production was curtailed in the summer of 2018 and 2019 in response to low AECO pricing. A
    commitment light business model provides Westbrick the necessary flexibility to respond to
                             adverse price swings to preserve returns.

                                                                                                 Guiding Principles
                                                                                                     • Rate of return focused
                                                                                                     • Only buy quality
                                                                                                     • Don’t sell production at a loss
                                                                                                     • Minimize commitments
                                                                                                     • Reduce fixed costs
                                                                                                     • Financial hedging to provide minimum
                                                                                                       revenue
                                                                                                     • Production management
                                                                                                     • Capital spending flexibility

                                                                                                 Key Efforts
                                                                                                     • Developed efficient data management tools
                                                                                                     • Grinding out cost savings
                                                                                                     • Spend when you have the money not in
                                                                                                       anticipation of getting the money

                                                                                                                                                   8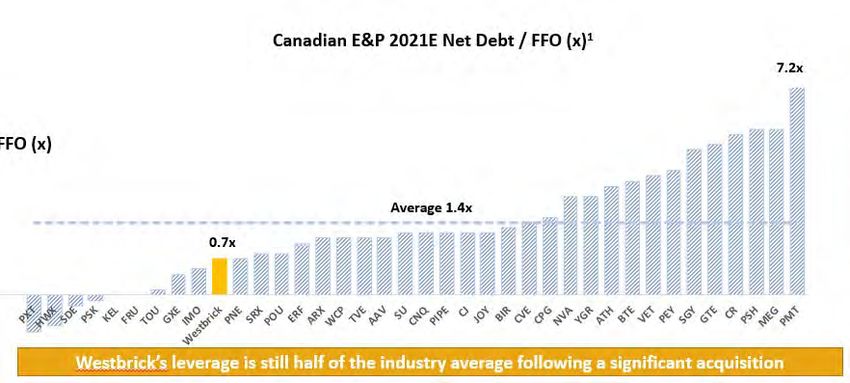
WESTBRICK RESERVE PROFILE
                  Adding value through the drill bit
                                                                                                                                      3‐Year Average PDP FD&A Comparative ($C$/boe)
                                                                                                                       $25.00
                  Westbrick Reserve Summary – July 1, 2021                      Effective1
                                                                                                                       $20.00

                                                                                                                       $15.00
                                                   Oil        NGLs          Gas        Total       Btax
                                                 Mmbbls      Mmbbls         Bcf       Mmboe       NPV10%               $10.00           Peer Median: $7.35/boe
  Proved Developed                                 3           11           242          54         481                 $5.00
   Proved Undeveloped                               6          14           229          58         232
                                                                                                                            ‐‐
  Total Proved                                     9           25           471         112         713
   Probable                                        8           21           385          93         463
  Total Proved + Probable                          17          46           856         205        1,176
   % PDP of TPP                                   16%         25%           28%        22%          41%
   % Proved of TPP                                51%         55%           55%        55%          61%                                     3‐Year Average Recycle Ratio Comparative
                                                                                                                          2.5x

                                                                                                                          2.0x
    Westbrick’s three‐year average PDP recycle ratio tops the                                                                                                              Peer Median: 1.5x
                                                                                                                          1.5x
    industry peer group which highlights the prolific nature of the
                                                                                                                          1.0x
    underlying resource combined with minimal dilution from
                                                                                                                          0.5x
    required full‐cycle investments.
                                                                                                                            ‐‐

1Reserves estimated   by GLJL Petroleum Consultants as at January 1, 2021 mechanically updated to July 1, 2021. Btax 10% value in $Mm based on June 29, 2021 strip.

                                                                                                                                                                                               9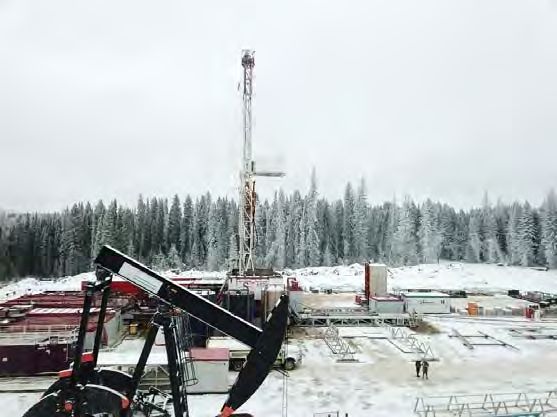
HISTORY OF PRUDENT BALANCE SHEET MANAGEMENT
              We have carefully used our balance sheet to deliver value growth
                        Historical Production (Boe/d)

                                                                                               Canadian E&P 2021E Net Debt / FFO (x)1
                                                                                                                                                                 7.2x

                  Westbrick Historical Net Debt/FFO (x)
                                Periods of depressed AECO pricing.

                                                                                  Managing the balance sheet as follows:
                                      1.6x 1.6x
                                 1.1x         1.4x                                1.     Capital spending program
                                                                                                           Average 1.4x
                                        1.0x
                                                 1.1x
                               0.9x
                                                          0.7x                    2.   0.7xProduction   management
Careful utilization of 0.6x
balance sheet to drive
production growth                                                                 3.     Consistent Hedging program

                                  Target < 1.0x                      Westbrick’s leverage is still half of the industry average following a significant acquisition
1Source:   Peters & Co. Limited E&P Overview Tables, June 28, 2021                                                                                                      10
MINIMAL ARO FOOTPRINT
Modest ARO liability principally reflects organically grown production base
• Westbrick’s production is generated primarily from horizontal wells drilled post 2013 which results in a modest ARO liability by
industry standards
• $70 Mm undiscounted liability attributed to active and inactive wells, facilities and pipelines
• $1 Mm annual required spending on inactive abandonment and reclamation
• 611 net wells within the Company with 60% currently active
• Minimal interest in large processing facilities and not exposed to major reclamation liability
Westbrick Asset Retirement Obligation (ARO) Snapshot
Total Company ARO Obligation ($Mm, Undiscounted) $70
Company well bore profile (net)
Active 367
Inactive 244
Total 611
ARO recognized per net well bore ($K) $115
ARO per boe (PDP) $1.27
11ESG HAS ALWAYS BEEN GOOD FOR OUR BUSINESS
Proud member of the communities where we operate
Solar powered multi‐well pad development
• Focus on reuse of existing wellsites and infrastructure
• Use natural gas to fuel drilling operations wherever possible
• In line well testing to minimize flaring
• Community engagement with multiple stakeholders
12WESTBRICK DRILLING INVENTORY
• Concentrated geographic footprint that reduces costs and
minimizes commitments.
• Existing legacy infrastructure and multiple egress options EDSON
• Multilayered geological potential allows for capital program
resiliency in a volatile commodity complex
• Inventory would take 30 years to consume at the 50 wells/year EDSONCYNTHIA
pace contemplated within the Company’s 5‐year plan
COLUMBIA
DRILLING INVENTORY BY FORMATION CYNTHIA
LODGEPOLE
DRILLING NET DRILLING COLUMBIA
FORMATION AVERAGE W.I.
INVENTORY INVENTORY
WILLESDEN GREEN
BELLY RIVER 45 44 97% LODGEPOLE
CARDIUM 36 25 70%
BRAZEAU
VIKING 36 30 84%
NOTIKEWIN 209 151 72%
WILLESDEN GREEN
FALHER B 87 86 99%
FALHER 309 237 77% BRAZEAU
WILRICH G 162 156 96%
WILRICH C 67 67 100%
BADGER
WILRICH 143 90 63%
GLAUC 31 28 92%
ELLERSLIE 388 280 72%
ROCK CREEK 335 278 83% BADGER
NORDEGG 27 20 75%
DUVERNAY 0 0 0%
TOTAL 1875 1493 80%
Note: Assumes one mile horizontal length. Plan is to drill 2 mile wells where possible
Oil potential
13TYPE CURVE INPUTS AND ECONOMICS
Diversity of plays provide options to invest capital
WILLESDEN GREEN BRAZEAU COLUMBIA EDSON • Illustrated type curves represent the
ITEM UNIT Falher B Wilrich G Falher A Lean Gas Rich Gas Rock Creek Ellerslie Ellerslie Rich Ellerslie Lean
Type Curve Lateral Length (Meters) 2,100 2,100 2,100 2,100 2,100 1,300 1,300 1,300 2,850
focus of our drilling for the next five
Type Curve Locations (Net) 37 40 10 30 30 216 35 66 18 years
GLJ P+P Booked Locations (Net) 6 24 3 13 7 32 12 24 4
% of Total Inventory (%) 16% 60% 29% 44% 23% 15% 34% 36% 21% • All key projects generate attractive
Volumes returns at strip pricing
IP 365 (boe/d) 681 598 1,367 779 858 482 464 451 683
Raw Gas EUR (MMcf) 5,611 4,303 10,952 7,735 7,735 1,973 2,622 2,127 4,209 • High return projects, combined with
Oil EUR (Mbbl) ‐ ‐ ‐ ‐ ‐ 189 ‐ 121 67
Total Sales EUR (Mboe) 1,176 932 2,395 1,359 1,498 639 667 564 859
short cycle times underpins
Plant C2 Ratio (Bbl/MMcf) 30 30 30 ‐ ‐ 40 39 1 1 resiliency of the business
Plant NGL Ratio ‐ C3+ (Bbl/MMcf) 38 45 47 16.5 37 60 92 56 37
Shrinkage (%) 15% 15% 15% 4.5% 6.0% 23% 26% 9% 9% • The drilling inventory was set up to
EUR Oil/Liquids Weighting (%) 32% 35% 35% 9% 19% 60% 52% 43% 26% give us flexibility to manage
Costs
commodity price swings
Fixed OPEX ($/well/mth) 6,000 6,000 6,000 6,000 6,000 11,400 8,000 4,300 4,500 • The Columbia POD was developed
Raw Gas Variable OPEX ($/mcf) 0.50 0.58 0.40 0.55 0.70 0.72 1.01 0.15 0.15 to give us capital allocation
Oil Variable OPEX ($/bbl) 2.8 2.70 2.70 flexibility during compressed gas
DCE CAPEX (MM$) 3.7 3.7 3.7 3.7 3.7 5.0 3.2 2.7 4.1 prices
BT Single Well Economics (July 1, 2021)
BT IRR (%) 141% 105% 679% 208% 281% 117% 195% 487% 248%
• The addition of Edson has added
Capital Efficiency ($/boe/d) 5,433 6,187 2,707 4,750 4,312 10,373 6,897 5,987 6,003 further oil leverage
BT NPV @ 10% (MM$) 5.5 4.0 15.7 6.3 7.8 5.5 3.1 5.2 4.9
Payout (Months) 10 12 6 10 9 12 9 6 7 • Have continued to capture
additional projects throughout the
commodity downturn
14HALF CYCLE ECONOMICS IS OUR COMPETITIVE ADVANTAGE
Abundant legacy infrastructure exits throughout our operating area
Plentiful Midstream Options within Franchise Area
• A hallmark of Westbrick’s strategy is to target
development within areas that contain abundant
under utilized capacity, which allows the Company to
avoid the dilution to half‐cycle returns that is posed
by full cycle investments otherwise required for
greenfield developments.
• As a result of legacy development within the Greater
Pembina area, significant “white space” is available to
facilitate Westbrick’s growth plans.
> 1.8 Bcf/d of midstream capacity lies within our
franchise area with 1.1 Bcf/d of available
capacity (40% utilization)
> Capacity within 3rd party (competitor) gas
plants > 30 Mmcf/d totals 2.5 Bcf/d with our
franchise area with ~1.4 Bcf/d available
> 1,200 km of 4” or greater midstream pipelines
lie within the franchise area Half cycle advantage illustrated – re‐use of existing surface location:
> Almost 8,000 km of 4” or greater 3rd party Drilling underway on 05‐28‐046‐13W5 well with existing producer 04‐27‐046‐13W5 in
the foreground
(competitor) pipelines lie within the franchise
area
• Surface locations from legacy development can be
reused in order to avoid the cost of lease construction
and tie‐ins.
15DEEP BASIN PLAY AREA EXPANSION
Applying our Deep Basin knowledge to an undercapitalized asset
Northwest Deep Basin Acquisition Northwest Deep Basin Acquisition Overview
• The acquired Edson land position consists of over 260,000 net acres (78% average working interest). Primary targets have been the
Lower Mannville (primarily Ellerslie), with the Spirit River is prevalent throughout the land base. Target horizons are identical to those
currently being exploited by Westbrick allowing it to leverage its accumulated technical capabilities.
• The assets have seen minimal capital during the last several years with only 10 wells rig released since the beginning of 2019. As a
result of inactivity, production has declined from 11,300 boe/d to ~7,600 boe/d currently.
• Substantial owned infrastructure exists to facilitate low cost development including the 100% WI 33.5 Mmcf/d 12‐15 Rosevear Gas
Plant.
• The assets have a modest ARO footprint an undiscounted ARO liability of $35 Mm and required annual inactive ARO spending
estimated at $0.5 Mm; similar to Westbrick standalone.
• The acquired Edson infrastructure would also provide an egress solution to facilitate the development of our Minnow Lake lands
• Production from the assets is forecast to average 7,300 boe/d in 2021 and cash flow of $49 Mm. Implied purchase multiple is 2.9x
2021 EBITDA.
• The asset was financed entirely through RBL drawings, with Westbrick 2021 exit net debt increasing to 0.9x from 0.4x prior to the
acquisition.
Implied Multiple1 Metric Edson Valuation
Purchase Price ($Mm) $143
TEV / 2021E EBITDA ($Mm) $49 2.9x
TEV / 2022E EBITDA ($Mm) $62 2.3x
TEV / 2021E Production (boe/d) 7,262 $19,691
TEV / 2022E Production (boe/d) 9,819 $14,564
Westbrick Land Acquisition Lands TEV / NAV PV-10 ($Mm) $291 0.5x
Acquisition Pipelines and WI Gas Plants TEV / NAV PV-15 ($Mm) $204 0.7x
1Forecasts reflect June 1, 2021 strip Undeveloped Value / Net Location ($Mm) 432 $0.1
16WESTBRICK ANALYSIS
Westbrick Peer Benchmarking (Forward strip pricing as at July 1, 2021)
Production Growth 21E ‐ 22E (%)
45%
28% 23%
6% 13% 15%
8% Peer Group Average 14%
3%
2021E YE Net Debt / LTM CF¹ (x)
1.8x
1.3x
0.7x 0.7x 0.7x
0.9x
Peer Group Average 0.8x
0.4x
0.1x
Q1 2021 Opex & Transportation Costs ($/boe)
$15.47 $16.18
$8.70 $8.82
Peer Group Average $9.25
$6.02 $6.40 $5.59
$3.18
Source: Company Disclosure and FactSet as at Jul. 1, 2021, as per broker estimates at strip prices
1 Net debt includes lease liabilities and working capital deficit (surplus)
175-YEAR FINANCIAL FORECAST1
Westbrick Forecast Summary (Forward strip pricing as at July 1, 2021)
Production (Mboe/d) & Capital Expenditures ($MM) EBITDA ($MM)
$232 $216 $212 $213
$421
$371 $386
$143 80
74 $332
67
52 $220
32
2021E 2022E 2023E 2024E 2025E 2021E 2022E 2023E 2024E 2025E
Cash Flow ($MM) Free Cash Flow1 ($MM) & YE Net Debt / LTM Cash Flow (x)
YE ND / LTM CF 0.7x 0.2x n.m. n.m. n.m.
$365
$330 $334 $152
$306
$114 $121
$215
$72 $74
2021E 2022E 2023E 2024E 2025E 2021E 2022E 2023E 2024E 2025E
1 Free cash flow calculated as cash from operations less capital expenditures
18COMPELLING FREE CASH FLOW PROFILE1
Forecasted Annual Free Cash Flow (Forward strip pricing as at July 1, 2021)
Cumulative Free Cash Flow Sensitivity ($MM)
Free Cash Flow Discretionary Free Cash Flow
$0.4 billion cumulative free cash flow 2021‐2025 AECO
C$/GJ $60.00
WTI (US$/bbl)
$65.00 $70.00
AECO
C$/GJ $60.00
WTI (US$/bbl)
$65.00 $70.00
$2.00 $277 $347 $416 $2.00 $745 $815 $884
$2.50 $473 $540 $604 $2.50 $941 $1,008 $1,072
$0.9 billion cumulative discretionary free cash flow 2021‐2025 $3.00 $661 $726 $790 $3.00 $1,129 $1,194 $1,258
67 74 80
52
32
$231
$220 $210
$193
$147 $152
$114 $121
$72 $74
2021E 2022E 2023E 2024E 2025E
Free Cash Flow Discretionary Free Cash Flow Production
19RISK MANAGEMENT THROUGH HEDGING
Hedge portfolio designed to protect downside and economic returns
• Westbrick employs a relatively vanilla hedging program that utilizes a combination of swaps and collars
• Positions are actively layered in to build out the risk management portfolio
• Hedging goals for 2021 are largely complete. Focus is shifting to bolstering downside protection in 2022.
Natural gas production hedged1 Crude oil production hedged1
Thousands GJ/day Bbl/day
100 60% 1,500 80%
1,250
80
45% 60%
1,000
60
30% 750 40%
40
500
15% 20%
20
250
– 0% – 0%
Q3'2021 Q4'2021 2022 Q3'2021 Q4'2021 2022
Production Hedged % Hedged Production Hedged % Hedged
1Positions as of June 29, 2021
20WESTBRICK ANALYSIS
Westbrick Peer Benchmarking1 (Forward strip pricing as at July 1, 2021)
YE Net Debt / CF Production Production Growth
Share Price Market Cap Net Debt² TEV 2021E 2022E 2021E 2022E '20A ‐ '21E '21E ‐ '22E
($ / sh) ($MM) ($MM) ($MM) (x) (x) (Mboe/d) (Mboe/d) (%) (%)
Tourmaline $30.90 $9,342 $1,648 $11,436 0.1x (0.4x) 442 500 42% 13%
ARC $9.79 $7,098 $2,355 $8,229 0.3x (0.1x) 301 341 86% 13%
Paramount $17.41 $2,532 $669 $3,027 0.7x 0.4x 82 87 20% 6%
Peyto $8.38 $1,428 $1,177 $2,361 1.3x 0.9x 91 102 14% 13%
Birchcliff $5.31 $1,553 $792 $2,267 0.9x 0.4x 80 83 5% 3%
NuVista $4.08 $959 $685 $1,546 1.8x 0.9x 52 66 2% 28%
Advantage $4.95 $931 $248 $1,115 0.4x 0.0x 50 53 10% 8%
Spartan Delta $6.02 $792 ($2) $790 0.1x (0.3x) 38 43 144% 15%
Crew $2.24 $369 $379 $459 0.7x (0.0x) 27 33 23% 23%
Storm $3.63 $458 $122 $508 0.2x (0.3x) 28 33 19% 19%
Average 0.7x 0.2x 37% 14%
Min. 0.1x (0.4x) 2% 3%
Max. 1.8x 0.9x 144% 28%
Westbrick 0.7x 0.2x 32 52 30% 61%
TEV / Discretionary FCF Yield
Price / CF DACF Production Unlevered Levered
2021E 2022E 2021E 2022E 2021E 2022E 2021E 2022E 2021E 2022E
(x) (x) (x) (x) ($/boe/d) ($/boe/d) (%) (%) (%) (%)
Tourmaline 3.0x 3.0x 4.0x 3.6x $25,897 $22,863 16% 19% 22% 22%
ARC 2.3x 2.5x 3.0x 2.6x $27,329 $24,110 20% 24% 28% 25%
Paramount 3.6x 3.9x 4.1x 4.2x $36,911 $34,870 17% 16% 20% 18%
Peyto 2.2x 2.1x 3.3x 3.0x $26,090 $23,058 19% 21% 30% 32%
Birchcliff 2.9x 2.9x 4.1x 3.7x $28,233 $27,348 16% 18% 23% 22%
NuVista 2.7x 1.9x 3.8x 3.0x $29,898 $23,420 15% 22% 21% 37%
Advantage 3.2x 3.3x 3.7x 3.4x $22,516 $20,872 19% 21% 23% 23%
Spartan Delta 4.5x 3.9x 4.9x 4.1x $21,023 $18,207 17% 21% 18% 22%
Crew 1.3x 1.1x 2.3x 1.9x $16,921 $13,730 15% 20% 54% 67%
Storm 2.5x 2.1x 2.7x 2.3x $18,326 $15,337 26% 32% 32% 41%
Average 2.8x 2.7x 3.6x 3.2x $25,315 $22,382 18% 22% 27% 31%
Min. 1.3x 1.1x 2.3x 1.9x $16,921 $13,730 15% 16% 18% 18%
Max. 4.5x 3.9x 4.9x 4.2x $36,911 $34,870 26% 32% 54% 67%
Westbrick (Share Price @ Avg.)³ $15.55 $17.70 $16.11 $21.25 $14.25 $19.50 $13.87 $16.05
Westbrick (Share Price @ Min.)³ $8.74 $9.49 $9.73 $11.82 $17.30 $26.59 $20.88 $27.10
Westbrick (Share Price @ Max.)³ $22.29 $24.57 $24.93 $34.86 $8.80 $12.01 $6.96 $7.42
Source: Company Disclosure and FactSet as at Jul. 1, 2021, as per broker estimates at strip prices. 4 Westbrick assumptions as follows:
1 Hedges monetized.
2021E DACF ($MM) $246 2022E YE Net Debt ($MM) $75 Current Production (Mboe/d) 36
2 Net debt includes lease liabilities.
2022E DACF ($MM) $310 2021E Maint. Capex ($MM) $68 2022E Production (Mboe/d) 52
3 Westbrick TEV / 2021E Production based on current production.
2021E YE Net Debt ($MM) $148 2022E Maint. Capex ($MM) $75 Shares O/S (MM) 47.35 21WESTBRICK GENERATING RETURNS FOR OUR SHAREHOLDERS
All the ingredients are in place to substantially grow our free cash flow
Careful use of debt and equity to improve shareholder value
For the past five years have preserved shareholder capital during one of the toughest periods of time for our industry
Have not taken concentrated risks that depend on strengthening commodity prices to be successful
Westbrick competitive advantages
• Diversified drilling portfolio, will focus on gas development
• Clean balance sheet
• No commitments “I am proud to be part of an organization that
• AECO marketing strategy demonstrates integrity in the pursuit of
• Top decile capital efficiency excellence, and faces all challenges while
• Very little ARO liability having fun doing it.”
Ken McCagherty, President & CEO October 2020
• Accurate, current and analytical information systems
• Culture: Everyone is focused on being a success
In 2021 Westbrick has commenced our next major growth cycle.
22DISCLAIMER
General
This presentation is not, and does not constitute, an advertisement, an offer to sell or the solicitation, invitation or recommendation to purchase any securities in any jurisdiction. Neither this presentation nor anything contained herein shall form the basis of any contract or
commitment and no part of it shall form the basis of or be relied upon in connection with any contract, commitment or investment decision in relation thereto. This document and its contents are confidential. It is being supplied to you solely for your information and may not
be reproduced or forwarded to any other person or published (in whole or in part) for any purpose. Certain information contained herein has been prepared by third-party sources. Such information has not been independently audited or verified by Westbrick Energy Ltd.
(“Westbrick” or the “Company”).
This presentation is provided for informational purposes only as of the date hereof, is not complete, and may not contain certain material information about Westbrick, including important disclosures and risk factors associated with an investment in Westbrick. Neither
Westbrick nor any of its directors, officers, employees, agents or advisors makes any representation or warranty in respect of the contents of this presentation or otherwise in relation to Westbrick or its business. In particular, no representation or warranty, express or implied, is
made as to the fairness, accuracy or completeness of the information or opinions contained herein, which have not been independently verified. In the event of a subsequent offer to sell or a solicitation of an offer to purchase securities by Westbrick, disclosures, the terms and
conditions relating to, and the representations and warranties for, a particular investment will be contained in the offering documents and/or subscription agreement prepared for such offer or solicitation. Except pursuant to applicable law, no person shall have any right of
action against Westbrick or any other person in relation to the accuracy or completeness of the information contained in this presentation. The information contained in this presentation is provided as at the date hereof and is subject to amendment, revision and updating in any
way without notice or liability to any party.
Forward-Looking Statements
This presentation contains certain statements and information that constitute forward-looking statements and forward-looking information as defined under applicable securities legislation (collectively, "forward-looking statements"). These forward-looking statements relate to
future events or future performance of Westbrick . All statements other than statements of historical fact are forward-looking statements. The use of any of the words "anticipate", "plan", "contemplate", "continue", "estimate", "expect", "intend", "propose", "might", "may",
"will", "shall", "project", "should", "could", "would", "believe", "predict", "forecast", "pursue", "potential" and "capable" and similar expressions are intended to identify forward looking statements. These statements involve known and unknown risks, uncertainties and other
factors that may cause actual results or events to differ materially from those anticipated in such forward-looking statements. No assurance can be given that these expectations will prove to be correct and such forward-looking statements included in this presentation should not
be unduly relied upon. These statements speak only as of the date of this presentation. This presentation contains forward-looking statements attributed to third party industry sources. Westbrick believes such information is accurate and that the sources from which it has been
obtained are reliable. However, the accuracy and completeness of such information cannot be guaranteed and the assumptions upon which information are based have not been independently verified.
In particular and without limitation, in this presentation there are forward-looking statements pertaining to among other things: our strategic plans and growth strategies; financial outlook for 2021 and for the five year period from 2021 to 2025, including EBITDA, free cash
flow, cash flow, capital expenditures, and net debt over cash flow; 2021 reserves amounts; year-end net debt; forecast production rates from Westbrick's assets; 2021 and 2022 estimated EBITDA and production from acquired assets; Westbrick's plans to manage its financial
structure; future commodity cost prices and costs; expectations with respect to debt-adjusted cash flow and capital efficiencies; Westbrick's net debt to forward year cash flow leverage ratio and leverage metrics; Westbrick's hedging activities; and Westbrick's plans for
exploration and development activities and the expected results for such activities.
In addition, statements relating to “reserves” and related net present values are deemed to be forward-looking statements as they involve the implied assessment based on certain estimates and assumptions that the reserves described can be profitably produced in the future.
There are numerous uncertainties inherent in estimating quantities of reserves and in projecting future rates of production and the timing of development expenditures. The total amount or timing of actual future production may vary from reserve and production estimates.
Developing forward-looking information involves reliance on a number of assumptions and consideration of certain risks and uncertainties, some of which are specific to Westbrick and others that apply to the industry generally. The factors or assumptions on which the
forward-looking information in this presentation is based include, among other things: future crude oil, NGL and natural gas prices; future exchange rates, Westbrick's ability to obtain qualified staff and equipment in a timely and cost-efficient manner; the regulatory
framework governing royalties, taxes and environmental matters in the jurisdictions in which Westbrick conducts its business and any other jurisdictions in which Westbrick may conduct its business in the future; Westbrick's ability to market production of oil and natural gas
successfully to customers; Westbrick's future production levels; the applicability of technologies for recovery and production of Westbrick's reserves; the recoverability of Westbrick's reserves; future capital expenditures to be made by Westbrick; future cash flows from
production meeting the expectations stated in this presentation; future sources of funding for Westbrick's capital program; Westbrick's future debt levels; geological and engineering estimates in respect of Westbrick's reserves; the geography of the areas in which Westbrick is
conducting exploration and development activities; the impact of competition on Westbrick; and Westbrick's ability to obtain future financing on acceptable terms or at all.
Actual results could differ materially from those anticipated in these forward-looking statements as a result of the risk factors including, but not limited to: business operations and capital costs; US/CAD exchange rates; Westbrick's status and stage of development, the
management of growth and its ability to successfully complete development plans; general economic, market and business conditions; volatility in market prices and demand for crude oil and natural gas and hedging activities related thereto; seasonality of the Canadian oil and
natural gas industry; risks related to the exploration, development and production of oil and natural gas reserves; current global financial conditions, including fluctuations in interest rates, foreign exchange rates and stock market volatility; the effects of the COVID-19
pandemic; risks related to the timing of completion of Westbrick's projects; competition for, among other things, capital, the acquisition of reserves and skilled personnel; operational hazards; actions by governmental authorities, including changes in government regulation and
taxation; environmental risks and hazards; risks inherent in the exploration, development and production of oil and natural gas which may create liability to Westbrick in excess of Westbrick's insurance coverage; cost of new technologies; failure to accurately estimate
23DISCLAIMER (CONT’D)
abandonment and reclamation costs; failure of third parties' reviews, reports and projections to be accurate; the availability of capital on acceptable terms; political risks; risks associated with climate change and Westbrick’s assumptions relating thereto; changes to royalty or tax
regimes; the failure of Westbrick or the holders of certain licenses or leases to meet specific requirements of such licenses or leases; claims made in respect of Westbrick's properties or assets; aboriginal claims; unforeseen title defects; risks arising from future acquisition
activities; potential conflicts of interest; the potential for management estimates and assumptions to be inaccurate; risks associated with establishing and maintaining systems of internal controls; risks related to the reliance on historical financial information; liquidity and
additional funding requirements; additional indebtedness; failure to engage or retain key personnel; potential losses which would stem from any disruptions in production, including work stoppages or other labour difficulties, or disruptions in the transportation network on
which Westbrick is reliant; uncertainties inherent in estimating quantities of oil and natural gas reserves; failure to acquire or develop replacement reserves; geological, technical, drilling and processing problems, including the availability of equipment and access to properties;
and disclosure of confidential information of Westbrick.
Financial outlook and future-oriented financial information contained in this presentation about prospective financial performance, financial position or cash flows is based on assumptions about future events, including economic conditions and proposed courses of action,
based on management's assessment of the relevant information currently available and is subject to the same risk factors, limitations and qualifications as set forth above. The financial information included in this presentation, including prospective financial information, has
been prepared by, and is the responsibility of, management. Westbrick and its management believe that such financial information has been prepared on a reasonable basis, reflecting the best estimates and judgments, and that prospective financial information represents, to the
best of management's knowledge and opinion, Westbrick's expected course of action. However, because this prospective information is highly subjective, it should not be relied on as necessarily indicative of past or future results. Pricing assumptions for financial outlook are
included in the Appendix slide. The Company’s five-year plan has been derived by utilizing, among other assumptions historical Westbrick production performance and current cost assumptions. Financial outlook and future-oriented financial information for 2022 and beyond
provided for illustration only. Budgets and forecasts beyond 2021 have not been finalized and are subject to a variety of factors including prior year’s results.
The forward-looking statements included in this presentation are expressly qualified by this cautionary statement and are made as of the date of this presentation. Westbrick does not undertake any obligation to publicly update or revise any forward-looking statements except as
required by applicable securities laws.
Presentation of Financial Information
Unless otherwise indicated, references to "CDN$" or "$" are to Canadian dollars and references to "US$" are to U.S. dollars. Unless otherwise indicated, all financial information relating to Westbrick in this presentation has been prepared in Canadian dollars using International
Financial Reporting Standards ("IFRS").
Non-IFRS Measures
This presentation contains financial measures that do not have any standardized meanings prescribed by IFRS, including, EBITDA, funds flow from operations, free cash flow, discretionary free cash flow, debt adjusted cash flow, netbacks and net debt. None of these measures
are used to enhance the Company’s performance or position. These measures may not be comparable to similar measures presented by other issuers and should not be considered in isolation with measures that are prepared in accordance with IFRS, as an indicator of financial
performance. These measures are considered useful a complementary measures in assessing Westbrick’s performance, efficiency and liquidity.
“EBITDA” is a non-IFRS measure which should not be considered an alternative to, or more meaningful than, “net earnings (loss)” as determined in accordance with IFRS, as an indicator of financial performance. EBITDA is presented to assist management and investors in
analyzing operating performance by business in the stated period. EBITDA equals net earnings (loss) plus finance expenses (income), provisions for (recovery of) income taxes, and depletion, depreciation and amortization.
“Funds flow from operations” or “FFO” is a non-IFRS measure which should not be considered an alternative to, or more meaningful than, “cash flow – operating activities” as determined in accordance with IFRS, as an indicator of financial performance. FFO is presented to
assist management and investors in analyzing operating performance of the Company. FFO equals cash flow – operating activities plus change in non-cash working capital.
“Free cash flow” or “FCF” is a non-IFRS measure which should not be considered an alternative to, or more meaningful than, “cash flow – operating activities” as determined in accordance with IFRS, as an indicator of financial performance. FCF is presented to assist
management and investors in analyzing operating performance by the business. FCF equals cash flow – operating activities less capital expenditures.
“Discretionary free cash flow” is a non-IFRS measure which should not be considered an alternative to, or more meaningful than, “cash flow – operating activities” as determined in accordance with IFRS, as an indicator of financial performance. Discretionary free cash flow is
presented to assist management and investors in analyzing operating performance by the business in the stated period. Discretionary free cash flow equals cash flow – operating activities less capital expenditures required to maintain existing productive capacity.
“Debt-adjusted cash flow” is a non-IFRS measure which should not be considered alternative to, or more meaningful than, “cash flow – operating activities” as determined in accordance with IFRS, as an indicator of financial performance. It is presented to assist management
and investors in analyzing operating performance by the business in the stated period. Debt-adjusted cash flow resents fund flows from operations prior to the impact of interest charges.
“Operating netback” is a common non-IFRS measure used in the oil and gas industry. Management believes this measure assists management and investors to evaluate the specific operating performance by product at the oil and gas lease level. Operating netback is calculated
as gross revenue less royalties, production and operating and transportation costs on a per unit basis. 24DISCLAIMER (CONT’D)
“Operating netback” is a common non-IFRS measure used in the oil and gas industry. Management believes this measure assists management and investors to evaluate the specific operating performance by product at the oil and gas lease level. Operating netback is calculated
as gross revenue less royalties, production and operating and transportation costs on a per unit basis.
“Net debt” is a non-IFRS measure that equals total debt less cash and cash equivalents. Total debt is calculated as long-term debt, long-term debt due within one year and short-term debt. Net debt is considered to be a useful measure in assisting management and investors to
evaluate the Company's financial strength.
Presentation of Oil and Gas Information
Reserves Data: Reserves data set forth in this presentation is based upon an evaluation of the Company’s reserves prepared by GLJ effective January 1, 2021, mechanically updated to July 1, 2021 and prepared in accordance with the Canadian Oil and Gas Evaluation
Handbook. The discounted and undiscounted net present value of future net revenues attributable to reserves do not represent the fair market value of such reserves. There are numerous uncertainties inherent in estimating quantities of oil and natural gas and the future cash
flows attributed to such reserves. The reserve and associated cash flow information set forth in this presentation are estimates only. In general, estimates of economically recoverable oil and natural gas and the future net cash flows therefrom are based upon a number of variable
factors and assumptions, such as historical production from the properties, production rates, ultimate reserve recovery, timing and amount of capital expenditures, marketability of oil and natural gas, royalty rates, the assumed effects of regulation by governmental agencies and
future operating costs, all of which may vary materially. For these reasons, estimates of the economically recoverable oil and natural gas reserves attributable to any particular group of properties, classification of such reserves based on risk of recovery and estimates of future
net revenues associated with reserves prepared by different engineers, or by the same engineers at different times, may vary. Westbrick's actual production, revenues, taxes and development and operating expenditures with respect to its reserves will vary from estimates thereof
and such variations could be material. Readers are cautioned that the foregoing list of risk factors should not be construed as exhaustive.
Barrels of oil equivalent: Throughout this presentation, the calculation of barrels of oil equivalent ("boe") is based on the widely recognized conversion rate of 6,000 cubic feet ("mcf") of natural gas for 1 barrel ("bbl") of oil. Boe conversions may be misleading, particularly if
used in isolation. A boe conversion ratio of 6 mcf:1 bbl is based on an energy equivalency conversion method primarily applicable at the burner tip and does not represent a value equivalence at the wellhead. As the value ratio between crude oil and natural gas based on the
current price of crude oil and natural gas is significantly different from the energy equivalency of 6:1, utilizing a conversion on a 6:1 basis may be misleading as an indication of value.
Drilling locations: The 1,500 net drilling locations referred to are comprised of less than 20% booked locations. Unbooked locations are internal management estimates. Unbooked locations do not have attributed reserves or resources. Unbooked locations have been
identified by management as an estimation of Westbrick’s multi‐year drilling activities based on evaluation of applicable geologic, seismic, engineering, production and reserves information. There is no certainty that the Company will drill any or all unbooked drilling
locations and if drilled there is no certainty that such locations will result in additional oil and gas reserves, resources or production. The drilling locations on which the Company will actually drill wells, including the number and timing thereof is ultimately dependent upon the
availability of funding, commodity prices, provincial fiscal and royalty policies, costs, actual drilling results, additional reservoir information that is obtained and other factors.
Type Curve Information and Estimated Ultimate Recovery: This presentation provides indicative information regarding the Company’s type curve parameters and economics. Type curve information reflects current operating experience in relation to wells of the indicated
type, including with respect to costs, production and decline rates, and are based on pricing assumptions. There is no assurance that actual well results will be in accordance with those suggested by the type curve information. Actual results will differ, and the difference may be
material. The type curve information includes estimated ultimate recovery (EUR), which is a measure commonly used in the oil and natural gas industry but is not a resource category or defined term under the COGE Handbook. EUR refers to the quantity of petroleum
estimated to be potentially recoverable from an accumulation, plus quantities already produced therefrom. EUR does not, however, have a standardized meaning and may not be comparable to similar measures presented by other companies. Accordingly, EUR should not be
used for comparisons. EUR estimates in this presentation reflect type curve information based on internal empirical data and publicly available information sources believed to be independent. There is no assurance that EUR volumes are recoverable or that it will be
commercially viable to produce any portion thereof. Management uses EUR for internal corporate performance purposes and to provide a measure to assess that performance over time; however, such measure is not a reliable indicator of future performance and therefore should
not be unduly relied upon. The well test results and initial production rates provided in this presentation should be considered to be preliminary, except as otherwise indicated. Test results and initial production rates disclosed herein may not necessarily be
indicative of long‐term performance or of ultimate recovery.
Capital Efficiency: The Company uses the term “capital efficiency”, which is calculated by dividing the development capital per well by the well’s initial production rate ($ per flowing barrel, mcf or boe). Development capital includes the cost to drill, complete, equip and tie-
in wells to existing infrastructure. As capacity becomes available within facilities, new wells are added to replace the volume. The number of wells required to replace such volume is a function of capital efficiency. Capital efficiency does not have any standardized meaning
and therefore should not be used to make comparisons to similar measures presented by other issuers.
Recycle Ratio and FD&A: Recycle ratio is calculated as operating netback divided by finding and development costs for the particular reserves category. “Finding and development costs” are calculated by dividing: (i) total capital expenditures for the period (excluding
corporate expenditures and land and property acquisitions) by (ii) the net changes in reserves from the prior year from extensions/improved recovery, technical revisions and economic factors. Recycle ratio does not have any standardized meaning and therefore should not be
used to make comparisons to similar measures presented by other issuers. FD&A is finding and development costs, plus land and property acquisitions.
25Suite 2300 520 – 3th Ave SW
Calgary Alberta T2P 0R3
Proud Supporter
Ken McCagherty, President & CEO
T: (587) 293 4660
E: mccagherty@westbrick.ca
Lloyd Heine, VP Finance & CFO
T: (587) 293 4679
E: lheine@westbrick.ca
Bankers: NBC, TD, CIBC, HSBC, BMO, BDC, CWB
Evaluation Engineers: GLJ Petroleum Consultants
Auditors: KPMG LLP
Legal Counsel: Osler, Hoskin & Harcourt LLPYou can also read