Fixed Income Investor Presentation - June 2019 - BMO Bank of Montreal

Page created by John Olson
 
CONTINUE READING
Fixed Income Investor Presentation - June 2019 - BMO Bank of Montreal
Fixed Income
Investor Presentation
June 2019
Fixed Income Investor Presentation - June 2019 - BMO Bank of Montreal
Forward looking statements & non-GAAP measures
Caution Regarding Forward-Looking Statements
Bank of Montreal’s public communications often include written or oral forward-looking statements. Statements of this type are included in this document, and may be included in other filings with Canadian securities
regulators or the U.S. Securities and Exchange Commission, or in other communications. All such statements are made pursuant to the “safe harbor” provisions of, and are intended to be forward-looking statements under, the
United States Private Securities Litigation Reform Act of 1995 and any applicable Canadian securities legislation. Forward-looking statements in this document may include, but are not limited to, statements with respect to our
objectives and priorities for fiscal 2019 and beyond, our strategies or future actions, our targets, expectations for our financial condition or share price, the regulatory environment in which we operate and the results of or
outlook for our operations or for the Canadian, U.S. and international economies, and include statements of our management. Forward-looking statements are typically identified by words such as “will”, “would”, “should”,
“believe”, “expect”, “anticipate”, “project”, “intend”, “estimate”, “plan”, “goal”, “target”, “may” and “could”.
By their nature, forward-looking statements require us to make assumptions and are subject to inherent risks and uncertainties, both general and specific in nature. There is significant risk that predictions, forecasts, conclusions
or projections will not prove to be accurate, that our assumptions may not be correct, and that actual results may differ materially from such predictions, forecasts, conclusions or projections. We caution readers of this
document not to place undue reliance on our forward-looking statements, as a number of factors – many of which are beyond our control and the effects of which can be difficult to predict – could cause actual future results,
conditions, actions or events to differ materially from the targets, expectations, estimates or intentions expressed in the forward-looking statements.
The future outcomes that relate to forward-looking statements may be influenced by many factors, including but not limited to: general economic and market conditions in the countries in which we operate; the Canadian
housing market; weak, volatile or illiquid capital and/or credit markets; interest rate and currency value fluctuations; changes in monetary, fiscal, or economic policy and tax legislation and interpretation; the level of
competition in the geographic and business areas in which we operate; changes in laws or in supervisory expectations or requirements, including capital, interest rate and liquidity requirements and guidance, and the effect of
such changes on funding costs; judicial or regulatory proceedings; the accuracy and completeness of the information we obtain with respect to our customers and counterparties; failure of third parties to comply with their
obligations to us; our ability to execute our strategic plans and to complete and integrate acquisitions, including obtaining regulatory approvals; critical accounting estimates and the effect of changes to accounting standards,
rules and interpretations on these estimates; operational and infrastructure risks, including with respect to reliance on third parties; changes to our credit ratings; political conditions, including changes relating to or affecting
economic or trade matters; global capital markets activities; the possible effects on our business of war or terrorist activities; outbreaks of disease or illness that affect local, national or international economies; natural disasters
and disruptions to public infrastructure, such as transportation, communications, power or water supply; technological changes; information and cyber security, including the threat of hacking, identity theft and corporate
espionage, as well as the possibility of denial of service resulting from efforts targeted at causing system failure and service disruption; and our ability to anticipate and effectively manage risks arising from all of the foregoing
factors.
We caution that the foregoing list is not exhaustive of all possible factors. Other factors and risks could adversely affect our results. For more information, please see the discussion in the Risks That May Affect Future Results
section, and the sections related to credit and counterparty, market, insurance, liquidity and funding, operational, model, legal and regulatory, business, strategic, environmental and social, and reputation risk, in the Enterprise-
Wide Risk Management section which begin on page 78 of BMO’s 2018 Annual Report, and the Risk Management section in BMO’s Second Quarter 2019 Report to Shareholders, all of which outline certain key factors and risks
that may affect our future results. Investors and others should carefully consider these factors and risks, as well as other uncertainties and potential events, and the inherent uncertainty of forward-looking statements. We do
not undertake to update any forward-looking statements, whether written or oral, that may be made from time to time by the organization or on its behalf, except as required by law. The forward-looking information
contained in this document is presented for the purpose of assisting our shareholders in understanding our financial position as at and for the periods ended on the dates presented, as well as our strategic priorities and
objectives, and may not be appropriate for other purposes.
Material economic assumptions underlying the forward-looking statements contained in this document are set out in the 2018 Annual Report under the heading “Economic Developments and Outlook”, as updated by the
Economic Review and Outlook section set forth in BMO’s Second Quarter 2019 Report to Shareholders. Assumptions about the performance of the Canadian and U.S. economies, as well as overall market conditions and their
combined effect on our business, are material factors we consider when determining our strategic priorities, objectives and expectations for our business. In determining our expectations for economic growth, both broadly and
in the financial services sector, we primarily consider historical economic data provided by governments, historical relationships between economic and financial variables, and the risks to the domestic and global economy.
See the Economic Review and Outlook section of BMO’s Second Quarter 2019 Report to Shareholders.

Non-GAAP Measures
Bank of Montreal uses both GAAP and non-GAAP measures to assess performance. Readers are cautioned that earnings and other measures adjusted to a basis other than GAAP do not have standardized meanings
under GAAP and are unlikely to be comparable to similar measures used by other companies. Reconciliations of GAAP to non-GAAP measures as well as the rationale for their use can be found on page 4 of BMO’s
Second Quarter 2019 Report to Shareholders and on page 27 of BMO’s 2018 Annual Report, all of which are available on our website at www.bmo.com/investorrelations.
Examples of non-GAAP amounts or measures include: efficiency and leverage ratios; revenue and other measures presented on a taxable equivalent basis (teb); amounts presented net of applicable taxes; results and
measures that exclude the impact of Canadian/U.S. dollar exchange rate movements, adjusted net income, revenues, non-interest expenses, earnings per share, effective tax rate, ROE, efficiency ratio, pre-provision
pre-tax earnings, and other adjusted measures which exclude the impact of certain items such as, acquisition integration costs, amortization of acquisition-related intangible assets, decrease (increase) in collective
allowance for credit losses, restructuring costs, revaluation of U.S. net deferred tax asset as a result of U.S. tax reform and the remeasurement of an employee benefit liability as a result of an amendment to the plan.
Bank of Montreal provides supplemental information on combined business segments to facilitate comparisons to peers.

                                                                                                                                                                            Investor Presentation  June 2019                              2
Who We Are
Established in 1817, BMO Financial Group is a highly diversified financial services provider based in North America

             8th largest                                                           $830 billion
             bank in North America
                                                                                             in total assets
                   by assets1                                                                                                             An engaged and diverse team
                                                                                                                                                 of employees

                                                                              Three operating groups

        Personal and                                                                      BMO Wealth                                           BMO Capital
     Commercial Banking                                                                   Management                                            Markets

                                                  12+ million                                                8+ million                         2+ million
 We serve:                                             customers globally                                 personal and commercial             personal, small business
                                                                                                            customers in Canada              and commercial customers
                                                                                                                                                in the United States

 Committed to
                                                                                                                                                         #2
 Sustainable                                   Named One of the World's Most                             Signatory to the UN Principles       Customers ranked BMO the
                                                  Ethical Companies by the
 Performance:                                    Ethisphere Institute for the
                                                                                                          for Responsible Investment            second most reputable
                                                                                                                                                  among U.S. banks2
                                                    second year in a row
 * All amounts in this presentation in Canadian dollars unless otherwise noted
 1 - source: Bloomberg, as at April 30, 2019
 2 - Based on American Banker and the Reputation Institute’s customer surveys of the 40 largest U.S. banks by assets
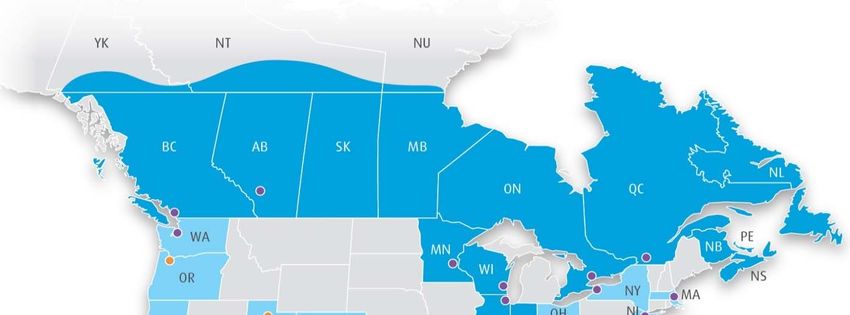
                                                                                                                                           Investor Presentation  June 2019   3
BMO’s Strategic Footprint
BMO’s strategic footprint spans strong regional economies. Our three operating groups – Personal and
Commercial Banking, BMO Capital Markets and BMO Wealth Management – serve individuals, businesses,
governments and corporate customers across Canada and the United States. Our significant presence in North
                                                                                                              70%                    31%
                                                                                                              An estimated 70% of    The metropolitan areas
America is bolstered by operations in select global markets in Europe, Asia, the Middle East and South        corporate customers    that comprise the majority
America, allowing us to provide all our customers with access to economies and markets around the world       have cross-border      of BMO’s strategic U.S.
                                                                                                              needs                  footprint account for
                                                                                                                                     approximately 31% of
                                                                                                                                     overall U.S. GDP

                                                                                                                           International Offices
                                                                                                              BMO Capital Markets    BMO Wealth Management

                                                                                                              Abu Dhabi              Europe and Middle East
                                                                                                              Beijing                Abu Dhabi
                                                                                                              Dublin                 Amsterdam
                                                                                                              Guangzhou              Edinburgh
                                                                                                              Hong Kong              Frankfurt
                                                                                                              London                 Geneva
                                                                                                              Melbourne              Lisbon
                                                                                                              Mumbai                 London
                                                                                                              Paris                  Madrid
                                                                                                              Rio de Janeiro         Milan
                                                                                                              Shanghai               Munich
                                                                                                              Singapore              Paris
                                                                                                              Taipei                 Stockholm
                                                                                                              Zurich                 Zurich

                                                                                                                                     Asia-Pacific
                                                                                                                                     Beijing
                                                                                                                                     Guangzhou
                                                                                                                                     Hong Kong
                                                                                                                                     Shanghai
                                                                                                                                     Singapore
                                                                                                                                     Sydney

                                                                                                             Investor Presentation  June 2019        4
Q2 2019 – Financial Highlights
Adjusted1 net income up Y/Y driven by good growth in P&C businesses

• Adjusted1 EPS $2.30, up 5% Y/Y (reported up 22%)                                                                                              Reported                                 Adjusted1
                                                                                                     ($MM)                            Q2 19        Q1 19       Q2 184         Q2 19         Q1 19       Q2 18
• Adjusted1 net income up 4% Y/Y
                                                                                                                     2
                                                                                                     Net Revenue                      5,652        5,591         5,248        5,652         5,591        5,248
    – U.S. Segment adjusted1 net income up 13% Y/Y
      (reported up 25%); 35% of bank income YTD                                                      Total PCL                         176          137          160            176          137          160

    – Reported net income4 up 20% in part reflecting prior                                           Expenses                         3,595        3,557         3,525        3,563         3,520        3,232
      year restructuring charge                                                                      Net Income                       1,497        1,510         1,246        1,522         1,538       1,463

• Net revenue2 up 8% Y/Y, 6% excluding impact of                                                     Diluted EPS ($)                   2.26         2.28         1.86          2.30         2.32         2.20
  stronger U.S. dollar                                                                               ROE (%)                           13.6         13.6         12.6          13.9         13.9         14.9
                                                                                                            3
• Adjusted1 expenses up 10% Y/Y, 9% excluding                                                        ROTCE (%)                         16.4         16.5         15.6          16.4         16.6         18.0
  impact of stronger U.S. dollar (reported up 2%)                                                    CET1 Ratio (%)                    11.3         11.4         11.3

    – BMO Capital Markets severance expense and
      acquisition accounted for approximately half the Y/Y
      increase
                                                                                                                                           Net Income1 Trends
• Total PCL of $176MM, up $16MM Y/Y
                                                                                                                1,463                1,566                   1,531                  1,538                   1,522
    – PCL on impaired loans $150MM                                                                                                                   1,697
                                                                                                                               1,537                                        1,510
    – PCL on performing loans $26MM                                                                                                                                                                 1,497
                                                                                                        1,246
• Adjusted1 ROE 13.9% (reported 13.6%)

                                                                                                           Q2'18                  Q3'18                  Q4'18                 Q1'19                  Q2'19
                                                                                                                        Reported Net Income ($MM)                        Adjusted Net Income ($MM)

1 Adjusted measures are non-GAAP measures, see slide 2 for more information. For details on adjustments refer to page 4 of BMO’s Q2’19 Report to Shareholders;
  Net revenue is net of insurance claims, commissions and changes in policy benefit liabilities (CCPB). Operating leverage based on net revenue. Reported gross revenue: Q2'19 $6,213MM; Q1'19 $6,517MM; Q2'18 $5,580MM
2 Adjusted Return on Tangible Common Equity (ROTCE) = (Annualized Adjusted Net Income avail. to Common Shareholders) / (Average Common shareholders equity less Goodwill and acquisition-related intangibles net of
  associated deferred tax liabilities). Numerator for Reported ROTCE is Annualized Reported Net Income avail. to Common Shareholders less after-tax amortization of acquisition-related intangibles
3 Q2’18 reported net income includes a restructuring charge of $192 million after-tax ($260 million pre-tax)

                                                                                                                                                        Investor Presentation  June 2019                        5
Strong Capital Position
Strong CET1 Capital Ratio                                                                    -34 bps
                                                    +27 bps

                                                                                                                                      -3 bps                               11.3%

                                                                                                                                                                            1.55%
                                                                                                                                                        9.75%                                       Current OSFI expectation
                                                                                                                                                                            1.75%             Domestic Stability Buffer1
                                                                                                                                                                             1.0%             D-SIB Surcharge

              11.4%                                                                                                                                                          2.5%             Capital Conservation Buffer

                                                                                                                                                                             4.5%             Minimum CET1

              Q1'19                       Internal Capital Generation            Higher source currency RWA             Other changes in CET1 Capital                        Q2'19

  Credit Ratings                                                                                                                          Sound Leverage and Liquidity Ratios

                                        Moody’s              S&P                 DBRS                 Fitch                               • Leverage Ratio 4.2%
  Long term deposits /                  Aa2                  A+                  AA                   AA-                                 • Liquidity Coverage Ratio 132%
  legacy senior debt2
  Senior debt3                          A2                   A-                  AA(low)              AA-

  Outlook                               Stable               Stable              Stable               Stable

1 On June 4, 2019, OSFI announced that it has set the Domestic Stability Buffer at 2.00% of total risk-weighted assets, effective October 31, 2019
2 Long term deposits / legacy senior debt includes: (a) Senior debt issued prior to September 23, 2018; and (b) Senior debt issued on or after September 23, 2018 which is excluded from the Bank Recapitalization
  (Bail-In) Regime
3 Subject to conversion under the Bank Recapitalization (Bail-In) Regime

                                                                                                                                                             Investor Presentation  June 2019                       6
Economic Overview
Economic Outlook and Indicators1

                                                                           Canada                    United States                           Eurozone
  Economic Indicators (%)1, 2                                20182         2019E2   2020E2   20182      2019E2       2020E2        20182       2019E2      2020E2
  GDP Growth                                                    1.9         1.4      1.7      2.9         2.5         1.7            1.9         1.2            1.2
  Inflation                                                     2.3         2.0      2.1      2.4         1.9         2.2            1.8         1.6            2.1
  Interest Rate (3mth Tbills)                                  1.37         1.65     1.65    1.97        2.40         2.35         (0.36)       (0.35)      (0.35)
  Unemployment Rate                                             5.8         5.6      5.6      3.9         3.6         3.6            8.2         7.9            8.1
  Current Account Balance / GDP3                              (2.6)         (2.7)    (2.4)   (2.4)       (2.3)        (2.4)          3.6         3.6            3.5
  Budget Surplus / GDP3                                       (0.7)         (0.9)    (0.8)   (3.9)       (4.2)        (4.0)         (0.5)       (0.9)       (0.8)

Canada                                                                                          United States
• After downshifting last year, Canada’s economy is                                             • After strengthening on fiscal stimulus, U.S. economic
  expected to moderate further to 1.4% in 2019 due to                                             growth is projected to moderate to 2.5% in 2019 due
  past increases in interest rates, oil output cuts and                                           to higher interest rates and less fiscal support
  slower global demand
                                                                                                • The unemployment rate is expected to remain near
• Amid recent steady job growth, the unemployment rate                                            half-century lows
  is expected to remain near current four-decade lows
                                                                                                • Amid low inflation, the Federal Reserve is expected to
• The Bank of Canada is expected to keep policy rates                                             refrain from raising policy rates, and there is a strong
  steady, but there is a chance of a rate cut if the global                                       chance of a rate reduction due to escalating trade
  trade war broadens                                                                              tensions

1 This slide contains forward looking statements. See caution on slide 2
2 Data is annual average. Estimates as of June 7, 2019
3 Eurozone estimates provided by OECD

                                                                                                                            Investor Presentation  June 2019         8
Canada’s housing market is stable
   • Rising interest rates, new mortgage rules and provincial policy measures have slowed the housing market, but recent signs of
     stability suggest the market has digested the policy changes
   • The Toronto condo market remains healthy due to steady demand from international migrants and millennials
   • We expect real estate markets across the country to firm moderately this year
   • Vancouver’s market is one exception, as prices continue to decline in response to poor affordability
   • Mortgage arrears remain near record lows, despite some upturn in Alberta and Saskatchewan
   • The household debt-to-income ratio, though elevated, has stabilized recently amid the slowest rate of borrowing in 35 years
   • Debt servicing ratio has risen to all-time highs amid past increases in interest rates, weighing on consumer spending

       Debt Service Ratio                                                                                          Mortgage Delinquencies/Unemployment
16.0                                                                                                            0.50                                                                                               9.0
14.0                                                                                                                                                                                                               8.5
                                                                                                                0.45
12.0                                                                                                                                                                                                               8.0
10.0                                                                                                            0.40                                                                                               7.5
 8.0                                                                                                            0.35                                                                                               7.0
 6.0                                                                                                                                                                                                               6.5
                                                                                                                0.30
 4.0                                                                                                                                                                                                               6.0
 2.0                                                                                                            0.25                                                                                               5.5
 0.0                                                                                                            0.20                                                                                               5.0
       1990
              1992
                     1994
                            1996
                                   1998
                                          2000
                                                 2002
                                                        2004
                                                               2006
                                                                      2008
                                                                             2010
                                                                                    2012
                                                                                           2014
                                                                                                  2016
                                                                                                         2018

                                                                                                                       2007

                                                                                                                               2008

                                                                                                                                      2009

                                                                                                                                             2010

                                                                                                                                                    2011

                                                                                                                                                           2012

                                                                                                                                                                  2013

                                                                                                                                                                         2014

                                                                                                                                                                                2015

                                                                                                                                                                                       2016

                                                                                                                                                                                              2017

                                                                                                                                                                                                     2018

                                                                                                                                                                                                            2019
                                             Total                                                                            Percent of Arrears to Total Number of Residential Mortgages (%)
                                             Interest only
                                                                                                                              Unemployment Rate

       Source: BMO CM Economics and Canadian Bankers’ Association as of June 7, 2019
       This slide contains forward looking statements. See caution on slide 2

                                                                                                                                                           Investor Presentation  June 2019                       9
Structure of the Canadian residential mortgage market with
       comparisons to the United States
 • Conservative lending practices, strong underwriting and documentation discipline have led to low delinquency rates
       — Over the last 30 years, Canada’s 90-day residential mortgage delinquency rate has never exceeded 0.7% vs. the U.S. peak rate
         of 5.0% in early 2010
 • Mandatory government-backed insurance for high loan to value (LTV >80%) mortgages covering the full balance
 • Government regulation including progressive tightening of mortgage rules to promote a healthy housing market
 • Shorter term mortgages (avg. 5 years), renewable and re-priced at maturity, compared to 30 years in the U.S. market
 • No mortgage interest deductibility for income tax purposes (reduces incentive to take on higher levels of debt)
 • In Canada mortgages are held on balance sheet; in the U.S. they may be sold or securitized in the U.S. market
 • Recourse back to the borrower in most provinces
 • Prepayment penalties borne by the borrower whereas U.S. mortgages may be prepaid without penalty

      Mortgage Delinquencies                                                                 Equity Ownership (%)
      Arrears to Total Number of Residential Mortgages (%)
6.0                                                                                   80.0
                                                                                      75.0
5.0
                                                                                      70.0
4.0                                                                                   65.0
                                                                                      60.0
3.0
                                                                                      55.0
2.0                                                                                   50.0
                                                                                      45.0
1.0
                                                                                      40.0
0.0                                                                                   35.0
                                                                                              1991
                                                                                              1992
                                                                                              1993
                                                                                              1994
                                                                                              1995
                                                                                              1996
                                                                                              1997
                                                                                              1998
                                                                                              1999
                                                                                              2000
                                                                                              2001
                                                                                              2002
                                                                                              2003
                                                                                              2004
                                                                                              2005
                                                                                              2006
                                                                                              2007
                                                                                              2008
                                                                                              2009
                                                                                              2010
                                                                                              2011
                                                                                              2012
                                                                                              2013
                                                                                              2014
                                                                                              2015
                                                                                              2016
                                                                                              2017
                                                                                              2018
                                                                                              2019
       1998
       1999
       2000
       2001
       2002
       2003
       2004
       2005
       2006
       2007
       2008
       2009
       2010
       2011
       2012
       2013
       2014
       2015
       2016
       2017
       2018
       2019

                                 Canada                        United States
                                                                                                             Canada          United States
      Source: BMO CM Economics and Canadian Bankers’ Association as of June 7, 2019
      This slide contains forward looking statements. See caution on slide 2

                                                                                                                    Investor Presentation  June 2019   10
Loan Portfolio
Overview
Our loans are well-diversified by geography and industry
Gross Loans & Acceptances                                                                                                Loans by Geography3
                                                              Canada &
By Industry                                                                           U.S.          Total   % of Total
                                                               Other1
($B, as at Q2 19)
Residential Mortgages                                            108.9                11.9          120.8      28%
                                                                                                                                        35%           Canada
Consumer Instalment and Other
                                                                  54.0                10.4          64.4       15%         63%                        U.S.
Personal
Cards                                                              7.9                 0.6           8.5       1%                                     Other
                                                                                                                                                 2%
Total Consumer                                                   170.8                22.9          193.7     44%
Service Industries                                                19.8                23.5          43.3       10%
Financial                                                         15.2                22.8          38.0       9%        Loans by Product3
Commercial Real Estate                                            20.9                14.5          35.4       8%
Manufacturing                                                      7.8                19.6          27.4       6%                                     Commercial & Corporate

Retail Trade                                                      13.7                 9.4          23.1       5%          56%             28%        Residential Mortgages

Wholesale Trade                                                    5.2                11.3          16.5       4%                                     Personal Lending 4

Agriculture                                                       10.8                 2.2          13.0       3%                    16%
Transportation                                                     2.6                 9.3          11.9       3%
Oil & Gas                                                          5.5                 5.8          11.3       3%
                                                                                                                         Loans by Operating Group5
Other Business and Government2                                    13.6                 9.5          23.1       5%

Total Business and Government                                    115.1               127.9          243.0     56%                     26%              Canadian P&C
                                                                                                                                                       U.S. P&C
                                                                                                                           55%
Total Gross Loans & Acceptances3                                 285.9               150.7          436.7     100%                                     BMO Capital Markets
                                                                                                                                           14%
1   Includes ~$10.6B from Other Countries                                                                                                              BMO Wealth Management
2   Other Business and Government includes all industry segments that are each
Canadian Residential-Secured Lending
  Residential-Secured Lending by Region ($141.2B)
                                                                                                                                   • Total Canadian residential-secured lending
  HELOC                                                                                                                              portfolio at $141.2B, representing 32% of total
                                           $62.6                                                                                     loans, below peer average of approximately 46%
  Uninsured Mortgages
  Insured Mortgages
                                            24%                                    $27.3                                               ─      LTV1 on uninsured of 51%
                                                                                                                                       ─      90 day delinquency rate for RESL remains good at
                                                                                                                                              24bps; loss rates for the trailing 4 quarter period
                     $21.4                                                           24%
                                                                                                                                              were 1bp
                                                               $19.1
                                                                                                                                   • Residential mortgage portfolio of $108.9B
                       28%                                       17%
                                                                                                                                       ─      44% of portfolio insured
                                           47%
                                                                 29%
                                                                                     54%                                               ─      LTV1 on uninsured of 55%
                       34%
                                                                                                                                       ─      70% of the mortgage portfolio has an effective
                                                                                                                                              remaining amortization of 25 years or less
   $6.2
   14%                                      29%                  54%                                      $4.5                     • HELOC portfolio of $32.3B outstanding of which
                       38%
   34%                                                                               22%                  17%
                                                                                                          34%                        56% is amortizing
   52%                                                                                                     49%
                                                                                                                                   • GTA and GVA portfolios demonstrate better LTV,
   Atlantic            Quebec              Ontario              Alberta         British Columbia All Other Canada                    delinquency rates and bureau scores compared to
                                                                                                                                     the national average
   Avg. LTV1                                                                    British All Other              Total
                     Atlantic      Quebec         Ontario        Alberta
  Uninsured                                                                    Columbia Canada                Canada
Mortgage
  - Portfolio          59%           59%             55%           61%            48%            56%            55%
   - Origination       73%           72%             68%           73%            64%            71%            68%
HELOC
   - Portfolio         50%           55%             43%           55%            41%            49%            46%
   - Origination       64%           70%             58%           63%            55%            63%            60%
  1 LTV is the ratio of outstanding mortgage balance to the original property value indexed using Teranet data. Portfolio LTV is the combination of each individual mortgage LTV weighted by the mortgage balance

                                                                                                                                                              Investor Presentation  June 2019                     13
Gross Impaired Loans (GIL) and Formations

                                                            Formations                         Gross Impaired Loans    •    GIL ratio 53 bps, up 5 bps Q/Q but
By Industry
($MM, as at Q2 19)
                                                                                                                            down 3 bps Y/Y
                                               Canada &                                     Canada &
                                                                    U.S.          Total                U.S.    Total
                                                 Other                                       Other1
Consumer                                           262               51            313        496      439      935
                                                                                                                                     Formations ($MM)

Agriculture                                          7               37             44         58      229      287
Service Industries                                   1               40             41         62      183      245                                                741
                                                                                                                           578       522       443       467
Oil & Gas                                            0              126            126         13      221      234
                                                                                                                           Q2'18     Q3'18    Q4'18      Q1'19     Q2'19
Transportation                                       1               35             36         6       141      147
Wholesale Trade                                      2               76             78         13      110      123                Gross Impaired Loans ($MM)
Manufacturing                                        9               40             49         30       78      108
Retail Trade                                         6                1              7         28       47       75
                                                                                                                           2,152     2,076     1,936      2,019     2,335
Commercial Real Estate                              12               20             32         33       33       66
Financial                                            0                0              0         19       28       47        Q2'18     Q3'18     Q4'18      Q1'19     Q2'19
Construction (non-real estate)                       2                0             2          18       17       35
Other Business and                                                                                                                           GIL (bps)
                                                    12                1             13         19       14       33         56
Government2
Total Business and                                                                                                                     53                             53
                                                    52              376            428        299      1,101   1,400                             48         48
Government

Total Bank                                         314              427            741        795      1,540   2,335
                                                                                                                       Q2'18        Q3'18      Q4'18       Q1'19      Q2'19
1 Total Business and Government includes nil GIL from Other Countries
2 Other Business and Government includes industry segments that are each
Provision for Credit Losses (PCL)
    PCL By Operating Group
                                           Q2 19                  Q1 19         Q2 18
    ($MM)                                                                                                                         PCL (bps)
    Total Canadian P&C                      122                    114           131
    Total U.S. P&C                              18                 15            66                                      19
                                                                                                                                         18
                                                                                                           17
    Wealth Management                       (1)                     2             1                                                                                    16
    Capital Markets                             12                  1           (16)                       18            18              18
                                                                                                                                                       13
    Corporate Services                      (1)                    (5)          (10)
                                                                                                                                                                       14
    PCL on Impaired Loans                   150                   127           172
    PCL on Performing Loans                     26                 10           (12)                      Q2'18         Q3'18           Q4'18         Q1'19           Q2'19
    Total PCL                               176                   137           160                                  PCL on Impaired Loans                    Total

                                  1.80%

PCL on Impaired Loans as a
                                  1.60%                                                                                   F2018 PPPT would cover PCL rate in
                                  1.40%                                                                                   excess of 200bps, higher than any time
% of Average Net Loans &
                                                                                                                          in at least 30 years, over five times
Acceptances                       1.20%
                                                                                                                          average
                                  1.00%
•     BMO’s PCL loss rates have   0.80%
      been lower than peer                                                                                                                              0.53%
                                  0.60%
      average over time
                                  0.40%                                                                                                                 0.39%
                                                                                                                                                        0.34%
                                  0.20%
                                                                                                                                                        0.14%
                                  0.00%
                                          '90        '92    '94    '96    '98   '00     '02   '04   '06     '08   '10     '12     '14     '16   '18

                                                           BMO                                                    Cdn Peers Avg.
                                                           BMO Historical Avg. (1990 - 2018)                      Cdn Peers Historical Avg. (1990 - 2018)

                                                                                                                                Investor Presentation  June 2019             15
Liquidity & Wholesale
Funding Mix
Liquidity and Funding Strategy

             Cash and Securities to Total Assets Ratio (%)

                                                                                                                                       • BMO's Cash and Securities to Total Assets
                                                             29.9                      29.3
          28.1                      28.2                                                                        28.2                     Ratio reflects a strong and stable liquidity
                                                                                                                                         position

         Q2'18                     Q3'18                    Q4'18                     Q1'19                    Q2'19

                                  Customer Deposits1 ($B)

          310.0                    317.8                    329.2                     341.7                    351.3                 • BMO’s large base of customer deposits,
                                                                                                                                       along with our strong capital base, reduces
                                                                                                                                       reliance on wholesale funding

         Q2'18                     Q3'18                    Q4'18                     Q1'19                    Q2'19

1 Customer deposits are operating and savings deposits, including term investment certificates and retail structured deposits, primarily sourced through our retail, commercial, wealth and corporate banking businesses.

                                                                                                                                                               Investor Presentation  June 2019                        17
Canadian Bail-in Regime

• Canadian bail-in regime became effective from September 23, 2018
  (implementation date)
                                                                                                          Canadian Approach
• Bail-in eligible senior unsecured debt that is issued after the implementation date
  will be subject to conversion in a resolution scenario
                                                                                           Statutory / Contractual Subordination
      — Bail-in eligible debt includes senior unsecured debt issued by the parent
        bank with an original term >400 days and marketable (with a CUSIP/ISIN)
• Key exclusions are Covered bonds, structured notes, derivatives and consumer                       CDIC Insured Deposits
  deposits
• Bail-in eligible debt will be issued under existing programs (US MTN, EMTN, AMTN
  etc.) governed by local laws, with the exception of bail-in conversion requirements                                           Other Deposits
                                                                                        Other unsecured      Structured
                                                                                                                                (including legacy
  which will be governed by Canadian law                                                   liabilities1        Notes1
                                                                                                                                  senior debt)1
• Bail-in eligible debt has a statutory conversion feature that provides the Canada
  Deposit Insurance Corporation (CDIC) the power to trigger conversion of bail-in
  securities into common shares of the bank (no write-down provision)
                                                                                                      Sr. Debt (bail-inable)1
• The statutory conversion supplements the existing Non-Viable Contingent Capital
  (NVCC) regime which contractually requires the conversion of subordinated debt
  and preferred equity into common equity upon the occurrence of certain trigger
  events
                                                                                                               Tier 2
• The notional amount of bail-in securities to be converted and the corresponding
  number of common shares issued in a resolution scenario will be determined by
                                                                                                  Additional Non-Common Tier 1
  CDIC at the time of conversion (unlike NVCC securities, where the calculation for
  the number of shares issued is already defined). Any outstanding NVCC capital
  must be converted, in full, prior to conversion of bail-in securities                               Common Equity Tier 1

• Conversion maintains the creditor hierarchy (no creditor worse off principle is
  respected)
    1 Pari passu ranking in liquidation.

                                                                                                Investor Presentation  June 2019           18
Manageable TLAC Requirements and no incremental funding

• Canadian D-SIBs will be required to meet a Supervisory Target                        Funding Profile as at April 30, 2019
  ratio by November 1, 2021
                                                                    40.0%
     — Risk-based TLAC ratio of 23.25% (Minimum 21.5% of                                                                                                          36.5%

       RWA TLAC ratio plus a Domestic Stability Buffer of           37.5%

       1.75% of total RWA)                                          35.0%                                                                           33.0%
                                                                                                                                                                 Legacy
                                                                                                                                                                Unsecured
                                                                                                                                                                (RT < 1yr)
     — Minimum TLAC Leverage ratio of 6.75%                         32.5%
                                                                                                                                                                  3.5%

                                                                                                                                                    Legacy
                                                                    30.0%
• TLAC eligible securities will have a minimum remaining term                                                                                      Unsecured
                                                                                                                                                   (RT > 1yr)   TLAC            Bail-in
  of 365 days
                                                                                                                                                     15.0%
                                                                    27.5%                                                                                       Eligible        Debt
                                                                              Supervisory target risk-
                                                                    25.0%      based TLAC 23.25%                                                                                (BID)
• No incremental funding required to meet the TLAC obligations
                                                                    22.5%

• BMO will only be issuing one class of medium and long term        20.0%                                                       Existing Bail-in
                                                                                                                                  Unsecured

  senior debt that will over time replace the legacy senior debt    17.5%
                                                                                                                                     3.0%

  outstanding                                                                                                 Tier 2 Capital,
                                                                                                                   2.3%
                                                                    15.0%                   Tier 1 Capital,
                                                                                                 1.4%

• Similar to US TLAC securities, Canadian bail-in securities will   12.5%

  retain the clause regarding acceleration of payments, subject     10.0%
  to a minimum 30-business-day cure period, in case of events
  of default relating to non-payment of scheduled principal         7.5%
                                                                            CET1,
  and/or interest                                                   5.0%    11.3%

                                                                    2.5%
• TLAC eligible debt will be issued at the parent bank operating
  company level whereas US FIs issue TLAC debt at the holding       0.0%

  company level

                                                                                                                     Investor Presentation  June 2019                     19
Diversified Wholesale Term Funding Program

•      BMO's wholesale funding principles seek to match the term of assets with the term of funding. Loans for example are funded
       with customer deposits and capital, with any difference funded with longer-term wholesale funding

•      BMO has a well diversified wholesale funding platform across markets, products, terms, currencies and maturities

•      We do not expect a significant change to BMO’s funding strategy following the implementation of the bail-in regime

                    Wholesale Capital Market Term                                                                                             Wholesale Capital Market Term
                    Funding Composition1 ($121B)                                                                                               Funding Maturity Profile1,2
                         as at April 30, 2019                                                                                                      as at April 30, 2019

                                                                                                                                   24                    24
                                                                                                                                                                                21
                                                   Covered Bonds                                                                                                                              18       18
                                                       21%
                 Senior Debt (Global
                     Issuances)
                        32%                                                                                     8
                                                  Mortgage, Credit
                                                   Card, Auto &
                                                      HELOC
                                                  Securitization +
                         C$ Senior Debt
                                                  FHLB advances
                              19%                                                                           Q3 - Q4'19             F2020                F2021                  F2022         F2023    ≥ F2024
                                                       28%
                                                                                                                                              Term Debt         Securitization (Ex - FHLB)

    1 Wholesale capital market term funding primarily includes non-structured funding for terms greater than or equal to two years and term ABS. Excludes capital issuances.
    2 BMO term debt maturities includes term unsecured and Covered Bonds.

                                                                                                                                                                  Investor Presentation  June 2019         20
Diversified Wholesale Funding Platform

    •       Programs provide BMO with diversification and cost effective funding

                            Canada1                                                                           U.S.1                Europe, Australia & Asia1
•       Canadian MTN Shelf (C$8B)                                               •    SEC Registered U.S. Shelf (US$25B)    •    Note Issuance Programme (US$20B)
•       Fortified Trust (C$5B)                                                  •    Global Registered Covered Bond        •    Australian MTN Programme (A$5B)
•       Other Securitization (RMBS, Canada                                           Program (US$22B)                      •    Global Registered Covered Bond
        Mortgage Bonds, Mortgage Backed                                         •    Securitization (Credit cards, Auto)        Program (US$22B)
        Securities)

                                                                                    Recent Notable Transactions
                                               •     C$2 billion 5-yr Fixed Rate Senior Unsecured Notes at 2.85%
                                               •     C$350 million 5-yr Rate-Reset Preferred Shares at 5.10%
                                               •     C$764.829 million Fortified HELOC Securitization
                                               •     US$2.25 billion 3-yr Fixed and Floating Rate Senior Unsecured Notes
                                               •     US$476.19 million Master Credit Card Trust II Notes
                                               •     US$561.95 million CPART Auto Securitization
                                               •     EUR€1.25 billion 5-yr Fixed Rate Covered Bond at 0.25%
                                               •     GBP£0.3 billion Fixed Rate Senior Unsecured Notes at 1.625%
                                               •     CHF450 million long 4-yr Fixed Rate Senior Unsecured Notes at 0.05%
                                               •     AUD$1.55 billion 3-yr Floating and 5-yr Fixed and Floating Rate Senior Unsecured Notes

         1 Indicated dollar amounts beside each wholesale funding program denotes program issuance capacity limits.

                                                                                                                               Investor Presentation  June 2019   21
Appendix
Diversified businesses delivering resilient and robust earnings
         Adjusted Net Income                                                                                Driven by diversified sources of revenue
       by Operating Group – LTM1                                                                            % of Operating Groups Net Revenue - LTM

                  Can P&C                                                               Canadian                                                                                           BMO Capital
                    40%                                                                   P&C                                                                                               Markets
                                                                                          35%                                                                                                20%
                                          BMO CM
                                           18%
                                                                                                                                Canadian
                                                                                                                                Personal
                                                                                                                                Banking

               U.S. P&C             BMO WM
                 25%                  17%

                                                                                                          Canadian
                                                                                                         Commercial
                                                                                                           Banking
            Adjusted Net Income
            by Geography – LTM1

                      Other
                       9%

          U.S.
          31%
                                          Canada
                                           60%

                                                                                       U.S. P&C                                                                                           BMO Wealth
                                                                                         23%                                                                                              Management
1 Adjusted measures are non-GAAP measures, see slide 2 for more information.
                                                                                                                                                                                             22%
  For details on adjustments refer to page 4 of BMO’s Q2’19 Report to Shareholders
  Reported net income last twelve months (LTM) by operating group (excludes Corporate Services): Canadian P&C 41%, U.S. P&C 25%, BMO WM 17%, BMO CM 17%; by geography: Canada 62%, U.S. 29%, Other 9%

                                                                                                                                                  Investor Presentation  June 2019                     23
Canadian Personal & Commercial Banking

                            Strengths and Value Drivers                                                                                                             Q2’19 Highlights (Adjusted1)

•   Highly engaged team focused on providing a personalized banking                                                                     Net Income                                                      $615 million
    experience, anticipating customers’ needs and finding new ways to
    help                                                                                                                                Net Income Growth (Y/Y)                                         5%
•   Top-tier commercial banking business, number two ranking in                                                                         ROE                                                             26.8%
    Canadian market share for business loans up to $25 million
                                                                                                                                        Efficiency Ratio                                                49.6%
•   Strong and growing retail banking business, accelerating digital
    engagement and digital sales                                                                                                        Operating Leverage                                              0.2%

•   Largest Mastercard® card issuer in Canada                                                                                           Average Net Loans and Acceptances                               $234 billion
•   Consistently applied credit risk management practices, providing                                                                    Customers                                                       ~8 million
    reliable access to appropriate financing solutions
                                                                                                                                        Branches                                                        899

                                      Net Income1 and NIM                                                                                                                 Revenue ($MM)

        2.59               2.60               2.62              2.61              2.61                                                                        1,934        1,943    1,954      1,921
                                                                                                           Reported                          1,830
                                                                                                               Net
                                                                                                            Income                                              692        699        734       710
                                                                                                                                              643
                               641                675                648                                     ($MM)
             589                                                                       615                                                                                                                      Commercial
                                                                                                           Adjusted
                                                                                                               Net                                                                                              Personal
      588               641                674                647               615                         Income                           1,187             1,242       1,244     1,220      1,211
                                                                                                             ($MM)

                                                                                                           NIM (%)
       Q2'18              Q3'18             Q4'18              Q1'19              Q2'19                                                     Q2'18             Q3'18       Q4'18     Q1'19      Q2'19

    1 Adjusted measures are non-GAAP measures, see slide 2 for more information. For details on adjustments refer to page 4 of BMO's Q2'19 Report to Shareholders
    On a reported basis: Net Income $615MM, Net income growth 5%, ROE: 26.8%; Efficiency ratio 49.6%, Operating leverage 0.2%

                                                                                                                                                                              Investor Presentation  June 2019            24
U.S. Personal & Commercial Banking

                            Strengths and Value Drivers                                                                                                             Q2’19 Highlights (Adjusted1)
•   Rich Midwestern heritage dating back to 1847, with a long-standing
                                                                                                                                        Net Income                                                       US$314 million
    commitment to the success of our customers and communities
•   Large-scale, diversified national commercial business, supported by in-                                                             Net Income Growth (Y/Y)                                          12%
    depth industry knowledge, best-in-class customer experience, and                                                                    ROE                                                              11.9%
    top-tier market share in our flagship businesses
                                                                                                                                        Efficiency Ratio                                                 57.8%
•   Increasing momentum in personal banking: large and growing
    customer base, extensive branch network, broad suite of products and                                                                Operating Leverage                                               (0.2)%
    services, accelerated investment in digital capabilities                                                                            Average Loans and Acceptances                                    US$84 billion
•   Comprehensive, integrated control structure to actively manage risk
                                                                                                                                        Customers                                                        >2 million
    and regulatory compliance
                                                                                                                                        Branches                                                         568

                                      Net Income1 and NIM                                                                                                                Revenue (US$MM)

        3.77
                           3.71               3.69              3.71                                       Reported
                                                                                  3.61                        Net                            939                976        988         1,002       990
                                                                     340                                    Income
                                                                                       314                 (US$MM)                                              325        327           340       335
             279               288                294                                                                                         303                                                                 Personal
                                                                                                           Adjusted
                                                                                                              Net                                                                                                 Commercial
                                                              332               306
      271               279                285                                                              Income                            635               651        661           662       654
                                                                                                           (US$MM)

                                                                                                           NIM (%)
       Q2'18              Q3'18             Q4'18              Q1'19              Q2'19                                                     Q2'18             Q3'18       Q4'18        Q1'19      Q2'19

    1 Adjusted measures are non-GAAP measures, see slide 2 for more information. For details on adjustments refer to page 4 of BMO's Q2'19 Report to Shareholders
    On a reported basis: Net Income $306MM, Net income growth 13%, ROE: 11.6% Efficiency ratio 58.9%, Operating leverage 0.1%

                                                                                                                                                                                 Investor Presentation  June 2019           25
BMO Wealth Management

                                Strengths and Value Drivers                                                                                                         Q2’19 Highlights (Adjusted1)
•     Planning and advice-based approach that integrates investment,
      insurance, specialized wealth management and core banking                                                                         Net Income                                                       $315 million
      solutions, offered by a team of highly skilled professionals                                                                      Net Income Growth                                                3%
•     Diversified portfolio of solutions, from self-directed online investment                                                          ROE                                                              20.4%
      to professional money management and integrated trust/banking
      services for retail and institutional clients                                                                                     Efficiency Ratio                                                 67.9%
•     Globally significant asset manager with broad distribution capabilities                                                           Operating Leverage                                               (0.1)%
      in North America, EMEA and Asia
                                                                                                                                        AUA / AUM                                                        $862 billion
•     Robust risk management framework supporting alignment with
      heightened regulatory expectations                                                                                                Average Loans                                                    $23 billion

                                                                                                                                        Average Deposits                                                 $36 billion

                                                Net Income1                                                                                                                   AUA / AUM ($B)

      296 307                         301                                                             305      315
                              291
                                                                                                                                                 826                   846                        816                   862
                                                                                                                                                                                     821
      69      69                       89              219 229                239 249                  79      79
                               89
                                                       27      27              65  65                                                                                                                                   465
                                                                                                                                                 439                   451           438           439

     227      238                     212                                                             226     236
                              202                     192     202             174     184
                                                                                                                                                 386                   395           383           377                  397

Reported Adjusted         Reported Adjusted        Reported Adjusted        Reported Adjusted        Reported Adjusted                         Q2'18                  Q3'18         Q4'18         Q1'19                Q2'19
         Q2’18                   Q3’18                      Q4’18                Q1’19                      Q2’19
                                        Traditional Wealth               Insurance                                                                                     AUA                      AUM
                                               ($MM)                       ($MM)

    1 Adjusted measures are non-GAAP measures, see slide 2 for more information. For details on adjustments refer to page 4 of BMO's Q2'19 Report to Shareholders
    On a reported basis: Net Income $305MM, Net income growth 3%, ROE: 19.8% Efficiency ratio 68.8%, Operating leverage 0.0%

                                                                                                                                                                                Investor Presentation  June 2019              26
BMO Capital Markets

                            Strengths and Value Drivers                                                                                                              Q2’19 Highlights (Adjusted1)
                                                                                                                                        Net Income2                                          $253 million
• Unified coverage and integrated distribution across our North
  American platform and complementary global footprint, delivering                                                                      Net Income       Growth2                             (11)%
  a seamless and exceptional client experience                                                                                          Efficiency Ratio                                     71.7%
• Top-ranked Canadian equity and fixed income research with sales                                                                       Operating Leverage                                   (13.3)%
  and trading capabilities and deep expertise in core sectors
                                                                                                                                        Average Gross Loans and Acceptances                  $60 billion
• Well-diversified platform and business mix – by sector, geography,
  product and currency, including a strong and scalable U.S. business                                                                   Offices:                                             33 globally, 19 in N.A.

• Strong first-line-of-defence risk management and regulatory and                                                                       Employees                                            2,764
  compliance capabilities                                                                                                               U.S. Revenue Contribution                            44%

                                                                                                                                        U.S. Equities market share3                          2.02%

                                                                                                                                        U.S. IB market       share4                          #21

                                         Net Income1 ($MM)                                                                                                                   Revenue ($MM)

                                                                                                                                                                                                       1,229
                               303                 309                                               Reported Net                                                    1,105     1,132       1,132                    Investment
             286                                                                                                                              1,042
                                                                     262               253             Income                                                                                                       and
                                                                                                                                                                                                           510
                                                                                                                                                421                  467        502         500                     Corporate
                                                                                                                                                                                                                    Banking
      286               301                298
                                                              255                249                 Adjusted Net
                                                                                                       Income                                   621                  638        630         632            719      Trading
                                                                                                                                                                                                                    Products

       Q2'18              Q3'18             Q4'18              Q1'19              Q2'19                                                       Q2'18              Q3'18         Q4'18      Q1'19        Q2'19
    1 Adjusted measures are non-GAAP measures, see slide 2 for more information. For details on adjustments refer to page 4 of BMO's Q2'19 Report to Shareholders;
    On a reported basis: Net Income $249MM, Net income growth (13)%, Efficiency ratio 72.1%, Operating Leverage (14.1)%
    2 Q2’19 results absorbed severance expense of $120MM ($90MM after-tax)
    3 Source: McLagan as at March 2019
    4 Source: Dealogic as at Jan 2019

                                                                                                                                                                                Investor Presentation  June 2019         27
Our Commitment to Sustainability
BMO’s sustainability principles—Social Change, Community Building, Financial Resilience and Environmental Impact—align to
our strategic priorities because financial performance and corporate responsibility are inextricably connected. Our success
depends on meeting our commitments to our customers, employees, community, and our planet

                                      Supporter of
 Making a                     Financial Stability Board’s   BMO has been carbon        40% of BMO senior
                                                                                                              BMO is a founding member
 Positive Impact                 Taskforce on Climate-
                                   related Financial
                                                             neutral since 2010        leaders are women
                                                                                                                 of Project PROTECT
                                                                                                                which works to combat
                                      Disclosure                                                                  human trafficking
 In 2016, we declared
 our support for the UN’s
 17 Sustainable                            BMO holds Canadian Council for                        North American representative on
 Development Goals. Our                    Aboriginal Business Gold certification                Equator Principles Steering Committee;
 strategic initiatives are                 in Progressive Aboriginal Relations.                  Member of Financial Industry Advisory
                                           We also ranked on the 2018 Disability                 Group for the Sustainable Accounting
 aligned to these goals,                   Equality Index from the American                      Standards Board; Long-time member of
 focusing on areas where                   Association of People with Disabilities               the UN Environment Programme
 we believe BMO can
 have the greatest
 impact
                                                                      BMO contributed ~$63.5MM to non-profits across North America,
                                                                             with 19,500 employee volunteer hours (F2018)

                                                                                                  Investor Presentation  June 2019   28
Driving Value with Sustainable Solutions

Sustainable Finance
BMO Capital Markets underwrote US$6.3B in sustainable bonds in F2018 (US$4.8B in green bonds; US$1.5B in sustainable development bonds)
BMO Global Asset Management is a Green Bond Principles signatory and has developed a Green Bond Strategy fund with €225MM AUM

Responsible Investing
For 30+ years, BMO GAM has invested responsibly, with US$2.9B in Responsible Funds range. In March 2019, BMO GAM launched a new SDG
Engagement Fund

Community Building
BMO provided US$593MM in loans to support community development in the U.S. in F2018

Climate Action
BMO participated in $6.4B of renewable energy equity and debt financing and provided $4.2B of loan commitments to renewable entities and
projects

Financial Inclusion
Our On-Reserve Housing Loan Program helped to provide $225MM in loans to Indigenous communities. We committed $3B in capital to
women-owned businesses across Canada over the next 3 years. US$33.9MM assets under management in the BMO Women in Leadership Fund

 Awards and Recognition
   Listed on Dow Jones            One of only 5 banks, and the only                                     Supporting Women Entrepreneurs         2 Time Catalyst Award
                                                                           2019 Bloomberg Gender-
Sustainability Index (North    Canadian bank, to be named to the 2019
                                                                            Equality Index for fourth   by extending $3B in new capital to     winner for accelerating
      America) for 14              World’s Most Ethical Companies
                                                                                 year in a row              women-owned businesses             diversity and inclusion
    consecutive years                   (Ethisphere Institute)

                                 Listed on FTSE4Good Index Series, Ethibel         2018 Thomson                                          Awarded Lead Manager of the
 BMO GAM awarded an A+                                                                                   BMO Volunteer Day contributed
                                 Sustainability Index Excellence Global, and       Reuters Global                                       Year – Sustainability Bonds – SSA
 rating by the UN Principles                                                                            14,000 volunteer hours with 215
                                Euronext Vigeo World 120. Awarded oekom         Diversity & Inclusion                                     Category by Environmental
for Responsible Investment                                                                                   organizations globally
                                                 Prime status                           Index                                                        Finance

                                                                                                                           Investor Presentation  June 2019             29
Investor Relations
Contact Information
bmo.com/investorrelations
E-mail: investor.relations@bmo.com

JILL HOMENUK               CHRISTINE VIAU
Head, Investor Relations   Director, Investor Relations
416.867.4770               416.867.6956
jill.homenuk@bmo.com       christine.viau@bmo.com
You can also read