Monetary policy, technology and inequality - Bank for ...
←
→
Page content transcription
If your browser does not render page correctly, please read the page content below
13 January 2021

Monetary policy, technology and inequality

Based on remarks by Luiz Awazu Pereira da Silva 1

Centre for Economic Policy Research / International Monetary Fund / Peterson Institute for International
Economics roundtable: “Central banking and inequality: Covid-19 and beyond”, 11 December 2020

Introduction
Post-Global Financial Crisis, a typical question triggered by the wealth effect of unconventional monetary
policies has been whether monetary policy has contributed to rising income and wealth inequality
(Domanski et al (2016)). The indications are that it has not been among the main drivers of income
inequality 2. For instance, as to what regards monetary frameworks, income inequality has risen in inflation
targeting countries and in non-inflation targeting countries alike, and in countries with or without
unconventional monetary policies. Monetary policy stabilises the business cycle and inflation, and thus the
more cyclical components of inequality. The conventional view is that monetary policy can limit the
volatility of inflation, which penalises first and foremost the poorest households, whose assets, such as
cash and bank accounts, are not protected against inflation. More recently, however, inflation has become
a lower risk, at least in most OECD countries. Hence the debate on monetary policy and inequality has
turned to employment, or rather unemployment risk. Indeed, cyclical increases in unemployment are much
more likely to lower the income of workers with fewer marketable skills. When national unemployment
rises, the increase is much larger in the poorest neighbourhoods and among ethnic minorities.
         Hence the recent debate on monetary policy and inequality, as exemplified by the Federal
Reserve’s review of its monetary policy strategy in August 2020 emphasised countering inequality by
ensuring that recessions remain mild and short-lived. This finds roots in the notion that unemployment
and the associated loss in income are the main drivers of income inequality, which in turn cumulates into
wealth inequality. Thus, properly run monetary policy works as a safeguard against rising inequality (Romer
and Romer (1999)). On top of dampening cyclical fluctuations, price stability will also facilitate longer-run
income stability and growth. So, in a world where the “divine coincidence” holds, central banks would only
have to focus on their traditional mandates. In particular, inequality would also be addressed by protecting
the purchasing power of the poor’s main assets, typically deposits and cash. This makes, in theory, central
bankers’ job quite straightforward, and leaves structural issues that affect inequality to be dealt with in
other policy spheres in particular fiscal and structural reform policies.

1
    Deputy General Manager, Bank for International Settlements (BIS). I would like to thank the contributions of Jon Frost, Leonardo
    Gambacorta, Emanuel Kohlscheen and Marco Lombardi, respectively Senior Economist, Head of the Innovation and the Digital
    Economy unit, Senior Economist and Senior Economist, all at the BIS. I thank Giulio Cornelli, Mert Onen, Emese Kuruc and
    Alberto Americo for excellent research assistance. I also thank Benoît Mojon for useful comments. The views expressed are my
    own and do not necessarily represent those of the BIS.
2
    Inequality seems to have risen mainly because of secular trends beyond central bankers’ reach: technological progress,
    globalisation and the associated erosion in workers’ bargaining power. Technological progress and globalisation have been
    the most important drivers of income and wealth gaps (eg Jaumotte et al (2013)) and what role these play in growth (Berg et
    al (2018)).

                                                              1/14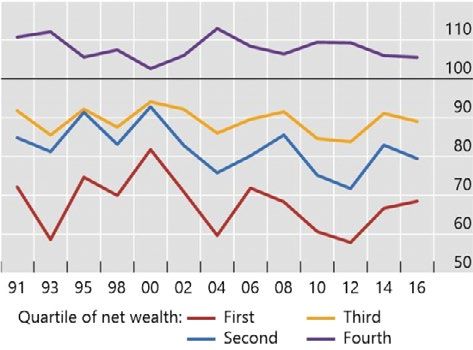
However, central banks are fully aware that in the real world, things are more intertwined. Income
inequality has been rising steadily since the Great Moderation – against the backdrop of lower
unemployment and inflation volatility. Irrespective of its causes, inequality has surged to a degree that
influences the mechanics of the business cycle, particularly as households’ propensity to spend depends
crucially on their income. In addition, low-income households save less than wealthier ones. Rising
inequality can therefore change the transmission of monetary policy, a hypothesis that central banks are
re-assessing carefully. And indeed the issue is rising on central banks’ policy agendas.
         Inequality raises the issue of policy effectiveness as it may affect, for example, the transmission
of central banks’ actions to fulfil their mandates of price and financial stability. By taking predominantly a
convenient view in which agents are homogeneous, we can neglect other important transmission channels.
     During the Covid-19 pandemic and the associated recession, the increase in wealth and income
disparities has come further into the limelight (Ahmed et al (2020)). Central banks reacted quickly to
support aggregate demand, in an unprecedented coordinated effort with treasuries that in many instances
designed new policies to target specific segments that were severely hit by the pandemic (BIS (2020)).
However, as we look now early 2021 toward the rollout of a vaccine and the pace of the recovery, what
the post-pandemic world will look like in terms of the sectoral composition of output and the level of
employment remains highly uncertain. This brings us back to the issue of policy effectiveness, and notably
whether the currently elevated rate of savings will persist. We have also learned that financial technology
can play an inclusive role, enhance the speed and transmission of payments, and reduce the cost of access
to credit. When it comes to inequality, among many questions, will digital technologies be part of the
solution, and can central banks use the lever of new technologies in the pursuit of their policy mandates
to increase their effectiveness?
      These remarks address the role of technology in central banks’ thinking on inequality. They start by
discussing inequality in light of a core function of central banks: monetary policy. We will show that
inequality hinders monetary policy transmission and job creation. We then ask: can technology help? There
are a number technology infrastructures that can help to improve inclusion, and we see concrete evidence
of this already. But we will also discuss a number of challenges. These include new forms of segmentation
in credit markets and new forms of income and wealth concentration around big techs. We conclude with
some thoughts on what public policy can do to harness the power of digital technologies to promote
efficiency and equity.

Monetary policy and inequality: why bother?
Monetary policy affects household income mostly through employment. Second, it affects spendable
income through the interest bill on mortgages and the income accrued from savings. Third, tighter labour
markets due to loose monetary policy may also bring higher wages as firms struggle to attract more skilled
workers. 3 For households, variation in terms of type of employment and skills and, to a lesser extent, assets
and liabilities can lead to very different effects of changes in the monetary policy stance. For example, low
rates benefit borrowers (mostly middle class and young or middle-aged) at the expense of savers (mostly
elderly middle class or wealthy). Yet some poorer households may be prevented from borrowing due to
their lack of collateral, and so will not benefit from lower rates. Low rates are also likely to boost asset
prices, which are held only by pensioners and the small fraction of households, typically among the 5%
richest in most OECD countries, which hold stocks. Under such circumstances, determining the final effect
of monetary policy on inequality is mostly an empirical question whose answer depends on the scale of

3
    The relevance of this effect along the intensive margin depends on the bargaining power of workers, which has been eroding
    over time; see Lombardi et al (2020).

                                                           2/14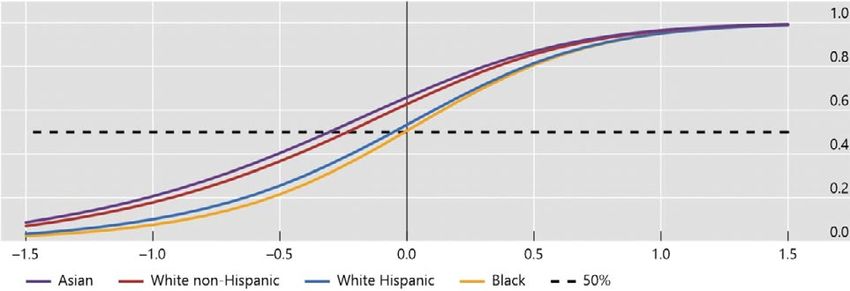
heterogeneity among households. As one would expect, most empirical studies (eg Kharroubi et al (2021))
actually find that more accommodative monetary policy reduces income inequality. This is because lower
unemployment increases income among poorer households. Changes in interest income for savers and
payments for borrowers remain small in comparison with the effects of unemployment.
          The effects are opposite for wealth inequality: households at the bottom of the distribution are
renters, the middle class owns mainly real estate and bank deposits, and those at the top own more
sophisticated (and higher-yielding) financial assets, equities in particular.
         In light of these developments, the issues of transmission across different groups and, implicitly,
inequality have featured more prominently in major central banks’ current review of monetary policy
(Powell (2020)). In practical terms, some central banks are extending their description of the monetary
transmission channel to heterogeneous agents New Keynesian models (see Kaplan et al (2020), and
Feiveson et al (2020) for a background paper for the strategy review of the Federal Reserve).
     For example, it is clear that income inequality has increased across the US states, as reported for
instance by the Sommeiller and Price (2018) data set (Graph 1, left-hand panel). This shows the growing
income share of the top decile of the distribution. Why does this matter? For one thing, Kharroubi et al
(2021) show that more inequality is associated with steeper declines in private consumption during
recessions (right-hand panel), precisely at the time when it matters most. This can also be clearly seen
using more granular data from US states. For example, during the 2007–09 GFC, private consumption fell
by significantly more in US states that had higher pre-crisis concentrations of incomes. So, despite the role
of macro policies to smooth downturn across all states, inequality has a higher contraction cost in more
unequal states.

A cost of rising inequality in the US: deeper recessions due to the GFC                                                     Graph 1

Income inequality across US states                                      GFC: more unequal US states had steeper declines in
                                                                        consumption1
                         % income share of top decile of distribution

1
  Aggregate private consumption growth between 2007 and 2009 as a function of the income share of the top 5% earners in the respective
state.
Sources: Kharroubi et al (2021); Sommeiller et al (2018).

     That higher levels of income inequality are associated with steeper declines in private consumption
during recessions applies more generally across space and time. By analysing data from a large sample of
advanced economies, in Kharroubi et al (2021) we further show that more inequality implies steeper
recessions (Graph 2, left-hand panel). And the difference is material: during a recession a country at the
90th percentile of income inequality experiences a drop in consumption that is 3 percentage points larger

                                                                   3/14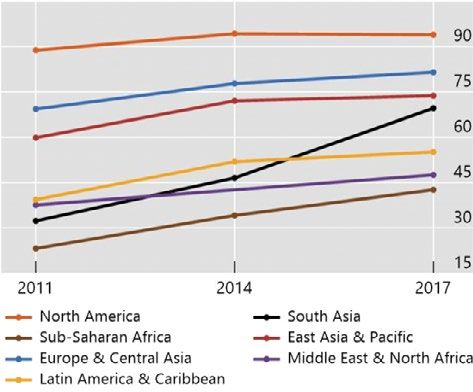
than that experienced by a country at the 10th percentile of income inequality. Why? A plausible
explanation is that higher concentration of income goes hand in hand with more cyclical unemployment
rates and more cyclical income of the middle class. As the propensity to consume income is higher for
poorer households, a more cyclical income is compounded into a steeper response of consumption.
      What is more, inequality reduces the effectiveness of monetary policy transmission (Kharroubi et
al (2021)). High income concentration can indeed affect the transmission of monetary policy through the
different effects easy monetary conditions have across heterogeneous households. Wealthier households
have a much lower propensity to consume; hence their consumption may be less reactive to monetary
stimulus. In turn, poorer households may not benefit from easier credit conditions because they lack
collateral or adequate credit scores and are hence unable to borrow.
      To show this, we report estimates 4 of how income inequality interacts with the transmission of
monetary policy to real private consumption growth in advanced economies (Graph 2, right-hand panel).
The dots represent the central estimates of cumulative real private consumption growth (in per cent) per
100 basis points of an expansionary monetary policy shock by quantile of income concentration. We can
see that in countries with higher inequality (darker dots), the effect of monetary policy easing on growth
is limited in year 1 and much lower later than in more equal countries (lighter dots, in each column, at the
top). An expansionary monetary policy shock (ie an interest rate surprise), leads to a significant increase in
real private consumption growth in the same year and in the following two years. However, more
concentrated income (ie a higher share of post-tax income accruing to the top decile) tends to significantly
attenuate this expansionary effect.
     There is corroborating evidence from other studies. For instance, Doerr et al (2020) find that rising
top income shares may be associated with less credit to small businesses and less job creation. This is
because high-income households save relatively less in the form of bank deposits, and small firms are
bank-dependent. The authors of this study find that a 10 percentage point rise in the income share of the
top 10% reduces the net job creation rate of small firms by 2 percentage points relative to large firms. This
could choke off the type of lending that central banks have in many cases been trying to encourage,
particularly during the Covid-19 pandemic. The bottom line is: concentration of income can affect the
transmission of monetary policy.

4
    In Kharroubi et al (2021), a two-step empirical exercise is conducted with a standard panel vector autoregression (PVAR) using
    quarterly data from 1999 to 2019 and 30 advanced economies, with country and time fixed effects.

                                                             4/14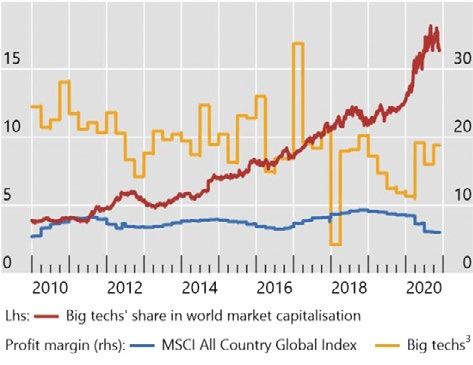
Inequality reduces the effectiveness of the transmission of monetary policy                                                           Graph 2

Recessions in more unequal countries are steeper1                        Estimates of cumulative consumption growth (in %)2
                         % income share of top decile of distribution

1
  Estimated fall in per capita consumption during recessions at each percentile of inequality in the income distribution. Recessions are defined
as a year of negative growth, and the share of income of the top 10% is taken as the indicator of inequality. Based on estimated coefficients
of a cross-country panel with fixed effects. The specification regresses consumption growth on its lag, on an indicator of a recession, on the
share of income held by the top 10% and on the interaction between the latter two variables. The sample period is 1972 to 2019. The “all
countries” sample is based on 129 countries. 2 Results of the central estimates of cumulative consumption growth (in %) per 100 basis
points of an expansionary monetary policy shock using a standard panel vector autoregression (PVAR) with quarterly data from 1999 to 2019
for 20 advanced economies.
Source: Kharroubi et al (2021).

Can digital technologies reduce inequality?

Naturally, income and wealth inequality can be mitigated by many other policy instruments that are
associated with structural reforms in our economies. But in the realm of the financial sector, central banks
and regulators, one question is, can digital technologies help? Can innovations promote greater equity
and efficiency, and boost the transmission of monetary stimulus? The good news is that we do have some
encouraging evidence from countries around the world.
     One technology is digital identity (ID) infrastructure, like India’s Aadhaar. “Aadhaar” is Hindi for “base”
or “foundation”. In India, the introduction of government digital ID has drastically reduced the costs of
onboarding – by one estimate from 15 US dollars per new account to 7 cents. This has allowed a dramatic
increase in the share of adults with a bank account – from 10% in 2008 to over 80% just 10 years later
(Graph 3, left-hand panel). This increase would have taken 47 years relying on normal economic growth
processes alone (D’Silva et al (2019)).
     India is certainly an important case, but it is not entirely unique. Graph 3 (right-hand panel) shows
progress in account access across regions, from the World Bank. South Asia, shown in black, sticks out,
driven in large part by India. But you can see that in sub-Saharan Africa, there has also been a strong
increase – a doubling in account access between 2011 and 2017. This was driven in particular by mobile
money innovations. Mobile money is also an important driver of inclusion in the Middle East and North
Africa and in Latin America and the Caribbean.

                                                                    5/14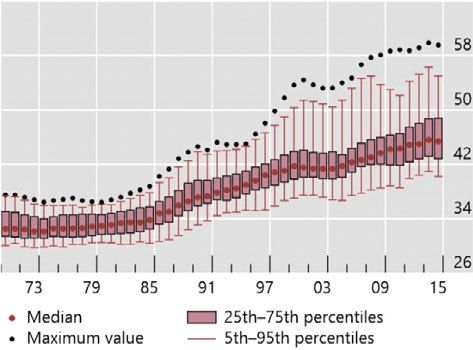
Technology has helped to support dramatic improvements in account access                                                              Graph 3

Progress with account access after India’s Aadhaar digital Progress with account access across regions, especially
ID1                                                        South Asia
                                                                                                                                       Per cent

1
    Data for 2011; for India, 2008 (estimate), 2011, 2014 and 2017.
Sources: BIS (2020): D’Silva et al (2019); World Bank.

Technology is allowing faster, cheaper payments at home and abroad                                                                    Graph 4

Diffusion of fast retail payment systems in the world1                   Payment innovations are reducing remittance costs
                                                  Number of countries                                                                  Per cent

1
    The dotted part of the lines corresponds to projected implementation.    2
                                                                                 Partnerships between non-bank firms and financial institutions.
Sources: World Bank (2020); BIS (2020); authors’ calculations.

     Technology has also been a key driver of the costs of migrants’ remittances. Currently, migrants pay
an average of 7% fees to send a remittance of $200 home (World Bank (2020)). These costs have fallen
over time, and technology has been an important driver. Indeed, non-bank money transfer operators
charge consistently less for remittance services than banks and joint ventures (Graph 4, right-hand panel).
Competition from these non-bank providers may also be an important reason for the decline in remittance
costs for banks. It is notable that during the Covid-19 pandemic, the costs for banks and joint ventures
have actually ticked up slightly, while those for money transfer operators have not.

                                                                      6/14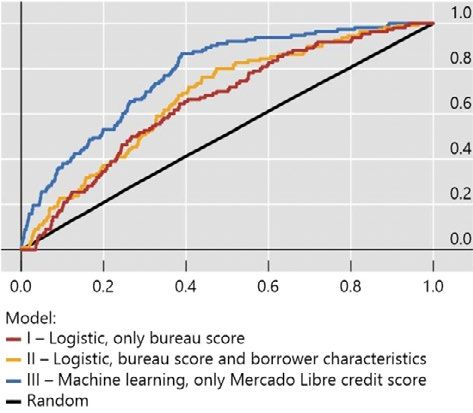
Fintech allows credit to reach individuals and firms that are typically unbanked. This should increase
the effectiveness of monetary policy transmission. For instance, most small and medium-sized enterprises
(SMEs) in China, India and Latin America do not meet the minimum requirements for a bank loan
application, especially since they cannot provide audited financial statements or other formal
documentation (Gambacorta et al (2019, 2020)). This does not allow them to be rated by a credit bureau.
Big tech firms are able to overcome these limitations by exploiting the information provided by their core
businesses, such as e-commerce or social media, with no need for additional documentation from
merchants.
      Evidence from BIS researchers (Frost et al (2019)) shows that the internal ratings of big techs, which
use big data and machine learning, are better able to predict losses. Graph 5 (left-hand panel) shows the
loss rate, ie the volume of loans more than 30 days past due relative to the origination volume for the case
of Mercado Libre in Argentina. While both the internal rating and the credit bureau rating are continuous
variables (between 0 and 1,000), they can be segmented into five different risk groups (A through E) versus
three clusters identified by the credit bureau.
     For a given bureau rating (eg low-risk), the expected loss rate is strictly monotonic with the internal
rating (ie the patterns of the dots show that the internal rating orders expected loss). Conversely, given an
internal rating (eg C, D or E), the loss rate is not strictly monotonic with the bank bureau risk. For example,
the dot associated with internal rating D in the low-risk bureau category indicates a higher risk than the
internal rating D in the medium-risk bureau category. Moreover, the internal rating has a broader range,
covering losses from 0.0 to 10.2%; the bureau rating ranges from 0.7 to 2.8%.
      Most importantly, by using its proprietary scoring model, Mercado Libre is able to serve the profiles
assessed as high-risk by the bureau. The size of the dots is proportional to the share of the firms in rating
distribution. Thirty per cent of the portfolio originated by Mercado Libre would fall into the high-risk
cluster. Banks use a mix of credit bureau information and soft information from loan officers, but in general
would not lend to these borrowers in Argentina. These simple statistics indicate that the internal rating
system of Mercado Libre is more granular than a traditional credit bureau, and allows the firm to serve
vendors that would be otherwise be excluded from the provision of credit. It remains to be verified if an
internal rating system based on machine learning and big data from the e-commerce platform can
outperform (ex post) the more traditional models in predicting defaults over a full business and financial
cycle.
     There is also more formal evidence on the predictive power of machine learning-based credit scores.
Graph 5 (right-hand panel) reports the area under the receiver operating characteristics (ROC) curve for
different models in Argentina. The ROC curve is created by plotting the true positive rate against the false
positive rate at various threshold settings. The area under the ROC curve ranges from 50% (purely random
prediction) to 100% (perfect prediction). The 45 degree line corresponds to tossing a coin. We consider
three models. The red line is a logistic model with only the bureau score. The yellow line is a logistic model
with the bureau score and borrower specific characteristics. The blue line is the machine learning and big
data model of Mercado Libre. The predictive power rises substantially for the model that use a machine
learning technique applied to the data from the e-commerce platform.

                                                     7/14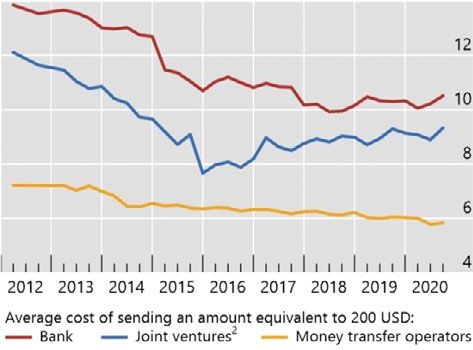
Technology and big data can help enhance credit access for small firms                                                                    Graph 5

Loss rates by big tech internal ratings vs the credit                      Better prediction of default using ML big data as seen by
bureau in Argentina1                                                       ROC curves for the different credit score models2
                                                               Per cent

1
  The loss rate is the volume of loans more than 30 days past due relative to the origination volume. In its use to date, the internal rating of
Mercado Libre is better able to predict such losses. It segments the originations into five different risk groups, versus the three clusters
identified by the credit bureau. The size of the dots is proportional to the share of the firms in the rating distribution. The horizontal blue lines
indicate the average loss rates for each credit bureau cluster. 2 True positive rates versus false positive rates for borrowers at different
thresholds for a logistic model with only the credit bureau score (I), a logistic model with the bureau score and borrowers’ characteristics (II),
and a machine learning model with the Mercado Libre credit score (III). A random model is included for comparison purposes. The ROC curve
shows that the machine learning (ML) model has superior predictive power to both the credit bureau score only and the credit bureau score
with borrower characteristics.
Source: Frost et al (2019).

Some important challenges: can digital technology offset exclusion?

Overall, technology holds great promise to enhance inclusion – but there are also important challenges.
Could financial technology be sophisticated and significantly improve risk assessment, but not be sufficient
to offset discrimination and exclusion?
     As one example, a study by Fuster et al (2020) looks at machine learning-based credit scoring in US
mortgage markets. They find that white and Asian Americans benefit disproportionately from the new
machine learning models. Black and Hispanic borrowers benefit less. Graph 6 shows the cumulative share
of borrowers for each change in the predicted probability of default. For white and Asian borrowers, about
65% are better off with the machine learning model. This is only 50% for Black and Hispanic borrowers.
     Another challenge is to increase the dissemination of technology, since currently it is adopted
primarily by the wealthy. Frost et al (2020) have shown evidence of the Matthew Effect – the tendency for
the rich to get richer. The name comes from the New Testament Book of Matthew, which states: “For unto
every one that hath shall be given”. This tendency is explored in many areas in the social sciences. In Italy,
the researchers show that higher-wealth households have achieved consistently higher returns than lower-
wealth households (Graph7, left-hand panel). They also find that especially higher-wealth households were
able to benefit from remote banking access – an early form of fintech (right-hand panel). Another study

                                                                       8/14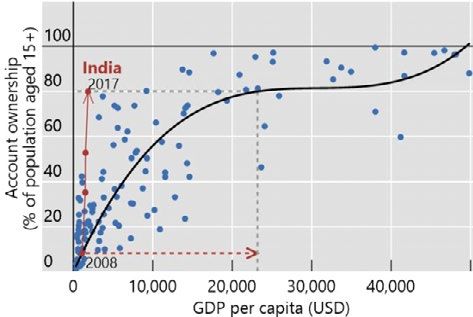
finds comparable evidence for the United States, where gains from financial technology have accrued
disproportionately to high-wealth investors since the early 2000s (Mihet (2020)).

Credit innovations may benefit different ethnic groups differently
Cumulative share of borrowers                                                                                                       Graph 6

The horizontal axis reports the change in the log predicted default probability as lenders move from traditional predictive technology (a
“Logit” classifier) to machine learning technology (a “Random Forest” classifier). The vertical axis reports the cumulative share of borrowers
from each racial group that experience a given level of change.
Sources: Fuster et al (2020); Gambacorta et al (2019).

     An implication of these findings is that other accompanying policies are needed to address these
challenges. Technology may be helpful – in this case to achieve higher returns – but if it is adopted
primarily by those who are already well off, it may enhance inequality. We often hear of the “digital divide”.
The good news is that in Italy, this tendency has declined over time, as remote banking has become more
widely diffused (Frost et al (2019)). That is, technology does not produce disparities when it is for everyone.

                                                                   9/14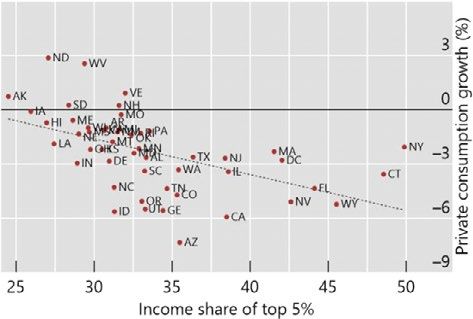
The Matthew Effect: inequality in returns to wealth                                                                                 Graph 7

Rate of financial returns of Italian households by net                  Effect of remote banking access on financial returns2
wealth quartile1
                                        Per cent, year average = 100

1
   The graph indicates that households with wealth in the top quartiles of the distribution have consistently received higher returns on their
investments than other wealth quartiles. 2 The graph indicates that remote banking access has a positive impact on the returns to household
financial wealth. This increases starkly moving towards the top of the wealth distribution.
Source: Frost et al (2020).

Big techs have a rising share in overall market cap and higher profitability, and
the “tech premium” in labour markets is rising                                                                                      Graph 8

Share of big techs1 in overall stock index2 and profit                  Average salary in the US by industry3
margins
Per cent                                                    Per cent                                                                     USD

1
  The sample includes Alibaba, Amazon, Apple, Baidu, eBay, Facebook, Google, Kakao Corp, Line, Microsoft, NTT Docomo, Rakuten, Samsung
and Tencent. 2 MSCI All Country Global Index. 3 Average profit margin. 4 Average of publishing industries (includes software) and
information and data processing services. The graph shows that in the last decade the average salary for employees in the technology sector
has increased approximately 50% more than the wages in the financial sector.
Sources: Bureau of Economic Analysis; Bloomberg; authors’ calculations.

                                                                   10/14
In recent quarters – and particularly during the Covid-19 pandemic – we see another striking trend.
Big tech companies, which make widespread use of digital technologies, have been highly profitable
(Graph 8, left-hand panel). You can see the yellow line is consistently higher than the blue line, which
represents profitability for all companies in the MSCI All Country Index. As a result of this, the share of big
techs in global market cap has risen, from less than 10% in 2011 to over 30% today. Indeed, e-commerce
platforms like Amazon or Mercado Libre have done very well during the pandemic, seeing a big increase
in demand for their services. That helps to explain the steepening of the red curve in early 2020.
This divergence between tech firms and the rest is also apparent in labour markets. Before and after
the GFC, there was a debate about wages in the financial sector, and how abnormally high wages may pull
the best and the brightest away from other sectors in the “real economy” (Philippon and Reshef (2012)).
You can see that divergence in Graph 8 (right-hand panel) – finance and insurance do indeed pay higher
wages than other sectors, though the gap narrowed a bit after the crisis. What is striking is that the
technology industry – software, IT and data processing – is now paying wages that are more than twice as
high as those of other sectors, and much higher than in the financial sector (Pereira et al (2019)). This so-
called “tech premium” has continued rising, and it is even possible that this, too, has increased in the
pandemic.
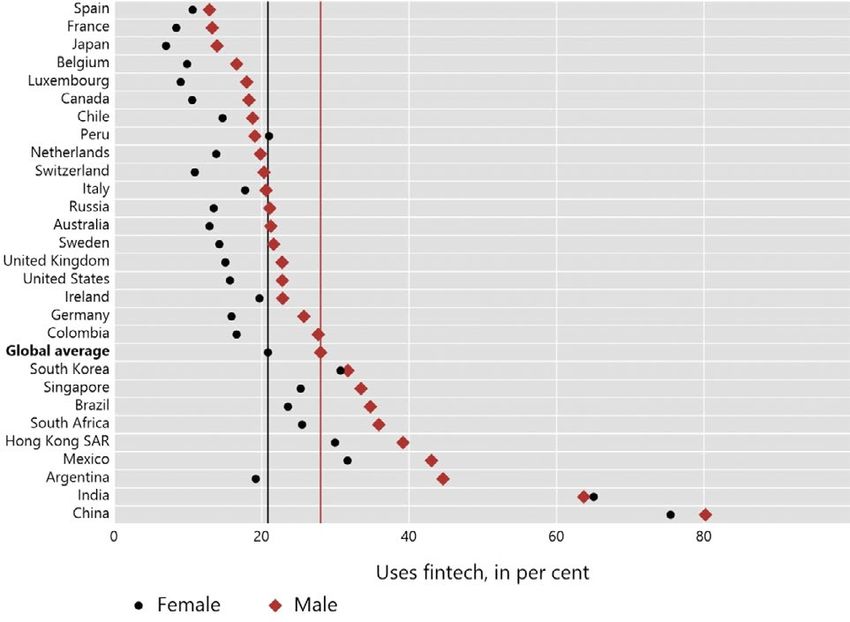
A final challenge is that technology on its own may not close the gender gap in access to financial
services. Indeed, a new study by Chen et al (2020) looks into the fintech gender gap – the difference in the
use of fintech products and services by gender. The authors find that in nearly every country surveyed,
women are less likely to use fintech than men (Graph 9). India and Peru are the two exceptions. The authors
also find that women are less willing to share their data in exchange for better offers on financial services,
that they worry more about their security when dealing with companies online, and that they are less
willing to use fintechs for innovative services. Overall, for a variety of potential reasons, it seems that fintech
providers are not yet adequately catering to women. If fintech is to help make our financial system more
inclusive, then additional policy efforts – around digital ID, data protection regulation and digital and
financial literacy – may be needed. In these areas, central banks and regulators may have to cooperate
with other public authorities.
11/14Use of fintech products and services by country and gender Graph 9
Source: Chen et al (2020).
Conclusion
Monetary policy has become more concerned with inequality, mostly because inequality is likely to impact
its transmission and its effectiveness. This has been backed by growing empirical evidence for advanced
economies, including some of my current research (Kharroubi et al (2021)). This new body of evidence
resonates with ongoing reviews of monetary policy frameworks, most prominently that of the Federal
Reserve. While inequality influences monetary policy transmission and job creation, it should be
particularly relevant at the current juncture since the Covid-19 pandemic has worsened poverty, especially
of workers in the most heavily customer-facing sectors, and inequality has increased even more than in
previous recessions.
Can technology help? New financial technology can certainly increase financial inclusion and thus
enhance policy effectiveness. Yet by itself, without the support of other policies, it can also be insufficient
to fully offset discrimination. Overall, we see that technology holds enormous promise to enhance financial
inclusion and thus reduce inequality – and we see concrete evidence of this already. But there are several
challenges, and ways in which digital technologies could need to be combined with other policies in order
to avoid new forms of exclusion.
12/14For technology to contribute even more to inclusion, we need to promote its quality as a “public
good” – its availability to all with a wide diffusion. That could entail looking at fostering public platforms
and competition and preventing innovation from being captured and managed by the few.
Hence, public policy interventions have to aim at promoting both efficiency and equity. This can
include building public infrastructures like digital ID or fast retail payment systems. It could also include a
balanced regulatory approach, incentivising innovation and avoiding rent-seeking. That requires concrete
progress on inclusion metrics from both incumbent financial institutions and new fintech and big tech
challengers. It also implies adapting regulation and supervision and continuing research on the effects of
our digital transformation.
Overall, technology is obviously unlikely to solve the problems of inequality on its own. An array
of structural policies is needed, as is well known (eg Milanovic (2019), Atkinson (2015) and
Bourguignon (2015)). One promising lead is that new digital technologies may also make other policies
more efficient. For instance, fiscal policy may use better digital ID tools to target specific households
benefiting from conditional cash transfer (CCT) programmes, or the speed of settlements and transfers
might allow poor households to be reached much faster. Moreover, if technology enhances policy
coordination, it can increase the overall efficiency of public policies in general. In the domain of the
financial sector, if central banks and regulators want technology to be a force for both efficiency and
equity, we have to promote wide diffusion and support for important public policy goals. It is up to
policymakers in all areas to contribute to these goals and thus to a more equal, more efficient and more
inclusive economy.
References
Ahmed, F, N Ahmed, C Pissarides and J Stiglitz (2020): “Why inequality could spread COVID-19”, The Lancet,
vol 5, no 5.
Atkinson, T (2015): Inequality – what can be done?.
Bank for International Settlements (2020): Annual Economic Report 2020, June.
Berg, A, J Ostry, C Tsangarides and Y Yakhshilikov (2018): “Redistribution, inequality, and growth: new evidence”,
Journal of Economic Growth, vol 23.
Bourguignon, F (2015): The globalization of inequality.
Chen, S, S Doerr, J Frost, L Gambacorta and H S Shin (2020): “The fintech gender gap”, BIS Working Papers,
forthcoming.
Doerr, S, T Drechsel and D G Lee (2020): “Top incomes, financial intermediation, and small firms”, mimeo.
Domanski, D, M Scatigna and A Zabai (2016): “Wealth inequality and monetary policy”, BIS Quarterly Review,
March, pp 45–64.
D’Silva, D, Z Filková, F Packer and S Tiwari (2019): “The design of digital financial infrastructure: lessons from
India”, BIS Papers, no 106, December.
Feiveson, L, N Goernemann, J Hotchkiss, K Mertens and J Sim (2020): “Distributional considerations for monetary
policy strategy”, Federal Reserve Board Finance and Economics Discussion Series, no 2020-073,
https://doi.org/10.17016/FEDS.2020.073.
Frost, J, L Gambacorta, Y Huang, H S Shin and P Zbinden (2019): “BigTech and the changing structure of financial
intermediation”, Economic Policy, vol 34, no 100.
Frost, J, L Gambacorta and R Gambacorta (2020): “The Matthew Effect and modern finance: on the nexus
between wealth inequality, financial development and financial technology”, BIS Working Papers, no 871.
13/14Fuster, A, P Goldsmith-Pinkham, T Ramadorai and A Walther (2020), “Predictably unequal? The effects of
machine learning on credit markets”, mimeo.
Gambacorta, L, Y Huang, H Qiu and J Wang (2019): “How do machine learning and non-traditional data affect
credit scoring? New evidence from a Chinese fintech firm”, BIS Working Papers, no 834.
Gambacorta, L, Y Huang, Z Li, H Qiu and S Chen (2020): “Data vs collateral”, BIS Working Papers, no 881.
Jaumotte, F, S Lall and C Papageorgiou (2013): “Rising income inequality: technology, or trade and financial
globalization?”, IMF Economic Review, vol 61.
Kaplan, G, B Moll and G Violante (2018), “Monetary policy according to HANK”, American Economic Review,
vol 108, no 3.
Kharroubi, E, E Kohlscheen, M Lombardi, B Mojon and L Pereira da Silva (2021): “Inequality and the post-Covid
recovery”, Bank for International Settlements, mimeo.
Lombardi, M, M Riggi and E Viviano (2000): “Bargaining power and the Phillips curve: a micro-macro analysis”,
BIS Working Papers, no 903.
Mihet, R (2020): “Who benefits from innovations in financial technology?”, mimeo.
Milanovic, B (2019): Capitalism alone.
Pereira da Silva, L, J Frost and L Gambacorta (2019): “Welfare implications of digital financial innovation”, based
on remarks to Santander International Banking Conference, November.
Philippon, T and A Reshef (2012): “Wages and human capital in the US finance industry: 1909–2006”, The
Quarterly Journal of Economics, vol 127, no 4.
Powell, J (2020): “New economic challenges and the Fed’s monetary policy review”, in Navigating the decade
ahead: implications for monetary policy, proceedings of the Federal Reserve Bank of Kansas City Jackson Hole
symposium, August.
Romer, C and D Romer (1999): “Monetary policy and the well-being of the poor”, Economic Review, vol 84,
issue Q I.
Sommeiller, E and M Price (2018): “The new gilded age: income inequality in the US by state, metropolitan area,
and county”, Economic Policy Institute, 19 July.
World Bank (2020): Remittance Prices Worldwide, remittanceprices.worldbank.org.
14/14You can also read