Fiscal Commission Working Group First
Report - Annex

Assessment of key currency options
←
→
Page content transcription
If your browser does not render page correctly, please read the page content below
Fiscal Commission Working Group First Report - Annex Assessment of key currency options
Assessment of Key Currency Options

Introduction
1          As highlighted in the Fiscal Commission Working Group’s First Report, a key choice for an
           independent Scotland in designing its macroeconomic framework concerns the currency to
           use.

2          The choice of currency, by dictating both the fundamental structure of the monetary
           framework and the relationship with other countries, will also have implications for the
           overall framework for fiscal policy and financial stability.

3          Countries of comparable size to Scotland have adopted a range of different currency
           frameworks to suit their economic situation. This paper builds upon the analysis set out in
           chapter seven of the Working Group’s Report. It provides a summary of the key options for
           Scotland and provides analytical assessment of their respective strengths and weaknesses1.

4          There are a variety of economic factors and technical assessments which are worthy of
           consideration when assessing the merits of the currency options available to an independent
           Scotland. These can be useful in helping to inform the debate.

5          However, views on the relative importance of each factor and the respective trade-offs are
           likely to be subjective2. Moreover, the best structure may change over time depending upon
           developments in both the Scottish economy and trade partners.

6          The key point is that sovereignty over the decision with respect to the currency would rest
           with the Scottish Parliament. Scottish Ministers have indicated a clear preference to retain
           Sterling as part of a formal monetary union.

1                                                                                                                              st
    All data is latest available as at end January 2013. New output estimates were published by the Scottish Government on the 31 January
2013 and have been used in the analysis in this paper except where highlighted.
2
 Care should also be taken when extrapolating the experiences of other countries to the particular case of Scotland. Ultimately decisions
over currency choice – as is the case with all macroeconomic frameworks – will be driven by key characteristics of the economy and local
considerations.

                                                                     1
Assessment of Key Currency Options
Assessing the Options
7 There are a number of different frameworks through which the various considerations
relevant for the choice of currency can be assessed.
8 It is common practice to begin considering currency options by referring to the work on
‘Optimal Currency Areas’ (OCA)3. This frames the choice as a contrast between the benefits of
greater macroeconomic autonomy (in respect of independent monetary and exchange rate
policy) versus the benefits to trade and competition from a common currency area (e.g.
exchange rate risk, transaction costs and price transparency).
9 In essence, countries are believed to be better suited to currency unions when there is a high
degree of trade, capital and labour mobility between them, and they share the same broad
trends and structures in their macroeconomies.
10 The criteria typically used to make such an assessment include:
· Trade levels, both intermediate and final goods & services;
· Factor mobility;
· Alignment of economic structures, both within the economy – e.g. importance of key
sectors – and institutionally and structurally – e.g. wage bargaining, home ownership;
· Wage and price flexibility;
· Productivity;
· Correlation of economic cycles; and
· Prevalence and scale of asymmetric shocks.
11 In the economic literature, ‘Optimal Currency Area’ analysis provides a useful starting point
for assessing the range of currency options. It is however, principally a theoretical and
technical assessment of hypothetical scenarios. In practice, a series of important practical
considerations – economic, historical and political – will also play an important role.
3
The seminal academic paper in the field was Mundell, R.A. (1961), “A Theory of Optimum Currency Areas”, American Economic Review,
Vol. 51(4), pp. 657 – 665.
2Assessment of Key Currency Options
12 Moreover, it is also relevant to consider microeconomic factors such as the preferences and
expectations of the users of a particular currency4.
13 In analysing the currency choices for Scotland, it is helpful to view each option through five
broad areas of assessment –
· Are the fundamental structures of the Scottish economy currently suited to such an
arrangement?
· Are there any benefits/implications for short-term macroeconomic stabilisation?
· What are the potential benefits/implications for trade and investment?
· How straightforward would the transition arrangements be? and,
· What policy levers would be open to future Scottish Governments to address the key
challenges and take advantage of new opportunities in the Scottish economy?
14 Retaining Sterling would be a practical option for Scotland immediately post-independence. In
addition to the long-term structural benefits that are highlighted below, retaining Sterling
would assist with a smooth transition to independence (e.g. practicalities of sharing assets and
liabilities and establishing the necessary economic, financial and fiscal institutions). It would
ensure a functioning monetary system from day one of independence.
15 Over the medium term it may well be in Scotland’s interests to move to an alternative
arrangement, should either the performance of the Scottish economy change or the
preferences of the people of Scotland change. It may also be in the interest to retain Sterling.
This would be a decision for the future.
16 This paper assesses three currency options for Scotland according to the five areas of
assessment set out above –
· Sterling;
· the Euro; and,
· Establish a Scottish currency.
4
For example, optimal currency area work assumes that if a country chooses to move to a new currency option it will immediately become
the principal medium of exchange. However, with fully tradable currencies the reality can be different. The use of the dollar in many
countries outside the US – including those with their own currency – is a case in point.
3Assessment of Key Currency Options
Sterling
17 As highlighted in Chapter 7 of the Working Group’s First Report, there are two likely avenues
through which Sterling could remain the currency of an independent Scotland.
18 Formally, through a monetary union with the rest of the UK, or informally, through a process
termed ‘sterlingisation’.
19 Chapter 7 of the Working Group’s First Report provides a description of each option, however
Box 1 below provides a short summary.
Box 1: Options to retain Sterling
· Monetary policy set for ‘Sterling Area’. (UK and Scotland)
· Range of options to cover governance and oversight of monetary
Formal
framework – including supranational central bank with national central
Monetary Union
banks, or joint shareholder model of one ‘Sterling Area’ Bank.
· Negotiated with UK Government
· Sterling currency for Scotland but without formal monetary
Informal arrangements – e.g. central bank or lender-of-last-resort.
Arrangement
· Monetary policy set for UK only.
(‘Sterlingisation’)
· No input into governance or oversight of monetary framework
20. International evidence suggests that informal monetary unions tend to be adopted by
transition economies or small territories with a special relationship with a larger trading
partner (e.g. between the UK and Jersey, Guernsey and the Isle of Man). Advanced
economies of a significant scale tend not to operate in such a monetary framework. Though
an option in the short-term, it is not likely to be a long-term solution. The focus of the
discussion below is therefore set within the context of a formal monetary union.
4Assessment of Key Currency Options
Are the fundamental structures of the Scottish economy suited to
such an arrangement?
20 Sterling has been Scotland’s currency throughout modern economic history. It underpins day-
to-day economic decision making across all sectors of the Scottish economy, households,
businesses and the public sector.
21 Scotland is an open economy with the UK as its major trading partner. Exports to the rest of
the UK account for around two thirds of total exports – approximately £46 billion in 20115.
While robust figures on imports are not yet available, it is clear from existing data – both from
Scottish Input-Output tables and new experimental data in the Scottish National Accounts
Project – that imports from the UK are at least as large as the figures for Scottish exports.
22 It is interesting to note UK exports of services (excluding travel, transport and banking) in 2010
to Ireland were around £5.4 billion, with exports to Germany and France of around £3.9 billion
and £5.2 billion respectively6.
23 In addition, while less than 2% of registered enterprises in Scotland are owned by enterprises
from the UK, they account for around 20% of employment and turnover7. Anecdotal evidence
also points to the existence of a number of significant cross border UK companies operating in
Scotland and vice versa.
24 There is also evidence of labour mobility between Scotland and the UK – helped by strong
transport links, shared culture and a common language. Historically, the vast majority of
inward migration into Scotland has been from other locations in the UK. This has changed to
some extent in recent years following the accession of new Member States to the EU. In
2010-11 however, around 50% of migration into and out of Scotland was still from the UK8.
25 From a macroeconomic perspective, and as highlighted in Chapter 4 of the Working Group’s
First Report and Box 2 below, on key indicators of economic performance Scotland currently
performs close to the UK average. Scotland also shares similar institutional and economic
structures and principals with the rest of the UK.
5
Global Connections Survey 2011
6
International Trade in Services Survey 2010, ONS.
7
Scottish Corporate Statistics 2010 - www.scotland.gov.uk/Topics/Statistics/Browse/Business/Corporate
8
www.scotland.gov.uk/Topics/Statistics/Browse/Population-Migration/grosorigindestmig
5Assessment of Key Currency Options
26 This suggests that – based upon historical data – Scotland meets many of the key structural
economic criteria for a successful currency union with the rest of the UK.
Box 2: Key structural linkages; Scotland/UK vis-à-vis the Euro Area
· Scotland and UK: Scottish onshore GDP per capita in 2011 was 99% of
the UK average and third highest in the UK9.
Competitiveness
· Euro Area: GDP per capita in Germany is more than 50% greater than in
Greece. Even amongst the developed core economies, GDP per capita
can differ by more than 20% (see Table 4)
· Scotland and UK: Scottish productivity (GDP per hour worked) in 2011
was 97% of the UK average and third highest in the UK or 99% of the
UK average in terms of GDP per filled job10.
Productivity
· Euro Area: In terms of GDP per hour worked, productivity in Germany
was estimated to be around 70% more than in Greece in 2011. Even
core economies can vary greatly, with productivity in France nearly
30% greater than in Italy (see Table 4)
· Scotland and UK: Labour market trends in Scotland and UK are similar.
The latest data, (Sep-Nov 2012), shows unemployment in Scotland of
7.8% compared to 7.7% in UK11.
Labour market
· Euro Area: Unemployment in the Euro Area is more varied. Current
rates range from 5.9% in Germany to 17.7% in Greece and 21.7% in
Spain. The Euro Area average is 9.6%.12
· Scotland and UK: Scotland’s economic cycle, while at a lower trend rate
Economic cycle
of growth, shares broadly the same shape and structure as the UK –
see Box 3. The two economies share a correlation coefficient on output
9
December 2012 Regional Gross Value Added release, ONS
10
GVA per hour worked, ONS
11
Nomis
12
Eurostat
6Assessment of Key Currency Options
of 0.90 (see table 6).
· Euro Area: There is a variable level of synchronisation between Euro
Zone members as measured by their growth correlation coefficients,
ranging from 0.92 between France and Austria to 0.05 between
Germany and Greece (see table 6).
· Scotland and UK: At the macroeconomic level, the Scottish and UK
economies share similar structures and industry compositions. Analysis
of past asymmetric shocks – Box 4 – shows that they are relatively
limited and temporary in nature.
Asymmetric
Shocks
· Euro Area: The 2008/09 credit crunch shows that shocks can be
asymmetric across the Euro Area. In 2009, average growth across the
Euro Area was -4.4%. However, in this year Cyprus grew at a greater
rate of -1.9% whilst Estonia grew at -14.1%.13
· Scotland and UK: Around 2/3 of Scottish exports are destined for the
UK. Although not currently measured, there is likely to be a similar
level of imports from the UK to Scotland.
Openness
· Euro Area: Around 50% of German and French exports are to other
member states. This falls to around 20% for Greece.14
· Scotland and UK: On most assessments, Scotland and the UK have
similar degrees of labour market flexibility (e.g. regulation, skilled
workforce, wage bargaining), share similar institutions and asset
Structural market structures. Scotland and the UK also have very similar housing
market structures. In 2011, 63.9% of all dwellings in Scotland were
owner occupied, compared to 64.7% in the UK15.
· Euro Area: Fundamental differences in the structure of labour and
13
Eurostat
14
Eurostat
15
DCLG and ONS
7Assessment of Key Currency Options
product markets existed prior to the creation of the Euro Area. Many
of these continue today16.The discussion on the Euro Area below
highlights notable divergences between members in terms of industrial
make-up, trend levels of employment and levels of labour productivity.
· Scotland and UK: Scotland’s fiscal position is not dissimilar to the UK.
Over the period 2006-07 to 2010-11, Scotland’s estimated net fiscal
deficit (including a geographic share of North Sea Revenues) averaged
5.1% of GDP compared to 6.4% for the UK17.
Fiscal Position · Euro Area: There were significant divergences evident from the start of
the Euro. Many countries failed to meet criteria on net debt, and
divergences have since grown. In 1999, France had a gross debt to GDP
ratio of 59% compared to 113% in Italy. Greece was running a fiscal
deficit of 3.7% of GDP compared to 1.2% in Spain. In 2011, these
discrepancies have become more extreme18.
· Scotland and UK: High degree of labour and capital flows (e.g. in 2010-
11 around 50% of migration into and out of Scotland was from the UK).
Supported, not just by economic factors, but also by social factors (e.g.
common language).
Factor Mobility · Euro Area: While the degree of factor mobility between certain
member states is high – e.g. Belgium and Luxembourg – it is much less
pronounced elsewhere. Across the EU, only 2.5% of EU citizens are
currently resident in a country that they are not a citizen of19, and only
0.1% of EU population have changed official residence.20 Less than half
of EU member state FDI is from other member states21.
16
http://www.ecb.Europa.eu/pub/pdf/scpwps/ecbwp1360.pdf
17
Scottish Government: Government Expenditure and Revenues (GERs).
18
Eurostat
19
Eurostat population figures and Scottish Government calculations
20
http://www.ecb.int/pub/pdf/scpops/ecbocp52.pdf. (Based on EU15 countries in 2001, page 7)
21
Eurostat
8Assessment of Key Currency Options
27 As highlighted in Chapter 8 of the Working Group’s Report, one relative difference between
the Scottish and UK economies is the importance of North Sea oil and gas output and
revenues.
28 It is estimated that an independent Scotland would be a net oil and gas exporter. Oil is a major
component of the Scottish economy. As highlighted in the report, careful management of
Scotland’s oil and gas reserves is likely to be a key priority for an independent Scotland.
Norway for example has successfully managed its oil wealth and continued to have a strong
onshore economy through careful currency management and the use of stabilisation and
wealth funds.
29 Retaining Sterling would provide a helpful mechanism to manage the macroeconomic
implications of oil and gas production, particularly on the value of the currency and the
implications for the balance of payments. A practical advantage of being part of a larger
currency union, such as Sterling or the Euro Area, is that one issue – commodity currency
volatility – would be significantly diluted. The Balance of Payments for Sterling would continue
to benefit from Scotland’s share of North Sea production22.
Are there any benefits/implications for macroeconomic stabilisation?
30 There are two aspects to this from the perspective of retaining Sterling. On the one-hand, as
part of a monetary union with the rest of the UK, Scotland would remain part of a relatively
large common economic area (compared to the size of the Scottish economy). This can
provide a degree of insulation against external shocks and instability in the global economy. It
would also mean retention of the existing monetary frameworks and reputation for
macroeconomic management currently held by the Bank of England.
31 One of the advantages that some independent countries have found in the past would not
however be open to Scotland – that is, the opportunity to set an independent monetary and
financial stability policy. If the two economies were to diverge, then monetary policy may not
be set optimally for Scotland, requiring adjustment in the real economy (e.g. through wages,
prices or employment) or fiscal policy.
22
See Professor Alex Kemp – ‘Evidence to Select Committee on Economic Affairs, Enquiry on the Economic Implications for the UK of
th
Scottish Independence’, 24 October 2012.
9Assessment of Key Currency Options
32 Of critical importance therefore is the degree of alignment of the Scottish and UK
macroeconomies. The question of whether monetary policy decisions at the aggregate
Sterling Area level are appropriate for the Scottish economy depends on what part of the
business cycle the Scottish economy is operating at relative to the rest of the UK.
33 It is always challenging to assess future alignment, and this will clearly depend upon a number
of different factors. However, history can provide a useful guide. Box 3 provides a summary of
analysis which assesses the degree of convergence between the Scottish and UK economies,
and therefore the likely suitability of a monetary policy set for the Sterling Zone for an
independent Scotland.
Box 3: Analysis of Economic Cycles: Scotland and UK
Charts 1 and 2 present differences in year-on-year growth in output and unemployment data
between the UK and Scotland. In chart 1 the solid bars show annual growth in GDP. The solid black
line shows the percentage point difference in growth between the two economies. As can be
observed, the difference varies around 0% and is rarely greater than 2%.
From the chart, it is clear that there have been relatively few periods when the two economies are
noticeably divergent. In only 2 years has one economy grown and the other shrank (1974 and 1991),
and even then, the differences were small (i.e. one grew weakly whilst the other contracted only
slightly). On only 3 occasions have growth rates differed by more than 2%.
Chart 1: Year on Year change in Output, UK and Scotland
10.0%
8.0% UK
% change in output
6.0% Scotland
4.0%
2.0%
0.0%
-2.0%
-4.0%
-6.0%
1964
1966
1968
1970
1972
1974
1976
1978
1980
1982
1984
1986
1988
1990
1992
1994
1996
1998
2000
2002
2004
2006
2008
2010
Source: UK data from ONS
Scotland: Scottish Government GVA estimates
Chart 2 presents unemployment data for Scotland and the UK since 1992. The bars show the
10Assessment of Key Currency Options
percentage change in the unemployment rate from year-to-year. The black line shows percentage
point differences. (NB: Scottish unemployment is more volatile than for the UK, though this is, in
part, likely to reflect greater noise in the data as a result of a smaller sample size.)
Chart 2: Unemployment – Year on Year percentage change - Scotland and the UK
60
Scotland
40 UK
Difference
20
Annual % change
0
-20
-40
Source: NOMIS web: http://www.nomisweb.co.uk/
Chart 2 shows that the labour market in Scotland and the UK appear to have moved broadly in the
same direction over time.
Despite greater volatility in the Scottish data, in only 3 years out of the last 21 have unemployment
rates moved in a different direction between Scotland and the UK.
Average unemployment rates in the UK and Scotland have been around 7% over the period. Over
this time, Scottish and UK unemployment rates have not differed by more than 2 percentage points,
and have an average difference of 0.8 percentage points.
Chart 3 extends the output analysis by showing estimates of the output gap for Scotland and the UK
using a statistical filters approach (H-P filter). The bars present the estimated output gap in each
economy and the line shows the absolute (i.e. irrespective of direction or sign) difference between
the two estimates.
11Assessment of Key Currency Options
Chart 3: Estimated Output Gaps – Scotland and the UK
6.0%
UK
4.0%
Scotland
% of trend GDP
2.0%
0.0%
-2.0%
-4.0%
-6.0%
1964
1966
1968
1970
1972
1974
1976
1978
1980
1982
1984
1986
1988
1990
1992
1994
1996
1998
2000
2002
2004
2006
2008
Source: Output estimates as Chart 1 plus Scottish Government calculations using HP filter
The output gap estimates differ by more than 2 percentage points on just two occasions – 1987 and
1988, a period known as the Lawson boom in the UK. Once again, this suggests relatively close
movements between the two economies. The average difference in output gaps since 1964 is just
0.7 percentage points.
By way of comparison, Chart 4 looks at the output gaps in Belgium and Luxembourg – two countries
in a formal monetary union since 1922.
Chart 4: Output Gaps – Belgium and Luxembourg
10.0%
Belgium
8.0%
% deviation from trend
Luxembourg
6.0%
4.0% Difference
output
2.0%
0.0%
-2.0%
-4.0%
-6.0%
-8.0%
1971
1973
1975
1977
1979
1981
1983
1985
1987
1989
1991
1993
1995
1997
1999
2001
2003
2005
2007
2009
Source: OECD GDP stats and Scottish Government calculations using HP filter
The data suggest that since 1971 there were fifteen years when the output gaps for Luxembourg and
Belgium diverged by more than 2 percentage points. The output gaps have differed by an average of
2.0 percentage points over the period. Belgium and Luxembourg were in a long running and
successful monetary union. The data suggest that Scotland and the UK appear relatively more
12Assessment of Key Currency Options
aligned than Belgium and Luxembourg.
Looking across a sample of 14 Euro Area countries, the average difference in output gaps since 2000
as estimated by the OECD is 3.0 percentage points - over three times the gap observed between
Scotland and the UK. This suggests that, historically, there has been greater alignment between the
Scottish and UK economic cycles than elsewhere – including countries that are considered to be
relatively closely aligned.
Analysis of the output gap controls for different trend rates of growth but not for different
volatilities. This may exaggerate the difference between economies that follow similar cycles but
with different magnitudes of growth. It is possible to remove the longer term trends in the data and
to express data on a standard scale to control for differing volatility. Chart 5 presents Scottish and
UK growth data expressed as standard deviations from trend. The bars show annual output growth
in the Scottish and UK economies expressed as standard deviations from their respective trends
since 1964. The line shows the difference.
Chart 5: Year on Year Change in output growth, standard deviations from trend, UK and Scotland
3.0
2.0
Standard Deviations
1.0
0.0
-1.0 UK
-2.0
Scotland
-3.0
Difference
-4.0
1964
1966
1968
1970
1972
1974
1976
1978
1980
1982
1984
1986
1988
1990
1992
1994
1996
1998
2000
2002
2004
2006
2008
2010
Source: Data as chart 1 plus Scottish Government calculations
From looking at the chart, there are no ‘stand out’ periods when the Scottish and UK economies
were notably divergent. Indeed there are only 4 years when the two series were separated by more
than one standard deviation from their respective growth trends, 1986, 1987 and 2002 and 2006.
If absolute differences in deviations from trend between economies over the period are averaged, it
is possible to calculate a single measure, hereafter referred to as “degree of synchronisation”. This
captures how closely economic cycles have moved in two economies, where a lower value predicts
more closely synchronised countries.
13Assessment of Key Currency Options
Table 1: Degree of Synchronisation: Scotland: UK & Euro Area Economies
Country Degree of Synchronisation
Italy and Belgium 0.42
(UK and Scotland) 0.42
Top 5 closest EU
France and Belgium 0.43
countries by degree of
synchronisation Italy and France 0.43
Sweden and Finland 0.48
Germany and Austria 0.48
EU Average 0.64
Sweden and Portugal 0.89
Top 5 divergent EU Spain and Denmark 0.89
countries by degree of Greece and Netherlands 0.89
synchronisation Greece and Finland 0.91
Greece and Sweden 0.98
Source: OECD stats plus Scottish Government calculations
Table 1 compares the closest and most divergent economies within 13 Euro Area countries to the
value for the UK and Scotland. The calculated value for Scotland and the UK based on the data above
is 0.42.
Unsurprisingly, table 1 shows that core Euro Area economies tend to be more synchronised than the
peripheral economies. Once again, Scotland and the UK appear to demonstrate a relatively high
degree of alignment.
A final approach to analysing the synchronisation is to test for the ‘appropriateness of monetary
policy’.
There are rules of thumb that can be used to estimate appropriate interest rates. One such rule is
the Taylor Rule, which weights deviations of inflation from target and output from trend to suggest a
bank rate. Chart 6 presents Taylor Rule Bank Rate estimates for the UK and Scotland.
Price data are only available for the UK as a whole and are not broken down for Scotland. However,
as discussed in Chapter 4 of the Working Group’s Report the data that is available does not suggest
much of a historical divergence in price indicators between Scotland and the UK (with the exception
of London).
14Assessment of Key Currency Options
Chart 6: Bank Rate implied by Taylor Rule
9.0%
UK
8.0%
Scotland
7.0%
6.0%
5.0%
Bank Rate
4.0%
3.0%
2.0%
1.0%
0.0%
1989
1990
1991
1992
1993
1994
1995
1996
1997
1998
1999
2000
2001
2002
2003
2004
2005
2006
2007
2008
2009
2010
2011
Source: Output data as chart 1, Prices data from ONS CPI All Items price index, Scottish Government calculations
The Taylor Rule analysis suggests that, over the last 2 decades, Scotland and the UK would have
followed very similar paths of monetary policy, given the same monetary objectives.
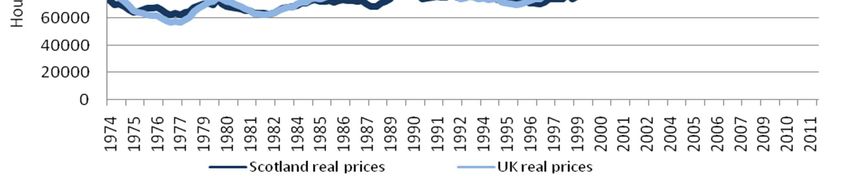
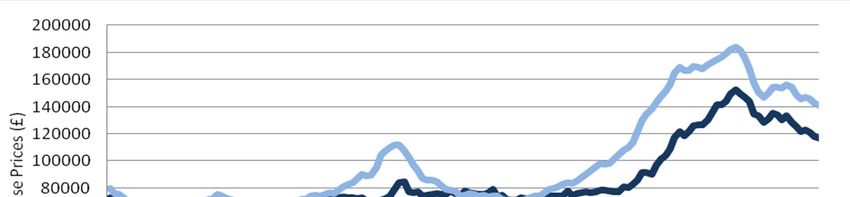
34 In addition to headline output data, other key macroeconomic indicators show a degree of
alignment. For example, employment levels are also broadly similar between Scotland and the
UK. Over the long-term, house prices have tended to follow a similar trend in Scotland and the
UK, the UK – driven primarily by developments in London and the South East – has had a
greater susceptibility to house price spikes and falls – see Chart 7.
Chart 7: Average House Prices in Scotland and the UK
Source: Nationwide
15Assessment of Key Currency Options
35 Overall therefore, past evidence suggests that the Scottish and UK economies have – at a
broad level – had relatively similar macroeconomic characteristics (albeit Scotland has grown
more slowly). While this will partly reflect the existing constitutional arrangement and a
common monetary and fiscal policy, it does lead to the conclusion that the economies of UK
and Scotland are integrated with each other more so than many economies of the Euro Area.
36 This suggests that monetary policy set to promote price and financial stability across a Sterling
Zone would, as an initial assessment, appear to be broadly consistent with the objectives of
helping to deliver a stable macroeconomic system for Scotland on day one of independence.
37 A clear issue with monetary unions is not just the degree of synchronisation over the cycle,
but also the prevalence of asymmetric shocks. Again there appears to be only limited
evidence, based upon historical data, to suggest that this would be a significant issue for
Scotland immediately post-independence. Box 3 above highlights that there have been few
years when there has been much divergence. Box 4 below discusses in greater detail certain
instances when there has been apparent divergence and assesses the overall impact on the
Scottish economy.
Box 4: Past Asymmetric Shocks: Scotland and UK
Case stud y 1: What happened in 1986 – 1988?
As highlighted in Box 3, both growth and output gap approaches suggest a divergence in the Scottish
and UK economies in the period 1986 – 1988.
During this period, UK GVA grew at 4.0%, 4.9% and 5.3% whilst Scottish GDP grew at 0.5%, 2.0% and
3.9%.
Sector breakdown
Table 2 presents a sector breakdown of Scottish GVA during these years. From the table it appears
that the cause of relatively weak growth in Scotland shifts from year to year, from manufacturing in
1986, construction in 1987 and to transport, storage and communication in 1988.
16Assessment of Key Currency Options
Table 2: Scottish GVA growth 1986 - 198823
Production and construction Services
Business,
Distribution,
GVA Cons- Transport & Financial, &
All Manufacturing All hotels and
truction comms other
catering
services
1986 0.5% -2.7% -3.0% 1.5% 2.0% 2.1% 0.8% 2.3%
1987 2.0% -0.5% -0.3% -1.8% 3.6% 3.8% 5.6% 3.0%
1988 3.9% 5.5% 6.3% 5.0% 3.3% 8.2% 0.6% 2.2%
Source: Scottish Government 2012 Q2 output estimates
The table suggests that there was no one sector responsible for the divergence in growth rates
during this period, and an explanation should be sought from elsewhere.
UK and Scottish economic events
The period in the mid-to-late 80’s in the UK was known as the ‘Lawson Boom’. Overall, the UK
experienced a period of rapid growth. This is attributed to expansionary fiscal and monetary policy
as well as financial de-regulation (the ‘big bang’) in 1986.
From 1986 to 1988, house prices in England and Wales increased 52%, compared to 15%24 in
Scotland. While there was strong growth in the UK during this period, it eventually gave out to
inflation and a recession in the early 90’s. Scotland appears to have missed both the boom and
subsequent bust that occurred in other parts of the UK. This could be explained by Scotland having a
smaller financial sector at the time – or at least a financial sector not specialising in the areas
immediately affected by de-regulation – relative to the UK as whole.
What is noticeable however is that this divergence was temporary and soon the Scottish and UK
economies returned to a period of greater alignment – see Chart 3 in Box 3. The asymmetric shock
to the two economies was temporary in nature.
Case stud y 2: Is it possible to detect Silicon Glen in Macro data?
The previous case study looked for notable movements in the data and related it to historic events.
This case study takes the opposite approach, taking a well-known economic event and relating this
23
http://www.scotland.gov.uk/Topics/Statistics/Browse/Economy/GDP2012Q2XLS
24
ONS House price index table 14
17Assessment of Key Currency Options
to the macro level data. NB This analysis is based on the pre January 31st GDP release, and is
therefore based on SIC03 sector classifications.
The Scottish electronics manufacturing boom, known as ‘Silicon Glen’, began in the 1960’s. The
industry peaked in Scotland in the late 90s when 5.4% of Scottish GDP was accounted for by the
sector.
The industry began to decline as manufacturers shifted production to lower cost economies. Though
a similar effect occurred in the UK overall, it was keenly felt in Scotland. By 2007, the manufacture of
electrical equipment in Scotland accounted for 1.7% of GDP, a relative decline of over two thirds.
Despite this, the Scottish economy grew strongly over this period. This is even taking into account of
a decline between 2001 and 2003 in “Electrical and Instrument Engineering” of over 30%. Table 3
summarises the sector weightings and contributions to growth during 2003, the year of the greatest
fall in output in the sector.
Table 3 shows that whilst Electrical and Instrument Engineering accounted for only 2.4% of output in
2003, the 30% decline in the sector reduced growth in the year by over 20%. This is as great a
contribution to growth as the rest of the manufacturing sector combined.
Table 3: Output growth 2003
Electrical Construction Services Mining and Electricity & Other
and Quarrying Gas Supply manufacturi
Instrument Industries ng
Engineer
Growth in 2003 -31% 6.6% 3.8% -2.4% 3.7% 6.0%
Weight (2003) 2.4% 6.8% 73.2% 1.3% 2.1% 11.8%
% contribution to
growth -22% 14% 84% -1% 2% 22%
Source: Scottish Government 2012 Q2 sector growth and weights
The analysis above shows the noticeable macroeconomic impacts that the decline in electronics
manufacturing in Scotland had. However, despite the steep declines in the sector, Scottish GVA still
grew strongly over the period and was closely aligned to the UK. In conclusion, while Scotland did
suffer a greater shock in electronics compared to the UK, the scale of the difference between
Scotland and the UK was small, and as a result the divergence at a macro level was limited.
18Assessment of Key Currency Options
How straightforward would the transition arrangements be?
38 One of the main advantages of retaining Sterling vis-à-vis other currency alternatives is the
fact that there will be little in the way of arrangements needed for transition. Retaining
Sterling would also give a newly independent Scottish Government time to establish
credibility and new economic institutions (Scottish Treasury, Fiscal Commission, Monetary
Institute etc.) an opportunity to develop effective working practices.
39 It would also provide a stable environment to resolve the allocation of assets and liabilities –
such as the share of public sector debt and assets – and to conclude negotiations in other
areas.
What are the potential implications for trade and investment?
40 As set out in Chapter 4 of the Working Group’s report, Scotland is an open economy. The UK is
Scotland’s principal trading partner, accounting for around two thirds of Scotland’s exports25.
Retaining Sterling would avoid exchange rate costs and allow for transparent comparisons to
be made over the cost of goods and services.
41 Scotland is also a key export destination for the rest of the UK. Promoting this single market
will therefore have advantages to both countries. This will be particularly important in sectors
which are highly integrated and for firms with complex supply chains operating across the UK.
42 It would also give investors certainty over the future value of returns. Retaining Sterling would
continue to promote access to the City - Europe’s largest and most liquid capital market.
What policy levers would be open to future Scottish Governments?
43 Under such an arrangement, fiscal policy and other economic levers such as regulation would
become the dominant economic policy tool open to the Scottish Government. These powers
would be substantial.
25
The scale of Scotland’s manufactured exports to markets outside the rest of the UK is similar (£13.7 bn) however manufacturing
accounts for a more significant share of Scotland’s overseas exports (62%).
19Assessment of Key Currency Options
44 As highlighted in the Working Group’s First Report, it is common for countries in a monetary
union to reach agreement on the broad parameters for managing fiscal policy (e.g. a range of
values for net borrowing or net debt) and increasingly financial stability. Within this overall
envelope however, there would be freedom to tailor tax and spending policies to the unique
policy opportunities and challenges facing the Scottish economy.
45 A fiscally independent Scotland in a monetary union would also have an opportunity to vary
fiscal stabilisation policies to reflect differences in the business cycle in Scotland vis-à-vis rUK.
46 Over the long-term, independence within a Sterling Zone would provide the Scottish
Government/Parliament with access to policy levers which can have an impact on long-term
productivity and economic growth such as taxation, regulation, competition policy and
welfare.
47 Such a framework would bring a step-change in the level of economic responsibility in
Scotland. Chapter 10 of the Working Group’s First Report discusses these powers in greater
detail.
Alternative currency options: The Euro and a Scottish Currency
48 Two alternatives to retaining Sterling would be for Scotland to join a currency union with
another currency (e.g. adopting the Euro) or to launch its own currency.
49 If Scotland was to join the Euro, monetary policy would be overseen by the European Central
Bank (ECB) and delivered by a Central Bank of Scotland. Scotland would have formal
representation on the ECB and be able to contribute to the monetary decision making process
for the Euro Area.
50 Chapter 7 in the Working Group’s First Report summarises the steps required of EU member
states before they can join the Euro. This would not be straightforward. Key convergence
criteria would take time to be met, even if there was a willingness to join the Euro. There
would however be no compulsion for a newly independent Scotland to join the Euro, as
discussed in paragraph 7.37 of the Working Group’s First Report.
20Assessment of Key Currency Options
51 An independent Scottish currency would have monetary and exchange rate policy set by a
Scottish Central Bank. Within the option of choosing a Scottish currency, a future government
may decide to peg to another currency or allow it to float. As the first is similar to a currency
union – though with the much greater ease of altering the peg – the focus of discussion that
follows is on the creation of a flexible exchange rate model.
Box 5: Summary of Euro and Scottish Currency
· Join the European Monetary Union (subject to meeting convergence
criteria)
· Euro is established as currency in Scotland
· European Central Bank sets monetary policy for Euro Area (including
The Euro
setting of interest rates). Scottish Central Bank discharges decisions of
ECB in Scotland
· Banking Union to govern financial stability
· Fiscal Compact
· New Scottish currency established
· Scottish Central Bank governs monetary framework (including setting of
interest rates)
· Monetary policy set for conditions in Scottish economy and/or to
Scottish Currency
maintain currency peg
· Option to peg the currency to another (e.g. Sterling) or to float-freely
· Options to manage fluctuations in currency – particularly from oil –
including establishment of stabilisation fund
Are the fundamental structures of the Scottish economy suited to
such an arrangement?
The Euro
52 As highlighted above, whether two areas constitute an ‘optimal currency area’ depends upon
a range of factors such as the degree of trade, capital and labour mobility, wage and price
flexibility and common productivity levels.
21Assessment of Key Currency Options
53 Based upon all of these criteria, the assessment on whether Scotland would form an ‘optimal
currency area’ with the Euro Area is less clear than is the case with Sterling. On many key
macroeconomic indicators, Scotland is currently less aligned with the Euro Area than it is with
the UK.
Macroeconomic indicators
54 Box 2 shows that Scotland has similar levels of output per person and productivity to the UK,
with output per person in Scotland around 99% of the level in the UK. Table 4 shows that this
can be quite variable across the EU and when compared to the UK (and by extension,
Scotland). Germany has over 50% greater output per person and over 70% greater
productivity than Greece. Even between core members, GDP per capita and productivity can
vary substantially. For example, GDP per capita is nearly 30% higher in Austria than Italy whilst
productivity is nearly 25% greater in France than Spain. Levels of capital investment varies
substantially too. The UK has quite low levels of gross capital investment.
55 Substantial differences in output, productivity and capital investment might suggest
divergences in underlying economic structures between these economies.
22Assessment of Key Currency Options
Table 4: EU macroeconomic indicators
GDP per capita in PPS Labour productivity per hour Gross Fixed Capital
(EU-27 = 100) worked (EU-27 = 100) Formation as % GDP
Germany 121 125 18
France 108 130 20
Austria 129 116 22
Greece 79 73 15
Spain 98 106 18
Italy 100 101 19
UK 109 106 15
Source: All figures from Eurostat for 2011
Structure of the economy
56 Chart 8 presents a sector breakdown of selected economies. Compared to Scotland, Germany
has a noticeably smaller Services and Construction sector but a larger production Industry.
Greece has a very large ‘Other Services’ sector but small production and financial services.
France is more heavily weighted towards business activities and away from Industry. By
comparison, the UK and Scotland are clearly more closely aligned in terms of their economies’
sector structures.
57 Similar industrial structures may be important to economic cohesion within a monetary union.
Say for example there is a global increase in demand for manufactured goods and a fall in
demand for services. Germany with a large manufacturing sector would move to operating
above capacity, whilst France with a larger services sector might experience a relative slump.
Differing monetary policy responses would be demanded in each case.
23Assessment of Key Currency Options
Chart 8: Sector breakdown of economies
UK Scotland
1 1
16
19
6
43
47 8
33 25
Greece Germany
3 1
14
24
4
41
4
61
21
31
France Legend
2
13
7
46
34
Source: Eurostat for all figures except Scotland, from Scottish Government output estimates. Eurostat gives a slightly different split of
financial services to non financial services in the UK to ONS, but is broadly similar.
24Assessment of Key Currency Options
Labour Force
Table 5: European Labour Force statistics
Tertiary education
Long term Unemployment attainment (% of
Employment Rate (%) Rate (%) population aged 30-34)
Germany 76 2.8 31
France 69 4.0 43
Austria 75 1.1 24
Greece 60 8.8 29
Spain 62 9.0 41
Italy 61 4.4 20
UK 74 2.7 46
Scotland 71** 2.2 54
Source: All data from Eurostat (2011) except where indicated
**From Nomisweb for 2011Q1. UK figure for comparison is 70
58 Labour market structures vary across the EU. Scotland has a comparable rate of employment
compared to Germany, France and Austria. These economies have much higher rates of
employment than Greece, Spain and Italy. These are long term trends and a similar pattern is
observed in the years leading up to the financial crisis. By contrast, the UK and Scotland have
similarly shaped labour forces. The employment rate in the UK in 2011Q3 is 70% and 71% in
Scotland according to ONS. Eurostat gives slightly different figures for the UK for comparison
to other EU economies. The UK and Scotland also have comparable and relatively low rates of
long term unemployment.
59 The UK and Scotland have similar highly skilled labour forces, with high levels of tertiary
education attainment. Italy, Austria and Greece have noticeably lower levels of educational
attainment at this level. This again suggests different structures in these countries labour
forces and economies.
60 One system by which underlying labour market structures will affect the macroeconomy is
through the natural rate of unemployment, or the Non-Accelerating Inflation Rate of
Unemployment (NAIRU). Depending on an economies underlying NAIRU, it can tolerate
different levels of under or over capacity in the labour market without impacting prices,
implying divergent monetary policy responses to shocks across economies with different
25Assessment of Key Currency Options
labour markets. The above evidence again suggests that labour market structure in Scotland is
closer to the UK than the EU.
Monetary Indicators
61 Chart 9 compares Taylor rule estimates for Scotland to the Euro Area and the UK. Taylor rule
estimates suggest appropriate nominal bank rates for an economy based on the rate of
inflation and the size of the output gap. The chart is presented as deviations from the Scottish
estimated Taylor rate. Smaller deviations in Taylor Rule estimates between economies suggest
a greater alignment of monetary policy. The Taylor Rule estimates assume a target rate of
inflation of 2%, an equilibrium real interest rate of 2% and an equal weighting of inflation and
output gaps for all economies.
Chart 9: Taylor rule bank rate estimates, deviation of UK and EU from Scotland
1.5%
Euro area
Percentage point deviation
1.0%
0.5%
0.0%
-0.5%
-1.0%
-1.5%
-2.0%
2000 2001 2002 2003 2004 2005 2006 2007 2008 2009 2010 2011
Source: Eurostat HCIP and GVA series plus Scottish Government Calculations
62 The chart shows that Taylor rule estimates for the Euro area deviate more from the estimated
rate for Scotland than does the UK. The average deviation for the Euro Area is 0.7 percentage
points (i.e. Taylor rule estimates suggest that interest rates in the Euro Area would be nearly 1
percentage point different to the optimal rate for Scotland). This is compared to a value of just
0.3 percentage points for the UK. This small difference may in part be expected at this level
due to statistical errors in estimating output in an economy.
63 Taylor rule estimates for a sample of Euro Area economies were also estimated based on
Eurostat data. The sample has an average range of over 4 percentage points (i.e. the nominal
26Assessment of Key Currency Options
interest rate as suggested by the Taylor rule differed by an average of 4% between the lowest
and highest estimate over the period). Even in the more stable years of 2000 – 2006, Taylor
rule estimates for Germany (average = 2.4%) and France (average = 2.7%) differ notably from
estimates for Greece (average = 0%) and Spain (average = 1%).
64 These estimates suggest less cyclical synchronisation in the Euro Area when compared to the
relatively close synchronisation of Scotland and the UK.
Factor Mobility
65 Over the longer term, a greater level of factor mobility between economies might help to lead
to a greater synchronisation of economic cycles, by allowing capital and labour to move to
regions of lower spare capacity, levelling out divergences.
66 The degree of factor mobility (both in terms of labour and capital – i.e. investment funds)
between Scotland and Europe, while increasing in recent years, is also much smaller than it is
with the UK (see charts 4.09 and 4.10 in chapter 4 of the Working Group’s Report).
67 While there have been unprecedented increases in migration both to and from Europe in
recent decades, this has been from a comparatively low base. Practical differences – some of
which may be perceived rather than real – in economic barriers (e.g. connectivity and skills)
coupled with social barriers (e.g. language) mean that there has yet to significant cross-border
flows of labour or capital between Scotland and the Euro Area.
Scottish Currency
68 Scotland is undoubtedly a sufficiently large economic area to have an independent currency.
Denmark, New Zealand, Singapore and Norway are all roughly of the same size as Scotland
and have their own currency.
69 From a macroeconomic policy perspective this would provide the maximum degree of
flexibility. The value of a Scottish currency would reflect the fundamental structure and
performance of the Scottish economy. For example, if Scotland needed a competitive
advantage then a lower exchange rate relative to competitors could boost exports and
relative productivity and create jobs.
27Assessment of Key Currency Options
70 From a microeconomic perspective there would be some challenges in the setting up of a new
currency, at least in the short-run. The period of monetary union as part of the UK means that
there are significant and complex linkages between households, businesses and financial
services companies operating across the UK. Establishing a new currency would have to
manage these linkages.
71 Just as important in determining the optimal currency for Scotland as the overall
macroeconomic environment are the preferences of the users of the currency – i.e.
households, businesses and financial enterprises.
72 In certain instances and at least for a short-period of time, it is possible that a system of dual
currency could emerge, with Sterling still used as the medium of exchange alongside the
Scottish currency. This would have benefits but also pose some challenges.
Are there any benefits/implications for macroeconomic stabilisation?
The Euro
73 As highlighted above, the Scottish economy is relatively closely aligned to the UK economy.
The degree of synchronicity with the economies of the Euro Area appears to be much less.
74 As a simple illustration, Table 6 estimated correlation coefficients between Scotland and EU
economies. These figures indicate the relative synchronisation of different economic cycles,
with a value of 1.0 indicating perfect synchronisation.
75 Countries are ranked by their correlation coefficient with Scotland. From this selection of
countries, the UK ranks top as being most synchronised with Scotland. Scotland has much
lower correlation coefficients with other large Euro Area countries such as France (0.78) and
Germany (0.59).
76 Correlation coefficients between Euro Area members have also been calculated. These range
from 0.93 between France and Italy, to 0.54 between Spain and Germany and to 0.05
between Germany and Greece.
28Assessment of Key Currency Options
Table 6: Correlation coefficients of annual output
growth rates – Scotland to UK, and selected Euro
Area countries (1996 to 2011)
Country Correlation Coefficient with Scotland
UK 0.90
Spain 0.85
Italy 0.83
France 0.78
Austria 0.73
Greece 0.69
Germany 0.59
Source: Eurostat and Scottish Government output data and Scottish
Government calculations
77 This analysis has two conclusions. Firstly, Scotland’s economic cycle is more in line with the UK
than with other large Euro Area economies. This is important, monetary policy in the Euro
Area is set with reference to conditions across the Euro Area, which would be highly
influenced by its largest economies, i.e. Germany, France and Italy. Secondly, the suitability of
monetary union between Scotland and the UK as measured by correlation coefficients scores
more highly than between many existing Euro Area members.
78 Based upon the information above, there is the possibility that, without sufficient
convergence, macroeconomic conditions in the Euro Area may not necessarily be in line with
those in the Scottish economy. Therefore the common monetary policy stance could be
unsuited to Scotland’s macroeconomic conditions. The onus on fiscal policy to iron out any
such divergences would be greater.
Scottish Currency
79 With an independent Scottish currency, the Scottish Government would be free to set a
monetary and exchange rate regime that best suited the characteristics of the Scottish
economy.
80 This would provide the greatest freedom to set macroeconomic policy with respect to the
specific conditions in the Scottish economy.
29Assessment of Key Currency Options
81 However, a flexible exchange rate is also open to greater fluctuations from volatility in
international capital markets and decisions taken to buy and/or sell currency. These can often
reflect sentiment in the wider market, and not just developments in the Scottish economy.
Some of stability – e.g. a ‘managed exchange rate’ – may be beneficial.
82 Overall, and as highlighted in Box 3, the economic cycles between Scotland and the rest of the
UK have historically been relatively similar. If this was to continue in the future, the specific
advantages of having a distinctly different macroeconomic stabilisation policy may not be that
significant. It would however be there as an option, if needed.
83 In addition, even if there was to be a degree of asymmetry, some countries – particularly
those that operate alongside larger monetary areas – have found it advantageous to maintain
a degree of coordination to guard against sudden changes in cross-border capital flows.
84 At the same time, the economic impact of changes in the value of exchange rates may not
necessarily conform to initial expectations. For example, while a devaluation might make
Scottish exports more competitive, it would also increase import prices and have implications
for capital flows. Given the openness of the Scottish economy this may undermine any boost
in competitiveness. Equally, an appreciation would make imports cheaper but exports less
competitive. This suggests careful management would be needed.
85 Finally, an independent currency would require the establishment of a clear strategy to
manage Scotland’s oil and gas sector to ensure that fluctuations in commodity prices did not
spill-over into the wider economy. There is a question as to how much changes in oil and gas
prices would influence the day-to-day value of a Scottish currency given that output from the
sector is typically traded internationally in dollars. Norway has used a variety of techniques to
attempt to insulate its onshore economy and exchange rate from commodity price
fluctuations, including the use of an Oil Fund.
30Assessment of Key Currency Options
What are the potential implications for trade and investment?
The Euro
86 By implication, Scotland would operate with the Euro instead of a pound exchange rate.
Collectively the EU is Scotland’s largest international trading partner, accounting for around
45% of international exports in 2010 (around 15% of all Scottish exports)26.
87 A Euro currency would therefore lead to greater money-changing costs for a larger share of
Scotland’s trade than is currently the case, or would be the case if Scotland retained Sterling
post-independence. Against this, there would be reduced costs in relation to trade with Euro
Area countries.
88 The Euro has fluctuated with the pound since its launch, from a high of around €1.70 to the
pound at the launch of the Euro currency in 2000 to a low of close to €1.00 to the pound
during the recession. In time, trade relationships may change and Scotland may become more
integrated with Europe.
Scottish Currency
89 An independent Scottish currency could – if valued more competitively than Sterling – offer a
significant advantage to Scottish firms. This would make their goods more attractive in key
markets (though would also increase their own import costs) both at home and outside
Scotland.
90 Aside from the potential value of a Scottish currency however, using an independent currency
would require more money-changing than either the continuation of Sterling or the adoption
of the Euro.
91 Exchange rate risk and transaction costs in currency conversion could then be factored into
trade transactions with trading partners (including transactions with the rest of the UK). This
could be mitigated to some extent by the establishment of a stable and credible exchange
rate with key partners.
26
Global Connections Survey 2011
31Assessment of Key Currency Options
92 Many larger enterprises already have functions in place to account for cross-border
transactions and exchange rate risks. However companies who do not currently rely on
international imports and exports for their business, would have to account for these in trade
with other parts of the UK.
93 Overall therefore, in this regard, it is likely to be an advantage to try to establish some degree
of relative stability in any Scottish/rUK exchange rate.
How significant are any short-term transition costs?
94 Moving to any new currency would involve transitional arrangements. Switching requires one-
time costs of reprinting price tags, and of re-denominating financial accounts. A transition
period may involve businesses pricing in two different currencies for a time.
95 Moreover, a change in currency regime may carry a degree of short-term adjustment until the
new regime established credibility. A key task will be to ensure that this did not have a
negative impact. A stable trading relationship with the UK would also to be in the interests of
the UK economy and joint action to manage any short-term uncertainty is likely to be
attractive to both governments (and central banks).
The Euro
96 The transition costs of moving to the Euro could draw on the procedures and experiences of
other countries in the Euro Area.
97 Short-term exchange rate risk is likely to be relatively limited as any accession of Scotland to
the Eurozone is unlikely to have a significant impact on the value of the Euro, and this would
provide stability. There is of course the potential for on-going fluctuations between the Euro
and Sterling.
98 As highlighted above, under existing Treaty arrangements, a formal requirement to joining the
Euro is to be within the Exchange Rate Mechanism II for at least two years. Therefore, short of
special dispensation, joining the Euro would require the establishment of a Scottish currency
that demonstrated stability with the Euro for a period of time.
32You can also read


