REDUCING PUBLIC DEBT WHEN GROWTH IS SLOW
←
→
Page content transcription
If your browser does not render page correctly, please read the page content below
4
REDUCING PUBLIC DEBT WHEN GROWTH IS SLOW
S. Ali Abbas, Bernardin Akitoby, Jochen Andritzky, Helge Berger,
Takuji Komatsuzaki, and Justin Tyson
SDN/13/x
Growth and Fiscal Consolidation Are Driving Debt
Dealing with high public debt is never easy, but the current environment poses new challenges
for many advanced economies.1 Sovereign debt is approaching historical highs, largely reflecting
the work of automatic stabilizers, countercyclical fiscal policy, and financial sector bail-outs. In
past episodes of debt reversals, output growth and fiscal adjustment were the main drivers.
However, a weak medium-term growth outlook complicates the task of putting debt back on a
clearly declining path. Thus, the burden of adjustment is shifted further on to fiscal policy at a
time when fiscal accounts are already under pressure from underlying structural changes such as
continued population aging and rising health care spending. And although front-loaded
consolidations can have positive credibility effects and ease the pain of fiscal adjustment through
lower risk premiums, they are unlikely to fully offset the short-term adverse impact on economic
activity, especially in those countries in which interest rates are already low, financial
fragmentation has kept lending rates elevated, or both.
Adding to the challenge is the fact that the public sector is not alone in its need to deal with high
levels of debt. The previous two chapters highlighted the similar challenges of debt reductions
and balance sheet repair that private households (Chapter 2) and corporates (Chapter 3) face. In
a situation in which virtually all participants in an economy have to reduce spending and increase
saving, the impact on economic activity is even more severe, further complicating the need for
deleveraging.
Yet, some of the most successful historical public debt reversals have started under adverse
circumstances and provide encouraging examples for the task ahead.2 Many periods of large and
The authors would like to thank Ariel Binder, Vizhdan Boranova, and Thomas Dowling for excellent research
assistance. The chapter is based on Abbas and others (2013).
1
The terms public debt, sovereign debt, and debt are used interchangeably in this chapter, but all refer to the
same concept: gross general government debt recorded at face value, as a share of GDP. For countries for which
data on general government debt were not available, central government debt data were used instead.
2
This is also broadly the conclusion of other papers on this topic. See, for example, IMF (2012b, Chapter 3).REDUCING PUBLIC DEBT WHEN GROWTH IS SLOW lasting debt reductions started in times of high debt, high interest rates, and low initial rates of growth. Ultimately, supportive external demand and monetary policy helped economic growth and offset the contractionary impact of initial large fiscal adjustments, and typically, reductions in debt-to-GDP ratios have coincided with pick-ups in growth. Because the growth environment is more challenging in the current context, and given that other options for reducing debt are unlikely to provide much support,3 debt reductions will require an even more sustained commitment to fiscal consolidation and careful design. The cost to growth could be sizable in the short term and may initially increase the debt ratio because of fiscal multiplier effects. A gradual pace of fiscal adjustment will be credible only if embedded in a medium-term fiscal consolidation strategy buttressed by strong budget institutions. Other growth-enhancing measures, such as structural reforms, will be important to improving growth potential in the medium term and to helping reduce the debt ratio durably. Where fiscal accounts are weaker and sovereign interest rates are higher, the pace of adjustment will have to be more ambitious. The chapter proceeds in five parts. The next section discusses the scale of the problem, which is unprecedented, at least in peacetime. The subsequent section focuses on the economics of debt reversals using several methodologies to decompose changes in debt-to-GDP ratios and explore tradeoffs. The third section analyzes large debt reversals from the past. The fourth section discusses policy alternatives for supporting fiscal adjustment processes, and the final section concludes. Public Debt in Advanced Economies: The Scale of the Problem Sovereign debt in many advanced economies is approaching historical highs.4 The median debt- to-GDP ratio in advanced economies rose from about 45 percent at the start of the crisis to about 74 percent by the end of 2012—a level not seen since the years just after World War II (Figure 4.1).5 The debt-to-GDP ratio at mid-2013 is about 90 percent or higher for many Group of Seven economies and a number of euro area economies (Table 4.1). Debt ratios in these countries are forecast to peak in 2013–14 at levels some 40 percent of GDP higher than their precrisis levels. 3 The options of privatization and asset sales remain challenging, particularly because the growth outlook is weak and many assets are held by local authorities. Other options, such as reducing debt through higher inflation, may be unavailable and, in any case, would come with their own significant risks. 4 The sample includes 30 advanced economies (see Appendix 4A) and 3 euro area economies not in the advanced economies sample (Cyprus, Luxembourg, and Malta). 5 GDP-weighted averages are higher, increasing from about 60 percent at the start of the crisis to about 100 percent of GDP (IMF, 2013a). 2 INTERNATIONAL MONETARY FUND
REDUCING PUBLIC DEBT WHEN GROWTH IS SLOW

                Figure 4.1. Developments in Gross Debt and Structural Balance in
                                     Advanced Economies
               The Great Recession triggered an                               Af ter worsening during the crisis,
             increase in debt not seen since af ter                        structural balances started to recover.
                         World War II.
   120                                                            0
         Gross Debt-to-GDP Ratio and Real GDP Growth                   Structural Balance
         (Percent)                                           8         (Percent of GDP)

   100                                                            -1
                                                             6

    80                                                       4    -2

                                                             2
    60                                                            -3

                                                             0

    40                                                            -4

                                                             -2

                                                                              All advanced economies
    20          GDP growth, 30 advanced economies (right          -5
                scale)
                GDP growth, euro area (right scale)          -4               Euro area
                Debt-to-GDP ratio, 30 advanced economies
                (left scale)
                Debt-to-GDP ratio, euro area (left scale)

     0                                                       -6   -6
      1945    1955   1965    1975    1985     1995    2005          2000    2002    2004    2006       2008   2010   2012

         Sources: IMF, Historical Public Debt Database; IMF, Fiscal Monitor; IMF, World Economic Outlook,
         and IMF staf f calculations.

The debt surge reflects the direct effect of the recession as well as other factors. The collapse in
revenues caused by the Great Recession has been a key driver of the debt buildups. But other
factors also played an important role, including the fiscal stimulus carried out in response to the
crisis and financial sector support (e.g., in Iceland and Ireland). Overall, structural balances in
advanced economies worsened by about 4 percent of GDP on average before recovering (Figure
4.1, right panel).

High and increasing levels of public debt can lead to higher interest rates and slower growth.
Although the idea of precise “debt thresholds” remains under discussion, many studies find that
high debt levels have a negative effect on growth (IMF, 2013a). High debt also makes public
finances more vulnerable to future shocks, both by constraining the ability of governments to
engage in countercyclical policies and by increasing the primary surplus needed to stabilize the

                                                                             INTERNATIONAL MONETARY FUND               3
REDUCING PUBLIC DEBT WHEN GROWTH IS SLOW
Table 4.1. Main Macroeconomic Indicators for Selected Advanced Economies
(Percent unless otherwise indicated)
2012 2013—18 Average Forecast
Debt Real Marginal Inflation Real Average Real Growth r−g
(percent Interest Rate Rate Interest Rate Rate (g)
of GDP) (r)
Selected euro area
France 90 0.6 1.6 0.6 1.3 −0.7
Germany 82 −0.5 1.7 1.5 1.1 0.4
Ireland 118 4.1 1.6 2.7 2.3 0.3
Italy 127 2.2 1.4 2.9 0.7 2.2
Portugal 124 7.8 1.3 2.1 0.9 1.2
Spain 84 3.4 1.2 2.8 0.2 2.6
Non-euro area G7
Canada 86 0.4 1.9 1.9 2.3 −0.4
Japan 238 0.9 1.8 0.4 1.3 −0.9
United Kingdom 90 −0.2 2.1 1.5 1.7 −0.2
United States 106 −0.3 2.0 1.1 3.0 −1.8
Sources: IMF, World Economic Outlook database (July 2013); and IMF staff calculations.
Note: G7 = Group of Seven.
debt ratio following an adverse shock to growth or interest rates. Indeed, when debt is high,
there is a risk of falling into a bad equilibrium caused by self-fulfilling expectations. The looming
surge of age-related spending will complicate the task for countries that have to bring down
high debt (IMF, 2013).
Even more important is the diminished outlook for growth. The household, corporate, and
financial sector deleveraging that followed the financial crisis has dampened the medium-term
growth outlook.6 Based on World Economic Outlook projections (IMF, 2013b), average output
growth in advanced economies will be about 2 percent during 2013–18, significantly below the
3.3 percent growth that the same economies recorded during 1980–2007. Lower growth means
not only higher structural deficits as tax revenue weakens and spending plans struggle to adjust
to the low-growth environment; it also affects the debt ratio through the denominator (see the
next section).
6
As mentioned, the previous chapters focus in more detail on deleveraging needs in the household (Chapter 2)
and the corporate (Chapter 3) sectors.
4 INTERNATIONAL MONETARY FUNDREDUCING PUBLIC DEBT WHEN GROWTH IS SLOW
The combination of low growth and high interest rates makes debt reversal particularly
challenging for some high-debt countries. When interest rates are high, financing debt becomes
more expensive, complicating efforts to reduce debt. The financial crisis has led to sharply higher
interest rates for countries with low growth rates facing market pressures (e.g., in the euro area
periphery). In other countries perceived as “safe havens,” interest rates have fallen and growth
rates have been less weak (Table 4.1). Given the uncertainty surrounding both groups of
countries, it is not easy to predict the future path of the interest rate–growth differential, which is
what influences debt dynamics.
The Economics of Debt Reversals
First Cut: What Drives the Debt Ratio?
A first look suggests that the primary fiscal balance plays an important role in the debt ratio.
Based on a sample of four-year rolling changes in the debt ratios of 27 advanced economies
between 1980 and 2011, debt-reduction spells were more frequent during periods with higher
primary balances (that is, the fiscal balance excluding interest payments).7 Similarly, debt
increases are more frequent when primary balances are below average. Figure 4.2 (top left panel)
shows four-year changes in the debt-to-GDP ratio conditioned on whether the cumulative
primary balance for the period is above (high) or below (low) the country-specific median.
Growth appears to be the other key factor. The historical record confirms that a decline in the
debt ratio is more likely when real GDP growth is high. Figure 4.2 (top right panel) shows four-
year changes in the debt-to-GDP ratio conditioned on whether growth during the four years is
above (high) or below (low) the country-specific median. Other factors, such as inflation, interest
rates, and stock-flow adjustments (SFAs),8 also affect debt dynamics. However, their impact on
the distribution of changes in debt ratios is less clear cut than for fiscal effort and output growth
(Figure 4.2, bottom panels).
A decomposition of debt-reduction spells using standard debt dynamics seems to confirm these
impressions.9 For all debt-reduction episodes, the combined growth effect (i.e., the sum of the
impact of real GDP growth and automatic stabilizers) reduced the debt ratio by 2 percent of GDP
7
The sample includes the 30 advanced economies listed in Appendix Table 4A.1, excluding Israel (because of
hyperinflation in the 1980s), and Norway and Singapore (because of their particular net asset positions).
8
SFAs reflect the difference between the annual change in gross debt and the budget deficit. They can arise for
different reasons, including valuation changes and other transactions that affect debt but not the deficit (such as
the privatization or realization of contingent liabilities) (Baum, Poplawski-Ribeiro, and Weber, 2012).
9
Debt-reduction spells are defined as at least four years of declining debt ratios, allowing for one exception year.
For example, a period of four years that combines three years of debt reduction with one year when the debt
ratio increases up to 2 percentage points will be included in the sample.
INTERNATIONAL MONETARY FUND 5REDUCING PUBLIC DEBT WHEN GROWTH IS SLOW
Figure 4.2. Density of Debt Changes Conditional on Macroeconomic Variables
Debt declines are associated with higher primary
balances... ... and higher growth.
25 25
Low four-year primary
balance
Low growth
20 High four-year primary
20
balance
High growth
15 15
Frequency
Frequency
10 10
5 5
0 0
-40 -30 -20 -10 0 10 20 30 40 50 60 70 -40 -30 -20 -10 0 10 20 30 40 50 60 70
Four-year debt ratio change Four-year debt ratio change
(percent of GDP) (percent of GDP)
Debt dynamics do not dif fer visibly whether inf lation
is low or high... ...or whether the real interest rate is low or high.
25 25
Low inflation Low real interest rate
20 20
High inflation High real interest rate
15 15
Frequency
Frequency
10 10
5 5
0 0
-40 -30 -20 -10 0 10 20 30 40 50 60 70 -40 -30 -20 -10 0 10 20 30 40 50 60 70
Four-year debt ratio change Four-year debt ratio change
(percent of GDP) (percent of GDP)
Sources: IMF, World Economic Outlook; and IMF staf f calculations.
Note: Each panel shows two densities of debt ratio changes where primary balances, growth rates, rates of
inf lation, and real interest rates are below (low) or above (high) the country median.
6 INTERNATIONAL MONETARY FUNDREDUCING PUBLIC DEBT WHEN GROWTH IS SLOW
0
Mean
-1 -2.3
-3.1 ppt
ppt
-2
+0.9
-3 ppt
-2.0
-4 ppt
-5 +3.4
ppt
Inter- -1.6
-6 ppt
quartile
range
-7
-8
Structural Growth Inflation Interest Stock-flow Total
primary expenditure adjustment
balance
Sources: IMF World Economic Outlook; and IMF staff calculations.
annually. By contrast, the structural primary balance contributed to a debt reduction of 3.1
percent of GDP per year. The interest rate bill is another relevant factor: interest expenditure
added more than 3 percentage points of GDP annually to the debt stock, on average (Figure 4.3).
SFAs and the net impact of inflation played much smaller roles. SFAs were a relatively small factor
during debt-reduction spells, increasing the debt ratio by about 1 percentage point, on average.
This low impact also holds for inflation, which can lower the debt ratio through higher nominal
GDP and tax revenues and by compressing the real interest rate, but which played a small role
empirically.10
On average, debt reductions tend to be larger when growth rates are high and interest rates are
low. Whereas the average annual reduction in debt is 3.4 percent of GDP when growth is high
and interest rates are low, it is only 1.7 and 2.4 percent of GDP, respectively, when growth is
lower or interest rates are higher (Figure 4.4). Fewer debt reversals occurred in a challenging
10
Figure 4.3 separates out the impact of inflation on the denominator in the debt ratio (i.e., disentangles nominal
GDP growth). However, inflation still affects the numerator through nominal interest expenditure, but in the
opposite direction. The net impact on the debt ratio is consequently smaller than implied by Figure 4.3, as
evidenced by Figure 4.2.
INTERNATIONAL MONETARY FUND 7REDUCING PUBLIC DEBT WHEN GROWTH IS SLOW
Figure 4.4. Debt Ratio Changes Conditional on Growth and Interest Rates
High Growth Moderate Growth
0 0
1.0 ppt
-3.3 ppt 2.4 ppt
High Real Interest Rate
-2 -2 -3.7 ppt
-4 -1.2 ppt -4
4.1 ppt
percent of GDP
percent of GDP
8.1 ppt
-1.4 ppt -3.4 ppt
-6 -6
0.4 ppt
-8 -8
Percent of all observations -4.9 ppt
-10 -10
28% 7% 3.2 ppt
-12 -12
0 0
1.7 ppt
-2 -3.4 ppt -2 -2.9 ppt
3.4 ppt
Low Real Interest Rate
3.1 ppt
-4 -4 -1.7 ppt
-2.5 ppt
3.4 ppt
percent of GDP
percent of GDP
-1.3 ppt 1.1 ppt
-6 -6
-1.5 ppt 0.9 ppt
-8 -8
-10 -10
34% 31%
-12 -12
Structural Growth Inflation Stock flow Interest Debt ratio Structural Growth Inflation Stock flow Interest Debt ratio
primary adjustment expenditure change primary adjustment expenditure change
balance balance
Sources: IMF, World Economic Outlook; and IMF staff calculations.
Note: ppt = percentage points. Numbers in ovals indicate proportion of all debt reduction spells that
had each combination of growth and interest rates.
environment of moderate growth and high interest rates (7 percent of 127 debt-reduction
spells), and the declines were more gradual (1 percent of GDP per year). Periods of high growth
are defined as four years of growth greater than 2 percent (allowing for one exceptional year),
which is the average projected growth rate for advanced economies from 2013 to 2018;
moderate growth is defined as between 0 and 2 percent.
Indeed, fiscal effort is more likely to be successful when growth is stronger. Only 26 percent of all
fiscal consolidation spells—defined as a large adjustment in the cyclically adjusted primary
balance (CAPB)11—were successful in reducing debt levels when growth was below median.
When growth was above median, the success rate increased to 41 percent. Here, success is
defined as at least a one-year overlap between a consolidation spell and a debt-reduction spell—
significant consolidation may eventually lead to a fall in debt, even if there are spells within the
consolidation period in which a decline in debt ratios did not occur. There were also fewer
11
As in Abbas and others (2010), consolidation spells are identified by a cumulative improvement in the CAPB of
more than 5 percent of GDP, for episodes lasting at least three years. In a given episode, the CAPB should not be
reversed by more than 1 percentage point from one year to the next.
8 INTERNATIONAL MONETARY FUNDREDUCING PUBLIC DEBT WHEN GROWTH IS SLOW
Figure 4.5 Economic Determinants of the Debt Ratio
attempts to consolidate when growth was below the median—only about one-third of
consolidations took place when growth was below the median.12 This result suggests that the
association of higher growth with larger debt reductions, given CAPB improvements described
above, goes beyond the simple denominator effect.
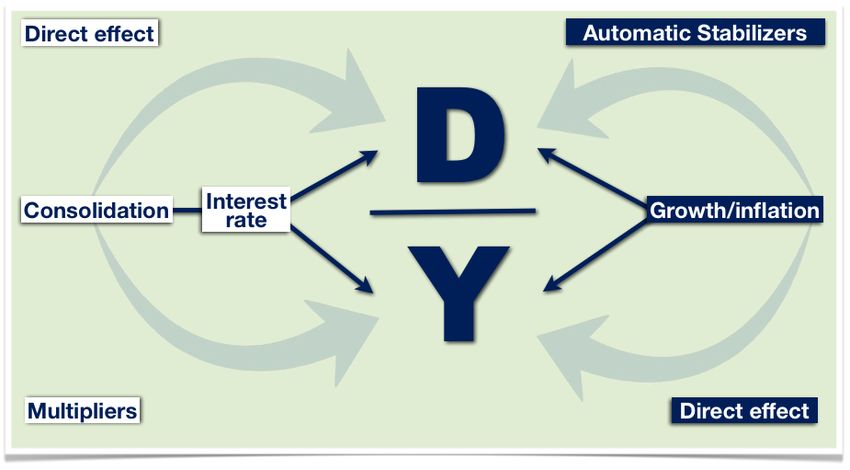
The Mechanics: Growth, Fiscal Policy, and Interest Rates
Fiscal consolidation and growth are critical to improving the debt ratio, but economic conditions
and fiscal policy interact in complex ways. Changes in the debt-to-GDP ratio can be decomposed
into three contributing factors: (1) the interest rate–GDP growth rate differential, (2) the primary
balance, and (3) SFAs. These three factors all interact with each other (Figure 4.5).
Fiscal consolidation improves the primary balance, which directly reduces the amount of
funds the government has to borrow, and hence the level of debt.
12
Similar findings hold when, instead of relying on CAPB changes, consolidation episodes are identified by policy
intentions. Abbas and others (2013) provide more detail using the Devries and others (2011) action-based data
set of fiscal consolidation.
INTERNATIONAL MONETARY FUND 9REDUCING PUBLIC DEBT WHEN GROWTH IS SLOW
However, lower government spending and higher taxes tend to have a negative effect on
growth (the fiscal multiplier), which could increase the debt-to-GDP ratio in the short term.13
Any change in GDP will, in turn, affect the fiscal deficit through automatic stabilizers, thus
eroding some of the fiscal effort.14 Together with the fiscal multiplier effects, this erosion
means that fiscal consolidation may worsen the debt-to-GDP ratio in the short term, if the
starting debt levels and fiscal multipliers are high (Eyraud and Weber, 2013).
As the health of public finances improves, interest rates can drop (e.g., Giavazzi and Pagano,
1996; Alesina and Perotti, 1995; Alesina and Ardagna, 2010), further improving the budget
balance.15 Lower interest rates can also affect the economy: if low rates encourage investors
and consumers to spend more, GDP will rise and the debt-to-GDP ratio will fall.
Illustrative examples further show the importance of these factors for debt reversals. The
underlying model (Abbas and others, 2013) assumes that GDP evolves in line with long-term
potential growth, abstracting from cyclical forces. Relative to a baseline calibrated according to
euro area averages (at end-2012), the speed of any debt reversal resulting from fiscal
consolidation increases considerably if growth is more buoyant, interest rates are lower, or both
(Figure 4.6).
Fiscal policy and growth also interact in the long term. In certain circumstances, discretionary
policy changes can affect long-term potential growth. For example, DeLong and Summers (2012)
argue that a process of hysteresis links the short-term cycle to the long-term trend, implying
more persistent fiscal policy effects. Such declines in potential growth, in turn, can lead to an
unwanted deterioration in the structural balance despite the apparent absence of discretionary
policy (Mauro and others, 2013).
Tradeoffs
Faster fiscal adjustment comes with tradeoffs. Front-loading a fiscal consolidation to achieve a
given debt reversal within a certain time will have a larger up-front growth cost than would a
13
The size of these effects also depends on various factors. Spilimbergo, Symansky, and Schindler (2009) describe
how accommodative monetary policy can increase the multiplier during fiscal expansions, while IMF (2010) and
Woodford (2011) show how a policy rate close to the zero lower bound can worsen the economic impact of fiscal
consolidation. Batini, Callegari, and Melina (2012) and Blanchard and Leigh (2013) highlight the finding that
multipliers can be higher in recessions.
14
When growth is accompanied by asset price booms, it can improve both headline and structural balances,
complicating the assessment of both fiscal space and stance.
15
If risk premiums respond to debt levels, the effect of consolidation is more ambiguous because a short-term
increase in the debt ratio could further exacerbate debt levels through higher yields (Batini, Callegari, and Melina,
2012).
10 INTERNATIONAL MONETARY FUNDREDUCING PUBLIC DEBT WHEN GROWTH IS SLOW
Figure 4.6. Factors Driving Debt Reversals
120
110
100
Debt-to-GDP ratio
90
80
70
60 Baseline
with fiscal effort
50 with fiscal effort and higher growth
with fiscal effort, higher growth and lower interest rate
40
t-1 t t+1 t+2 t+3 t+4 t+5 t+6 t+7 t+8 t+9 t+10
Assumptions:
Baseline real growth: 1.2 percent (excluding drag from risk premium). Underlying interest rate: 2 percent.
Starting debt-to-GDP ratio: 90 percent. Maturity (average): 7 years.
Fiscal multiplier: 1 and persists for 4 years. Credibility ef fect: 15 basis points
per 1 percent of GDP adjustment.
The structural primary balance is adjusted by 2 percent of GDP in year t and 1 percent more in year t+1.
Higher growth and lower interest scenarios respectively increase and decrease baseline rates by 1
percentage point.
more gradual approach, because of the multiplier effect. However, the gradual approach requires
higher levels of the primary balance later in the period to compensate for the delayed
improvement in primary flows (Figure 4.7).16 State-dependent multipliers in downturns
exacerbate the economic cost of the up-front strategy, if the up-front adjustment were to tip the
economy into a recession, whereas potential interest bill gains from credibility effects would
16
Under the assumption of a constant multiplier, the cumulative output loss is the same in either scenario. When
multipliers are state dependent (higher in deep recessions), the output loss from up-front consolidation would be
larger. The framework is reasonably robust to variations in key parameters. For example, allowing the fiscal
multiplier to vary within a plausible range of 0.2 to 1.5—a range capturing the vast majority of recent research on
advanced economies (Mineshima, Poplawski-Ribeiro, and Weber, forthcoming)—does not significantly alter the
main findings.
INTERNATIONAL MONETARY FUND 11REDUCING PUBLIC DEBT WHEN GROWTH IS SLOW
Figure 4.7. Growth and Primary Balance Paths for Achieving a Given Debt Reduction
Up-f ront adjustment requires a lower primary ...but with more pronounced short-term costs
balance... (especially if multipliers are state dependent).
6
Primary Balances 1
Deviations from Baseline Output Levels
(Percent of GDP) (Percent)
5 0
-1
4
-2
3
-3
2 -4
-5
1
-6
0 Gradual
Gradual
-7
Up-front Up-front
-1
-8
Up-front (state-dependent Up-front (state-dependent
multiplier) multiplier)
-2 -9
t-1 t t+1 t+2 t+3 t+4 t+5 t+6 t+7 t+8 t+9 t+10 t-1 t t+1 t+2 t+3 t+4 t+5 t+6 t+7 t+8 t+9 t+10
Assumptions:
Baseline real growth: 1.2 percent (excluding drag from risk premium). Underlying interest rate: 2 percent.
Starting debt -to-GDP ratio: 90 percent. Maturity (average): 7 years.
Fiscal multiplier (regular) : 1 and persists for 4 years. Credibility effect: 15 basis points per 1 percent of GDP
Fiscal multiplier (state-dependent): 1.5, peaks in t+1 and persists for 5 years. adjustment.
The structural primary balance is adjusted to meet a 60 percent of GDP target by year t+10 under two strategies:
gradual adjustment over five years (total adjustment needed is 6 percent of GDP) or up-front adjustment (total adjustment needed is 4.8
percent of GDP with regular multiplier and 5.3 percent of GDP with state-dependent multiplier).
lower the needed level of the primary balance. This suggests that short-term pain now must be
weighed against the economic and political difficulties of generating higher overall primary
surpluses for a prolonged period.17
Another tradeoff centers on the multiplier effect and credibility. Although fiscal consolidation
comes at the cost of initially lower economic activity, it can help reduce sovereign risk premiums.
In general, the balance will depend on the urgency of restoring market credibility, as well as on
17
See Zeng (forthcoming) for a discussion of the difficulties in sustaining a high primary surplus.
12 INTERNATIONAL MONETARY FUNDREDUCING PUBLIC DEBT WHEN GROWTH IS SLOW
Figure 4.8. Debt Reversals with Credibility Effects
Credibility ef f ects drive higher growth... ... and f aster debt reduction.
4 170
Deviations from Baseline Output Debt
(Percent) (Percent of GDP)
3 160
2 150
Multiplier effect
1 140
0 130
-1 120
Baseline
With fiscal effort
With fiscal effort
-2 110
With credibility
With credibility
-3 100
t-1 t t+1 t+2 t+3 t+4 t+5 t+6 t+7 t+8 t+9 t+10 t-1 t t+1 t+2 t+3 t+4 t+5 t+6 t+7 t+8 t+9 t+10
Assumptions:
Baseline real growth: 1.2 percent (excl.drag from risk premium). Underlying interest rate: 2 percent.
Starting debt-to-GDP ratio: 130 percent (closer to D_max of 170). Maturity (average): 7 years.
Fiscal multiplier: 1 and persists for 4 years. Credibility effect: 30 bps per 1 percent of GDP adjustment.
Baseline primary balance: -1.
The structural primary balance is adjusted by 2 percent of GDP in year t and another 1 percent of GDP in year t+1.
factors such as the size of the output gap, openness, and the simultaneity of the fiscal effort
elsewhere (aggregate multipliers are larger for synchronized consolidations because of the
weaker offset from external demand). In some cases, excessive front-loading, by undermining
social and political cohesion, might hurt rather than help market confidence.
Both the multiplier effect and the credibility effect have important implications for debt
dynamics. To illustrate the underlying mechanics, Figure 4.8 shows a modified baseline scenario
in which debt dynamics include a stronger risk premium effect from reductions in the debt level
given that the starting level of the debt ratio is higher.18 A fiscal consolidation over two years
pushes up the debt ratio because of the multiplier effect, before leading to a gradual reduction
in debt levels. The risk premium linked to the degree of fiscal effort is made stronger, which
18
Batini, Callegari, and Melina (2012) show that up-front consolidation can worsen the debt level relative to a
gradual effort and that this effect is exacerbated if risk premiums are linked to the debt level. In their simulation,
multipliers vary according to the cycle.
INTERNATIONAL MONETARY FUND 13REDUCING PUBLIC DEBT WHEN GROWTH IS SLOW
generates a larger credibility effect that helps bring down debt more rapidly.19 The credibility
effect assists debt reduction through two channels: lowering the interest bill of the sovereign
(direct effect) and stimulating economic activity by also lowering private sector borrowing costs
(indirect effect through lower output losses) (Figure 4.8).
Large Debt Reversals in the Past
Some of the largest debt reversals among advanced economies since 1980 started in difficult
economic conditions. The stylized facts and simulation results in the previous sections caution
that debt reversals in times of low growth can be difficult but not impossible—a fact also
reflected in the past episodes discussed below.
Since 1980, 26 large debt-reduction episodes of varying lengths occurred in 20 advanced
economies (Figure 4.9, and Appendix 4B). In each of these episodes, the debt-to-GDP ratio
declined by more than 5 percentage points, from debt levels of more than 50 percent of GDP.
Notable characteristics include the following:
Historical background. The majority of the episodes started in the 1990s, reflecting, among
other things, growth-supported consolidations in the Anglo-Saxon economies (Ireland, New
Zealand, the United Kingdom, and the United States), targeted improvements to public
finances in Europe in the run-up to the introduction of the euro, and the large adjustments
following the Nordic financial crises of the early 1990s.
Size. The average reduction in debt across these episodes was 26 percent of GDP, from an
average starting point (79 percent of GDP) similar to current levels. Out of the 26 episodes,
22 resulted in debt reductions of at least 11 percent of GDP.
Duration and speed. The average episode spanned eight years, with the shortest one being
New Zealand’s in 1986–88, which coincided with double-digit inflation. The longest running
one was Ireland’s in 1987–2007, where growth averaged 5.7 percent. The average pace of
debt reduction was about 3 percentage points of GDP per year.
Not surprisingly, growth conditions and fiscal consolidation were the main drivers behind these
large debt reversals. Figure 4.9 shows the major debt-reduction components for the 26 episodes.
Although the debt reductions vary by duration (ranging from 3 to 20 years), by size (from 6 to
84 percent of GDP), and by type of economy (large, small, European, and other advanced), the
19
Conceptually, the fiscal effort can have a larger impact if the risk premium reacts to the fiscal balance. Linking
the risk premium to the expected primary deficit (Corsetti and others, 2012), we find that up-front fiscal
consolidation is less detrimental to economic activity, and in cases of severe fiscal stress and constrained
monetary policy it may even be expansionary.
14 INTERNATIONAL MONETARY FUNDREDUCING PUBLIC DEBT WHEN GROWTH IS SLOW
Figure 4.9. Components of Major Debt Reductions in Advanced Economies Since 1980
(percent of GDP)
160 160
Stock-flow residual A positive value
Real interest rate indicates a debt
120 reduction 120
Cyclical growth (including cyclical primary balance)
Potential growth
80 Structural primary balance 80
Debt reduction
40 Growth-interest differential 40
0 0
-40 -40
-80 -80
GRC 2000–03 (3)
NZL 1992–07 (15)
BEL 1993–07 (14)
AVG (8)
JPN 1984–91 (7)
NZL 1986–88 (2)
SWE 1985–90 (5)
SWE 1996–08 (12)
CAN 1996–07 (11)
DNK 1993–07 (14)
DNK 1985–89 (4)
ITA 1994–03 (9)
CHE 2005–11 (6)
GBR 1986–91 (5)
GBR 1996–01 (5)
FIN 1994–02 (8)
AUT 2001–07 (6)
NLD 2004–07 (3)
PRT 1995–00 (5)
NLD 1993–01 (8)
ESP 1996–07 (11)
ISR 1989–00 (11)
IRE 1987–07 (20)
USA 1993–00 (7)
ISR 2004–08 (4)
CYP 2004–08 (4)
ISL 1995–05 (10)
Sources: IMF, World Economic Outlook; and IMF staf f calculations.
* Total contribution of components over entire debt reduction period (length of period in years on
parentheses).
broad pattern is captured by the average bar on the extreme right of the figure. The average
contribution of the structural primary balance was about equal to the total size of debt reduction.
The typical growth–interest rate differential was close to zero (Appendix 4B). The data suggest
that high structural primary surpluses occurred during periods of both high and low growth. In
fact, to the extent that any correlation is visible, it seems that countries generate higher primary
surpluses when the economic environment is weaker, perhaps to compensate for low growth
(Figure 4.10). However, average growth fell below 2 percent in only 3 of the 26 episodes, which
cautions that budget surpluses might have occurred mostly beyond a minimum level of growth.20
Some of the largest debt reductions were achieved when initial conditions were particularly
difficult (Figure 4.11).21 During the period 1989–2007, seven advanced economies (Austria,
20
Other than the identified debt-reduction periods, growth remained below the 2 percent threshold in 25
percent of the years since 1980, as compared with 19 percent during debt-reduction episodes.
21
“Initial conditions” refers to the year in which the debt-to-GDP ratio peaked.
INTERNATIONAL MONETARY FUND 15REDUCING PUBLIC DEBT WHEN GROWTH IS SLOW
Figure 4.10 Real GDP Growth, Structure of Primary Balance, and Size of Initial
Debt (Advanced Economies since 1980)
10
9
8
Structural primary balance (percent)
7 100 percent of GDP
6
5
4
3
2
1
0
-1
0 1 2 3 4 5 6 7
Real GDP growth (percent)
Source: IMF staff calculations.
Note: Real GDP growth and primary balance data are calculated as averages observed over
the debt reduction period. Size of bubble equals debt to GDP ratios.
Belgium, Denmark, Iceland, Israel, the Netherlands, and New Zealand) managed to achieve debt
reductions averaging about 40 percent of GDP, in spite of initially high debt levels (averaging 90
percent of GDP), and zero or modest growth (averaging 0.3 percent). In another important
episode—Italy during 1994–2003—debt was reduced by 18 percentage points from 122 percent
of GDP, despite economic growth averaging a modest 0.7 percent in the three years before the
debt reduction and 1½ percent during the debt reduction. These episodes suggest that when
countries try hard, large debt reversals can be achieved even in low-growth environments.
Despite difficult initial conditions, a number of factors helped bring debt ratios down eventually.
In particular, external demand and falling interest rates provided crucial growth support as fiscal
consolidation efforts picked up (Figure 4.12):
16 INTERNATIONAL MONETARY FUNDREDUCING PUBLIC DEBT WHEN GROWTH IS SLOW
Figure 4.11. Size of Debt Reduction vs. Initial Levels of Key Variables
(Advanced economies since 1980)
Many debt reduction episodes started Higher initial debt ratio is associated
when real interest rates were elevated. with larger debt reduction.
90 90
IRL(87) IRL(87)
80 80
70 70
60 60
DNK(93) ISR(89)
Debt reduction (percent of GDP)
Debt reduction (percent of GDP)
DNK(93)
50 BEL(93) 50
NZL(92) NZL(92) BEL(93)
40 40
CAN(96) SWE(96)
ISL(95)
ISL(95) CAN(96)
ESP(96) SWE(96)
30 NDL(93) 30 ESP(96)
CHE(05) CHE(05) NDL(93)
CYP(04) SWE(85)
SWE(85)
20 FIN(94)
20 FIN(94)
CYP(04)
ISR(04)
USA(93) ISR(04) ITA(94)
USA(93) ITA(94)
NZL(86) GBR(86) NZL(86)
GBR(96) GBR(96)
DNK (85)
10 AUT(01) 10 GBR(86)
DNK (85)
PRT(95)
NDL(04) PRT(95)
JPN(84) AUT(01)
GRC(00) JPN(84)
NDL(04) GRC(00)
0
0
0 1 2 3 4 5 6 7 8 9
40 60 80 100 120 140 160
Initial real marginal interest rate (percent)
Initial debt ratio (percent of GDP)
Real GDP growth was of ten low at the Larger debt reductions are associated
outset of debt reduction episodes. with a higher initial structural primary
surplus.
90 90
IRL(87) IRL(87)
80 80
70 70
Debt reduction (percent of GDP)
60 60
Debt reduction (percent of GDP)
DNK(93) ISR(89) ISR(89) DNK(93)
50 BEL(93)
50 BEL(93)
NZL(92) NZL(92)
40 40
CAN(96) SWE(96)
SWE(96) CAN(96)
ISL(95) ISL(95)
ESP(96) 30 ESP(96)
30
NDL(93) CYP(04) NDL(93)
CHE(05) CYP(04) CHE(05)
SWE(85) SWE(85)
20 USA(93) ISR(04) 20 USA(93) ISR(04)
ITA(94) ITA(94)
NZL(86) FIN(94) FIN(94)
GBR(96) GBR(86) DNK (85)
GBR(96)
10 DNK (85) PRT(95)
GBR(86)
10 NZL(86) PRT(95)
GRC(00)
AUT(01)
NDL(04) GRC(00) NDL(04) JPN(84)
JPN(84) AUT(01)
0 0
-1 0 1 2 3 4 5 -2 -1 0 1 2 3 4 5 6 7 8 9 10
Initial real GDP growth (percent) Initial structural primary balance (percent of GDP)
Source: IMF staf f calculations.
* Year in parentheses ref ers to the start of the debt reduction period.
INTERNATIONAL MONETARY FUND 17REDUCING PUBLIC DEBT WHEN GROWTH IS SLOW
Figure 4.12. Evolution of Key Variables through Debt Reduction Episodes
(Advanced economies since 1980)
Structural primary balance strengthened... ...and real GDP growth picked up ...
7 6
Median structural primary balance Median real GDP growth
6 (25th to 75th percentile region shaded) (25th to 75th percentile region shaded)
5
5
4 4
percent
percent of GDP
3
3
2
1 2
0
1
-1
-2 0
t−5 t−4 t−3 t−2 t−1 t t+1 t+2 t+3 t+4 t+5 t−5 t−4 t−3 t−2 t−1 t t+1 t+2 t+3 t+4 t+5
...while inflation was low and continued to decline Some moderate real depreciation took place before
during debt reduction episodes. debt reduction set in...
14 6
Median inflation Median REER appreciation
12 (25th to 75th percentile region shaded) (25th to 75th percentile region shaded)
4
10
2
percent
percent
8
0
6
-2
4
2 -4
0 -6
t−5 t−4 t−3 t−2 t−1 t t+1 t+2 t+3 t+4 t+5 t−5 t−4 t−3 t−2 t−1 t t+1 t+2 t+3 t+4 t+5
...while export growth picked up quite strongly, Real long-term interest rates started to decline
supporting growth . ahead of the debt reduction episode...
20 9
Median export value growth Median real long-term interest rate
(25th to 75th percentile region shaded) 8 (25th to 75th percentile region shaded)
15 7
6
10
percent
percent
5
4
5
3
0 2
1
-5 0
t−5 t−4 t−3 t−2 t−1 t t+1 t+2 t+3 t+4 t+5 t−5 t−4 t−3 t−2 t−1 t t+1 t+2 t+3 t+4 t+5
...partly explained by an easing in monetary Consumption growth picked up in the course of the
conditions, also supporting growth. debt reduction episodes.
16 6
Median short-term treasury bill rate Median private consumption growth
14 (25th to 75th percentile region shaded) (25th to 75th percentile region shaded)
5
12
4
10
percent
percent
8 3
6 2
4
1
2
0 0
t−5 t−4 t−3 t−2 t−1 t t+1 t+2 t+3 t+4 t+5 t−5 t−4 t−3 t−2 t−1 t t+1 t+2 t+3 t+4 t+5
Source: IMF staf f calculations.
18 INTERNATIONAL MONETARY FUNDREDUCING PUBLIC DEBT WHEN GROWTH IS SLOW
External demand conditions improved in the lead-up to debt reductions. The typical episode
was characterized by gradual real exchange rate depreciation and rising exports three years
before debt ratios began to reverse (year t in Figure 4.12).22 The exchange rate stabilized as
debt began to fall, but export value growth remained about 10 percent until t+2 before
moderating.
Falling short-term rates suggest supportive monetary policy, leading to a fall in longer-term
rates starting in t−2 ahead of the drop in debt ratios. The reduction in Treasury bill rates
started as early as t−4 and continued, at a declining rate, throughout the observation period
for most episodes. Short-term rates fell from higher levels, which meant that monetary
support was unconstrained by the zero lower bound. Previous analyses, such as IMF (2012b),
have also highlighted the importance of supportive monetary policy in reducing high public
debt ratios.
The start of the typical debt-reduction episode coincided with a pick-up in growth. Real GDP
growth picked up by almost 2 percentage points in the first year of falling debt. This pick-up
followed the strengthening of the external environment and falling interest rates, and it came
with a rapid increase in domestic demand starting in t.
Fiscal effort strengthened as growth picked up. Although the structural primary balances were
positive, on average, in the years preceding the debt peak, they improved significantly in t
and continued to strengthen as debt fell.
Inflation did not contribute to the large debt reversals in the sample. In fact, inflation fell and
would have led to increasing debt ratios, all else equal.
An improving growth environment was an important feature of successful debt-reduction
experiences. The fact that growth did not decline in the year before the debt peak—a year of
relatively strong fiscal consolidation—suggests that supportive monetary policy, falling long-
term rates, and the healthy external environment likely played a part in reducing the size of the
fiscal multiplier. Moreover, the improving outlook for economic activity likely supported the
22
The averages hide larger individual exchange rate movements. In 24 of the 26 debt-reduction episodes, a
depreciation of the real effective exchange rate was observed at some point during the four years preceding the
start of the debt reduction, with the depreciation exceeding 10 percent in 16 of them. The average cumulative
depreciation of the real effective exchange rate for the 24 episodes was 13 percent, more than half of which was
reflected in nominal effective exchange rate adjustments. The nominal effective adjustments, in turn, came by
way of both abrupt changes or devaluations (such as in Finland, Ireland, Italy, Portugal, Spain, the United
Kingdom, and Sweden—the latter two corresponding to the 1992 exit from the European Exchange Rate
Mechanism) and more gradual depreciations in the context of floating exchange rates (as in Belgium, Denmark,
and the Netherlands).
INTERNATIONAL MONETARY FUND 19REDUCING PUBLIC DEBT WHEN GROWTH IS SLOW politics of the fiscal effort in that year.23 Eventually, lower borrowing costs and the rapid pick-up in real private consumption helped drive down debt ratios and also mitigated the impact of the fiscal adjustment that started in t. Structural primary balances peaked four years into debt reduction. Dealing with Debt when Growth Is Low Although the advanced economy experience suggests that debt reduction is achievable even under adverse circumstances, the current and expected growth outlook is probably more challenging than in past episodes. In the absence of growth, the burden of adjustment falls on fiscal consolidation and, given moribund credit markets, the zero lower bound on nominal interest rates, and the still sizable output gap, the expectation is for fiscal multipliers to be larger than in more normal times. What is the best combination of fiscal, monetary, and structural reform to reduce debt vulnerabilities? What are the options for fiscal policy, and could other approaches, such as inflation and privatization, provide support? Fiscal Policy If multipliers are large, getting the pace of fiscal adjustment right is critical. Fiscal consolidation can hurt growth and exacerbate debt levels in the short term; therefore, if financing allows, adjustment should be conducted at a pace that balances the need to improve structural primary balances against the need to not undermine the recovery.24 Excessive delay may also be costly because markets could lose confidence in the government’s commitment to fiscal sustainability and demand higher interest rates. Thus, for many countries with adequate financing space, the safest course of action will be gradual but sustained fiscal consolidation to achieve a certain reduction in the debt level, supported by a prolonged commitment to deliver larger primary surpluses later. However, if sovereign market access is threatened and risk premiums are approaching prohibitive levels, smoothing the required consolidation may not be feasible and establishing credibility through front-loaded adjustment might be needed. Strong fiscal institutional frameworks can help. Even if countries have fiscal space, the short-term effects on growth of faster consolidation need to be balanced against the decrease in risks from lower levels of debt. To avoid the loss in credibility that could come with substituting for 23 Cottarelli and Jaramillo (2012, p. 7) note that markets have a strong focus on near-term growth prospects, hence, a better growth outlook could also support fiscal adjustment through lower borrowing costs. 24 The fact that external demand helped during the debt-reduction episodes analyzed earlier also suggests that international coordination is important. Simultaneous consolidation across many advanced economies tends to amplify the adverse effect on growth, suggesting that fiscal action should be sequenced and coordinated to reduce the size of the fiscal multiplier. 20 INTERNATIONAL MONETARY FUND
REDUCING PUBLIC DEBT WHEN GROWTH IS SLOW

adjustment today a promise to adjust tomorrow, the fiscal path should be embedded in a
credible fiscal consolidation strategy, buttressed by strong budget institutions (IMF, 2012a,
2013a).

The package of fiscal adjustment measures should aim to mitigate the negative impact on
growth. This mitigation can be achieved by shifting resources to budget components with higher
multipliers. For example, increasing indirect taxes and reducing direct taxes—the so-called fiscal
devaluation—can provide support to labor demand and improve the trade balance. On the
expenditure side, cutting the least productive current spending is likely to have a smaller
detrimental effect on growth than cutting investment or support for the most vulnerable citizens.

Monetary Policy

In an environment of public sector deleveraging, monetary policy should remain accommodative,
with due regard for country conditions. With fiscal consolidation acting as a drag on growth,
monetary stimulus needs to be kept in place, especially in countries in which the output gap
remains large. This means keeping policy rates at low levels and maintaining ample liquidity,
subject to inflationary expectations remaining well anchored. If downside risks materialize,
further rate reductions should be considered, if possible, along with additional unconventional
measures, especially in economies in which policy rates are near the zero lower bound. Broken
monetary policy transmission mechanisms caused, for instance, by a weak banking system,
should be addressed.

Privatization

In the past, the privatization of public assets has figured prominently in debt-reduction
strategies, including in IMF-supported programs. Privatization can help lower public debt
through two channels. First, if properly executed, privatization may help boost overall
productivity, raising potential growth and thus helping debt dynamics. Second, privatization can
affect the SFA factor in public debt dynamics if proceeds from the privatization are used to pay
down debt and reduce interest expenditure. In the past, proceeds from privatization have been
sizable in advanced economies. For instance, Portugal collected about 16 percent of GDP in
privatization revenue during 1996–2000; Italy collected 7 percent during 1997–2001; and Greece
and Spain each collected about 6 percent during four-year periods. At the same time, the
revenue loss arising from the sale of those assets would also have to be considered to assess the
longer-term impact on public finances.

Is selling additional government assets an option in the future? Public financial assets are still
large in advanced economies (more than 40 percentage points of GDP, on average, half of that in
the form of shares and other equity. However, reliance on privatization for debt-reduction
purposes requires careful planning and realism. Most equity holdings are in the hands of
subnational governments that may lack the incentive to sell assets, for example, because of their

                                                               INTERNATIONAL MONETARY FUND      21
REDUCING PUBLIC DEBT WHEN GROWTH IS SLOW
relatively low levels of debt. The majority of public nonfinancial assets (such as land and
buildings) are also owned by regional and local governments and may be difficult to monetize.
Moreover, in the economic climate of 2013, asset liquidation may not yield the same revenue as
it has in the past. In addition, only a very small share of nonfinancial assets is considered by the
authorities to be “salable” (see IMF, 2013, for a discussion on privatization).
Inflation
In principle, higher inflation could help reduce public debt.25 Inflation can affect the primary
balance, for example, if income brackets are not indexed under a progressive income tax.
Governments can also capture real resources by base money creation, but the scope for raising
seigniorage is limited by the small size of base money. The largest impact inflation could have
would be from eroding the real value of debt. Assuming a constant debt maturity structure, no
impact of inflation on economic growth, and a one-for-one adjustment of nominal interest rates
on newly issued debt to inflation (full Fisher effect), simulations for Group of Seven countries
suggest that a hypothetical increase in inflation from World Economic Outlook baseline levels to 6
percent for five years would reduce the average net debt ratio by less than 10 percentage points
by the end of the period, for most countries. The effect drops rapidly after five years because an
increasingly large share of securities will have been issued at higher interest rates. This result is
consistent with the empirical finding that inflation has not been a significant contributor to past
debt reversals.
However, higher inflation would be accompanied by significant challenges and risks. As a
practical matter, it might be difficult to raise inflation to a meaningful level in the current
economic environment, as evidenced by Japan’s experience in the past few decades. More
important, reliance on inflation to erode debt could lead to fiscal dominance, with inflation rates
drifting even higher as confidence in the future value of money is lost. As a result, inflation
expectations could become unanchored, thus undermining the credibility of the monetary
frameworks built since 1980—often at significant economic cost (IMF, 2013)—to control inflation.
Unanchored inflation expectations could reduce the demand for debt of longer tenor, further
eroding any upside from higher inflation, which could ultimately reduce economic growth.
Structural Reforms to Raise Longer-Term Growth
Structural reforms can increase growth and help reduce debt ratios in the longer term. Barkbu,
Rahman, and Valdés (2012) survey the large empirical literature and conclude that there is
25
This section is based on Akitoby, Komatsuzaki, and Binder (forthcoming).
22 INTERNATIONAL MONETARY FUNDREDUCING PUBLIC DEBT WHEN GROWTH IS SLOW
substantial evidence that structural reforms can increase growth. Their simulations using the
IMF’s Global Integrated Monetary and Fiscal model show that a combination of large-scale labor,
product market, and pension reforms that halve the distance of all euro area countries from best-
practice benchmarks can increase GDP by 4½ percent during a five-year horizon. However, the
beneficial growth effects of structural reforms tend to accumulate slowly. Meanwhile, a lack of
short-term demand support—be it monetary or fiscal—can have long-term effects in the
opposite direction, for example, through hysteresis in the labor market. To be successful,
structural reforms will also have to be granular, targeting particular weaknesses. In the European
example, targeted reforms would include, among other things, tackling labor market dualism and
weak competitiveness in the south and obstacles to higher labor participation and a more vibrant
services sector in the north.26
Conclusion
Many advanced economies face significant challenges in reducing their public debt levels.
Although public debt is approaching secular highs, the continued weak medium-term growth
outlook complicates the task of putting debt on a clearly declining path. Also, monetary policy is
operating at or close to the lower bound and at the same time, there is little to be gained from
higher rates of inflation (which would come with risks) or ambitious privatization efforts (which
could prove difficult in the current environment). This combination of factors suggests that the
burden of lowering debt levels will fall more squarely on fiscal consolidation.
Successful past debt reversals in advanced economies often began under adverse circumstances.
Output growth and fiscal policy were the main drivers behind 26 past successful episodes of
public debt reduction. Although some past successful episodes started under challenging initial
conditions, strong external demand and an accommodative interest rate environment supported
output growth as fiscal consolidation efforts continued.
The current and expected growth environments, however, might make successful debt reversal
even harder to achieve. As a consequence, debt reductions will require both a sustained
commitment to fiscal consolidation and careful design. Fiscal consolidation is needed to keep
public finances sustainable, but it also diminishes demand and further lowers growth in the short
term because of fiscal multiplier effects. Initially, the debt ratio may actually increase. Up-front
consolidations, although sometimes unavoidable, can lead to greater output losses than would
gradual efforts, but they can also reduce risk premiums more quickly, especially if debt levels are
high initially and the overall magnitude of the needed adjustment is relatively large. Whether
26
Many of these issues are touched upon in more detail in other chapters in this book: Chapters 7 and 8 discuss
the impact of structural reforms and the importance of “granularity,” respectively, while Chapters 5 and 6
consider the labor market challenges and policy issues in different European economies.
INTERNATIONAL MONETARY FUND 23REDUCING PUBLIC DEBT WHEN GROWTH IS SLOW front- or back-loaded consolidations lead to more lasting success also depends on political factors, such as the ability to sustain a commitment to consolidation. In any case, positive credibility effects are likely to provide only partial offsets to short-term pain. What should policymakers do? For countries with good financial market access, the answer is to consolidate gradually but with a credible medium-term strategy, buttressed by strong budget institutions. This approach will minimize the adverse impact on growth, particularly if multipliers vary over time. In countries in which fiscal accounts are weaker and sovereign borrowing rates are higher, the pace of consolidation has to be more ambitious. In all cases, it makes good sense to plan the adjustment path in structural terms to avoid the procyclical tightening that can accompany a focus on headline deficits. This can be achieved by, for example, focusing on a set of agreed-upon fiscal measures that take into account the need to protect the most vulnerable citizens and safeguard spending programs with strong positive growth effects (e.g., high-return infrastructure projects or key active labor market policies). In the medium term, success will be much more likely if consolidation efforts are accompanied by ambitious structural reforms. Growth-enhancing measures, such as selected structural reforms (in particular, in product and labor markets), are important for improving growth potential in the medium term, for mitigating the adverse growth impact from continued fiscal consolidation, and for helping reduce the debt-to-GDP ratio in a durable way. The remainder of this book touches on many dimensions of these medium-term challenges. 24 INTERNATIONAL MONETARY FUND
REDUCING PUBLIC DEBT WHEN GROWTH IS SLOW

Appendix 4A. Country Samples Used in the Analyses
                     Country Samples Used in the Analyses

                     Euro Area    Advanced      Full Sample        Main Episodes

                                              Economics of Debt       Large Debt
                                                  Reversals       Reversals in the Past

Australia                            *                *
Austria                  *           *                *                     *
Belgium                  *           *                *                     *
Canada                               *                *                     *
Cyprus                   *                                                  *
Czech Republic                       *                *
Denmark                              *                *                     *
Estonia                  *           *                *
Finland                  *           *                *                     *
France                   *           *                *
Germany                  *           *                *
Greece                   *           *                *                     *
Hong Kong SAR                        *                *
Iceland                              *                *                     *
Ireland                  *           *                *                     *
Israel                               *                                      *
Italy                    *           *                *                     *
Japan                                *                *                     *
Korea                                *                *
Luxembourg               *
Malta                    *
Netherlands              *           *                *                     *
New Zealand                          *                *                     *
Norway                               *
Portugal                 *           *                *                     *
Singapore                            *
Slovak Republic          *           *                *
Slovenia                 *           *                *
Spain                    *           *                *                     *
Sweden                               *                *                     *
Switzerland                          *                *                     *
United Kingdom                       *                *                     *
United States                        *                *                     *

Source: IMF staff.

                                                    INTERNATIONAL MONETARY FUND           25
You can also read