The utility of Google Trends as a tool for evaluating flooding in data scarce places
←
→
Page content transcription
If your browser does not render page correctly, please read the page content below
Accepted: 16 March 2021

DOI: 10.1111/area.12719

REGULAR PAPER

The utility of Google Trends as a tool for evaluating flooding in
data‐scarce places

Joshua J. Thompson1 | Robert L. Wilby1                                              | Tom Matthews1                          | Conor Murphy2

1
  Department of Geography and
                                                        Google Trends (GT) offers a historical database of global internet searches with
Environment, Loughborough University,
Loughborough, UK                                        the potential to complement conventional records of environmental hazards, espe-
2
  Department of Geography, Maynooth                     cially in regions where formal hydrometeorological data are scarce. We evaluate
University, Maynooth, Ireland                           the extent to which GT can discern heavy rainfall and floods in Kenya and
Correspondence                                          Uganda during the period 2014 to 2018. We triangulate counts of flood searches
Robert L. Wilby                                         from GT with available rainfall records and media reports to build an inventory
Email: r.l.wilby@lboro.ac.uk
                                                        of extreme events. The Spearman rank correlation (ρ) between monthly mean
                                                        search interest for flooding and monthly Climate Hazards Group InfraRed Precipi-
                                                        tation with Station (CHIRPS) rainfall totals was ρ = +0.38 (p < 0.005) for Kenya
                                                        and ρ = +0.64 (p < 0.001) for Uganda. Media reports of flooding were used to
                                                        specify a threshold of detectability to give the same overall frequency of floods
                                                        based on GT search interest. When the GT search index threshold was set at ≥15
                                                        and ≥29, the correct detection rate was 75% and 64% within a five‐day window
                                                        of known flood events in Kenya and Uganda, respectively. From these prelimi-
                                                        nary explorations we conclude that GT has potential as a proxy data source, but
                                                        greater skill may emerge in places with larger search volumes and by linking to
                                                        historical information about environmental hazards at sub‐national scales. Wider
                                                        applicability of the GT platform might be possible if there is greater transparency
                                                        about how Google algorithms determine topics.

                                                        KEYWORDS
                                                        big data, data sparse, flood, Google Trends, Kenya, Uganda

1    | INTRODUCTION
Use of Big Data has exploded thanks to increasing computer processing power, falling storage costs, and improving accessibil-
ity to software. This is enabling advances in economic forecasting (Choi & Varian, 2012; Woo & Owen, 2019), disease predic-
tion and health care (Arora et al., 2019; Carneiro & Mylonakis, 2009; Ginsberg et al., 2009; Seifter et al., 2010), as well as
consumer modelling (Du et al., 2015; Silva et al., 2019). Big Data analytics paired with real‐time data streaming from devices
connected to the Internet of Things has the potential for realising the “smart city dream” by improving decision‐making and
reducing costs for public services (Mohamed & Al‐Jaroodi, 2014; Silva et al., 2017, 2018). The last decade saw the price of
mobile electronic devices fall, resulting in an exponential rise in the number of smartphone users to 3.6 billion in 2020 (Statista,
2021). Meanwhile, Google increased worldwide market share of internet searches to 77% in 2019, establishing it as the domi-
nant search engine platform (Statcounter, 2019). Google is a prime example of the rapid growth in Big Data processing, with
----------------------------------------------------------------------------------------------------------------------------------------------------------------------
This is an open access article under the terms of the Creative Commons Attribution License, which permits use, distribution and reproduction in any medium, provided the
original work is properly cited.
The information, practices and views in this article are those of the author(s) and do not necessarily reflect the opinion of the Royal Geographical Society (with IBG).
© 2021 The Authors. Area published by John Wiley & Sons Ltd on behalf of Royal Geographical Society (with the Institute of British Geographers)

Area. 2021;1–10.                                                                                                                    wileyonlinelibrary.com/journal/area    |   1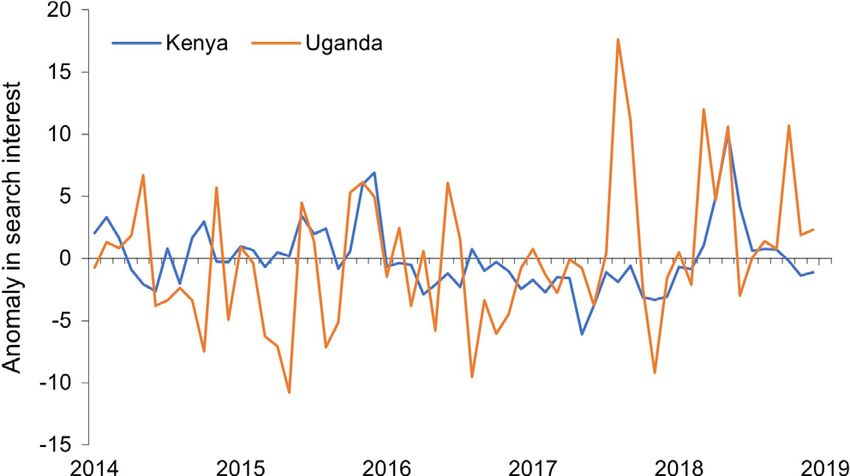
2
    |                                                                                                          THOMPSON   ET AL.

an estimated 76,000 searches per second in 2019 compared with 40,000 in 2012 (InternetLiveStats, 2019). Twitter is another
social media platform that has witnessed rapid growth, with over 320 million users (Statista, 2019).
    In 2006, Google Trends (GT) was launched. This allows analysis of search terms and topics for specified time periods
and regions. The tool has been applied in medicine, business, economics, and social science, where there are shared inter-
ests in real‐time data to detect and interpret social trends (Jun et al., 2018). For example, GT data use for research
expanded after the US Centers for Disease Control and Prevention demonstrated more rapid tracing and predicting of influ-
enza than traditional surveillance systems (Ginsberg et al., 2009; Jun et al., 2018). GT has also been used to detect signs of
diabetes by monitoring keywords and search terms (Tkachenko et al., 2017), recognising that citizens are increasingly turn-
ing to online sources as a means of self‐diagnosis. In economics, search data demonstrate better skill than structural models
at predicting directional changes in exchange rates (Bulut, 2018). Similarly, search information has been used in forecasting
models to complement consumer sentiment indexes (Woo & Owen, 2019), outperforming survey‐based measures in predict-
ing private expenditure (Vosen & Schmidt, 2011).
    Benchmarking the frequency, severity, and impact of environmental hazards is an important step towards the manage-
ment of future threats (Wilby, 2019). Hazards including floods, heatwaves, and droughts are expected to increase in fre-
quency and severity with climate change (Watts et al., 2015). GT offers an historical database of global searches with the
potential to complement historical records of environmental hazards. Furthermore, Google affords real‐time monitoring
capabilities that could eventually support emergency responders and strategic planning for hydrological hazards. As the UN
Office for Disaster Risk Reduction observes “acquiring qualitative and quantitative baseline information in poorly gauged
regions should be prioritized to provide the necessary robust foundation for adaptation planning” (Ballesteros‐Cánovas
et al., 2019, p. 2). Historical data are important sources of information about flood frequency that contribute to flood risk
assessment and management (Longfield et al., 2019).
    GT has previously been used to investigate internet search frequency in East Africa for flooding associated with the
2015/16 El Niño (Gannon et al., 2018; Siderius et al., 2018). We build on such analyses by evaluating the utility of GT
over a longer timescale in two countries with limited conventional meteorological data. More specifically, we evaluate the
extent to which GT data can discern heavy rainfall and flood events in Kenya and Uganda at the national scale. We trian-
gulate flood search information from GT with rainfall records and media reports to build an inventory of extreme events
that were so impactful as to be deemed newsworthy. By working through these cases, we uncover a range of confounding
factors that must be considered when interpreting results. We begin by describing the methods used to acquire then process
GT and precipitation data. Next, we show comparisons between search interest and reported flood events, correlations
between search interest and rainfall data, and a flood event search threshold. Finally, we discuss the utility of GT data for
analysing historical hydrological hazards more generally.

2       | DATA AND METHODS
Kenya and Uganda were chosen as the study areas because they are both relatively data‐sparse nations with rapid popula-
tion and urban growth, with high exposure to seasonal flooding (Weeser et al., 2018). According to the United Nations
Office for the Coordination of Humanitarian Affairs, nearly 6 million people in East Africa were affected by devastating
flood episodes in 2020. Meanwhile, the World Bank (2020) estimated that 18% and 24% of the population of Kenya and
Uganda, respectively, had access to the internet in 2017. Google has a 95% market share in Kenya and Uganda based on
volume of searches compared with other search engine platforms like Bing, Firefox, and Internet Explorer (Statcounter,
2019). This means the majority of search traffic from both nations is captured by Google.
    Google Trends is a publicly available sample of search data that are anonymised, categorised, and aggregated across all
Google products, including YouTube (Google Trends, 2019). This allows users to gauge interest in a search term or topic
by period and domain (even to city‐scale for countries with sufficient search volumes). GT has two filters for real‐time and
historical datasets. Real‐time gives searches covering the past seven days, compared with non‐real time, which is a sample
of the entire Google dataset from 2004 up to 36 hours ago. Real‐time search trends update every minute, highlighting
trending events within the last 24 hours, by location. Absolute search data would return billions of entries every day, which
would be too large to process quickly. Hence, data are presented as a proportion of all searches on all topics on Google for
the specified period and location. This also accounts for changing numbers of internet users through time.
    Google Trends has two search filters: search terms and search topics. Topics were introduced by the company as a way
of bundling all searches related to a given subject. For example, the topic “flood” would include searches for flooding in
other languages and searches that Google’s algorithm considers to be related to flooding. A drawback is that “flooding the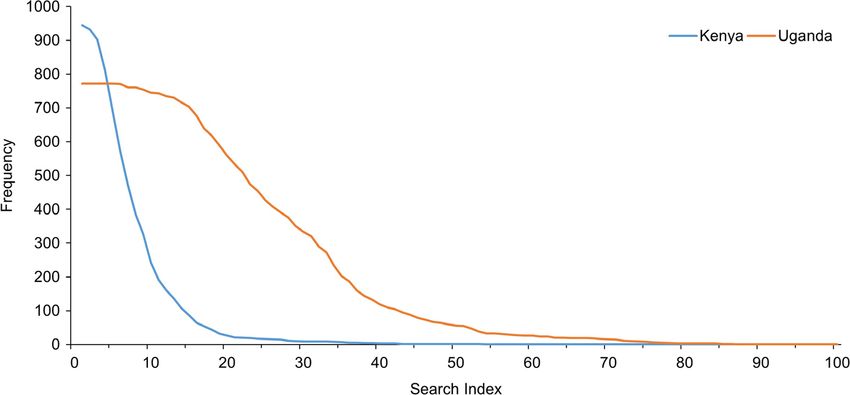
THOMPSON     ET AL.                                                                                                                                                 |   3

market” or other non‐flood‐related searches could be included in results. Furthermore, it is unclear how exactly these topics
are defined by Google, which introduces some uncertainty to their interpretation.
    Regardless of the period queried, GT always returns around 200 data points. This is a major limitation of the interface
that constrains the resolution of search interest, especially over long time frames, hindering the detection of flood events
because daily peaks and troughs in search interests are trimmed. To overcome this, shorter timeframes can be queried at
higher resolution, but these shorter periods have to be bridged with one another. This was undertaken in four steps.
    First, monthly search interest in the topic “flood” was queried between 2014 and 2018 in Kenya and Uganda. Second,
the month with the highest search interest was identified for both nations during the time period, then used to rescale inter-
est in all other months. For example, the month with the highest search interest is indexed at a value of 100 by GT, giving
a weighting of 1. Third, daily data on search interest under the topic of “flood” was acquired on a single month‐by‐month
basis for 2014–2018 for each nation. Fourth, daily data were scaled by multiplying every search interest value by the corre-
sponding monthly weighted value. This procedure was applied to all months to create a daily series of search interest
between 2014 and 2018 (with data retrieved on 29 September 2019). Additionally, monthly series were expressed as
anomalies from the monthly five‐year mean search interest to enable comparison of the series between the two countries.
    Precipitation data were obtained from the Climate Hazards Group Infrared Precipitation with Stations (CHIRPS) archive
(Funk et al., 2014). These data provide monthly precipitation series representing Kenya and Uganda between 1981 and
2020. Monthly totals were extracted for both countries within our study period 2014–2018. This source and time period
were chosen to demonstrate what can be achieved with publicly available data alone.
    A flood inventory was assembled from multiple media sources, including the Dartmouth Flood Observatory,1 Flood-
List,2 DesInventar,3 and Emergency Events Database (EM‐DAT),4 to triangulate known events (see Table 1 and Supple-
mentary Information). The lists were then compared with the search interest series compiled independently for the topic of
“Flood” for both countries. Spearman rank correlations (ρ) were calculated between the two national anomaly series in
search interest, as well as between monthly mean search interest and monthly precipitation for Kenya and Uganda. The
flood inventory was also used to eliminate background “noise” in searches by calibrating a threshold of search interest
against known events. This was achieved by identifying thresholds of search interest that give the same number of above‐
threshold events as the frequency of observed floods in each country, during the study period.
    Finally, using daily data, we test the sensitivity of GT correct and false detection rates to the length of the search win-
dow (spanning the actual day and up to five days after the date of a known flood) against events recorded by DesInventar.
A correct detection is when the search threshold and daily interest value signal a flood within a specified number of days
of the observed flood; false detection is when the search interest is above the threshold, suggesting a flood, yet none was
captured by the media within the specified period.

3    | RESULTS
Comparison of daily search interest (Figure 1) with media reports of flooding had mixed success. In Kenya, peaks in search
interest coincided with notable floods then decayed over time as flood waters receded. For instance, high search interest on

T A B L E 1 Media reports and disaster records of flooding in Kenya and Uganda between 2014 and 2018
                                                                              DesInventar reports of
                         Media reports of flooding                            flooding                                              EM‐DAT reports of flooding
 Year                    Kenya                     Uganda                     Kenya                     Uganda                      Kenya                     Uganda
 2014                     2                        1                          6                           60                        0                         0
 2015                    17                        0                          80                          38                        3                         0
 2016                     9                        1                          6                           38                        1                         1
 2017                     3                        1                          NA                          93                        1                         1
 2018                     7                        4                          NA                        113                         1                         0
Notes. Media reports refer to FloodList, Dartmouth Flood Observatory, and media outlets covering floods, details of which are available in the Supplementary Infor-
mation. DesInventar (2019) is sponsored by the UN Office for Disaster Risk Reduction. This disaster database applies a geographical resolution equivalent to a
municipality so is, therefore, more likely to detect localised events than the country‐level granularity of EM‐DAT (see Panwar & Sen, 2020). Note that the criteria
required for an event to be logged by EM‐DAT and DesInventar differ. EM‐DAT specifies that an event must meet at least one of four criteria before being
recorded: equal to or greater than 10 deaths; equal to or greater than 100 people affected; state‐level declaration of emergency; a call for international help. At least
one of the following must be met to be recorded in DesInventar: one or more death; one US dollar of economic loss.
4
| THOMPSON ET AL.
10 May 2015 coincided with nine fatalities after a mosque collapsed amid flooding in Nairobi (see Supplementary Informa-
tion). Peaks in December 2015 followed reports of heavy rain across the country, with hundreds of thousands of people
reportedly displaced (FloodList, 2019; ReliefWeb, 2019). Search interest again peaked in late April 2016 after at least ten
people were killed by another building collapse during flooding in Nairobi (FloodList, 2019). High search interest in early
and mid‐March 2018 matched with flooding in the capital that killed an estimated 13 people following heavy rain on 2
March (FloodList, 2019). Further peaks on 14 March 2018 were likely associated with heavy rainfall across much of the
country that resulted in 11 reported fatalities (FloodList, 2019). Multiple flood events were recorded between mid‐April and
early May 2018, resulting in 112 reported dead (see Supplementary Information) and tracked by the GT peak in Kenya in
April–June 2018. Unsurprisingly, events with multiple fatalities tend to receive more search interest. Additionally, floods in
neighbouring Ethiopia and Rwanda appeared to be reflected in heightened search interest in both Kenya and Uganda during
May 2018 (FloodList, 2019) (see Supplementary Information).
Overall, there is a weak correlation (ρ = 0.18, p < 0.1) between normalised GT search interest in Kenya and Uganda
(Figure 2). This suggests that, for most of the time, search interest in flooding occurs independently in the two countries.
However, the two highest values in search interest in Kenya (November–December 2015 and May 2018) correspond with
peaks in Uganda, confirming the view that these particular flood episodes affected East Africa more generally. Average
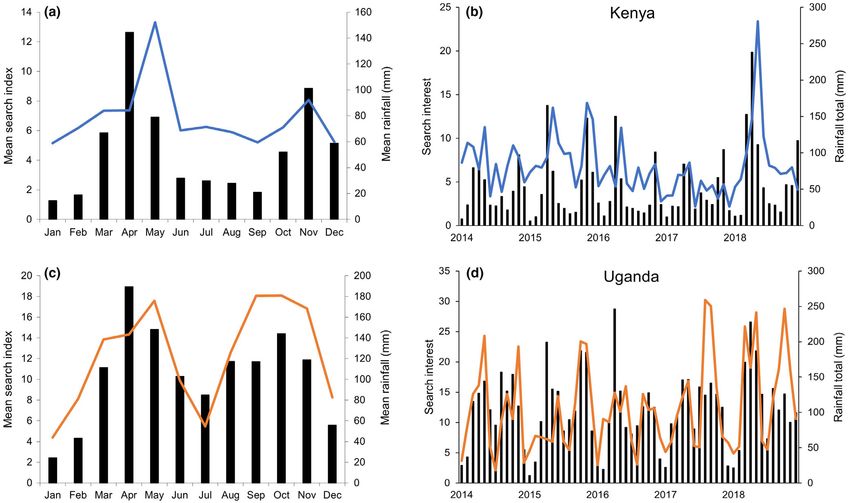
interest in flooding also follows the seasonal rainfall regime of each country (Figure 3, left panels). In both cases, search
interest peaks during April–May (long rains period), falls to a minimum during the drier summer months, then rises to a
second peak in November in Kenya and September to November in Uganda (during the short rains). Monthly series show
on average more search interest in floods coinciding with periods of unusually heavy rainfall (Figure 3, right panels). The
correlation between search interest and CHIRPS is significant in both countries but stronger in Uganda (ρ = 0.64,
p < 0.0001) than in Kenya (ρ = 0.38, p < 0.005).
DesInventar (2019) only lists floods up to 2016 in Kenya. Here, there were 92 days with reported floods between 2014
and 2016. The nearest equivalent frequency (87 days) requires a GT search index ≥15 (Figure 4). This GT interest thresh-
old achieves a 38% correct and 60% false detection rate for the same day as the observed flood, rising to 75% correct and
21% false within a five‐day window (Figure 5). For Uganda, there were 342 days with reported floods between 2014 and
2018, and closest frequency (350 days) from a GT search index ≥29 (Figure 4). This yields 48% correct and 53% false
F I G U R E 1 Daily search index for the topic “flood” between 2014 and 2018 in Kenya (upper panel) and Uganda (lower panel).
Note: On 1 January 2016, Google notes an improvement in the GT data collection system. Daily search interest for the topic of “flood” is
measured as a proportion of all searches on Google for Kenya and Uganda between 2014 and 2019.THOMPSON ET AL. | 5 F I G U R E 2 Search index expressed as a monthly anomaly relative to the respective 2014–2018 means for Kenya and Uganda. F I G U R E 3 Monthly mean search index for topic “flood” compared with monthly rainfall totals for Kenya and Uganda between 2014 and 2018. detection rates for the same day of the observed flood (Figure 5). As with Kenya, this improves with longer windows up to five days, for which the detection rates are 64% correct and 37% false. 4 | DISCUSSION Google Trends tracks search interest during floods. Interest tends to spike for events with widespread media coverage, or where fatalities are reported. This is unsurprising as news stories appear online in the aftermath of floods and internet users would likely see these in their timelines. Additionally, as flood reports are posted online, users are more likely to share these across social networks, further increasing search interest in the topic (Bakshy et al., 2012). Compared with nations with more internet infrastructure, Kenya and Uganda have relatively low search volumes, limiting the amount of informa- tion at regional scales, especially in Kenya. This is reflected by the lower baseline search interest scores in Kenya.
6
    |                                                                                                                           THOMPSON   ET AL.

F I G U R E 4 Inverse cumulative frequency of search index values between 2014 and 2018 for Kenya and Uganda.

F I G U R E 5 Correct and false detection rates for known floods in Kenya (2014–2016) and Uganda (2014–2018) when the GT interest
thresholds are ≥15 and ≥29, respectively.Note: The “correct” rate is given by the ratio of the number of days with floods detected by GT,
divided by the number of days with observed floods. The “false” rate is the proportion of days with floods detected by GT that did not coincide
with an observed flood. Window length 1 is the day of the known flood, 2 is the day of the flood as well as the one following, and so forth.

    Search interest expressed as monthly anomalies gives further insights (see Figure 2). In Kenya, high search interest dur-
ing November 2015 coincided with heavy rainfall, flash floods, and multiple fatalities. This was the same in May 2018,
when heavy rainfall caused flash flooding with over 100 fatalities and an estimated 200,000 people displaced. For Uganda,
an anomaly in August 2017 overlapped with severe flooding in the north that killed two people and displaced over 2000
(see Supplementary Information). Similarly, search interest anomalies in March, May, and October 2018 are explained by
reported flood events.
    There were statistically significant correlations between monthly mean search interest and monthly precipitation in both
Kenya and Uganda during the five‐year study period (ρ = 0.38 and 0.64 respectively). The long and short rainfall periods
are also reflected by intra‐annual variations in flood search interest (Figure 3), indicating that GT can be used as a proxy
for heavy rainfall. This could be a valuable source of information for countries that are relatively data sparse in terms of
historical rainfall and flood records. Moreover, GT could offer additional information about the impacts of extreme events,
thus yielding more robust estimates of flood frequencies. Similar techniques have been used with historical archives to
reconstruct flood frequencies elsewhere (e.g., Kjeldsen et al., 2014; Macdonald et al., 2006; Neppel et al., 2010). As flood
records improve, GT search interest could be re‐visited to better specify local thresholds for flood detection.
    In the absence of historical and consistent rainfall time series for Kenya and Uganda, satellite data products like
CHIRPS are critical for climate analyses and monitoring changes in precipitation patterns (Dinku et al., 2018). The quality
of CHIRPS data, therefore, underpins any comparative analysis. Recent evaluations of satellite‐derived rainfall products for
eastern Africa, including Kenya and Uganda, showed that CHIRPS performs better than similar products like ARC2 and
TAMSAT3 (Dinku et al., 2018; Macharia et al., 2020; Maidment et al., 2017). Validation against existing networks of rain
THOMPSON ET AL. | 7
gauges in Kenya and Uganda reveals that CHIRPS accurately predicts rainfall over low‐lying regions but may underesti-
mate precipitation in high elevation areas (such as Mt. Kenya) (Macharia et al., 2020).
Google search data, like hydrological measurements, are prone to errors and biases (Wilby et al., 2017). Although data
gathered by GT can be referenced by geographical area, searches made by users may be for events that are occurring (or
have happened) in places remote from the physical location of the browser. This effect may confound associations between
local rainfall and search interest, since rainfall data relate to specific places through time, whereas search interest is aggre-
gated by where a search occurs, not where the search is about. For example, by researching the utility of GT for this paper
we have been adding to the UK count of searches on the topic of flood, yet our interest has been about floods in East
Africa. These uncertainties may account for some of the false alarms.
Hence, detection of extreme rainfall and flood events is challenging for GT. Previous applications to the spread of dis-
ease or consumption patterns benefit from large‐scale population behaviour or phenomena that are not physically con-
strained. Other work also shows that GT can track drought awareness at national and regional scales (Kam et al., 2019;
Kim et al., 2019). Perhaps regular dissemination of forecasts by meteorological agencies like the Kenya Meteorological
Department or seasonal outlooks from the Intergovernmental Climate Prediction and Applications Centre (ICPAC) stimulate
search interest. In comparison, floods tend to be more localised and with rapid onset when compared with droughts, which
generally affect larger areas and can persist for years (Dutra et al., 2013). Nonetheless, we assert that there is sufficient
information to triangulate data sources for flood events even in data sparse regions and for quality‐assuring historical
events. Utility of GT may be greatest at a regional level where flood events cause multiple fatalities – as in Ethiopia and
Rwanda during May 2017. Regional events will likely have greater media coverage due to their impacts and thus receive
higher volumes of search interest too.
Google Trends offers a freely available and expanding dataset that could augment conventional data streams and be
applied to other weather‐related hazards. Moreover, words like “landslide” have greater specificity than “flood,” because
there is less ambiguity about the term. Hence, GT could provide an invaluable data source for hazard and impact assess-
ment with the possibility of real‐time monitoring as Google continues to develop the platform. When considering the con-
text of expected increases in climatic variability for many parts of the world, especially East Africa (Nicholson, 2017), a
region impacted by frequent drought and flooding, the value of baseline data cannot be over‐stated.
GT search data could be interpreted as a “social hydrograph.” Interest is likely to be highest either on or after the day
of a flood event as a result of surges in media reporting, followed by a decay in attention as flood waters recede. By ana-
lysing this trace, the type of flood could be determined by discriminating between a flash‐flood, short‐, or long‐rains flood
signatures. Furthermore, it could help distinguish the seasonality of some flood types. By analysing this in the long term, it
may be possible to categorise the dominant flood type(s) for a region and how these change through time.
Twitter also gives insight to hazard impacts, such as temperature‐related mortality during heatwaves (Cecinati et al.,
2019). However, a major limitation of Twitter data is that tweets do not have a linked geolocation and there is currently no
openly accessible platform to analyse Tweets, unlike GT. It is estimated that 15% of all Twitter accounts (48 million) are
automated. For example, some bots automatically post breaking news or emergency information, while others have been
used to disseminate fake news, manipulate Twitter trends, or steer public perception (Jones, 2019; Rodríguez‐Ruiz et al.,
2020). Despite these limitations, Twitter has the potential to be a complementary tool for GT data since individual tweets
can be analysed and time‐stamped.
As search volumes increase with growing access to mobile and electronic devices with internet support, as well as
improved internet access, there could be potential in analysing search interest on district scales. This is already feasible for
the USA and offers the possibility of matching search interest with locally recorded rainfall data, potentially supporting
flood event detection on a district scale. However, this presumes good internet connectivity (despite potential outages of IT
services during extreme weather) and additional support from Google through data visualisation at a district level across
East Africa.
5 | CONCLUSIONS
We investigated the feasibility of using GT to analyse historical floods. Preliminary findings for Kenya and Uganda show
promise – associations were found between the volume of GT searches, seasonal patterns of rainfall, and incidence of sig-
nificant flood episodes at national scales. We found that search interest correctly detects a newsworthy flood within a five‐
day window for 75% of events in Kenya and 64% in Uganda. These detection statistics partly depend on the criteria fol-
lowed by online media and DesInventar when reporting floods in each country, which influence the number of days with
floods in the news. Some reports, such as on the television or radio, may be overlooked.8
| THOMPSON ET AL.
The correct detection rate is expected to improve as search volumes grow. However, querying search interest for the
topic “flood” also captures non‐flood‐related searches and, until Google releases detailed information about how topics are
determined, this will remain an uncertainty. Furthermore, removal of background noise or non‐flood event‐related queries is
not straightforward via the current platform. We tested various thresholds of search interest in flooding matched to the num-
ber of days with official records and news articles about flooding, and people and property affected, recognising that there
is a level of background searches from browsers in neighbouring countries. Hence, there is uncertainty in both the true
number of days with floods and the true amount of national, flood‐related search interest.
Google Trends is a unique dataset that could be explored in more exacting ways to gain deeper insights into societal
search behaviour during extreme events such as floods, droughts, heatwaves, wildfires, and landslides. This study illustrates
the potential for GT to complement official hydrological records in data‐scarce regions, with mixed success in areas that
have limited internet infrastructure. Future studies could apply GT in places with more detailed hydrological records to
evaluate the factors affecting thresholds of detectability within search metrics. Additionally, future research for East Africa
might evaluate rising lake levels and associated flood events via concurrent and lagged correlation analysis of Google data.
Insights from GT will only become more powerful and accurate as the dataset continues to grow with every search we
make.
ACKNOWLEDGEMENTS
The authors thank the anonymous reviewers for their careful and constructive remarks which certainly improved the final
paper.
DATA AVAILABILITY STATEMENT
The data that support the findings of this study are available from the corresponding author on reasonable request.
ORCID
Robert L. Wilby https://orcid.org/0000-0002-4662-9344
Tom Matthews https://orcid.org/0000-0001-6295-1870
Conor Murphy https://orcid.org/0000-0003-4891-2650
ENDNOTES
1
Dartmouth Flood Observatory website: http://floodobservatory.colorado.edu (accessed March 2021).
2
FloodList website: http://floodlist.com (accessed March 2021).
3
DesInventar website: https://www.desinventar.net (accessed March 2021).
4
EM‐DAT website: https://www.emdat.be (accessed March 2021).
REFERENCES
Arora, V. S., McKee, M., & Stuckler, D. (2019). Google Trends: Opportunities and limitations in health and health policy research. Health Pol-
icy, 123, 338–341. https://doi.org/10.1016/j.healthpol.2019.01.001
Bakshy, E., Rosenn, I., Marlow, C., & Adamic, L. (2012). The role of social networks in information diffusion. In Proceedings of the 21st
Annual Conference on World Wide Web (pp. 519–528). https://doi.org/10.1145/2187836.2187907
Ballesteros‐Cánovas, J. A., Sciences, E., Allen, S., & Stoffel, M. (2019). The importance of robust baseline data on past flood events for regional
risk assessment: A study case from the Indian Himalayas. Geneva, Switzerland: UN Office for Disaster Risk Reduction.
Bulut, L. (2018). Google Trends and the forecasting performance of exchange rate models. Journal of Forecasting, 37, 303–315. https://doi.org/
10.1002/for.2500
Carneiro, H. A., & Mylonakis, E. (2009). Google Trends: A web‐based tool for real‐time surveillance of disease outbreaks. Clinical Infectious
Diseases, 49, 1557–1564. https://doi.org/10.1086/630200
Cecinati, F., Matthews, T., Natarajan, S., McCullen, N., & Coley, D. (2019). Mining social media to identify heat waves. International Journal
of Environmental Research and Public Health, 16, 762. https://doi.org/10.3390/ijerph16050762
Choi, H., & Varian, H. (2012). Predicting the present with Google Trends. Economic Record, 88, 2–9. https://doi.org/10.1111/j.1475‐4932.2012.
00809.x
DesInventar. (2019). DesInventar web‐site. Retrieved from https://www.desinventar.net/THOMPSON ET AL. | 9
Dinku, T., Funk, C., Peterson, P., Maidment, R., Tadesse, T., Gadain, H., & Ceccato, P. (2018). Validation of the CHIRPS satellite rainfall esti-
mates over eastern Africa. Quarterly Journal of the Royal Meteorological Society, 144, 292–312. https://doi.org/10.1002/qj.3244
Du, R. Y., Hu, Y., & Damangir, S. (2015). Leveraging trends in online searches for product features in market response modeling. Journal of
Marketing, 79, 29–43. https://doi.org/10.1509/jm.12.0459
Dutra, E., Magnusson, L., Wetterhall, F., Cloke, H. L., Balsamo, G., Boussetta, S., & Pappenberger, F. (2013). The 2010–2011 drought in the
Horn of Africa in ECMWF reanalysis and seasonal forecast products. International Journal of Climatology, 33, 1720–1729. https://doi.org/10.
1002/joc.3545
FloodList. (2019). FloodList web‐site. Retrieved from http://floodlist.com/
Funk, C. C., Peterson, P. J., Landsfeld, M. F., Pedreros, D. H., Verdin, J. P., Rowland, J. D., Romero, B. E., Husak, G. J., Michaelsen, J. C., &
Verdin, A. P. (2014). A quasi‐global precipitation time series for drought monitoring: U.S. Geological Survey Data Series 832. USGS, 4.
https://doi.org/10.3133/ds832
Gannon, K. E., Conway, D., Pardoe, J., Ndiyoi, M., Batisani, N., Odada, E., Olago, D., Opere, A., Kgosietsile, S., Nyambe, M., Omukuti, J., &
Siderius, C. (2018). Business experience of floods and drought‐related water and electricity supply disruption in three cities in sub‐Saharan
Africa during the 2015/2016 El Niño. Global Sustainability, 1, 1–15. https://doi.org/10.1017/sus.2018.14
Ginsberg, J., Mohebbi, M. H., Patel, R. S., Brammer, L., Smolinski, M. S., & Brilliant, L. (2009). Detecting influenza epidemics using search
engine query data. Nature, 457, 1012–1014. https://doi.org/10.1038/nature07634
Google Trends. (2019). Google Trends web‐site. Retrieved from https://trends.google.com/trends
InternetLiveStats. (2019). InternetLiveStats web‐site. Retrieved from https://www.internetlivestats.com/google‐search‐statistics/
Jones, M. O. (2019). Propaganda, fake news, and fake trends: The weaponization of Twitter bots in the Gulf crisis. International Journal of Com-
munication, 13, 1389–1415. https://doi.org/10.1109/SNAMS.2019.8931874
Jun, S.‐P., Yoo, H. S., & Choi, S. (2018). Ten years of research change using Google Trends: From the perspective of big data utilizations and
applications. Technological Forecasting and Social Change, 130, 69–87. https://doi.org/10.1016/j.techfore.2017.11.009
Kam, J., Stowers, K., & Kim, S. (2019). Monitoring of drought awareness from Google Trends: A case study of the 2011–17 California drought.
Weather, Climate, and Society, 11, 419–429. https://doi.org/10.1175/WCAS‐D‐18‐0085.1
Kim, S., Shao, W., & Kam, J. (2019). Spatiotemporal patterns of US drought awareness. Palgrave Communications, 5, 1–9. https://doi.org/10.
1057/s41599‐019‐0317‐7
Kjeldsen, T. R., Macdonald, N., Lang, M., Mediero, L., Albuquerque, T., Bogdanowicz, E., Brázdil, R., Castellarin, A., David, V., Fleig, A.,
Gül, G. O., Kriauciuniene, J., Kohnová, S., Merz, B., … Wilson, D. (2014). Documentary evidence of past floods in Europe and their utility
in flood frequency estimation. Journal of Hydrology, 517, 963–973. https://doi.org/10.1016/j.jhydrol.2014.06.038
Longfield, S. A., Faulkner, D., Kjeldsen, T. R., Macklin, M. G., Jones, A. F., Foulds, S. A., Brewer, P. A., & Griffiths, H. M. (2019). Incorporat-
ing sedimentological data in UK flood frequency estimation. Journal of Flood Risk Management, 12, e12449. https://doi.org/10.1111/jfr3.
12449
Macdonald, N., Werritty, A., Black, A. R., & McEwen, L. J. (2006). Historical and pooled flood frequency analysis for the River Tay at Perth,
Scotland. Area, 38, 34–46. https://doi.org/10.1111/j.1475‐4762.2006.00673.x
Macharia, J. M., Ngetich, F. K., & Shisanya, C. A. (2020). Comparison of satellite remote sensing derived precipitation estimates and observed
data in Kenya. Agricultural and Forest Meteorology, 284, 107875. https://doi.org/10.1016/j.agrformet.2019.107875
Maidment, R. I., Grimes, D., Black, E., Tarnavsky, E., Young, M., Greatrex, H., Allan, R. P., Stein, T., Nkonde, E., Senkunda, S., & Alcántara,
E. M. U. (2017). A new, long‐term daily satellite‐based rainfall dataset for operational monitoring in Africa. Scientific Data, 4, 170063.
https://doi.org/10.1038/sdata.2017.63
Mohamed, N., & Al‐Jaroodi, J. (2014). Real‐time big data analytics: applications and challenges. In Proceedings of the 2014 International Con-
ference on High Performance Computing and Simulation (pp. 305–310). https://doi.org/10.1109/HPCSim.2014.6903700
Neppel, L., Renard, B., Lang, M., Ayral, P.‐A., Coeur, D., Gaume, E., Jacob, N., Payrastre, O., Pobanz, K., & Vinet, F. (2010). Flood frequency
analysis using historical data: accounting for random and systematic errors. Hydrological Sciences Journal, 55, 192–208. https://doi.org/10.
1080/0262666090354609
Nicholson, S. E. (2017). Climate and climatic variability of rainfall over eastern Africa. Reviews of Geophysics, 55, 590–635. https://doi.org/10.
1002/2016RG000544
Panwar, V., & Sen, S. (2020). Disaster damage records of EM‐DAT and DesInventar: a systematic comparison. Economics of Disasters and Cli-
mate Change, 4, 295–317. https://doi.org/10.1007/s41885‐019‐00052‐0
ReliefWeb. (2019). ReliefWeb web‐site. Retrieved from https://reliefweb.int/
Rodríguez‐Ruiz, J., Mata‐Sánchez, J. I., Monroy, R., Loyola‐González, O., & López‐Cuevas, A. (2020). A one‐class classification approach for
bot detection on Twitter. Computers and Security, 91, 101715. https://doi.org/10.1016/j.cose.2020.101715
Seifter, A., Schwarzwalder, A., Geis, K., & Aucott, J. (2010). The utility of “Google Trends” for epidemiological research: Lyme disease as an
example. Geospatial Health, 4, 135. https://doi.org/10.4081/gh.2010.195
Siderius, C., Gannon, K. E., Ndiyoi, M., Opere, A., Batisani, N., Olago, D., Pardoe, J., & Conway, D. (2018). Hydrological response and com-
plex impact pathways of the 2015/2016 El Niño in Eastern and Southern Africa. Earth’s Future, 6, 2–22. https://doi.org/10.1002/
2017EF000680
Silva, B. N., Khan, M., & Han, K. (2017). Big data analytics embedded smart city architecture for performance enhancement through real‐time
data processing and decision‐making. Wireless Communications and Mobile Computing, 2017, 1–12. https://doi.org/10.1155/2017/942967610
| THOMPSON ET AL.
Silva, B. N., Khan, M., Jung, C., Seo, J., Muhammad, D., Han, J., Yoon, Y., & Han, K. (2018). Urban planning and smart city decision manage-
ment empowered by real‐time data processing using big data analytics. Sensors (Switzerland), 18, 2994. https://doi.org/10.3390/s18092994
Silva, E., Hassani, H., Madsen, D., & Gee, L. (2019). Googling fashion: Forecasting fashion consumer behaviour using Google Trends. Social
Sciences, 8, 111. https://doi.org/10.3390/socsci8040111
Statcounter. (2019). Statcounter web‐site. Retrieved from http://gs.statcounter.com/search‐engine‐market‐share
Statista. (2019). Statista web‐site. Retrieved from https://www.statista.com/statistics/282087/number‐of‐monthly‐active‐twitter‐users/
Statista. (2021). Statista web‐site. Retrieved from https://www.statista.com/statistics/330695/number‐of‐smartphone‐users‐worldwide/
Tkachenko, N., Chotvijit, S., Gupta, N., Bradley, E., Gilks, C., Guo, W., Crosby, H., Shore, E., Thiarai, M., Procter, R., & Jarvis, S. (2017).
Google Trends can improve surveillance of Type 2 diabetes. Scientific Reports, 7, 4993. https://doi.org/10.1038/s41598‐017‐05091‐9
Vosen, S., & Schmidt, T. (2011). Forecasting private consumption: survey‐based indicators vs. Google trends. Journal of Forecasting, 30, 565–
578. https://doi.org/10.1002/for.1213
Watts, G., Battarbee, R. W., Bloomfield, J. P., Crossman, J., Daccache, A., Durance, I., Elliott, J. A., Garner, G., Hannaford, J., Hannah, D. M.,
& Hess, T. (2015). Climate change and water in the UK–past changes and future prospects. Progress in Physical Geography, 39, 6–28.
https://doi.org/10.1177/0309133314542957
Weeser, B., Stenfert Kroese, J., Jacobs, S. R., Njue, N., Kemboi, Z., Ran, A., Rufino, M. C., & Breuer, L. (2018). Citizen science pioneers in
Kenya – A crowdsourced approach for hydrological monitoring. Science of the Total Environment, 631–632, 1590–1599. https://doi.org/10.
1016/j.scitotenv.2018.03.130
Wilby, R. L. (2019). A global hydrology research agenda fit for the 2030s. Hydrology Research, 50, 1464–1480. https://iwaponline.com/hr/artic
le/50/6/1464/70340
Wilby, R. L., Clifford, N. J., De Luca, P., Harrigan, S., Hillier, J. K., Hodgkins, R., Johnson, M. F., Matthews, T. K., Murphy, C., Noone, S. J.,
& Parry, S. (2017). The ‘dirty dozen’ of freshwater science: detecting then reconciling hydrological data biases and errors. Wiley Interdisci-
plinary Reviews: Water, 4, e1209. https://doi.org/10.1002/wat2.1209
Woo, J., & Owen, A. L. (2019). Forecasting private consumption with Google Trends data. Journal of Forecasting, 38, 81–91. https://doi.org/10.
1002/for.2559
World Bank. (2020). World Bank web‐site. Retrieved from https://data.worldbank.org/indicator/IT.NET.USER.ZS; https://climateknowledgeportal.-
worldbank.org/download‐data
SUPPORTING INFORMATION
Additional supporting information may be found online in the Supporting Information section at the end of the article.
Supplementary Material
How to cite this article: Thompson JJ, Wilby RL, Matthews T, Murphy C. The utility of Google Trends as a tool
for evaluating flooding in data‐scarce places. Area. 2021;00:1–10. https://doi.org/10.1111/area.12719You can also read