Unsupervised Fraud Detection in Medicare Australia
←
→
Page content transcription
If your browser does not render page correctly, please read the page content below
Proceedings of the 9-th Australasian Data Mining Conference (AusDM'11), Ballarat, Australia

                Unsupervised Fraud Detection in Medicare Australia
MingJian Tang*, B. Sumudu.U. Mendis, D. Wayne Murray, Yingsong Hu and Alison Sutinen
                                                  Strategic Data Mining Section
                                                  Department of Human Services
                                             134 Reed Street, Tuggeranong 2900, ACT
                                        *
                                            ming.jian.tang@humanservices.gov.au

Abstract                                                              faces new challenges with respect to efficiently and
                                                                      accurately detecting non-compliant patients. Patients are
Fraud detection is a fundamental data mining task with a              considered as consumers in MA since they consume
wide range of practical applications. Finding rare and                certain medical resources.
evolving fraudulent claimant behaviour in millions of
electronic Medicare records poses unique challenges due                  As part of MA’s integrity program, the Prescription
to the unsupervised nature of the problem. In this paper,             Shopping Program aims at protecting the integrity of the
we investigate the problem of efficiently and effectively             PBS by identifying and reducing the number of patients
identifying potential non-compliant Medicare claimants in             obtaining medicine subsidised under the scheme in excess
Australia. We propose an unsupervised and data-driven                 of medical need (Medicare Australia, 2011). Automating
fraud detection system called UNISIM. It integrates                   the process of detecting possible prescription shoppers is
various techniques, such as feature selection, clustering,            very challenging in nature, due to:
pattern recognition and outlier detection. By utilising the                     Large amount of real-life medical data coupled
beneficial properties of these techniques, we are able to                       with complex and implicit correlations.
automate the detection process. Additionally, useful                            Noise is prevalent in real-life data hampering the
temporal patterns are extracted from the existing data for                      direct application of many state-of-art data
future analysis. Through extensive empirical studies,                           mining techniques (garbage in and garbage out).
UNISIM is shown to effectively identify suspects with
highly irregular patterns. Additionally, it is capable of                       Absence of holistic and standardised domain
detecting groups of outliers. .                                                 knowledge (from data miners’ point of view).
Keywords: unsupervised fraud detection; health data;                            Prescription behaviours are constantly evolving
Hidden Markov Models; temporal pattern recognition.                             (existing predictive models or past knowledge
                                                                                can become obsolete).
1     Introduction                                                              Minimising the number of false positive (i.e.
As a major service delivery program of the Department of                        identifying consumers as prescription shoppers
Human Services, Medicare Australia (MA) looks after the                         when they have legitimate medical reason for
health of Australians through efficient services and                            their PBS load)
payments, such as the Medicare Benefit Schedule (MBS),                   Two analytical systems have been developed in MA
the Pharmaceutical Benefits Scheme (PBS), the                         for facilitating efficient detection of prescription shoppers
Australian Childhood Immunisation Register and the                    by utilising the PBS data. The work in (Ng et al. 2010)
Australian Organ Donor Register. According to MA’s                    focuses on capturing the temporal (explicit) and spatial
annual report (Medicare Australia, 2011), the PBS                     (postcode-based) aspects of consumers’ prescription
subsidies the cost of listed prescription medicine and the            behaviours, whereas the paper (Mendis et al. 2011)
Repatriation PBS (RPBS) provides eligible veterans and                examines sequential prescription patterns from either a
war widows and widowers some additional medicines                     global or a localised view. Due to the complex nature of
and dressings at concession rates. In 2009-2010, MA                   human behaviours coupled with their implicit health
processed approximately 198 million services or $8.3                  conditions, there can be many different fraudulent cases
billion in benefits under the PBS and RPBS indicating an              with peculiar behavioural patterns. With some global
increase of 7.8% over the previous year. As part of the               knowledge (e.g. ranks about consumers prescription
Human Services portfolio, MA bears the responsibility                 history either cost-wise or quantity-wise), some cases can
for ensuring that public funds are used appropriately by              be easily detected yet most of them are disguised deeply
maintaining the integrity of the programs it administers.             amongst       genuine      consumers.     Considering     the
In 2009-2010 alone, MA recovered more than $10.2                      labour-intensive manual approach and the complex nature
million from compliance activities. With the                          of these cases, it is highly unlikely that all cases can be
unprecedented growth of services and payments, MA                     enumerated. Therefore, an automated and adaptive
                                                                      detection system is urged for complementing the existing
                                                                      systems.
Copyright © 2011, Commonwealth of Australia. This paper
appeared at the 9th Australasian Data Mining Conference               1.1     Contributions and Paper Organisation
(AusDM 2011), Ballarrat, Australia. Conferences in Research           In this paper, we investigate an important real-life fraud
and Practice in Information Technology (CRPIT), Vol. 121.             detection problem in the domain of health care data. Due
Peter Vamplew, Andrew Stranieri, Kok-Leong Ong, Peter                 to the complex nature of the underlying data, we divide
Christen and Paul Kennedy, Eds. Reproduction for academic,            the problem into a set of sub-problems and conquer them
not-for-profit purposes permitted provided this text is included.

                                                                                                                                   103
CRPIT Volume 121 - Data Mining and Analytics 2011
accordingly. We propose an unsupervised fraud detection prescribing doctor or prescriber. The set of PBS items
system called UNISIM targeting in particular prescription charged along with their respective costs to Medicare is
shoppers. UNISIM is comprised of a number of encapsulated in {(Item, Cost)}. Dos and Dop are two time
functional components namely feature extractor, cluster stamps recording the date of supply and the date of
builder, model constructor and outlier detector. Each prescribing. Additional consumer information is available
component is responsible for performing data mining from the consumer directory including consumer ID,
tasks including feature selection, clustering, pattern name, age, gender and address.
recognition and outlier detection, into an cohesive system.
Completing such an unsupervised system is not only 2.2 Problem Statement
technically more challenging but also more desirable in In Ng et al. (2010), three classes of drugs were identified
the practical data mining applications. We conduct as being susceptible to abuse by prescription shoppers
extensive experiments using real-life medical claim data. namely: opioids, benzodiazepines and psychostimulants.
The system can efficiently extract the hidden consumer A list of drug names and their respective classes are given
patterns with respect to their temporal prescription in table 1.
behaviours. We also demonstrate its effectiveness on
identifying potential prescription shoppers. Name Class
The remainder of the paper proceeds as follows. In Alprazolam Benzodiazepine
section 2, we describe the available data and formally Clonazepam Benzodiazepine
define the problem. Section 3 presents the design of
Diazepam Benzodiazepine
UNISIM. Technical details of UNISIM are provided in
Nitrazepam Benzodiazepine
section 4. UNISIM is extensively evaluated by using
Olanzapine Benzodiazepine
real-life datasets in section 5, and section 6 concludes the
Oxazepam Benzodiazepine
paper.
Quetiapine Benzodiazepine
Temazepam Benzodiazepine
2 Preliminaries
Buprenorphine Opioids
2.1 Available Data Codeine Opioids
Fentanyl Opioids
All Australian permanent residents and certain categories
Hydromorphone Opioids
of overseas visitors have access to the Medicare Program.
Methadone Opioids
MA pays benefits to any eligible person to cover a set
Morphine Opioids
proportion of their incurred medical expenses. A
Oxycodone Opioids
consumer needs to lodge his/her medical bills in terms of
Tramadol Opioids
claims through MA in order to get the relevant benefits.
MA stores these claims in transactional databases. Each Dexamphenidate Psychostimulant
transaction record holds rich information including Methylphenidate Psychostimulant
consumer details and medical provider details (e.g. name, Table 1: target drugs
the date and type of service provided). Additionally, there
are reference databases which contain information about Besides the above highly specialised knowledge, some
various MA services. Since we are mainly interested in fragmental and intuitive indicators about typical
identifying prescription shopping consumers (i.e. prescription shopping can be:
fraudulently gaining access PBS medications in excess of Contradicting drug prescription (e.g. sleeping
legitimate medical need), we focus ourselves on data tablets versus stimulative tablets).
pertaining to consumers and their respective PBS drug Visiting a diversity of doctors for similar types
prescription details.
of drugs.
In general, MA stores consumer data in three different
databases namely consumer directory for general Excessive drug quantities over a set period.
information, MBS claims for medical services and Sudden changes in prescription behaviours.
consultations, and PBS claims for drug prescriptions. Recurrent large temporal gaps after getting lots
Linking both MBS and PBS databases would be of drugs.
beneficial for substantiating the genuine drug needs of a The main objective of this paper is to propose a
consumer. Unfortunately, we are only allowed to derive workable fraud detection system. It is required to identify
data from one of them due to the existing privacy consumers with irregular prescription behaviours over a
legislation. Therefore, the PBS data is chosen for the certain period of time (e.g. 1 to 4 years). Defining
purpose of countering prescription shoppers. accurate notion of irregularity, to some extents, requires
Each consumer, who obtains subsidised PBS drugs, is inputs from domain experts, which adds extra overheads.
represented by at least one transaction in the PBS Instead, the system needs to autonomously derive and
database. For an example, each transaction may take the identify such patterns. Since the eventual users of the
following form: system are mainly non-technical and business-oriented,
rendering interpretable results also plays a vital part.
(PhID, PrID, {(Item, Cost)}, Dos, Dop) Overall, the resultant system needs be unsupervised and
flexible due to the absence of labelled data and
where PhID is the identifier of the pharmacy at which the practicality issues.
drugs are supplied and PrID uniquely identifies the
104Proceedings of the 9-th Australasian Data Mining Conference (AusDM'11), Ballarat, Australia
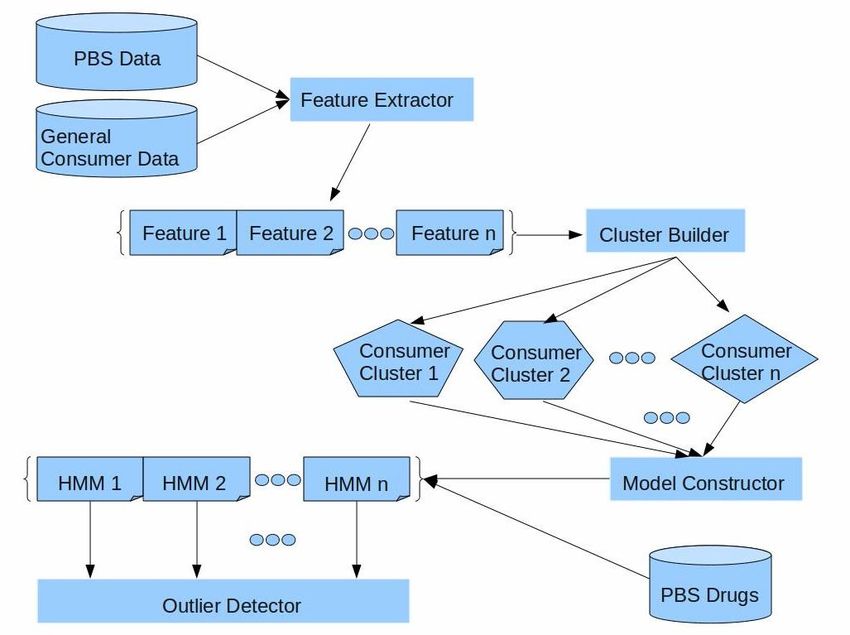
Figure 1: A high-level view of UNISIM
patterns), each record is rich in features in terms of
3 UNISIM - A Holistic View various types of attributes. Feature rich datasets have
The proposed system consists of several components as benefits and disadvantages. On one hand, they are
follows: beneficial for representing the underlying data with
various characteristics and granularities. On the other
Feature extractor. It harvests the PBS database
hand, the curse of dimensionality can hamper the
and the general consumer directory for
performance of existing data mining techniques (e.g.
constructing and preparing featured consumer
clustering and outlier detection). It is mainly because the
prescription data.
projected data points become sparser with the increase of
Cluster builder. It examines the constructed feature dimensionalities (database attributes). The earlier
consumer data and labels them on certain criteria work (Ng et al. 2010 and Mendis et al. 2011) was
(e.g. frequency of drug prescriptions or conducted mainly on grouped consumer prescription data
similarity of temporal prescription sequences). based on postcodes. This grouping, to a limited extent,
Model constructor. It learns hidden temporal captures the spatial correlation of consumers’ behaviours
patterns from the identified clusters of with respect to their drug prescriptions. The benefit can
consumers and builds respective Hidden Markov drown in the pool of noisy data introduced by people with
Models (HMMs) (Rabiner 1989) for capturing different demographics.
consumers’ implicit prescription patterns The overall aim of the feature extractor is to
according to their cohorts. judiciously select a subset of feature attributes for
representing the consumer prescription activities in a
Outlier detector. It generates an n-dimensional
score vector for each consumer then compares more compact way. These more compressed features can
each consumer against his/her reachable peers to then facilitate more efficient data mining practices and
derive a final outlier-ness score. lead to better results. Intuitively, consumers of similar
Figure 1 depicts how these components logically fit ages may suffer similar types of illness resulting in
into a common framework. Potentially we can utilise demands for similar drugs. Likewise, the clinical
different methods or techniques for each component. functions of certain drugs may be specific to a particular
Such a semi-open and modularised design maximises the gender. Therefore, both age and gender can serve as good
flexibility of the system and changes to each component discriminative features.
can easily be localised. The temporal nature of prescription data carries
essential information. As mentioned earlier, the
4 Technical Design transactional PBS data is in the form of (PhID, PrID,
(Item, Cost), Dos, Dop). Collectively, each consumer can
In this section, the intriguing details about each have a sequence of drugs prescribed over a certain period
component are covered and discussed. of time (e.g. quarterly or yearly) by simply appending
them together chronologically. Though such a flat
4.1 Feature Extractor
structure alleviates some workload for the later
Feature extraction is a process attempting to filter out processing steps, it can consequently cause the loss of
components of a data record which are irrelevant to the temporal information. Therefore, we decide to
task at hand. Albeit the stored PBS data can be concatenate each consumer’s temporal drug prescriptions
problematic (e.g. noise in terms of highly irregular
105CRPIT Volume 121 - Data Mining and Analytics 2011
into a multi-set. Formally, let I = {in | n > 0} be a set of where d= max{d1, …, dk} is the largest distance amongst
all the available prescription drug items. A subset of these Si ’s KNN and l = ||{Sj S | dist(Sj, Sj) < d}|| is the
items can be organised into an itemset X = {jm | jm I, 0 number of reachable neighbours. The clustering
m n}. The itemset symbolises a transaction of algorithm called Uniform kernel KNN clustering
prescribed drugs. A consumer can accumulate a sequence consisting of three steps as follows (Kum et al. 2003):
of transactions over a specified period, which is denoted Step 1. Initialise every sequence as a cluster.
as S = 0>. Eventually, a sequence is constructed
and attached to each consumer. Step 2. Merge nearest neighbours based on the
The feature extraction and dimensionality reduction is density of sequences.
an important research field. Our approach relies on Step 3. Merge based on the density of clusters.
simple yet effective intuitive knowledge. There exist The logical output is a set of cohorts so that consumers
various more sophisticated methods such as Principle having similar prescription patterns over the specified
Component Analysis (Kirby and Sirovich 1990), Linear period are organised into the same cluster.
Discriminant Analysis (Swets and Weng 1996) and
eigenvalues based analysis (Nguten and Gopalkrishnan 4.3 Model Constructor
2010). Each of them has benefits and disadvantages. We The main idea behind the model constructor is to model
are planning to investigate their applicability in the clustered prescription sequences by the stochastic process
future. of an HMM (Rabiner 1989). The HMM is a double
embedded stochastic process with a finite set of states
4.2 Cluster Builder governed by a set of transition probabilities. It is widely
Clustering techniques can be used to efficiently explore used in various applications including bioinformatics,
the data and reduce noise. Such an explorative approach speech recognition, and genomics (Smyth 1994 and
can effectively group similar consumers based on their Srivastava et al. 2008). In contrast to typical classification
sequential prescription activities. Mining on sequential methods, the HMM requires no labelled data and is
prescription patterns is challenging, thus contributing to relatively robust in the presence of noisy data.
the combinatorial nature of the problem. A density-based A typical HMM has the following characteristics
clustering algorithm called ApproxMAP (Kum et al. (Rabiner 1989):
2003) is adopted for accomplishing the task. It favours N is the number of states in the model. A set of
discovering approximate and long patterns over short and N states is denoted as H = {hj | i =1, 2, 3,… , N}.
trivial ones. The hierarchical edit-distance is utilised for qt represents the state at time instant t.
calculating the logical distances between prescription
sequences of different consumers. An edit can be of type M represents the number of unique observation
insertion, deletion or replacement. The cost is defined as symbols per state, which corresponds to the
the minimum editing operations required to change one physical output of the system being modelled.
sequence to the other. For example, changing (p, e, t) into The set of symbols is denoted as V = {vk | k =1,
(p, e, t, e, r) incurs two-unit of cost (e.g. two insertion 2, 3, …, M}.
operations). The cost associated with a replacement is The state transition probability matrix A = [aij],
assumed to be less than or equal to the aggregated cost of where aij = P(qt+1 = hj | qt = hi ), 1 i, j N and t
an insertion and a deletion. Formally, we denote IND() as > 0. For all i and j, we have aij > 0 indicating
the cost for either an insertion or a deletion and REPL() that any state can be reached by any other state
as a replacement cost. The eventual edit-distance D(S1, in a single step.
S2), between two sequences S1 = 0> and S2 = < The observation symbol probability matrix B =
Ym | m > 0>, can be computed by dynamic programming [bj(k)], where bj(k) = P(vk | hj), 1 j N, 1 k
using a set of recurrence relations (Kum et al. 2003). We M and 1 k M bj(k) = 1, 1 j N.
can then derive a normalised distance dist(S1, S2) by
dividing D(S1, S2) by max(||S1||, ||S2||) (e.g. the length of The initial state probability distribution i = P(q1
the longer sequence). The calculation of REPL() is based = hj),1 i N.
on Sørensen coefficient (Sørensen 1957) reflecting the A sequence of observations O = {ol | l = 1, 2, …,
normalised set difference. R}, where each observation ol is one of the
Given a database of sequences S, the density of each symbols from V. R is the number of observations
sequence Si is calculated based on its k-nearest from sequence O.
neighbours (KNN) as follows: A complete specification of an HMM model requires
l two model parameters (N and M) and three probability
density (Si) measures (A, B and ), which can be denoted as
|| S || d
.
106Proceedings of the 9-th Australasian Data Mining Conference (AusDM'11), Ballarat, Australia
probability based on the given HMM. The number n is
To build HMMs for capturing the common tuneable based on the results from the cluster builder.
prescription behaviours from consumer cohorts, we
incorporate the consumer-visiting-prescriber pattern into
various states denoted as H = {h1, …, hN}, N > 0. Each
sate indicates a consumer visit to a unique prescriber (e.g.
the first time visit), otherwise the visit is not considered
as unique and can be mapped accordingly based on the
PrID and the respective state. Therefore, a temporal
visiting pattern can be organised into a sequence of
various states, for instance, (h1, h1, h2, h3, h4, h3).
Considering the large number of registered prescribers,
we decided to focus on the intra consumer and prescriber
relations (visits) aspects of the problem. Each prescriber
visit can incur certain drug prescriptions, and we can
model them as physical outputs from the set V of all
observable outputs (e.g. all PBS drugs stored in the PBS
database). Modelling all PBS drugs can make the model
cumbersome and even infeasible due to two factors.
Firstly, it can increase the training time dramatically.
Secondly, derived probabilities associated with rare drugs
can be extremely small, thus hampering the performance Figure 2: An auxiliary HMM
of HMM. Therefore, a compressed list of drugs
(observations) is utilised, which covers all targeted drugs 4.4 Outlier Detector
in table 1. Additionally, we establish a generic drug The model constructor provides a common ground for
observation for capturing all non-targeted ones. Based on comparing prescription behaviors of different consumers.
these two sets, a sample HMM is shown in figure 2. Medicare consumers, based on their temporal activities,
The state h0 is a dummy state representing the start and are projected into an n-dimensional hyper-plane (e.g. n
the end of a consumer’s temporal pattern. Likewise, the consumer cohorts and their respective HMMs), and each
v0 is an artificial observation symbol for the sake of dimension implies a featured pattern encoded as an
model integrity and consistency. The inference of HMMs HMM. The spatial distance between any two consumers
also requires tunning parameters for three probability then can be computed. Various distance metrics (Cha
distributions (e.g. A, B and ), which is essentially an 2007) are available for facilitating the task. Since each
optimisation problem. Given an observation sequence O HMM score implicitly conveys the likelihood of a
= {o1, o2, …, ot}, the objective is to estimate = ( ) consumer being a member of the respective cohort, we
so that P( ) is maximised. We adopt the well-known adopt the City Block distance (Cha 2007) to augment the
Baum-Welch algorithm (Rabiner 1989), which can be difference between two score vectors along all
described as follows: dimensions. Based on these spatial distances, we can
Input: O = {o1, o2, …, ot} and . adopt outlier detection techniques to automate the process
Output: ( ) of identifying potential fraudulent consumers. The LOCI
(Local Correlation Integral) (Papadimitrious et al. 2003)
Step 1: Let initial model be 0. is adopted as the underlying outlier detector, which
Step 2: Compute new model based on 0 and produces outlier-ness scores rather than binary YES or
observation sequence O. NO answers. It is a density-based approach, which is
Step 3: If log(P( )) - log(P(O| 0)) < go to effective on discovering micro-clusters (e.g. groups of
Step 5. outliers). Additionally, it uses statistical reasoning (such
as standard deviation) to determine the outlier-ness.
Step 4: Else set 0 and go to Step 2. We briefly describe some terms used in the LOCI and
Step 5: Stop. detailed algorithm description can be found in
where we consider a uniform distribution model for (Papadimitrious et al. 2003).
initializing 0. r-neighbourhood of an object pi: a set of objects
For each of the consumer cluster, a profile HMM is within r distance of pi.
inferred. These profiles then can be used to evaluate new
consumer prescription patterns, namely given a model 1 n(pi ): the number of objects in the
= (A1, B1 1) and a sequence of observations Onew, we –neighbourhood of pi.
can compute the probability (Pr) that the sequence is ñ(pi ): the average number of objects over all
produced by the model. For each new consumer, we can objects p in the r-neighbourhood of pi.
examine his/her prescription patterns against each HMM, Multi-granularity deviation factor (MDEF) for pi
from which an n-dimensional scoring vector (Pr1, Pr2, …, at radius r:
Prn) can be derived. The forward and backward algorithm
(Rabiner 1989) is adopted to efficiently compute each n ( pi , r )
MDEF ( pi , r, ) 1
ñ( p i , r, )
107CRPIT Volume 121 - Data Mining and Analytics 2011
Standard deviation of n(pi, ) over the experiments. Instead, we briefly discuss how suitable
r-neighbours: values can be selected.
There is a trade-off for choosing the number of
p N ( pi , r )
(n( p, r ) ñ( pi , r, )) 2 clusters. On one hand, more clusters can reflect
ñ ( pi , r, ) finer-granularity of the underlying cohorts and HMMs.
n( pi , r) On the other hand, data is inevitably projected into
Normalised deviation: higher-dimensional spaces, which can hamper the
performance of the outlier detector. Additionally,
( pi , r, ) building more clusters incurs more overheads in terms of
ñ
MDEF ( p i , r , )
time taken to train HMMs, data projection and spatial
ñ( p i , r, ) distance calculations. We find that a value between 3 and
5 is experimentally sufficient to produce promising
The above terms essentially reflect the local integral results. The number of HMM states implies the number
correlation with respect to each projected data point (e.g. of unique prescribers that a consumer visits over a year.
each consumer). Given a distance within [rmin, rmax], we A value of 100 proves to be large enough, and it is almost
can compute the value of MDEF(pi, r, ) with MDEF(pi, r, impossible for a consumer to visit that many doctors over
) and evaluate how far they deviate from each other. a year. It can be used as an upper bound for designing the
Alternatively, both rmin and rmax can be replaced by the number of HMM states. Throughout various experiments,
number of neighbours for comparison so that they can be a few consumers are identified as visiting a large number
dynamically identified. of unique doctors (e.g. 45). Though these consumers
The automated outlier detection process can efficiently represent an absolute minority, it is necessary to make the
narrow down the number of potential prescription total number of allowable states large enough. As
shoppers, which enables more effective and targeted mentioned before, we utilise a compressed list of
manual investigation by medical experts. observation symbols (e.g. prescription drugs). All
targeted drugs are uniquely denoted, whereas a generic
Parameter Value Range observation symbol is defined to cover the rest of the
No. of clusters 3 to 5 drugs covered by the PBS. The list can be easily extended
No. of HMM states 50 to 100 to target more drugs. The number of LOCI neighbors for
No. of HMM observation symbols 42 to 100 comparison can be set to a range of values between 10
No. of LOCI neighbours 10 to 20 and 20, which indicates coverage of 100 to 200 data
Times of deviation 2 to 4 objects. Finally, the value for times of deviation
represents the tolerance towards considering an outlying
Table 2: parameter setting data object. It can be tuned accordingly to facilitate
varying investigation scope.
5 Experimental Results
We have conducted extensive experimental studies to 5.1 Detecting Known Outlying Consumers
evaluate the performance of UNISIM. The system is Due to the unsupervised nature of UNISIM, we first
implemented in C++ and OpenMP directives are inserted examine its validity through a mock-up dataset. The
wherever possible to allow the parallelising of functional dataset contains a sample of 1938 MA consumers along
computations. A standalone workstation hosts the system, with a year worth of their prescription activities. These
which has 8 CPU cores @ 2.66GHz and 32 GB of main individuals are randomly picked from the studied
memory. The underlying operating system is Ubuntu demographics. Through previous studies (Ng et al. 2010
version 10.04. A year worth of consumer data is extracted and Mendis et al. 2011), we obtain 20 identified outlying
from the PBS and consumer directory databases for all consumers resembling similar temporal behavioural
eligible Australian residents. For the purpose of this paper, patterns. They are deliberately injected into the sample
we further select consumers with certain demographics dataset. Based on the HMM scores (e.g. the likelihoods of
(e.g. male aged between 30 and 39), which has a each consumer belonging to respective HMMs), we can
population of more than 300,000. We randomly choose treat each consumer as a data point in a 3-dimensional
1% of the sampled consumers for building cluster cohorts hyper-plane. We plot these points in figure 3. For the sake
and training the HMMs. The training dataset size is not of presentation, each HMM score is multiplied by
only manageable but also sufficient for building 100,000. As it can be seen, the majority of data points are
consumer behavioural models. It is largely because we crammed together posing challenges for visual analysis.
focus on extracting common prescription patterns. Furthermore, outlying consumers are generally good at
Additionally, HMMs are intrinsically robust to noisy disguising themselves by emulating patterns of genuine
data. Experimentally, the size of 1% is reasonably consumers.
well-balanced between under-training and over-fitting the As it can be observed from table 3, all 20 outlying
HMMs. The training dataset is excluded from the consumers are successfully detected by UNISIM. The
proceeding testing. outlier-ness score is calculated as the difference between
Table 2 presents the set of parameters along with their MDEF and 3 times of MDEF. The bigger the score, the
value ranges required for UNISIM. Due to the more likely a data point can be classified as an outlier. A
departmental policy, we are restrained on revealing exact value of 0.57414 is big enough to indicate further
parameter values that have been used during our investigation is warranted. Experimentally, we have
found that the score is monotonically increasing. It is
108Proceedings of the 9-th Australasian Data Mining Conference (AusDM'11), Ballarat, Australia
worth noting that UNISIM is also capable of identifying a compromised of temporal prescription data of 10,253
group of outliers. In this particular case, the group of random consumers selected from the studied
known outlying consumers all have the same outlier-ness demographics sample. Considering the sheer quantity of
score, which is a very appealing feature. As table 3 all involved transactions, manual investigation is deemed
shows, all 20 pre-identified fraudulent consumers belong to be infeasible.
to one group, which can be regarded as an outlier group. Before delving into individual results comparison
In terms of HMM scores, all these consumers are against each consumer, we focus on the group results
characterized with significantly small scores (e.g. close to generated by UNISIM so that we can observe some
0) implying that their behavioural patterns are highly attractive features of it. Overall, there are 5,489
irregular compared with common consumers (e.g. consumers identified by the system having a greater than
captured patterns during the HMMs training). 0 outlier-ness score. Such a large number shows that the
real-life data is indeed very complex (e.g. irregular
patterns from genuine consumers). Interestingly, some
groups of outliers are amongst them (e.g. same score with
similar prescription patterns). Table 4 shows 5 such
groups along with their respective outlier-ness scores and
number of members. Together they represent a population
of 3,579 consumers or around 65% of 5,489 consumers
(outlier-ness score > 0). By closely analysing the patterns
in group 1, we can observe that all its member consumers
have one-off prescription over the chosen year. They can
be easily filtered before further investigation. All four
other groups have the similar properties. The capability of
detecting micro-clusters of outliers allows us to quickly
examine a group of consumers with similar temporal
behaviours. Accordingly, we are able to effectively filter
them out before further more costly investigation. For
example, if we set the cut-off value to above 0.44901,
there is an instant reduction of 87% leaving 693 potential
suspects. It is very flexible to scope the investigation by
the eventual business users.
Figure 3: HMM score plot
Group ID Outlier-ness Number of
Score Consumers
De-identified Consumer ID Outlier-ness Score 1 0.44901 1974
1 0.57414 2 0.449009 656
2 0.57414 3 0.159298 545
3 0.57414 4 0.335087 270
4 0.57414 5 0.155503 134
5 0.57414
6 0.57414 Table 4: representative outlier groups
7 0.57414
8 0.57414 De-identified Consumer ID Outlier-ness Score
9 0.57414 1 6.68674
10 0.57414 2 6.65758
11 0.57414 3 6.53518
12 0.57414 4 6.46845
13 0.57414 5 6.35029
14 0.57414 6 5.97089
15 0.57414 7 5.97089
16 0.57414 8 5.71688
17 0.57414 9 5.32089
18 0.57414 10 5.27353
19 0.57414
Table 5: top 10 individual outlying consumers
20 0.57414
We further examine the top 10 individual consumers
Table 3: known outlying consumers and their scores and their prescription patterns, which are included in
table 5. On average, 4 different doctors have been visited
5.2 Detecting Unknown Outlying Consumers by these consumers. The transaction records reveal that
In this section, we study the generalised performance of some extreme cases have multiple visits to different
UNISIM over unlabelled data. The dataset is doctors on one day. By looking at their prescription
109CRPIT Volume 121 - Data Mining and Analytics 2011
drugs, we can notice that the majority of them are Conference on Data Mining, San Francisco, California,
targeted ones (i.e. listed in table 1 as suggested by subject USA, pp311-315.
matter experts). With such a combination, we can Medicare Australia (2011): Medicare Australia Annual
confidently classify the consumer as suspicious and pass Report 2009-2010.
the information onto the compliance division for further http://www.humanservices.gov.au/spw/corporate/publi
investigation. cations-and-resources/annual-report/medicare/index.ht
ml. Accessed 29 July 2011.
6 Conclusion and Future Work
Mendis, B.Sumudu.U., Murray, D.W., Sutinen, A., Tang,
The main focus of the paper is unsupervised fraud M.J. and Hu, Y.S. (2011): Enhancing the Identification
detection particularly targeting MA claimants with of Anomalous Events in Medicare Consumer Data
potential prescription shopping behaviours. We propose a Through Classifier Combination. Proc. 6th
data-driven system, called UNISIM, for tackling the International Workshop on Chance Discovery,
problem. UNISIM is comprised of comprehensive data Barcelona, Spain, pp39-44, Springer Press.
mining components including feature extractor, cluster
builder, model constructor and outlier detector for Ng, K.S., Shan, Y., Murray, D.W., Sutinen, A., Schwarz,
effective and efficient analysis of MA consumer data. B., Jeacocke, D. and Farrugia. J. (2010): Detecting
Importantly, we provide effective HMM for encoding Non-compliant Consumers in Spatial-Temporal Health
essential knowledge into UNISIM enabling it to automate Data: A Case Study from Medicare Australia. Proc.
the fraud detection process. We have demonstrated the IEEE International Conference on Data Mining
effectiveness of UNISIM on detecting potential Workshops, Sydney, Australia, pp613-622, IEEE Press.
non-compliant consumers using real-life health care data. Nguyen, H.V. and Gopalkrishnan, V. (2010): Feature
We need to emphasise that UNISIM itself serves as a Extraction for Outlier Detection in High-Dimensional
complementary tool to assist with the subject matter Spaces. Proc. 4th Workshop on Feature Selection in
experts. For consumers identified as obtaining large Data Mining, Hyderabad, India, pp64-73.
quantities of PBS medications, we are still reliant on the Papadimitriou, S., Kitagawa, H., Gibbons, P.B. and
subject matter experts to decide if they have behaved Faloutsos, C. (2003): LOCI: Fast Outlier Detection
fraudulently. Using the Local Correlation Integral. Proc. 19th
In the future, we are planning to experiment with International Conference on Data Engineering
different techniques or algorithms other than the ones that (ICDE'03), California, USA, pp.315, 2003
have been implemented. Currently, complex real-life Rabiner, L.R. (1989): Investigating Hidden Markov
interactions, either explicit or implicit, are not the focus Models Capabilities in Anomaly Detection. Proc.
of UNISIM. Capturing these coupled and intriguing IEEE, vol. 77, no. 3, pp357-286, 1989.
relations are technically challenging yet can be beneficial
especially for identifying more professional and Smyth, P. (1994): Markov Monitoring with Unknown
organised fraud. The HMM can be built differently (e.g. States. IEEE Journal on Selected Areas in
to introduce contradictions). We expect to design and Communications, vol. 12, no. 9, pp1600-1612, 1994.
implement other stochastic models for evaluating Sørensen, T. (1957): A method of establishing groups of
consumer patterns. equal amplitude in plant sociology based on similarity
of species and its application to analyses of the
7 Acknowledgements vegetation on Danish commons. Biologiske
The authors wish to thank Dr. David Jeacocke for his Skrifter/Kongelige Danske Videnskabernes Selskab,
helpful clinical insights. We would also like to thank vol. 5, no. 4, pp1-34, 1957.
Leonie Greenwood, Thach Van, Alex Dolan, Rory King, Srivastava, A., Kundu, A., Sural, S. and Majumdar, A.K.
and Paul Cowan for providing timely management (2008): Credit Card Fraud Detection Using Hidden
support for this paper. Last but not least, we are grateful Markov Model. IEEE Transactions on Dependable and
for invaluable comments from both reviewers for making Secure Computing, vol. 5, no. 1, pp37-48, 2008.
any improvement on the paper possible. Swets, D.L. and Weng, J.Y. (1996): Using Discriminant
eigenfeatures for image retrieval. IEEE Transactions
References on Pattern Analysis and Machine Intelligence, vol. 18,
Cha, S.H. (2007): Comprehensive Survey on no. 8, pp831-836, 1996.
Distance/Similarity Measures between Probability
Density Functions. International Journal of
Mathematical Models and Methods in Applied
Sciences, vol. 1, no. 4, pp300-307, 2007.
Kirby, M. and Sirovich, L. (1990): Application of the
Karhunen-loeve procedure for the characterization of
human faces. IEEE Transactions on Pattern Analysis
and Machine Intelligence, vol. 12, no. 1, pp103-108,
1990.
Kum, H.C., Pei, J., Wang, W. and Duncan, D (2003):
ApproxMAP: Approximate Mining of Consensus
Sequential Patterns. Proc. 3rd SIAM International
110You can also read