Earthquakes on the surface: earthquake location and area based on more than 14 500 ShakeMaps - NHESS
←
→
Page content transcription
If your browser does not render page correctly, please read the page content below
Nat. Hazards Earth Syst. Sci., 18, 1665–1679, 2018
https://doi.org/10.5194/nhess-18-1665-2018
© Author(s) 2018. This work is distributed under
the Creative Commons Attribution 4.0 License.

Earthquakes on the surface: earthquake location and
area based on more than 14 500 ShakeMaps
Stephanie Lackner
Woodrow Wilson School of Public and International Affairs, Princeton University, Princeton, NJ 08544, USA

Correspondence: Stephanie Lackner (slackner@princeton.edu)

Received: 28 November 2017 – Discussion started: 18 January 2018
Revised: 23 May 2018 – Accepted: 31 May 2018 – Published: 20 June 2018

Abstract. Earthquake impact is an inherently interdisci-             ever, the literature commonly uses magnitude or other sub-
plinary topic that receives attention from many disciplines.         optimal measures to quantify the natural hazard of earth-
The natural hazard of strong ground motion is the reason             quakes for impact research. The physical phenomenon of
why earthquakes are of interest to more than just seismol-           strong ground motion does often not receive enough atten-
ogists. However, earthquake shaking data often receive too           tion and the literature lacks an interdisciplinary discussion of
little attention by the general public and impact research in        the natural hazard of earthquake-related surface shaking.
the social sciences. The vocabulary used to discuss earth-              Earthquake risk communication is generally considered
quakes has mostly evolved within and for the discipline of           a high priority topic and many research and practical ef-
seismology. Discussions on earthquakes outside of seismol-           forts are concerned with educating the public and improv-
ogy thus often use suboptimal concepts that are not of pri-          ing preparation. The Southern California Earthquake Center
mary concern. This study provides new theoretic concepts             (SCEC), for example, has started the Great California Shake-
as well as novel quantitative data analysis based on shaking         Out (Jones and Benthien, 2011), which has become an an-
data. A dataset of relevant global earthquake ground shaking         nual drill with millions of participants. The Global Earth-
from 1960 to 2016 based on USGS ShakeMap data has been               quake Model (GEM) project is an international effort to de-
constructed and applied to the determination of past ground          velop a global model of earthquake risk as an open-source,
shaking worldwide. Two new definitions of earthquake lo-             community-driven project (Crowley et al., 2013, https://
cation (the shaking center and the shaking centroid) based           www.globalquakemodel.org/, last access: 10 May 2018), and
on ground motion parameters are introduced and compared              the Global Seismic Hazard Map project (GSHAP) has pro-
to the epicenter. These definitions are intended to facilitate       moted a regionally coordinated, homogeneous approach to
a translation of the concept of earthquake location from a           future seismic hazard evaluation, including the production
seismology context to a geographic context. Furthermore, the         and distribution of a global seismic hazard map (Giardini,
first global quantitative analysis on the size of the area that is   1999). Technological progress has also allowed for the emer-
on average exposed to strong ground motion – measured by             gence of real-time seismology, which provides real-time in-
peak ground acceleration (PGA) – is provided.                        formation about an event during and in the immediate after-
                                                                     math of an earthquake (Kanamori, 2008).
                                                                        For research on earthquake impacts, an appropriate under-
                                                                     standing of the physical hazard of past earthquake shaking
1   Introduction                                                     as well as access to relevant data are necessary. However,
                                                                     earthquake communication about past events is a relatively
Earthquakes receive a lot of attention from the general public       neglected topic and many authors struggle with the incon-
as well as numerous disciplines across the natural and social        sistent – and sometimes inadequate – approaches in the so-
sciences. With the notable exception of seismology, most of          cial science literature (Kirchberger, 2017). This study utilizes
them are primarily or even exclusively concerned with the            USGS ShakeMap data (Wald et al., 1999) – a real-time seis-
surface phenomenon and the impacts of earthquakes. How-

Published by Copernicus Publications on behalf of the European Geosciences Union.
1666                                                                                 S. Lackner: Earthquakes on the surface

mology product – to create a dataset of global past shaking       and for several decades. For this study 14 608 ShakeMaps
exposure. Natural hazard exposure maps are necessary for          of earthquakes from 1960 to 2016 have been compiled into
impact research, and they also allow one to spatially over-       one dataset. Each ShakeMap consists of observed instrumen-
lap the natural hazard with social variables representing vul-    tal ground motion parameters where available and estimates
nerability or preparedness. This study provides a discussion      from models based on ground motion prediction equations,
and quantitative analysis of global earthquake ground shak-       nearby observations, and other data, where no observations
ing and variables of interest that can be calculated from such    exist. The ShakeMap methodology is continuously improved
data.                                                             and documented in numerous publications, which can be
                                                                  found through the USGS website (https://earthquake.usgs.
                                                                  gov/data/shakemap/background.php, last access: 10 May
2   Shaking data                                                  2018).
                                                                     In December 2016 all online available USGS ShakeMaps
Many different factors about an earthquake play impor-            were collected and combined into one dataset for this study.
tant roles in what kind of shaking is experienced on the          The ShakeMaps were combined with the GPWv4 grid-
Earth’s surface. Douglas (2003) classifies them into three cat-   ded Land and Water Area (CIESIN, 2016) to restrict the
egories: those related to the earthquake source (e.g., magni-     ShakeMaps to only on surface land shaking. Except for
tude, depth, or faulting mechanism), travel path (e.g., geol-     one event in 1923, ShakeMaps generally exist starting from
ogy can have a significant impact on attenuation), and lo-        1960, and they are systematically available from 1973 on-
cal site conditions. The prediction, estimation, and record-      wards. The representativeness of the sample of earthquake
ing of strong ground motion parameters are active fields of       ground shaking in the dataset compared to all earthquake
ongoing research and technological improvements (Douglas,         ground shaking in the time period is assessed by matching
2003; Denolle et al., 2014; Wald et al., 2011; Caprio et al.,     the ShakeMap data to two different earthquake lists, which
2015; Kong et al., 2016). SCEC, for example, has a Ground         allows a cross validation. Since not every earthquake has
Motion Prediction Working Group.                                  a ShakeMap, a reference dataset of all (or at least almost
   Strong ground motion can be expressed with different pa-       all) earthquakes since 1960 is required. For this purpose the
rameters, but it is commonly characterized by peak ground         ANSS Comprehensive Earthquake Catalog (ComCat, 2017)
acceleration (PGA), peak ground velocity (PGV), and peak          is used. More information on the ComCat data can be found
ground displacement (PGD). More sophisticated measures            in Appendix A. Finally, the NGDC Significant Earthquake
such as response spectra or Arias intensity (Arias, 1970)         Database (NGDC/WDS, 2017) is applied as an additional
generally provide a better characterization of strong ground      reference dataset and to assign impacts to events (the impact
motion (Joyner and Boore, 1988), but such data are not as         data will be used in future research). The combination of the
easily available as PGA or PGV. No individual index of            three earthquake data sources can help to identify how rep-
strong ground motion is ideal to represent the entire fre-        resentative the aggregated ShakeMap dataset is for all global
quency range, but peak ground motion parameters are con-          earthquake ground shaking. Details on how the three datasets
sidered to perform satisfactorily (Riddell, 2007).                were linked with each other are described in Appendix B.
   This study will focus on PGA as the ground motion pa-             As a result, the dataset can be considered to contain all rel-
rameter. However, PGA alone only provides a limited repre-        evant global earthquake ground shaking from January 1973
sentation of ground motion. To represent the entire frequency     to October 2016, a reasonable sample from 1970 to 1972,
range more appropriately a multi-parameter characterization       and shaking from individual devastating events from 1960 to
of ground motion is commonly used (e.g., for selected earth-      1969. However, the sample is more complete in later years,
quakes the ShakeMap product also provides response spectra        in that it contains more weaker events. For smaller events the
maps at periods of 0.3, 1, and 3 s – according to three Uni-      dataset has a bias towards North American events, which can
form Building Code reference periods). Nevertheless, while        be avoided by restricting the sample to only events with a
appropriate in engineering, a multi-parameter approach is not     magnitude of 5.5 or greater. However, reducing this thresh-
reasonable for many social science applications. PGA is still     old to 4.5 is generally sufficient to avoid this bias. Details on
widely use in earthquake engineering, and it provides the ad-     the representativeness of the ShakeMap dataset can be found
vantage of a single-valued parameter with good data avail-        in Appendix C.
ability. Expressing past shaking with PGA is also consistent
with the common approach of using PGA for earthquake haz-
ard maps.                                                         3   Past earthquake shaking
   While more sophisticated approaches to calculate ground
motion parameters (e.g., those employed by SCEC) than             Past earthquake shaking can be approached from two differ-
the ShakeMap methodology exist, USGS ShakeMaps are                ent angles, either comparing different locations or comparing
unique in providing consistent earthquake strong ground mo-       different events. First, we can consider the exposure of a lo-
tion data for a large number of events on a global scale          cation or region to past earthquake shaking of an individual

Nat. Hazards Earth Syst. Sci., 18, 1665–1679, 2018                        www.nat-hazards-earth-syst-sci.net/18/1665/2018/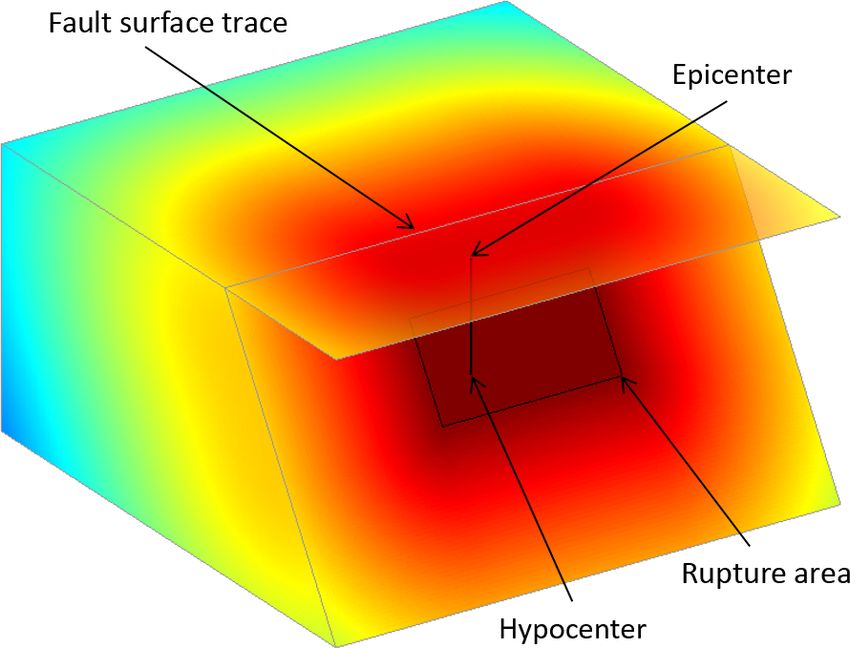
S. Lackner: Earthquakes on the surface                                                                                                 1667

Figure 1. Earthquake shaking history of 1973–2015. Panel (a) shows the average annual maximum shaking exposure and panel (b) provides
the average annual number of “big” shaking events by location. Panel (a) also illustrates some limitations of the data, such as the edges of
individual ShakeMaps and an over-representation of low shaking events in more populated regions (e.g., Australia). It is also important to be
aware that the shaking history is a combination of observed and estimated data for actual shaking exposure in the given time period.

event or to several events over a time period. The constructed           interest (e.g., cities in Australia). The visualization in Fig. 1b
dataset allows one to visualize the global past shaking expo-            avoids these limitations by restricting to shaking above a
sure. Hsiang and Jina (2014) term the average annual pixel               PGA of 10 %g and showing the number of events above that
exposure to maximum cyclone wind speeds the “cyclone cli-                threshold. Earthquake hazard maps are a common way to il-
mate”. This representation of past exposure to a natural haz-            lustrate where and what strength of future earthquake shak-
ard can be particularly useful in social science applications.           ing is likely to occur. Such maps are usually expressed in
In a similar way, the average annual pixel exposure to maxi-             PGA that is expected to be exceeded at a certain likelihood
mum PGA could be called the earthquake shaking “climate”.                within a given number of years (e.g., Shedlock et al., 2000).
Since earthquakes are not a climate phenomenon and past                  Using the maximum shaking over time instead of the average
exposure maps are not equivalent to future hazard maps, it               annual shaking allows one to compare the actually experi-
is more reasonable to refer to it as the earthquake shaking              enced shaking (or estimates of it) with the probabilistic esti-
history. Figure 1 illustrates the earthquake shaking history of          mates from hazard maps. To illustrate this potential applica-
1973–2015, the period for which the dataset is found to be               tion of ShakeMap data, a comparison of the earthquake max-
representative of overall shaking in the specific time range.            imum shaking history with the GSHAP global earthquake
However, some limitations of ShakeMaps become apparent                   hazard has been conducted and can be found in Appendix E.
in Fig. 1a: (i) the cutoff edges of the individual ShakeMaps                Second, the comparison of different past events can be the
are visible, (ii) some unrealistically high outliers might skew          main objective instead of comparing individual regional (or
individual pixels, and (iii) low shaking/impact events are               single coordinate) exposures. Two crucial aspects of a partic-
more likely to receive a ShakeMap when they are in areas of              ular earthquake are the location and the area affected by the

www.nat-hazards-earth-syst-sci.net/18/1665/2018/                                Nat. Hazards Earth Syst. Sci., 18, 1665–1679, 2018
1668                                                                                    S. Lackner: Earthquakes on the surface

shaking. It is, however, not straightforward to define these
concepts. An earthquake is caused by the rupturing of a fault
segment (illustrated in Fig. 2). The earthquake originates at
the hypocenter, but waves radiate out from the whole seg-
ment of the fault that ruptures (rupture area). This results in
the epicenter not being necessarily at the center of the strong
ground motion area. In the figure this depends on the size of
the rupture and the dip angle of the fault. Other factors such
as local site conditions and water bodies also affect where
strong ground shaking occurs. From a social science perspec-
tive the surface projection of the rupture area could actually
be considered to be more relevant than the epicenter – which
is the surface projection of the hypocenter. However, there
are numerous other factors that influence surface shaking and
even two earthquakes on the same fault can behave very dif-         Figure 2. Illustration of a fault plane and wave intensity. The earth-
                                                                    quake nucleates at the hypocenter, but waves radiate out from every
ferently due to their underlying rupture processes.
                                                                    point of the rupture area. For this reason as well as other factors
                                                                    (e.g., local site conditions and water bodies), the epicenter is not
                                                                    necessarily in the center of the strong shaking area.
4   Earthquake location

Earthquake location is currently primarily discussed within
and from the context of seismology. However, a translation          summarize the spatial component of earthquake ground mo-
to a geographic language would often be beneficial. Emer-           tion. While location information about earthquakes is often
gency response, hazard management, and regional planning            supplemented with qualitative statements (e.g., “the epicen-
often rely heavily on geographic parameters and the use of          ter is X km offshore” or “the most affected region is X km
geographic information systems (GIS). Tobler (1970) coined          south of city Y ”), the additional information does not nec-
the “first law of geography” stating that “everything is re-        essarily enhance the digestion of information. This is partic-
lated to everything else, but near things are more related than     ularly the case when the information provides details about
distant things”. It is therefore not surprising that the location   the complexities of a rupture process. Details such as rupture
is information about an earthquake that is of great interest        length or directivity are important aspects about an earth-
to the general public and disaster management. Furthermore,         quake in seismology and earthquake engineering, but they
the consideration of spatial effects (e.g., spatial autocorrela-    do not necessarily facilitate a better understanding for in-
tion and spatial heterogeneity) can be crucial in econometric       dividuals without the respective backgrounds and can even
models (Anselin, 2007) in the social sciences and requires to       contribute to confusion.
assign a location to each observation. Thus earthquake loca-           A simple geographic parameter that summarizes the shak-
tion can also be a crucial parameter in social science applica-     ing of an earthquake can facilitate a translation from seismol-
tions.                                                              ogy and engineering to a geographic context. Since many
   The currently most commonly used and calculated points           decision makers are familiar with such a geographic con-
to characterize earthquake location are the hypocenter and          text, this can enhance digestion of information by relevant
the epicenter. However, from a strong ground motion per-            individuals and groups. Moreover, in some social science
spective they are not the most interesting points. The epicen-      applications it is essential to be able to assign coordinates
ter is not necessarily a good proxy for where strong ground         to an individual event. Since the phenomenon of interest in
motion occurs, and it is thus not the optimal location choice       these applications is ground shaking, the purpose of this lo-
for many applications. When the epicenter is offshore it can        cation is to summarize shaking. So far, no formal definitions
also be far away from the strong shaking region, and it is          for earthquake locations based on ground motion parame-
not straightforward to assign the event to a country or region.     ters exist. This study will introduce two surface points other
Another earthquake location is the centroid location, such as       than the epicenter, both of which can be considered differ-
those calculated by the CMT project (Ekström et al., 2012).         ent definitions of the earthquake surface location: the shak-
The centroid location is the average location in space and          ing centroid and the shaking center. Both definitions are for-
time of the seismic energy release. However, the centroid lo-       mulated such that they can be applied to any ground motion
cation does also not account for water bodies and its surface       parameter. Nevertheless, this study specifically applies them
projection can thus often be far from the strong shaking area       to ShakeMap PGA data.
as well.                                                               The “shaking centroid” (xSCt , ySCt ) will be defined as
   In disaster management and planning as well as social            the average location (xi , yi ) of shaking si weighted by the
science applications, the desired location parameter should         squared shaking for a given ground motion parameter, only

Nat. Hazards Earth Syst. Sci., 18, 1665–1679, 2018                          www.nat-hazards-earth-syst-sci.net/18/1665/2018/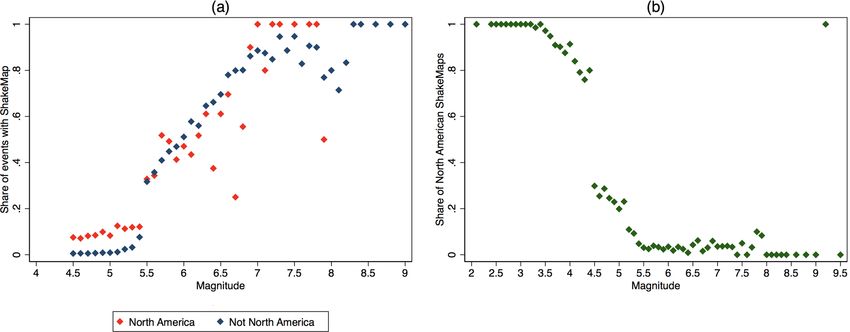
S. Lackner: Earthquakes on the surface                                                                                                              1669

including locations that experience at least 50 % of the max-                                 Padang, Indonesia (9/2009)
imum shaking smax of that event.                                                                                                                    80
                                                                     0.5
                                                                                                                        Shaking center
                 P                               2                                                                      Shaking centroid
                   i∈{i:si ≥0.5smax } (xi , yi )si                                                                      Epicenter                   70
(xSCt , ySCt ) =    P                       2
                                                          (1)
                        i∈{i:si ≥0.5smax } si                         0                                                                             60

   Restricting the included locations to the area with at least
                                                                                                                                                    50
50 % of the maximum shaking is chosen for two reasons.

                                                                                                                                                         PGA in %g
                                                                     -0.5
First, it helps to avoid the problem that ShakeMaps are usu-                                                                                        40
ally cutoff before the shaking has completely attenuated. Sec-
ond, it ensures that the shaking centroid represents a location      -1
                                                                                                                                                    30

that summarizes best the strong shaking area of the particular
                                                                                                                                                    20
event. The weaker shaking area is generally of less interest.
The squares of the ground motion parameter are also chosen           -1.5
                                                                                                                                                    10
to allow for a stronger weight of the high shaking locations.
Just like the epicenter, the shaking centroid could be a loca-                                                                                      0
                                                                                  98.5       99         99.5          100     100.5         101
tion that does not actually experience any shaking (when it
falls in water) or only relatively low shaking itself.               Figure 3. An example of a map of peak ground acceleration based
   In contrast, the “shaking center” (SC) is the point on the        on USGS ShakeMap data. The figure shows the locations of the
surface which experiences the strongest shaking for a given          epicenter, the shaking center and the shaking centroid. The shaking
ground motion parameter.                                             center in this example is 35 km away from the epicenter. The dis-
                                                                     tance between the shaking centroid and the epicenter is even 53 km.
(xSC , ySC ) = {(xi , yi ) : si = smax := maxsi }             (2)
                                           i

   The calculation of the shaking center provides a challenge
                                                                                         Distribution of distance between SC and EC
when a ShakeMap has more than one location that shares
                                                                          1000

this maximum value. Details on the here applied approach to
handle this issue are described in Appendix D.
                                                                          800

   Figure 3 provides an example of a ShakeMap with the
three different surface locations. The shaking center and
                                                                      Frequency
                                                                           600

shaking centroid generally do not coincide with the epicenter.
In particular when the epicenter lies in water, it will definitely
                                                                     400

be distinct from the shaking center and it will very likely also
                                                                          200

be distinct from the shaking centroid. The problems with the
definitions of the shaking center and the shaking centroid are
that (i) they depend on the choice of a ground motion param-
                                                                          0

                                                                                   0                1                  10             100           1000
eter and (ii) any map of a ground motion parameter – and                                                              km
therefore also the shaking center and the shaking centroid
                                                                                                  Epicenter on land            Epicenter in water
– cannot be as accurately evaluated as the epicenter. How-
ever, the shaking center and shaking centroid are locations of       Figure 4. Comparing the epicenter (EC) and the shaking center
greater interest for many applications.                              (SC) in terms of distance for all 11 510 earthquakes with shaking
   Table 1 compares the locations of epicenter, shaking center       and magnitude 4.5 or greater. In only about 9 % of earthquakes does
and shaking centroid for PGA as the ground motion param-             the epicenter coincide with the shaking center.
eter for all 12388 ShakeMaps in the dataset with magnitude
4.5 or greater. About 57 % of those earthquakes have their
epicenter in water and some of those events do not cause             5        Strong ground motion area
any shaking. Among the 11 510 events that do cause shak-
ing about 54 % have their epicenter in water. For the 46 %           In terms of the area affected by an earthquake, the literature
of those earthquakes that have their epicenter on land, the          so far has mainly referred to the area exposed to certain levels
average distance between the epicenter and the shaking cen-          of a qualitative intensity scale for individual events. There
ter is 7 km. This distance increases to 53 km when the epi-          has been no study on the global pattern of the area that is
center is in water. The full distribution of shaking center to       on average exposed to strong ground motion parameters for
epicenter distances is shown in Fig. 4. The PGA at the epi-          a given earthquake. This study provides the first summary of
center is on average 13 % weaker than at the shaking center,         global earthquake area size.
given that the epicenter is on land and experiences any shak-           The size of the area that experiences strong ground motion
ing (5285 events).                                                   from an earthquake is strongly dependent on the regional ge-

www.nat-hazards-earth-syst-sci.net/18/1665/2018/                                  Nat. Hazards Earth Syst. Sci., 18, 1665–1679, 2018
1670 S. Lackner: Earthquakes on the surface
Table 1. Distances in kilometers between the epicenter (EC), shaking center (SC), and shaking centroid (SCt), by whether the epicenter is in
water or on land for all 11 510 events with shaking and magnitude greater or equal 4.5.
EC to SC EC to SCt SC to SCt
Epicenter Mean SD Max Mean SD Max Mean SD Max
On land (46 %) 7 13 362 5 10 313 7 13 355
In water (54 %) 53 53 1022 59 54 682 25 33 445
Total (100 %) 32 46 1022 35 48 682 16 28 445
Average strong motion area (with 90 % of maximum PGA) by epicenter location
1e+04
1000
km 2 (log-colorscale)
100
10
1
0.1
Figure 5. Attenuation across the world illustrated by average strong ground motion area for 1973–2015. This map shows the average area
that was exposed to at least 90 % of the maximum PGA for an earthquake with the epicenter at that location. For each 1.25 × 1.25◦ grid cell
the average area is calculated for all earthquakes of the 12 388 ShakeMaps with magnitude 4.5 or greater, which have their epicenter in that
grid cell. The total number of earthquakes per grid cell varies significantly and the fact that many regions have recurrence intervals of more
than 43 years for strong events makes this map particularly sensitive to the time interval of the data.
ology. Figure 5 illustrates how different the size of the area ward. This highlights the importance of other factors than
exposed to strong ground motion can be across the world. magnitude in determining surface shaking. A more detailed
In particular it shows the average size of the area that was summary of average shaking areas can be found in Tables 2
exposed to at least 90 % of the maximum PGA within each and 3. The tables provide the average area exposed to 90 %
grid cell for the time period 1973–2015 (see Fig. C1 in Ap- of the maximum PGA for each ShakeMap and the average
pendix C for reference to how many earthquakes are used in area exposed to at least 10 %g PGA, separately by magnitude
each grid cell to calculate the average). For example, earth- and maximum PGA level. The total number of earthquakes
quakes along the west coast of South America can generally in each category, which is used to calculate the average, can
be felt at far wider distances from the epicenter than earth- be found in Table C1.
quakes on the west coast of North America. The west coast A stronger magnitude event – keeping everything else
of South America in Fig. 5 also illustrates how earthquakes about the earthquake constant (i.e., depth, geology, fault type,
close to the coast are spatially smaller, since the ocean re- hypocenter location) – will result in larger areas exposed to
stricts the shaking pattern to one side. Water bodies are cru- any given PGA level. This is generally confirmed by the data
cial in defining the area that can experience ground motion, in Table 3. A high-magnitude event can only have a low max-
and therefore also for the area exposed to strong ground mo- imum PGA level when the epicenter is in water. It is, how-
tion. ever, likely that a still large area would be exposed to these
Earthquake magnitude and distance are two of the most relatively low shaking values. Such events are responsible for
important factors in ground motion prediction equations. It the very large areas exposed to 90 % of the maximum PGA
is therefore intuitive that magnitude affects the area exposed in Table 2 and Fig. 6b. While an increase of the area above a
to a particular shaking threshold, and it is indeed easy to see fixed PGA threshold with increasing magnitude is intuitive,
this relationship in the data. However, as Fig. 6d shows, other Table 2 and Fig. 6b suggest that also the area exposed to a
factors (e.g., geology and water bodies) introduce significant fixed percentage of the maximum PGA increases with mag-
noise in this relationship and make it thus less straightfor- nitude. This is most likely due to the fact that large magnitude
Nat. Hazards Earth Syst. Sci., 18, 1665–1679, 2018 www.nat-hazards-earth-syst-sci.net/18/1665/2018/S. Lackner: Earthquakes on the surface 1671
(a) (b)
Log 10 of area (km2 ) with 90 % of max PGA
Log 10 of area (km2 ) with 90 % of max PGA
4 4
3e-3
8e-3
2 2
2e-3 6e-3
0 0
Density
Density
-2 -2 4e-3
1e-3
-4 -4 2e-3
-6 0 -6 0
1 1.5 2 2.5 4 5 6 7 8 9 10
Log 10 of maximum PGA (%g) Magnitude
(c) (d)
Log 10 of area (km2 ) with at least 10 %g PGA
Log 10 of area (km2 ) with at least 10 %g PGA
6 6
5e-3
8e-3
5 5
4e-3
4 4
6e-3
3 3
3e-3
Density
Density
2 2
4e-3
1 2e-3 1
0 0 2e-3
1e-3
-1 -1
-2 0 -2 0
1 1.5 2 2.5 4 5 6 7 8 9 10
Log 10 of maximum PGA (%g) Magnitude
Figure 6. Earthquake area compared to magnitude and maximum PGA. The four panels in this figure show scatter plots (with scatter density
illustrated by color) to illustrate the relationships between these measures. Only earthquakes with magnitude of at least 4.5 and maximum
PGA of at least 10 %g are included.
Table 2. Average area in square kilometers exposed to at least 90 % Table 3. Average area in 100 km2 exposed to at least 10 %g PGA,
of the maximum PGA, by magnitude and maximum PGA level. by magnitude and maximum PGA level.
PGA (%g) PGA (%g)
Magnitude 0–10 10–20 20–40 40–80 > 80 Total Magnitude 10–20 20–40 40–80 > 80 Total
< 4.5 16 11 14 14 15 < 4.51672 S. Lackner: Earthquakes on the surface
dataset of global strong ground motion data to define new spatial regression models or other statistical tools. The CMT
concepts of earthquake location as well as strong shaking centroid location could also be a relatively good predictor of
area to help summarize the natural hazard of surface shak- the location of strong surface shaking. An interesting future
ing. These concepts can help to facilitate a more effective extension of this research would therefore be to combine the
communication about the natural hazard of past earthquakes ShakeMap dataset with the CMT data to compare the shaking
that is focused on surface shaking. The concept of a shak- center and shaking centroid with the CMT centroid location.
ing center and a shaking centroid are introduced, which can Finally, the dataset is also applied to calculate a number of
often be better suited location definitions for an earthquake different shaking area variables. This work provides the first
than the epicenter in social science applications and in disas- summary of global earthquake strong ground motion area
ter management. size. The average strong ground motion area is shown to be
More than 14 500 individual ShakeMaps were compiled a useful tool to visualize attenuation across different regions
into one comprehensive dataset. The dataset can be consid- of the world.
ered to contain all relevant global earthquake ground shak- The constructed dataset can be used in future research to
ing from January 1973 to October 2016, a reasonable sample determine the short-term and long-term impacts of past earth-
from 1970 to 1972, and shaking from individual devastating quakes. This will allow us to investigate the impacts of earth-
events from 1960 to 1969. Observed or estimated shaking quakes based on measures that represent the natural hazard
data of past events can be used to compare hazard maps with of interest: earthquake ground shaking.
maps of actual shaking occurrences. An example of this ap-
plication can be found in Appendix E, which compares the
maximum PGA exposure for 1973–2015 according to the Code and data availability. The data sources used in this study are
ShakeMap data with the GSHAP hazard map of probabilistic freely available at the USGS website (https://earthquake.usgs.gov/
estimates. data/shakemap/ and https://earthquake.usgs.gov/data/comcat/, last
The dataset is applied to calculate the shaking center and access: 10 May 2018; ComCat, 2017), the NGDC website (https:
//www.ngdc.noaa.gov/hazard/earthqk.shtml; NGDC/WDS, 2017),
shaking centroid for all events in the dataset. The shaking
and the GSHAP website (http://static.seismo.ethz.ch/GSHAP/
center is particularly useful to assign a country to an event, global/, last access: 10 May 2018). The code that was used to pro-
since it is always on land. The shaking centroid, in contrast, cess the data and create the tables and figures, as well as more de-
is generally the best representation of the overall location of tails about the raw data, is available at the following GitHub repos-
shaking. It is the most reasonable choice for the assignment itory: https://github.com/slackner0/EQSurface.
of an event to a general region or to use as the location in
Nat. Hazards Earth Syst. Sci., 18, 1665–1679, 2018 www.nat-hazards-earth-syst-sci.net/18/1665/2018/S. Lackner: Earthquakes on the surface 1673
Appendix A: ANSS Comprehensive Earthquake ing chosen for the ShakeMap and the ComCat with slightly
Catalog (ComCat) deviating parameters. Sometimes the magnitude type might
also be different, resulting in different magnitude values.
For this work the list of all events with magnitude 4.5 or When possible events from the datasets are matched by tim-
higher that occurred between January 1960 and October 2016 ing (to the minute), magnitude (rounded to 0.1), longitude
is used. Additionally, events below magnitude 4.5 during that (rounded to 1), latitude (rounded to 0.25), and depth (rounded
time period were added if they do have a ShakeMap accord- to 25). Such a match is possible for 7882 ShakeMaps.
ing to ComCat. This results in a list of 225 429 earthquakes. The remaining ShakeMaps are matched to the remaining
The data were downloaded in March 2017 with the ComCat ComCat events (i) if they are at most 60 s apart, at a (Eu-
online access tool (https://earthquake.usgs.gov/earthquakes/ clidean) distance of at most 2◦ , and have a difference in mag-
search/, last access: 10 May 2018). The threshold of 4.5 is nitude of at most 2.2 (0.7 if the ShakeMap magnitude is be-
chosen since earthquakes outside the US below this magni- low 5.5), or (ii) if they occur within 2 s and at a distance of at
tude are not as systematically recorded in ComCat. We thus most 2◦ . If several events fulfill these criteria, the event with
have a reliable but not entirely complete list of global earth- the least time difference and the event with the least spatial
quakes of magnitude 4.5 and higher for the chosen years. difference are identified, and if they are the same event it
Since some of the earthquake data sources in ComCat only is assigned to the ShakeMap. Otherwise the event with the
provide data starting from certain years, the data are more least time difference is chosen if that time difference is at
complete for more recent years. As the analysis will show, most one-fifth of the next closest event (in terms of timing).
particularly for the time period 1960–1972, the ComCat list If that again is not the case, the spatially closest event is cho-
cannot be considered complete. sen, given that it has a spatial distance of at most 1◦ . For
A more likely problem than the lack of events in the list all so far unmatched events of relevance (high magnitude of
are possible duplicate events in the list. Earthquakes often the ShakeMap or ComCat event, or ComCat indicates that
occur in clusters. A big event might have foreshocks or after- a ShakeMap should exist for an event) a manual check and
shocks. Sometimes two different earthquakes occur at very potential assignment is done. For 20 events a manual assign-
close proximity and less than a minute apart. However, a ment was necessary to match the right ComCat event and
close investigation of the ComCat list reveals that some of ShakeMap.
those particularly similar events in terms of timing, loca- This process finally results in a total of 14 592 Com-
tion, and magnitude might actually not be separate events, Cat events with ShakeMap. According to ComCat only
but the same event with slight differences in the estimated 5310 events are supposed to have a ShakeMap. It was, how-
source parameters from different data contributors. I exclude ever, possible to find significantly more than that on the
33 events from the GCMT network for which another event USGS website. Nevertheless there are 127 events which
within 1.5 s at a distance of under 3◦ exists, since those events are supposed to have a ShakeMap, which is missing in
seem to be duplicates. Furthermore, I also exclude six events the dataset. Most of them are missing because they were
that do not fulfill these criteria but have been manually iden- produced after December 2016 when the ShakeMaps were
tified as most likely duplicates. There are, however, most downloaded and some also because the ShakeMap files were
likely more duplicate events, as the representativeness anal- corrupted. The magnitude of 67 of those events is below 4.5
ysis shows. After excluding these events, we have a list of and for only three of the 127 events is the magnitude higher
225 390 events which can be uniquely identified by the com- than 5.5. It is therefore reasonable to assume that the exclu-
bination of the following parameters (rounded to specific ac- sion of these 127 ShakeMaps will not affect the representa-
curacies in parentheses): timing (to the minute), magnitude tiveness of the dataset in a significant way.
(0.1), longitude (1), latitude (0.25), and depth (25). The second step is assigning each event from the signif-
icant earthquakes list to a ComCat event. Again, the source
parameters show slight deviations and a similar approach as
Appendix B: Linking the three earthquake datasets matching ShakeMaps with ComCat events is utilized. Each
significant earthquake event is matched to a ComCat event
The first step is to combine the ComCat earthquake list with if they are at most 90 s apart, at a distance of at most 5◦ ,
the ShakeMap dataset. Unfortunately, the ComCat list and and have a difference in magnitude under or equal to 2. If
the ShakeMap data are often updated separately from each more than one ComCat event fulfills these criteria the event
other and earthquake source parameters (e.g., magnitude, with the smallest time difference and spatial distance is cho-
timing, location) can therefore differ between a ComCat sen (they always agree for this dataset). However, for some
event and the ShakeMap for the same event. Also the earth- events the significant earthquake list has missing timing data
quake “ID” does not always agree between the ShakeMap (second, minute, or hour). For those events, the timing has to
and the corresponding ComCat event. The differences in be within the same day and the spatial difference cannot be
source parameters stem either from the data providing net- more than 2.5◦ . Additionally, 14 events were matched manu-
work updating the parameters or from different networks be- ally. Unfortunately some events in the significant earthquake
www.nat-hazards-earth-syst-sci.net/18/1665/2018/ Nat. Hazards Earth Syst. Sci., 18, 1665–1679, 20181674 S. Lackner: Earthquakes on the surface
list seem to have typos (e.g., a drop in the leading 100◦ of a Table C1. Number of ShakeMaps in the dataset by magnitude and
longitude location). Some typos are identified manually and maximum PGA level. The magnitude distribution of earthquakes
they are part of the 14 manual matches, but there are poten- with magnitude above 5.5 follows a power law, as expected for a
tially more typos or just deviations in the data in terms of comprehensive sample of earthquakes. For lower-magnitude events
the timing. For all unmatched events with no ComCat event ShakeMaps are not consistently produced and a less consistent mag-
nitude distribution is therefore observed in that range.
within 90 s, we therefore identify matches if they are within
24 h, at a distance of at most 0.2◦ , and have a magnitude that
PGA (%g)
deviates by at most 0.2.
All but 152 of the 2130 significant earthquakes can finally Magnitude 0 0–10 10–20 20–40 40–80 > 80 Total
be matched with ComCat events. An additional 16 events of < 4.5 7 1593 242 277 101 0 2220
the significant earthquake list that are not in the ComCat list 4.5–5.5 67 1263 853 390 34 1 2608
5.5–6 606 2070 2132 773 46 12 5639
were able to be matched with yet unmatched ShakeMaps. It 6–6.5 156 716 888 649 72 21 2502
is unlikely that excluding the remaining 136 events will bias 6.5–7 34 203 295 392 125 24 1073
the data in a problematic way. First, most of those events 7–7.5 10 48 51 189 68 33 399
have relatively low magnitudes and are therefore not in the 7.5–8 4 15 12 47 41 14 133
≥8 1 3 3 11 11 5 34
ComCat list (114 of the 136 events have a magnitude below Total 885 5911 4476 2728 498 110 14 608
5.5). Second, 86 of the 136 earthquakes stem from the pe-
riod of 1960–1972. This is a sign that the ComCat list for
that period is not as complete as for later periods, which we
already expect from the data availability of the ComCat data erally expect that a “significant” earthquake should have a
sources. Finally, considering the impact of fatalities, 91 of ShakeMap. Indeed, 1547 significant earthquakes in our com-
the 136 events caused at least 1 death, but the average among bined dataset do have a ShakeMap. We already discussed the
those is only 11, with a maximum of 80. After 1972, the 136 cases of significant earthquake events that could not be
largest number of fatalities among these events is 14. matched to either a ComCat event or a ShakeMap. Those
For the time period of January 1960–October 2016 we events are either relatively small or from the time period of
have 14 608 ShakeMaps that are matched either to a Com- 1960–1972, suggesting that the ComCat event list is not com-
Cat event (13 061), to a significant earthquake list event (16), plete for that time period. Of the 447 significant earthquake
or to both (1531). For those events we will use the source list events which have been matched to a ComCat event with-
parameters from the ShakeMap and disregard the potentially out a ShakeMap, 99 caused at least one fatality. This is a
deviating ComCat and significant earthquake list parameters. concern, since events with fatalities should usually have a
If no ShakeMap exists, the ComCat source parameters will ShakeMap. However, 84 of those events are from the time pe-
supersede the significant earthquake list parameters in the riod of 1960–1972. This is not unexpected, since ShakeMaps
dataset. were not systematically produced before 1973. The remain-
ing 15 events after 1972 with fatalities but no ShakeMap have
on average 3 fatalities and a maximum of 11. We can there-
Appendix C: The representativeness of the ShakeMap fore expect that these events are sufficiently small to not miss
dataset a major impact event. Of the entire 447 events, 207 are from
1960 to 1972 and they therefore cause no additional concern
The final ShakeMap dataset consists of 14 608 events. Ta- beyond the already known unreliability of that time period.
ble C1 summarizes the number of events in the dataset by For the remaining 240 events, only 73 have a magnitude of
magnitude and maximum PGA. Figure C1 provides a geo- 5.5 or higher. Many of these higher-magnitude events are in
graphic overview of the earthquakes in the dataset by epi- remote locations such as Antarctica or Alaska or occurred far
center location. Figure 5 presents the geographic distribution offshore and did not cause a lot of shaking. We have overall
of the average strong motion area for all events in the dataset, 9780 ShakeMaps with magnitude 5.5 or greater. The 73 miss-
and Fig. C2 provides a similar representation of the data, but ing events therefore imply an error rate of 0.7 %, which is
restricted to only events with a magnitude between 5.5 and in an acceptable range. Nevertheless, we can assume that the
6.5. missing events would have on average lower shaking and im-
The combination of the three earthquake data sources can pacts than the included events, since such events are more
help to identify how representative the aggregated ShakeMap likely to get attention and therefore have a ShakeMap pro-
dataset is for all global earthquake ground shaking. The first duced.
concern is whether “big” events – in terms of either shak- Another question is whether the ShakeMap coverage is
ing or impacts – might not be in the dataset. The ShakeMap comparable across years. To answer this question we first
creation criteria (Allen et al., 2009) are supposed to ensure need to consider the reference data. As we already discussed
that this does not happen. However, the significant earth- before, the ComCat list is most likely not as complete for
quake list provides us with a tool to test this. We would gen- the time period 1960–1972 as for the years after that. In
Nat. Hazards Earth Syst. Sci., 18, 1665–1679, 2018 www.nat-hazards-earth-syst-sci.net/18/1665/2018/S. Lackner: Earthquakes on the surface 1675
Number of earthquakes by epicenter location
100
63
40
25
16
(log-colorscale)
10
6
4
3
2
1
Figure C1. Epicenter locations of the sample of 12 388 earthquakes in the dataset with ShakeMaps and magnitude 4.5 or greater. The map
shows the number of earthquakes in the dataset which have their epicenter in the corresponding 1.25 × 1.25◦ grid cell.
Average strong motion area (with 90 % of maximum PGA) by epicenter location (5.5 M 6.5)
1e+04
1000
km 2 (log-colorscale)
100
10
1
0.1
Figure C2. Attenuation across the world illustrated by average strong ground motion area for 1973–2015 and earthquakes with magnitude
between 5.5 and 6.5. This map shows the average area that is exposed to at least 90 % of the maximum PGA for an earthquake with its
epicenter at that location.
Fig. C3 we can see that the total number of events for “all but also because the number of events with magnitude 5.5
earthquakes” (ShakeMap events plus ComCat events with- and without ShakeMap is surprisingly high for such a re-
out ShakeMap) seemingly increases over time. However, this cent year. This needs to be kept in mind when comparing the
should in theory not be the case. The number of earthquakes number of ShakeMap events with the number of all events in
per year should be more or less constant over years. Part of Fig. C3. Nevertheless, we can clearly see that from 1960 to
the variation is natural noise, but a lot of the increase can 1970 ShakeMaps only exist for very few selected events, all
probably be explained by missing events for the time pe- of which have fatalities. Starting in 1970, ShakeMaps gen-
riod 1960–1972. This becomes particularly apparent when erally existed and were systematically produced from 1973
events below magnitude 5.5 are considered. Another possi- onwards. In 2006/2007 the share of events with ShakeMaps
ble reason for the increase is that duplicates in the ComCat drastically increases.
database are more likely for the time periods with more data The ShakeMap data are increasingly complete in more re-
contributing networks. Since additional networks were added cent years and it is particularly incomplete before 1973 (and
over the years, the number of duplicate events might also in- even more so before 1970). The extra ShakeMaps in more
crease with years. In particular the year 2011 looks suspi- recent years, however, come from more and more weaker
ciously like it might hold a large number of duplicate events, events receiving a ShakeMap. We can also confirm this with
not only because the number of events is exceptionally large the distribution of magnitude for events with and without
www.nat-hazards-earth-syst-sci.net/18/1665/2018/ Nat. Hazards Earth Syst. Sci., 18, 1665–1679, 20181676 S. Lackner: Earthquakes on the surface
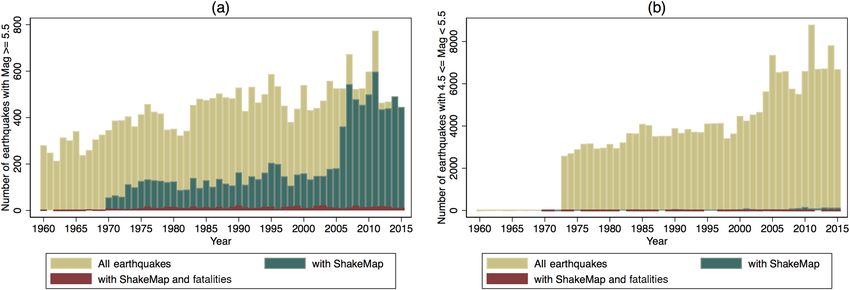
Figure C3. Number of earthquakes per year for given magnitude ranges. Before 1973 ComCat has a significant number of missing events,
particularly for events with magnitude below 5.5. Between 1960 and 1970 ShakeMaps only exist for individual events with (high) fatalities.
Starting 1973, ShakeMaps are produced systematically, and from 2007 onwards almost all events with magnitude 5.5 or greater have a
ShakeMap.
global maps of the number of events in the ComCat list to
5000
the number of ShakeMaps does indeed confirm a bias to-
wards more North American events, in particular along the
4000
Number of earthquakes
US west coast. Figure C5 helps us to investigate the North
America bias further. We can loosely define an event to
3000
be in North America when its epicenter has a latitude be-
tween −170 and −60 and a longitude between 25 and 70◦ .
2000
We can then see that for all events since 1973, almost all
1000
ShakeMaps with magnitude under 4 are from North Amer-
ica and there is a strong bias towards North American events
until about magnitude 4.5. Between magnitude 4.5 and 5.5
0
2 2.5 3 3.5 4 4.5 5 5.5 6 6.5 7 7.5 8 8.5 9 still relatively more North American ShakeMaps are avail-
Magnitude
able, but the bias is in a reasonable range. For events with
with magnitude >= 5.5 with ShakeMap
with ShakeMap and fatalities magnitude greater than 5.5 no apparent North American bias
exists. Panel a in Fig. C5 has some outliers with a much
lower than expected ratio of high-magnitude events having
Figure C4. The distribution of magnitude for events from January a ShakeMap. The most pronounced outliers are even for the
1973 to October 2016. ShakeMaps are systematically produced for
share of North American events being low for some rela-
all events with magnitude 5.5 or greater and the share of events with
ShakeMap increases with magnitude.
tively high-magnitude values. It is unlikely that there are
actually that many high-magnitude events (particularly in
North America) without ShakeMap and we are most likely
ShakeMap in Fig. C4. With increasing magnitude the share seeing the effect of duplicates in the ComCat list artificially
of ShakeMaps also increases. Most high-magnitude events increasing the denominator.
do have a ShakeMap and the lower-magnitude (but above It is advised to restrict the dataset to ShakeMaps with
5.5) events without ShakeMap are on average older events magnitude above 4.5 or even 5.5 for many applications to
than those with ShakeMap. This figure also confirms that avoid the North America bias. Events with a magnitude un-
“big” events do generally have a ShakeMap and we are not der 5.5 can still occasionally cause severe impacts. We there-
missing a significant number of high-magnitude events in the fore do not want to exclude all of them, particularly since
ShakeMap dataset. the events often have a ShakeMap if they did indeed cause
A bigger concern is whether the ShakeMaps have a ge- significant impacts. Nevertheless, it is important to be aware
ographic bias. Since the USGS is a North American insti- that the sample is geographically biased for earthquakes be-
tution, we expect that ShakeMaps for low-magnitude earth- low the magnitude threshold of 5.5. If we only considered
quakes in North America are more likely produced than for ShakeMaps from events with a magnitude of 4.5 or higher,
such events from different regions of the world. Comparing our sample size would be 12 388.
Nat. Hazards Earth Syst. Sci., 18, 1665–1679, 2018 www.nat-hazards-earth-syst-sci.net/18/1665/2018/S. Lackner: Earthquakes on the surface 1677
Figure C5. The share of events with ShakeMap (a) and the share of North American ShakeMaps (b) by magnitude for events since 1973.
Below magnitude 5.5 ShakeMaps for North American events are more commonly produced, and below magnitude 4.5 they are almost
exclusively produced for North American events.
Appendix D: Calculation of the shaking center Appendix E: Comparison of earthquake shaking history
with GSHAP hazard data
In the sample of 11 510 ShakeMaps with positive shaking
and magnitude 4.5 or higher, 10 401 ShakeMaps have a ShakeMap data can be used to compare probabilistic shak-
unique maximum PGA location, 656 events have two grid ing estimates for the future (hazard maps) with actual shak-
cells with the maximum PGA, and 453 ShakeMaps have ing occurrences. To illustrate this the earthquake maximum
more than two grid cells sharing the maximum PGA. For the shaking history calculated here (maximum PGA exposure for
earthquakes with more than one grid cell as potential shaking 1973–2015) is compared with the GSHAP global earthquake
center, it is necessary to define a consistent way to pick one hazard map in Fig. E1. The scale is cut off at a difference of
of them as the shaking center. The here applied approach to 10 %g, presenting any higher values in the same color as a
tackle this problem is to incrementally add the surrounding difference of exactly 10 %g.
cells of the shaking center candidate cell and calculate the av- Since only limited documentation about the GSHAP data
erage shaking value in that square. Only those shaking cen- could be found, it is necessary to make some assumptions
ter candidates that reach the highest value for that measure about the data before it can be combined with the ShakeMap
are kept, until only one location remains. In this manner, the data. In particular, (1) it is assumed that the coordinates re-
location with the maximum shaking that has the strongest fer to the center of each grid cell, and (2) the data for the
shaking in the area surrounding it is chosen as the shaking longitude 193 are dropped due to repetition of the longitude
center. This procedure reaches the edge of the ShakeMap column (longitude −167◦ is kept in the data). For this com-
in only 47 cases when PGA as the ground motion parame- parison, the maximum shaking history is calculated at the
ter. We then assume that the average shaking outside of the resolution of the GSHAP data of 1/10 × 1/10◦ . Each grid
ShakeMap is the same as the average shaking of the added cell is assigned the maximum PGA value exposure that oc-
cells that are still in the ShakeMap at the same distance to curred anywhere in that grid cell at some point between 1973
the potential shaking center. However, for 24 of the 47 events and 2015 according to the ShakeMap data.
still no unique shaking center can be found, since they oc-
curred in small island regions and only caused shaking in
very small areas (those events have on average only 17 km2
exposed to any shaking). For those events the location closest
to the shaking centroid that experiences maximum shaking
is chosen as the shaking center. This procedure results in a
unique shaking center for all 11 510 events. In cases where
this would not be sufficient, the smallest distance to the epi-
center can be considered.
www.nat-hazards-earth-syst-sci.net/18/1665/2018/ Nat. Hazards Earth Syst. Sci., 18, 1665–1679, 20181678 S. Lackner: Earthquakes on the surface Figure E1. Comparing the earthquake maximum shaking history with the GSHAP hazard map. Panel (a) shows the maximum shaking experienced between 1973 and 2015, and panel (b) plots the GSHAP data of probabilistic PGA estimates that will not be exceeded with a 90 % chance within 50 years. Subtracting (b) from (a) results in the difference between actual exposure and the probabilistic estimates, which is displayed in panel (c). The scale is cut off at a difference of 10 %g. This comparison reveals that the maximum shaking history for the given time range tends to exceed the GSHAP estimates in most seismically active regions of the world. It is important to keep in mind that the shaking history is a combination of observed and estimated data for actual shaking exposure in the given time period. Nat. Hazards Earth Syst. Sci., 18, 1665–1679, 2018 www.nat-hazards-earth-syst-sci.net/18/1665/2018/
S. Lackner: Earthquakes on the surface                                                                                               1679

Competing interests. The author declares that she has no conflict of   Ekström, G., Nettles, M., and Dziewoński, A. M.: The
interest.                                                                global CMT project 2004–2010: Centroid-moment tensors for
                                                                         13 017 earthquakes, Phys. Earth Planet. In., 200–201, 1–9,
                                                                         https://doi.org/10.1016/j.pepi.2012.04.002, 2012.
Acknowledgements. I want to thank John Mutter, Art Lerner-Lam,         Giardini, D.: The Global Seismic Hazard Assessment Pro-
Douglas Almond, Amir Jina, and George Deodatis for their advice          gram (GSHAP) – 1992/1999, Ann. Geofis., 42, 957–974,
on this work. I also thank Timothy Foreman, Jesse Anttila-Hughes,        https://doi.org/10.4401/ag-3780, 1999.
and Markus Riegler for helpful comments and discussions. I am          Hsiang, S. M. and Jina, A.: The Causal Effect of Environmental
grateful to David Wald and Michael Hearne for advice on the              Catastrophe on Long-Run Economic Growth: Evidence From
ShakeMap data and for providing some MATLAB code that helped             6 700 Cyclones, Tech. rep., National Bureau of Economic Re-
process the data.                                                        search, Cambridge, MA, https://doi.org/10.3386/w20352, 2014.
                                                                       Jones, L. M. and Benthien, M.: Preparing for a “Big One”: The
Edited by: Maria Ana Baptista                                            Great Southern California ShakeOut, Earthq. Spectra, 27, 575–
Reviewed by: two anonymous referees                                      595, https://doi.org/10.1193/1.3586819, 2011.
                                                                       Joyner, W. B. and Boore, D. M.: Measurement, Characterization
                                                                         and Prediction of Strong Ground Motion, in: Geotechnical Spe-
                                                                         cial Publication, 43–102, available at: http://pubs.er.usgs.gov/
References                                                               publication/70014404 (last access: 10 May 2018), 1988.
                                                                       Kanamori, H.: Earthquake physics and real-time seismology, Na-
Allen, T. I., Wald, D. J., Earle, P. S., Marano, K. D., Hotovec,         ture, 451, 271–273, https://doi.org/10.1038/nature06585, 2008.
  A. J., Lin, K., and Hearne, M. G.: An Atlas of ShakeMaps and         Kirchberger, M.: Natural disasters and labor markets, J. Dev. Econ.,
  population exposure catalog for earthquake loss modeling, B.           125, 40–58, https://doi.org/10.1016/j.jdeveco.2016.11.002,
  Earthq. Eng., 7, 701–718, https://doi.org/10.1007/s10518-009-          2017.
  9120-y, 2009.                                                        Kong, Q., Allen, R. M., Schreier, L., and Kwon, Y.-W.:
Anselin, L.: Spatial Econometrics, in: A Companion to Theoreti-          MyShake: A smartphone seismic network for earthquake
  cal Econometrics, Blackwell Publishing Ltd, Malden, MA, USA,           early warning and beyond, Science Advances, 2, e1501055,
  310–330, 2007.                                                         https://doi.org/10.1126/sciadv.1501055, 2016.
Arias, A.: A measure of earthquake intensity, in: Seismic Design for   National Geophysical Data Center/World Data Service
  Nuclear Power Plants, edited by: Hansen, R. J., Cambridge, MA,         (NGDC/WDS): Global Significant Earthquake Database,
  USA, 1970.                                                             2150 BC to present, National Geophysical Data Center, NOAA,
Caprio, M., Tarigan, B., Worden, C. B., Wiemer, S., and                  https://doi.org/10.7289/V5TD9V7K, last access: 1 January
  Wald, D. J.: Ground motion to intensity conversion equa-               2017.
  tions (GMICEs): A global relationship and evaluation of re-          Riddell, R.: On Ground Motion Intensity Indices, Earthq. Spectra,
  gional dependency, B. Seismol. Soc. Am., 105, 1476–1490,               23, 147–173, https://doi.org/10.1193/1.2424748, 2007.
  https://doi.org/10.1785/0120140286, 2015.                            Shedlock, K. M., Giardini, D., Grünthal, G., and Zhang, P.: The
Center for International Earth Science Information Network               GSHAP Global Seismic Hazard Map, Seismol. Res. Lett., 71,
  (CIESIN): Gridded Population of the World, Version 4                   679–686, https://doi.org/10.1785/gssrl.71.6.679, 2000.
  (GPWv4): Land and Water Area, Tech. rep., Columbia Univer-           Tobler, W. R.: A Computer Movie Simulating Urban Growth
  sity, Palisades, NY, https://doi.org/10.7927/H45M63M9, 2016.           in the Detroit Region, Econ. Geogr., 46, 234–240,
ComCat: ANSS Comprehensive Earthquake Catalog (ComCat)                   https://doi.org/10.2307/143141, 1970.
  Documentation, available at: https://earthquake.usgs.gov/data/       Wald, D. J., Quitoriano, V., Heaton, T. H., Kanamori, H., Scrivner,
  comcat/, last access: 1 January 2017.                                  C. W., and Worden, C. B.: TriNet “ShakeMaps”: Rapid Gen-
Crowley, H., Pinho, R., Pagani, M., and Keller, N.: Assessing            eration of Peak Ground Motion and Intensity Maps for Earth-
  global earthquake risks: The Global Earthquake Model (GEM)             quakes in Southern California, Earthq. Spectra, 15, 537–555,
  initiative, in: Handbook of Seismic Risk Analysis and Man-             https://doi.org/10.1193/1.1586057, 1999.
  agement of Civil Infrastructure Systems, Elsevier, 815–838,          Wald, D. J., Quitoriano, V., Worden, C. B., Hopper, M., and
  https://doi.org/10.1533/9780857098986.5.815, 2013.                     Dewey, J. W.: USGS “Did You Feel It?” Internet-based macro-
Denolle, M. A., Dunham, E. M., Prieto, G. A., and                        seismic intensity maps, Ann. Geophys.-Italy, 54, 688–707,
  Beroza, G. C.: Strong Ground Motion Prediction                         https://doi.org/10.4401/ag-5354, 2011.
  Using Virtual Earthquakes, Science, 343, 399–403,
  https://doi.org/10.1126/science.1245678, 2014.
Douglas, J.: Earthquake ground motion estimation using strong-
  motion records: a review of equations for the estimation of peak
  ground acceleration and response spectral ordinates, Earth-Sci.
  Rev., 61, 43–104, https://doi.org/10.1016/s0012-8252(02)00112-
  5, 2003.

www.nat-hazards-earth-syst-sci.net/18/1665/2018/                              Nat. Hazards Earth Syst. Sci., 18, 1665–1679, 2018
You can also read