THE STATE OF RACIAL DIVERSITY IN THE EDUCATOR WORKFORCE 2016 - U.S ...
←
→
Page content transcription
If your browser does not render page correctly, please read the page content below
THE STATE OF
RACIAL DIVERSITY
IN THE EDUCATOR
WORKFORCE
2016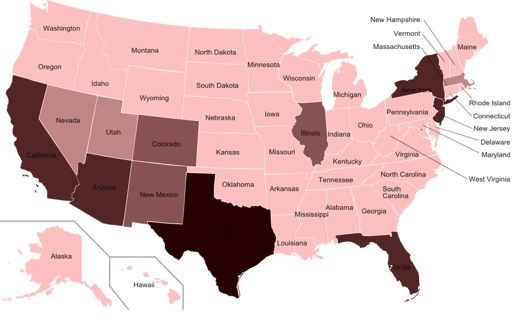
THE STATE OF RACIAL
DIVERSITY IN THE EDUCATOR
       WORKFORCE

                   JULY 2016

          POLICY AND PROGRAM STUDIES SERVICE
OFFICE OF PLANNING, EVALUATION AND POLICY DEVELOPMENT
           U.S. DEPARTMENT OF EDUCATION

                         i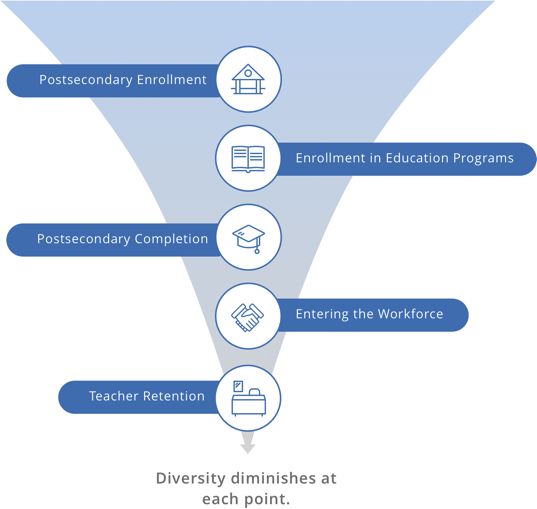
U.S. Department of Education
John B. King, Jr.
Secretary

Office of Planning, Evaluation and Policy Development
Amy McIntosh
Delegated Duties of Assistant Secretary
Policy and Program Studies Service
Jennifer Bell-Ellwanger
Director

July 2016

This report is in the public domain. Authorization to reproduce it in whole or in part
is granted. While permission to reprint this publication is not necessary, the citation
should be U.S. Department of Education, Office of Planning, Evaluation and Policy
Development, Policy and Program Studies Service, The State of Racial Diversity in the
Educator Workforce, Washington, D.C. 2016.
This report is available on the Department’s website at
http://www2.ed.gov/rschstat/eval/highered/racial-diversity/state-racial-diversity-
workforce.pdf.
Availability of Alternate Formats
Requests for documents in alternate formats such as Braille or large print should be
submitted to the Alternate Format Center by calling 202-260-0852, or by contacting
the 504 coordinator via e-mail at om_eeos@ed.gov.
Notice to Limited English Proficient Persons
If you have difficulty understanding English you may request language assistance
services for Department information that is available to the public. These services
are available free of charge. If you need more information about interpretation
or translation services, please call 1-800-USA-LEARN (1-800-872-5327) (TTY:
1-800-437-0833), or e-mail us at Ed.Language.Assistance@ed.gov. Or write to U.S.
Department of Education, Information Resource Center, LBJ Education Building, 400
Maryland Ave. SW, Washington, DC 20202.

                                                 ii
CONTENTS
List of Figures. . . . . . . . . . . . . . . . . . . . . . . . . . . . . . . . . . . . . . . . . . . . . . . . . . iv
Introduction. . . . . . . . . . . . . . . . . . . . . . . . . . . . . . . . . . . . . . . . . . . . . . . . . . . . 1
Summary of Findings. . . . . . . . . . . . . . . . . . . . . . . . . . . . . . . . . . . . . . . . . . . . 3
Racial Diversity of Students and Educators. . . . . . . . . . . . . . . . . . . . . . . . 5
Racial Diversity of Students . . . . . . . . . . . . . . . . . . . . . . . . . . . . . . . . . . . 5
Racial Diversity of Teachers. . . . . . . . . . . . . . . . . . . . . . . . . . . . . . . . . . . . 6
Racial Diversity of Principals . . . . . . . . . . . . . . . . . . . . . . . . . . . . . . . . . . 7
Educator Pipeline . . . . . . . . . . . . . . . . . . . . . . . . . . . . . . . . . . . . . . . . . . . . . . 9
Postsecondary Enrollment. . . . . . . . . . . . . . . . . . . . . . . . . . . . . . . . . . . . 10
Teacher Preparation Programs . . . . . . . . . . . . . . . . . . . . . . . . . . . . . . . . 13
Enrollment at Historically Black Colleges and Universities
(HBCUs). . . . . . . . . . . . . . . . . . . . . . . . . . . . . . . . . . . . . . . . . . . . . . . . . . . . 16
Alternative-Route Teacher Preparation Program Students . . . . . . . . 17
Postsecondary Completion . . . . . . . . . . . . . . . . . . . . . . . . . . . . . . . . . . . 18
Entering the Teacher Workforce. . . . . . . . . . . . . . . . . . . . . . . . . . . . . . . . 22
Bachelor’s Degree Graduates . . . . . . . . . . . . . . . . . . . . . . . . . . . . . . . . . 22
New Teachers. . . . . . . . . . . . . . . . . . . . . . . . . . . . . . . . . . . . . . . . . . . . . . . . 25
Teacher Workforce . . . . . . . . . . . . . . . . . . . . . . . . . . . . . . . . . . . . . . . . . . . 27
Teacher Retention. . . . . . . . . . . . . . . . . . . . . . . . . . . . . . . . . . . . . . . . . . . . 29
Conclusion. . . . . . . . . . . . . . . . . . . . . . . . . . . . . . . . . . . . . . . . . . . . . . . . . . . . . 31
Endnotes . . . . . . . . . . . . . . . . . . . . . . . . . . . . . . . . . . . . . . . . . . . . . . . . . . . . . . 33
iiiFIGURES
Figure 1. Percentage distribution of students enrolled in public
elementary and secondary schools, by race/ethnicity: Fall 2002,
fall 2012, and fall 2024 . . . . . . . . . . . . . . . . . . . . . . . . . . . . . . . . . . . . . . . . . . . 5
Figure 2. Percentage distribution of teachers in public elementary
and secondary schools, by race/ethnicity: Selected years,
1987 – 88 through 2011 – 12 . . . . . . . . . . . . . . . . . . . . . . . . . . . . . . . . . . . . . . . . 6
Figure 3. Percentage distribution of public school principals, by
race/ethnicity: Selected years 2003 – 04, 2007 – 08, and 2011 – 12 . . . . . 8
Figure 4. Key points along the educator pipeline . . . . . . . . . . . . . . . . . . . 9
Figure 5. Percentage of enrollment for high school graduates and
bachelor’s degree students, by race/ethnicity: 2011 – 12. . . . . . . . . . . . . . 10
Figure 6. Percentage distribution for bachelor’s degree students,
by major and race/ethicnicity: 1999 – 2000 and 2011 – 12 . . . . . . . . . . . . . 11
Figure 7. Percentage distribution of master’s degree students,
by field of study and race/ethnicity: 1999 – 2000 and 2011 – 12. . . . . . . . 12
Figure 8. Percentage of bachelor’s degree students majoring in
education, by race/ethnicity: 2011 – 12. . . . . . . . . . . . . . . . . . . . . . . . . . . . . . 12
Figure 9. Percentage of master’s degree students enrolled in an
education-related field of study, by race/ethnicity: 2011 – 12. . . . . . . . . . 13
Figure 10. Black enrollment in teacher preparation programs, by
state where program is located: 2013 – 14 . . . . . . . . . . . . . . . . . . . . . . . . . . 14
Figure 11. Hispanic enrollment in teacher preparation programs,
by state where program is located: 2013 – 14. . . . . . . . . . . . . . . . . . . . . . . . 14
Figure 12. Percentage distribution of all enrollees in IHEs
with teacher preparation programs versus the distribution of
enrollees at those IHEs who are in a teacher preparation
program, by race/ethnicity: 2012 – 13 . . . . . . . . . . . . . . . . . . . . . . . . . . . . . . 15
Figure 13. Share of teacher preparation program enrollment
in HBCUs: 2012 – 13. . . . . . . . . . . . . . . . . . . . . . . . . . . . . . . . . . . . . . . . . . . . . . 17
Figure 14. Percentage distribution for types of teacher preparation
programs, by race/ethnicity: 2012 – 13 . . . . . . . . . . . . . . . . . . . . . . . . . . . . . 18
Figure 15. Cumulative persistence and attainment by 2008 – 09
for bachelor’s degree students who began postsecondary
education in 2003 – 04, by major and race/ethnicity . . . . . . . . . . . . . . . . 19
ivFigure 16. Share of awards conferred for education majors and all
majors, by institution type: 2012 – 13 . . . . . . . . . . . . . . . . . . . . . . . . . . . . . . . 20
Figure 17. Share of education major awards conferred, by
MSI/HBCU status: 2012 – 13 . . . . . . . . . . . . . . . . . . . . . . . . . . . . . . . . . . . . . . . 21
Figure 18. Percentage of education degrees awarded to
white students compared to percentage of non-education
degrees awarded to white students, by institution type: 2012 – 13 . . . . . 22
Figure 19. Percentage distribution of 2007 – 08 bachelor’s degree
recipients who reported applying for k – 12 teaching position as
of 2012, by race/ethnicity. . . . . . . . . . . . . . . . . . . . . . . . . . . . . . . . . . . . . . . . 23
Figure 20. Percentage of 2007 – 08 bachelor’s degree recipients
who reported applying for a k – 12 teaching position as of 2012, by
race/ethnicity . . . . . . . . . . . . . . . . . . . . . . . . . . . . . . . . . . . . . . . . . . . . . . . . . . 24
Figure 21. Percentage distribution of 2007 – 08 bachelor’s degree
recipients for all majors, for those who majored in education, and
for those who worked as a k – 12 teacher, by race/ethnicity: 2012 . . . . . 25
Figure 22. Percentage distribution of public school teachers
for all teachers and teachers with three or fewer years of
experience, by race/ethnicity: 2012. . . . . . . . . . . . . . . . . . . . . . . . . . . . . . . . 26
Figure 23. Percentage distribution of classroom teachers in
geographic categories of districts, by race/ethnicity: 2014. . . . . . . . . . . 27
Figure 24. Percentage distribution of new classroom teachers in
geographic categories of districts, by race/ethnicity: 2014. . . . . . . . . . . 28
Figure 25. Percentage distribution of principals in geographic
categories of districts, by race/ethnicity: 2014. . . . . . . . . . . . . . . . . . . . . . 28
Figure 26. Percentage distribution of new principals, by race and
social conditions of districts: 2014 . . . . . . . . . . . . . . . . . . . . . . . . . . . . . . . . 29
Figure 27. Percentage of public school teachers who remained in the
same school, by race/ethnicity: School years 2011 – 12 to 2012 – 13 . . . . . 30
vINTRODUCTION
“Without question, when the majority of students in public
schools are students of color and only 18 percent of our teachers
are teachers of color, we have an urgent need to act. We’ve got
to understand that all students benefit from teacher diversity. We
have strong evidence that students of color benefit from having
teachers and leaders who look like them as role models and also
benefit from the classroom dynamics that diversity creates. But it
is also important for our white students to see teachers of color
in leadership roles in their classrooms and communities. The
question for the nation is how do we address this quickly and
thoughtfully?”
Education Secretary John B. King, Jr.,
Speaking at Howard University, March 8, 2016.
The U.S. Department of Education is dedicated to increasing the diversity
of our educator workforce, recognizing that teachers and leaders of
color will play a critical role in ensuring equity in our education system.
The release of this data is consistent with the Department’s mission
and values, and is intended to provide a basis for discussion, strategy
development, and further research.
Diversity is inherently valuable. We are stronger as a nation when people
of varied backgrounds, experiences, and perspectives work and learn
together; diversity and inclusion breed innovation. Groups of more
diverse problem solvers have been found to outperform groups of less
diverse problem solvers,1 and companies with more diversity in their
leadership also tend to be top financial performers.2
Research shows that diversity in schools, including racial diversity among
teachers, can provide significant benefits to students. While students
of color are expected to make up 56 percent of the student population
by 2024, the elementary and secondary educator workforce is still
overwhelmingly white.3 In fact, the most recent U.S. Department of
Education Schools and Staffing Survey (SASS), a nationally representative
survey of teachers and principals, showed that 82 percent of public
school teachers identified as white. This figure has hardly changed
in more than 15 years; data from a similar survey conducted by the
Department in 2000 found that 84 percent of teachers identified as
white.4
Improving teacher diversity can help all students. Teachers of color5
are positive role models for all students in breaking down negative
stereotypes and preparing students to live and work in a multiracial
society. A more diverse teacher workforce can also supplement training
in the culturally sensitive teaching practices most effective with today’s
student populations.
1In addition to providing social advantages for all students, the racial
diversity of the teaching workforce can help to close the achievement
gap,6 emerging research7 suggests. Both quantitative and qualitative
studies find that teachers of color can improve the school experiences of
all students; further, teachers of color8 contribute to improved academic
outcomes while serving as strong role models for students.9
One report suggests that, compared with their peers, teachers of color
are more likely to (1) have higher expectations of students of color (as
measured by higher numbers of referrals to gifted programs);10 (2)
confront issues of racism; (3) serve as advocates and cultural brokers;
and (4) develop more trusting relationships with students, particularly
those with whom they share a cultural background.11
A recent report shows that, despite the critical role that teachers of color
can play in helping students of color succeed, every state has a higher
percentage of students of color than teachers of color.12
The teaching force has become slightly more diverse in recent years. But
recent data from the National Center for Education Statistics (NCES)
estimates that the elementary and secondary student population will
continue to become less white and more diverse.13 Unless current
trends change, moving forward the disparity between the racial makeup
of students and teachers may increase further, fueling the need for
substantially more progress in increasing teacher diversity.
The purpose of this report is to provide a current snapshot of the
racial diversity of educators in our nation’s elementary and secondary
public schools. While not comprehensive, the report reviews trends in
the diversity of students, teachers, and education leaders; it examines
the teacher pipeline from enrollment in postsecondary education,
hiring, and teacher retention. This examination spotlights Historically
Black Colleges and Universities (HBCUs), as well as participation in
alternative certification programs. The report also includes statistics on
postsecondary completion, placement, and retention of new teachers of
color in the workforce.
While the focus of this report is on racial diversity, the Department
acknowledges that other forms of diversity such as socioeconomic
background, gender, sexual orientation, disability status, religion, and
multilingualism are also important and should be examined. For example,
when considering gender in addition to race, we know that black
males make up only 2 percent of the teaching workforce nationwide.
Addressing each of the above-listed disparities will require interventions
at all steps of the preparation, hiring, and retention processes. In addition,
while program quality is not within the scope of this report, diversifying
the teaching workforce should be pursued in conjunction with improving
the overall effectiveness of teachers and maintaining high-quality teacher
preparation programs.
Finally, the report provides examples of places that are working to
address the diversity issue in a variety of ways; other communities may
find these efforts instructive.14
2SUMMARY OF FINDINGS
Elementary and secondary school educators in the United States
are relatively homogenous racially.
• The elementary and secondary educator workforce is
overwhelmingly homogenous (82 percent white in public schools).15
• Over time, educator diversity has increased. In the 1987 – 88 school
year, 13 percent of public school teachers were teachers of color
compared to 18 percent in the 2011 – 12 school year.16
* While the proportion of all teachers of color has increased over
time, this trend is not the result of increases in the proportion
of teachers in all non-white racial and ethnic categories. For
example, the proportion of teachers who were black decreased
slightly over this time period.17
• Education leaders are also predominantly white. In the 2011 – 12
school year, only 20 percent of public school principals were
individuals of color.18
Diversity decreases at multiple points across the teacher
pipeline in which teachers progress though postsecondary
education, teacher preparation programs, and retention.19
• Bachelor’s degree students are less diverse than high school
graduates. In 2011 – 12, while 38 percent of bachelor’s degree
students were students of color,20 43 percent of public high school
graduates were students of color.21
• A large majority of education majors and, more specifically,
students enrolled in teacher preparation programs, are white. In the
2012 – 13 school year, 25 percent of individuals enrolled in a teacher
preparation program based in an institution of higher education
(IHE) were individuals of color. In comparison, 37 percent of all
individuals (regardless of major) in those same institutions were
individuals of color.22
• Like completion rates in other fields of study, bachelor’s degree
completion rates for students who major in education are
lower for black and Hispanic students than for white students.
Seventy-three percent of bachelor’s degree students majoring in
education completed a bachelor’s degree six years after beginning
postsecondary education. Forty-two percent of black bachelor’s
degree students majoring in education completed a bachelor’s
degree six years after beginning postsecondary education. Forty-
nine percent of Hispanic bachelor’s degree students majoring in
3education completed a bachelor’s degree six years after beginning
postsecondary education.23
• Teacher retention rates are higher among white teachers than for
black and Hispanic teachers.24
HBCUs and alternative routes to teacher certification tend to
enroll a more racially diverse population of teacher candidates.
• Two percent of individuals who are preparing to be teachers are
enrolled at HBCUs, but 16 percent of all black teacher candidates
attend HBCUs.25
• Alternative routes to teacher certification tend to enroll more
racially diverse populations of candidates than traditional teacher
preparation programs. Forty-two percent of teacher candidates
enrolled in an alternative teacher preparation program not based
in an IHE were individuals of color. Thirty-five percent of teacher
candidates enrolled in an alternative teacher preparation program
based in an IHE were individuals of color. Fewer teacher candidates
enrolled in a traditional teacher preparation program (26 percent)
were individuals of color.26
4RACIAL DIVERSITY OF STUDENTS AND
EDUCATORS
Racial Diversity of Students
The public school student population is projected to increase in
diversity. The National Center for Education Statistics (NCES) predicts
that white students will represent 46 percent of public school students
in 2024, a drop from 51 percent of the student population in 2012.
During the same 12-year timeframe, the proportion of Hispanic and
Asian/Pacific Islander students is projected to increase. Hispanic
public school students are projected to represent 29 percent of total
enrollment in 2024 (compared to 24 percent in 2012) and Asian/
Pacific Islander students are projected to represent 6 percent of total
enrollment in 2024 (compared to 5 percent in 2012). Black students are
projected to be 15 percent of all public school students in 2024, which is
a slight decrease from 16 percent in 2012.27
Figure 1. Percentage distribution of students enrolled in public elementary
and secondary schools, by race/ethnicity: Fall 2002, 2012, and
2024
Race/ethnicity
† Not applicable.
NOTE: Prior to 2008, separate data on students of two or more races were not collected. Detail may
not sum to totals because of rounding. Data for 2024 are projected.
SOURCES: U.S. Department of Education, National Center for Education Statistics, Common
Core of Data (CCD), “State Nonfiscal Survey of Public Elementary and Secondary Education,”
2002 – 03 and 2012–13; and National Elementary and Secondary Enrollment Projection
Model, 1972 through 2024. See Digest of Education Statistics 2014, Table 203.50. available at
http://nces.ed.gov/programs/coe/indicator_cge.asp
5Racial Diversity of Teachers
The elementary and secondary school teacher workforce in the United
States is not as racially diverse as the population at large or the students. In
the 2011 – 12 school year, 82 percent of public school teachers were white. In
comparison, 51 percent of all 2012 elementary and secondary public students
were white.28 In contrast, 16 percent of students were black,29 and 7 percent
of public teachers were black. Likewise, while 24 percent of students were
Hispanic,30 8 percent of teachers were Hispanic. In the 2011 – 12 school year,
the racial demographics of elementary school teachers were similar to those
of secondary school teachers.31 In addition, k – 12 educators were less likely
to be black or Hispanic than early learning educators (particularly those
teaching in Head Start or teaching without a bachelor’s degree).32
Figure 2 shows that the population of public school teachers has gradually
become more diverse over time. In the 1987 – 88 school year, 87 percent of
public school teachers were white compared to 82 percent in the 2011 – 12
school year. Over the same time period, the proportion of black public school
teachers fell from 8 percent to 7 percent, and the proportion of Hispanic
public school teachers grew from 3 percent to 8 percent. The proportion
of teachers who were Asian increased from 1 percent to 2 percent. The
proportion of teachers who were American Indian or Alaska Native dropped
from roughly 1 percent to half a percent.
Figure 2. Percentage distribution of teachers in public elementary and
secondary schools, by race/ethnicity: Selected years, 1987 – 88
through 2011 – 12
Percent
Year
*Data for years 1987– 88 through 1999 – 2000 are only roughly comparable to data for later years, because the
new category of two or more races was introduced in 2003 – 04.
NOTE: Excludes prekindergarten teachers. Data are based on a head count of full-time and part-time teachers
rather than on the number of full-time-equivalent teachers reported in other tables. The detail may not sum to
totals because of rounding, missing data, and cell suppression. Race categories exclude persons of Hispanic
ethnicity. The Other category represents the sum of Asian, Pacific Islander, American Indian or Alaska Native,
and Two or more races.
SOURCE: U.S. Department of Education, National Center for Education Statistics, Schools and Staffing
Survey (SASS), “Public School Teacher Data File,” 1987 – 88 through 2011 – 12. See Digest of Education Statistics
2013, Table 209.10, Number and percentage distribution of teachers in public and private elementary and
secondary schools, by selected teacher characteristics: Selected years, 1987 – 88 through 2011 – 12, available at
https://nces.ed.gov/programs/digest/d13/tables/dt13_209.10.asp
6Compared to all teachers, black and Hispanic teachers are employed
in different kinds of schools as measured by the socio-economic and
racial composition of students. High-poverty elementary and secondary
schools employed a greater percentage of black and Hispanic teachers
and a smaller percentage of white teachers than did low-poverty
schools, according to a 2007 – 08 NCES analysis. Among teachers
working in high-poverty elementary and secondary schools, 63 percent
were white, 16 percent were black, and 17 percent were Hispanic,
according to the data. In comparison, among teachers working in low-
poverty schools, 92 percent were white, 3 percent were Hispanic, and
3 percent were black.33 Teachers of color are also overwhelmingly
employed in public schools serving student populations with relatively
high proportions of students of color and public schools in urban
communities.34
SPOTLIGHT: BOSTON PUBLIC SCHOOLS
Thirty-seven percent of BPS teachers are teachers of color, and
25 percent of the new teachers hired in the 2015–16 school year
were black. The Office of Human Capital developed a strategic
plan focused on three distinct areas: workforce diversity, workforce
inclusion, and sustainability. Programs they run include the following:
One specific program that has been highly effective to increase
the diversity of their teacher workforce is called the Boston Public
School High School to Teacher Program. This program identifies
city students in high school who would make great teachers. The
program then provides the students with mentors, gives them
college prep courses, half their tuition and, if they are successful,
teaching jobs. Eighty-seven percent of the participants are black or
Latino.
Racial Diversity of Principals
For the most part, principals are also a racially homogenous group.
In the 2011 – 12 school year, a majority of public school principals were
white (80 percent), while 10 percent were black and 7 percent were
Hispanic. In the 2003 – 04 school year, the proportion of public school
principals who were white was 82 percent, and 11 percent were black
and 5 percent were Hispanic.
7Figure 3. Percentage distribution of public school principals, by race/
ethnicity: Selected years 2003 – 04, 2007 – 08, and 2011 – 12
Year
Percent
NOTE: The 2007 – 08 data for the Other category include estimates in which the coefficient of
variation (CV) is between 30 and 50 percent of estimates.
The Other category represents the sum of Asian, Pacific Islander, American Indian or Alaska Native,
and Two or more races.
SOURCE: U.S. Department of Education, National Center for Education Statistics, Digest of Education
Statistics, 2014, Table 212.08, Number and percentage distribution of principals in public and private
elementary and secondary schools, by selected characteristics: Selected years, 1993 – 94 through
2011 – 12; available at https://nces.ed.gov/programs/digest/d14/tables/dt14_212.08.asp.
The percentage of new white principals35 (77 percent) in public schools
was lower than the percentage of experienced white principals (84
percent) in public schools in the 2011 – 12 school year. The percentages
of new black and Hispanic principals were higher than the percentages
of experienced black and Hispanic principals in public schools. For
example, black principals comprised 11 percent of all new public school
principals, compared with 8 percent of all experienced principals in
public schools. New Hispanic public school principals accounted for
approximately 8 percent of all new principals in 2011 – 12, compared with
approximately 5 percent of all experienced Hispanic principals in public
schools.36
8EDUCATOR PIPELINE
The educator pipeline provides the supply of teachers and educators
for the elementary and secondary school workforce. For teachers
produced by traditional teacher undergraduate preparation programs,
points along this pipeline include postsecondary enrollment, enrollment
in teacher preparation programs, postsecondary completion, entrance
to the elementary and secondary workforce (after receiving teacher
certification or licensing), and teacher retention.37 The proportion of
teacher candidates of color decreases at multiple points along the
teacher pipeline.
Figure 4. Key points along the educator pipeline
9Postsecondary Enrollment
With few exceptions, postsecondary education is the pathway by which
new teachers enter the educator workforce.38 Even for postsecondary
students who may not choose to major in education, having some
degree of postsecondary education can serve as a gateway into later
opportunities to become educators through continuing education and/
or alternative pathways into teaching, since all states require at least a
bachelor’s degree to become certified to teach.
In examining the diversity in the racial composition of bachelor’s
degree students, the first point examined of this pipeline, data show
that the racial composition of bachelor’s students is less diverse than
that of students who graduate from a public high school.
Figure 5 shows the racial composition of high school graduates and
bachelor’s degree students (including transfer students). In 2011 – 12,
while only 57 percent of students graduating high school were white,
62 percent of students enrolled in a bachelor’s degree program were
white. The proportions of blacks were similar in the populations of high
school graduates and bachelor’s degree students. Thirteen percent of
bachelor’s degree students were Hispanic and 19 percent of high school
graduates were Hispanic. Efforts to create an educator workforce that
is racially diverse is hampered by this initial decline in diversity.
Figure 5. Percentage of enrollment for high school graduates and
bachelor’s degree students, by race/ethnicity: 2011 – 12
Percent
NOTES: The Other category for high school graduates combines Asian/Pacific Islander (6 percent),
American Indian/Alaska Native (1 percent), and Two or more races( 2 percent. The Other category
for bachelor’s degree combines Asian (7 percent), American Indian or Alaska Native (1 percent),
Native Hawaiian/other Pacific Islander (rounds to 0 percent), and More than one race (3 percent).
SOURCES: U.S. Department of Education, National Center for Education Statistics, 2011 – 12 National
Postsecondary Student Aid Study (NPSAS:12) and Digest of Education Statistics, 2013: Table
219.30, Public high school graduates, by race/ethnicity: 1998 – 99 through 2023 – 24. Available at
https://nces.ed.gov/programs/digest/d13/tables/dt13_219.30.asp
Though data in Figure 6 focus on education majors, it is important to
note that not all students who major in education will become teachers.
10While most degrees awarded to education majors are directly related to
elementary and secondary school teaching, education majors specialize
in a broad set of areas. Some education majors are enrolled in programs
that focus on the theory and practice of learning and teaching and
related research. Some are enrolled in programs that focus on school-
based administrative and support services. The racial composition of
bachelor’s degree students who pursue education-related majors is less
diverse than that of similar students who major in several other fields
of study. While 62 percent of all bachelor’s degree students in 2012
were white, 73 percent of students majoring in education were white.
However, the racial composition of the population of students enrolled
in bachelor’s degree programs is becoming more diverse over time.
In addition, the racial composition of bachelor’s degree students who
major and complete education bachelor’s degrees is also becoming more
diverse over time.
Figure 6. Percentage distribution for bachelor’s degree students, by major
and race/ethnicity: 1999 – 2000 and 2011 – 12
Student
majors
Percent
NOTE: The Other category for bachelor’s degree combines Asian, American Indian or Alaska Native,
Native Hawaiian/other Pacific Islander, and More than one race
SOURCES: U.S. Department of Education, National Center for Education Statistics, National
Postsecondary Student Aid Study (NPSAS:00 and NPSAS:12).
Similarly, the racial composition of the population of master’s degree
students who major in education has historically been less diverse than
master’s degree students who major in several other fields of study.
While 64 percent of all master’s degree students in 2012 were white, 71
percent of those students majoring in education were white. However,
Figure 7 shows that the racial composition of the population of students
enrolled in bachelor’s and master’s degree programs is becoming more
diverse over time. In addition, the racial composition of the population of
11bachelor’s degree and master’s degree students who major in education
is also becoming more diverse over time.
Figure 7. Percentage distribution of master’s degree students, by field of
study and race/ethnicity: 1999 – 2000 and 2011 – 12
Student
majors
Percent
NOTE: The Other category for bachelor’s degree combines Asian, American Indian or Alaska Native,
Native Hawaiian/other Pacific Islander, and More than one race.
SOURCE: U.S. Department of Education, National Center for Education Statistics, National
Postsecondary Student Aid Study: (NPSAS:00 and NPSAS:12).
In examining within-race disaggregation of education majors, among
white bachelor’s degree students, 8 percent majored in education.
Among black bachelor’s degree students, 5 percent majored in
education; among Hispanic bachelor’s degree students, 6 percent did so.
Figure 8. Percentage of bachelor’s degree students majoring in education,
by race/ethnicity: 201 1 – 12
Race/ethnicity
Percent
NOTE: The figure excludes Asian (2 percent), American Indian or Alaska Native (5 percent), and More
than one race (4 percent). The standard error for Native Hawaiian/other Pacific Islander estimate
represents more than 50 percent of the estimate.
SOURCE: U.S. Department of Education, National Center for Education Statistics, 2011 – 12 National
Postsecondary Student Aid Study (NPSAS:12).
In examining within-race disaggregation of education majors among
master’s students, roughly a quarter of students in each category of
white, black, and Hispanic are enrolled as education majors.
12Figure 9. Percentage of master’s degree students enrolled in an education-
related field of study, by race/ethnicity: 2011 – 12
Race/ethnicity
Percent
NOTE: The figure excludes Asian (5 percent), values for More than one race, American Indian or Alaska
Native, and Native Hawaiian/other Pacific Islander, which either did not meet reporting standards or
had standard errors representing more than 30 percent of estimate.
SOURCE: U.S. Department of Education, National Center for Education Statistics, 2011 – 12 National
Postsecondary Student Aid Study (NPSAS:12).
Teacher Preparation Programs
The U.S. Department of Education’s existing definitions for the Higher
Education Act (HEA) Title II reporting system define a teacher preparation
program as a state-approved course of study, the completion of which
signifies that an enrollee has met all the state’s educational requirements,
or training requirements (or both) for an initial credential to teach in the
state’s elementary, middle, or secondary schools. A teacher preparation
program may either be a traditional program or an alternative route
to certification program, and may be offered within or outside an
IHE. Alternative-route teacher preparation programs primarily serve
candidates who states permit to be the teachers of record in a classroom
while participating in the program. These programs may be within an IHE
(referred to as an “alternative, IHE-based” provider) or outside an IHE
(referred to as an “alternative, not IHE-based” provider).
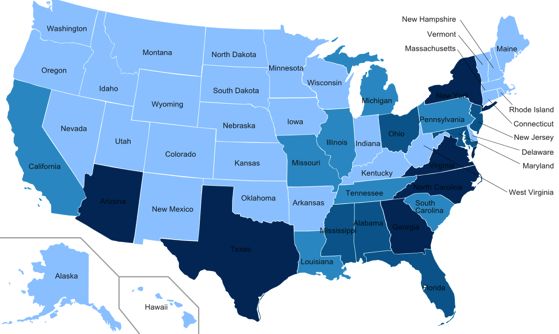
According to report cards that states have provided under the HEA Title II
reporting system, black enrollees were concentrated in programs located
in the Southeast, mid-Atlantic, and Arizona (i.e., due largely to online
enrollment in the University of Phoenix, though these students could
13reside anywhere), while Hispanic enrollees were concentrated in the
Southwest, Florida, and New York City area.39 While teacher preparation
programs in some regions enroll more numbers of black and Hispanic
teacher candidates, candidates who end up teaching in an elementary
and secondary school do not necessarily teach in the region the
program is located in.
Figure 10. Black enrollment in teacher preparation programs, by state where
program is located: 2013 – 14
Less than or equal to 500 students
501 — 1,000 students
1,001 — 2,000 students
2001 — 10,000 students
SOURCE: Based on data from U.S. Department of Education, Office of Postsecondary Education.
(2015). Higher Education Act Title II reporting system.
Figure 11. Hispanic enrollment in teacher preparation programs, by state
where program is located: 2013 – 14
Less than or equal to 500 students
501 — 1,000 students
1,001 — 2,000 students
2001 — 10,000 students
SOURCE: Based on data from U.S. Department of Education, Office of Postsecondary Education.
(2015). Higher Education Act Title II reporting system.
For IHEs with teacher preparation programs, in 2012 – 13, the overall
student population was more diverse than the subset of students
enrolled in the teacher preparation programs. In 2012 – 13, the overall
14student population in IHEs with the teacher preparation program was 63
percent white, 13 percent black, 14 percent Hispanic, 6 percent Asian, and
1 percent American Indian or Alaska Native. In comparison, the subset
of students in IHEs enrolled in a teacher preparation program was 74
percent white, 9 percent black, 10 percent Hispanic, 2 percent Asian, and
1 percent American Indian or Alaska Native.
Figure 12. Percentage distribution of all enrollees in IHEs with teacher
preparation programs versus the distribution of enrollees at those
IHEs who are in a teacher preparation program, by race/ethnicity:
2012 – 13
Race/ethnicity
Percent
NOTE: Host IHEs are the IHEs at which the teacher preparation programs are based. This figure
includes data for the 1,851 IHE-based teacher preparation programs that had data available for this
figure. The percentages may not sum to 100 percent due to rounding.
SOURCES: U.S. Department of Education, Office of Postsecondary Education. (2015). Higher
Education Act Title II reporting system. U.S. Department of Education, National Center for Education
Statistics. (2015). Integrated Postsecondary Education Data System (IPEDS).
15SPOTLIGHT: CALL ME MISTER
Call Me MISTER (Mentors Instructing Students Toward Effective Role
Models) is an initiative launched in South Carolina in 2000 to recruit
all students, with a particular focus on college male freshmen of color,
from the community into the teaching profession. The program has
expanded to Jackson State University in Jackson, Mississippi and
continues to grow nationally. The mission of the Call Me MISTER
Initiative is to increase the pool of available teachers from a broader
more diverse background particularly among the state’s lowest-
performing elementary schools. Student participants are largely selected
from among under-served, socio-economically disadvantaged and
educationally at-risk communities. The project provides
• tuition assistance through Loan Forgiveness programs for admitted
students pursuing approved programs of study in teacher education
at participating colleges;
• an academic support system to help assure their success;
• a cohort system for social and cultural support; and
• assistance with job placement.
Enrollment at Historically Black Colleges and Universities
(HBCUs)
The Higher Education Act of 1965, as amended, defines an HBCU as “…
any historically black college or university that was established prior
to 1964, whose principal mission was, and is, the education of black
Americans, and that is accredited by a nationally recognized accrediting
agency or association determined by the Secretary [of Education] to be
a reliable authority as to the quality of training offered or is, according
to such an agency or association, making reasonable progress toward
accreditation.”40 Since a large majority of students in HBCUs are black
students, these institutions provide an important opportunity for black
education degree-seeking students. For the 2012 – 13 academic year, 75
teacher preparation programs in HBCUs reported enrollment data under
the HEA Title II reporting system. According to these reports, programs
at these HBCUs enrolled 2 percent of the individuals enrolled in IHE-
based teacher preparation programs, but enrolled 16 percent of all
candidates in IHE-based teacher preparation programs who identified as
black.
16Figure 13. Share of teacher preparation program enrollment
in HBCUs: 2012 – 13
Teacher Preparation
Program Enrollment
Percent
NOTE: This figure reflects data states reported for the 1,851 teacher preparation programs that had
data available for IHE-based teacher preparation programs.
SOURCES: U.S. Department of Education, Office of Postsecondary Education. (2015). Higher Education
Act Title II reporting system. U.S. Department of Education, National Center for Education Statistics.
(2015). Integrated Postsecondary Education Data System (IPEDS).
Alternative-Route Teacher Preparation Program Students
For the 2012 – 13 school year, states reported a total 8,075 alternative-
route teacher preparation programs — accounting for 30 percent of the
26,589 teacher preparation programs across the country. Of the total
number of alternative-route teacher preparation programs, 5,325 (66
percent) were based at an IHE, and 2,750 (34 percent) were not based at
an IHE. Whereas traditional teacher preparation programs usually have
students complete coursework needed for a regular teaching credential
before they can receive a teaching credential and become a teacher
of record, most alternative-route preparation programs enroll students
who already have a bachelor’s degree and then receive a credential
that enables them to become teachers of record while they complete
requirements for a regular teaching credential. Many of the alternative-
route certification programs are offered online and allow students to
complete coursework while they work. This kind of flexibility and the
accelerated schedule offered by alternative-route certification programs
can be attractive to individuals who want to pursue a teaching career or
change from their current careers to become teachers, but who need to
work while doing so or have other relevant constraints.
The racial composition of students in the alternative-route teacher
preparation programs is more diverse than that of the traditional teacher
preparation program. In the 2012 – 13 academic year, 16 percent of
individuals enrolled in alternative programs based at IHEs and 18 percent
of individuals enrolled in alternative-route programs not based at IHEs
were black, compared to only 9 percent in traditional programs. Eighteen
percent of individuals enrolled in alternative-route programs not based at
IHEs were Hispanic, compared to 11 percent in traditional programs.
17Figure 14. Percentage distribution for types of teacher preparation
programs, by race/ethnicity: 2012 – 13
Percent
Race/ethnicity
NOTE: The data on enrollment by race/ethnicity were not available for all teacher preparation
programs. Some teacher preparation programs provided only the total number of students
enrolled; thus, the sum of the number of students enrolled by characteristic will not equal the total.
The 50 states, the District of Columbia, Puerto Rico, American Samoa, Guam, Marshall Islands,
Micronesia, Northern Mariana Islands, Palau, and Virgin Islands submitted a state Title II report in
2014.
SOURCES: U.S. Department of Education, Office of Postsecondary Education. (2015). Higher
Education Act Title II reporting system.
Postsecondary Completion
Bachelor’s degree completion rates are lower for black and Hispanic
students than the rate for white students. Likewise, bachelor’s degree
completion rates are lower for black and Hispanic students who major
in education than the rate for white students. As Figure 15 indicates,
among all undergraduate education majors, 42 percent of blacks and
49 percent of Hispanics attain a bachelor’s degree within six years,
while 73 percent of whites do so.
18Figure 15. Cumulative persistence and attainment by 2008 – 09 for bachelor’s
degree students who began postsecondary education in 2003 – 04,
by major and race/ethnicity
Race/ethnicity
and major
Percent
NOTES: Bachelor’s degree attainment refers to bachelor’s degree attainment in any major. Standard
errors represent more than 30 percent of the estimates for “Other outcomes” for education majors.
Represents cumulative persistence and attainment by 2008 – 09 for students who began
postsecondary education in academic year 2003 – 04, major when last enrolled academic year 2005-
06, enrolled in a bachelor’s degree program or higher (including first professional or graduate level)
when last enrolled in academic year 2005– 06. Major refers to major when last enrolled in academic
year 2005-06. Bachelor’s degree students refer to students enrolled in a bacheors degree program
or higher when last enrolled in the academic year 2005-06.
SOURCE: U.S. Department of Education, National Center for Education Statistics, 2003 – 04
Beginning Postsecondary Students Longitudinal Study, Second Follow-up (BPS: 04/09).
The Integrated Postsecondary Education Data System41 (IPEDS)
provides self-reported data from all IHEs participating in HEA Title IV
federal grant and loan programs. In addition to institution-level data,
IPEDS provides data at the program level for completions. These
programs are defined by Classification of Instructional Program (CIP)
codes including the CIP code for education majors, which focus on
the theory and practice of learning and teaching, and related research,
administrative, and support services. IPEDS reports the number of
degrees and certificates conferred by race/ethnicity and academic
level. For the purposes of this report, “education major awards” are
defined as bachelor’s degrees, master’s degrees, postbaccalaureate
certificates, and post-master’s certificates categorized under the CIP
code, 13 (education). For the purpose of this report, education major
awards provide a proxy for students who are preparing to start a career
in teaching.
19In the 2012 – 13 academic year, public institutions awarded the majority
of education major awards conferred as either bachelor’s degree,
master’s degree, post-baccalaureate or post-master’s certificate. At
those academic levels, 56 percent of education major awards were
conferred by public institutions, 38 percent of education major awards
were conferred by private institutions, and 7 percent of education major
awards were conferred by for-profit institutions. Public institutions
conferred 49 percent of education major awards provided to students
of color, private institutions conferred 40 percent of the education
major awards provided to students of color, and for-profit institutions
conferred 12 percent of the education major awards provided to
students of color.
Figure 16. Share of awards conferred for education majors and all majors, by
institution type: 2012 – 13
Awards conferred
Percent
NOTES: “Education” refers only to awards of bachelor’s degrees, master’s degrees, postbaccalaureate
certificates, and post-master’s certificates in the CIP code, 13 (Education). Students of color include
all non-white categories of race including race unknown. Awards include only “first major” awards—
those reported as the first major for students who were conferred awards as dual majors. The
universe of institutions is restricted to IPEDS Title IV institutions.
SOURCES: U.S. Department of Education, National Center for Education Statistics,
Integrated Postsecondary Education Data System (IPEDS) and College Scorecard
(see https://collegescorecard.ed.gov/data/).
In the 2012 — 13 academic year, HBCUs granted 1 percent of the
education major awards conferred at the academic levels of bachelor’s
degree, master’s degree, post-baccalaureate and post-master’s
certificate. At those same academic levels, HBCUs granted 4 percent
of the education major awards conferred to students of color. IHEs
receiving Minority Serving Institution42(MSI) grants from the Department
conferred 6 percent of all the education major awards. MSI grantees
conferred 12 percent of the education major awards to students of color.
20Figure 17. Share of education major awards conferred, by MSI/HBCU status:
2012 – 13
Percent
Awards conferred
NOTES: “Education” refers only to awards of bachelor’s degrees, master’s degrees,
postbaccalaureate certificates, and post-master’s certificates in the CIP code, 13 (Education).
Students of color include all non-white categories of race including race unknown. Awards include
only “first major” awards. The universe of institutions is restricted to IPEDS Title IV institutions.
SOURCES: U.S. Department of Education, National Center for Education Statistics,
Integrated Postsecondary Education Data System (IPEDS) and College Scorecard
(https://collegescorecard.ed.gov/data/).
The student population awarded education degrees from most
institutions is less racially and ethnically diverse than the population
of students awarded non-education degrees. The scatter plot in
Figure 18 shows the percentage of education major awards conferred
to white students versus the percentage of non-education major
awards conferred to white students. The points above the diagonal
line represent institutions with higher proportions of white students
receiving education major awards compared to the proportion of white
students receiving non-education major awards. The scatter plot shows
that many public, private, and for-profit institutions confer higher
proportions of education major awards than of non-education major
awards to white students.
21Figure 18. Percentage of education degrees awarded to white students
compared to percentage of non-education degrees awarded to
white students, by institution type: 2012 – 13
1
Percentage Education Awards to Whites
% Edu Major Awards to White Students
.8
.6
.4
.2
0
0 .2 .4 .6 .8 1
% non-Edu Major Awards to White Students
Private Public
For_profit y=x
NOTES: Includes only institutions where n>=30. “Education” refers only to awards of bachelor’s
degrees, master’s degrees, postbaccalaureate certificates, and post-master’s certificates in the CIP
code, 13 (Education). Non-education refers only to awards of bachelor’s degrees, master’s degrees,
postbaccalaureate certificates, and post-master certificates in any other CIP code except for the CIP
code for Education (13). Awards include only “first major” awards — those reported as the first major
for students who were conferred awards as dual majors.
SOURCES: U.S. Department of Education, National Center for Education Statistics,
Integrated Postsecondary Education Data System (IPEDS), College Scorecard data
http://collegescorecard.ed.gov/data/.
Entering the Teacher Workforce
Hiring and retention practices also play an important role in the
development of a diverse teaching workforce. A study of six urban
schools suggests that even in cases where schools have strategies in
place to recruit teachers of color, recruiting and retaining teachers of
color is difficult. The study suggests that there may be many challenges
to recruiting teachers of color, and that school recruiting, hiring, and
retention practices need to specifically address these challenges.43
Bachelor’s Degree Graduates
The Department’s Baccalaureate and Beyond (B&B) Longitudinal Study
administered by NCES provides information concerning education and
work experiences following completion of the bachelor’s degree. It
provides both cross-sectional profiles of the enrollment, persistence,
22and financial aid receipt of bachelor’s degree recipients in their final year
of undergraduate education; and longitudinal data on their entry into
and progress through graduate-level education and the workforce with
special emphasis on k – 12 teaching.44
The B&B study surveyed recent bachelor’s degree recipients who
prepared45 for teaching or were considering teaching about whether
or not they applied for k – 12 teaching positions shortly after graduation.
Among those graduates who applied to a k – 12 teaching positions, 66
percent were white, 12 percent were black, and 15 percent were Hispanic.
Figure 19. Percentage distribution of 2007 – 08 bachelor’s degree recipients
who reported applying for k – 12 teaching position as of 2012, by
race/ethnicity
NOTES: “Other” refers to Asian, American Indian or Alaska Native, Native
Hawaiian/other Pacific Islander, More Than One Race, and other. The standard
error for Other value represents more than 30 percent of the estimates.
The figure above applies to respondents who had prepared to teach or were currently considering
teaching.
SOURCE: U.S. Department of Education, National Center for Education Statistics, 2008/12
Baccalaureate and Beyond Longitudinal Study (B&B:08/12).
In examining within-race disaggregation, among white bachelor’s degree
recipients, 13 percent applied for a k – 12 teaching position. Among black
bachelor’s degree recipients, 15 percent applied for a k – 12 teaching
position. Among Hispanic bachelor’s degree recipients who prepared
to teach or were considering teaching, 18 percent applied for a k – 12
teaching position.
23Figure 20. Percentage of 2007 – 08 bachelor’s degree recipients who
reported applying for a k – 12 teaching position as of 2012,
by race/ethnicity
Race/ethnicity
Percent
NOTES: applies to respondents who had not taught and had prepared to teach or were currently
considering teaching.
Asian, American Indian or Alaska Native, More than one race, Native Hawaiian/other Pacific Islander,
and Other values either round to zero or have standard errors that represent more than 30 percent
of estimate.
SOURCE: U.S. Department of Education, National Center for Education Statistics, 2008/12
Baccalaureate and Beyond Longitudinal Study (B&B:08/12).
Based on data from the B&B study, 73 percent of 2007 – 08 all
bachelor’s degree graduates were white, 9 percent of all graduates
were black, and 9 percent of all graduates were Hispanic. Eighty-four
percent of all graduates who had a first or second major in education
were white, 4 percent of all graduates who had a first or second major
in education were black, and 8 percent of all graduates who had a first
or second major in education were Hispanic. Seventy-nine percent
of graduates who taught at the k – 12 level were white, 7 percent of
graduates who taught were black, and 8 percent of graduates who
taught were Hispanic.
24Figure 21. Percentage distribution of 2007 – 08 bachelor’s degree recipients
for all majors, for those who majored in education, and for those
who worked as a k–12 teacher, by race/ethnicity: 2012
Percent
Race/ethnicity
NOTES: Other category combines Asian, American Indian or Alaska Native, More than one race,
Native Hawaiian/other Pacific Islander, and Other. Worked as a k – 12 teacher refers to ”regular”
teaching positions that exclude temporary substitute teaching. “Education Majors” refers to
individuals who had a major in teaching as of 2008.
SOURCE: U.S. Department of Education, National Center for Education Statistics, 2008/12
Baccalaureate and Beyond Longitudinal Study (B&B:08/12).
Similar to those bachelor’s degree recipients who majored in education
and those who went on to teach, those who were certified to teach were
also predominately white. Eighty-two percent of 2007 – 08 bachelor’s
degree recipients who were fully certified to teach at the k – 12 level
(by 2012) were white. However, only 4 percent of recent graduates
certified to teach were black, and 9 percent of recent graduates
certified to teach were Hispanic.46 Certification rates may be impacted
by performance on licensure exams. Research suggests that teachers of
color, on average, score lower on licensure tests and have lower passing
rates than their white counterparts.47
New Teachers
The racial composition of new teachers entering the teaching profession
is more diverse than the racial composition of all teachers. In 2011 – 12,
while 82 percent of public school teachers were white, 78 percent of
teachers with three or fewer years of experience were white. While 7
percent of all teachers were black, 8 percent of all teachers with three
or fewer years of experience were black. While 8 percent of all teachers
were Hispanic, 10 percent of all teachers with three or fewer years of
experience were Hispanic.
25Figure 22. Percentage distribution of public school teachers for all teachers
and teachers with three or fewer years of experience, by race/
ethnicity: 2012
Teachers
Percent
SOURCE: U.S. Department of Education, National Center for Education Statistics, Schools and
Staffing Survey (SASS).
SPOTLIGHT: TEACH TOMORROW IN OAKLAND
Teach Tomorrow in Oakland (TTO) is a teacher recruitment and
development program that aims to place teachers in the classroom
who reflect the diversity of the local student population by focusing
their recruitment efforts on all members of the local community.
The program is the result of a grass-roots movement to diversify
the Oakland Unified School District (OUSD) teaching workforce and
a strategic partnership with former U.S. Rep. Ronald Dellums. The
program recruits OUSD alumni, community members, middle and high
school students, paraprofessionals, out-of-industry professionals, and
student teachers who value education, growth, and educating Oakland
youth. TTO provides educational and financial support for qualified
TTO cohort members looking to successfully complete the California
state credentialing requirements and commit to teaching within
OUSD. Participants attend qualified, accredited university programs
from May to July for pre-service training and then attend an intensive
six-week training program before being placed as teacher interns in
August. During their intern year, participants function as a teacher of
record while taking classes to earn certification. TTO provides tutoring,
professional development, and classroom resources throughout the
program. Participants are often recruited from the communities in which
the program hopes to place teachers. Funding comes from federal
grants and district support.
26You can also read


