Has the Stereotype of the Scientist Changed in Early Primary School-Aged Students Due to COVID-19? - MDPI

Page created by Matthew Watson
 
CONTINUE READING
Has the Stereotype of the Scientist Changed in Early Primary School-Aged Students Due to COVID-19? - MDPI
education
                sciences
Article
Has the Stereotype of the Scientist Changed in Early Primary
School–Aged Students Due to COVID-19?
César Quílez-Cervero † , María Diez-Ojeda † , Altamira Alicia López Gallego †
and Miguel Ángel Queiruga-Dios *,†

                                          Department of Specific Didactics, Universidad de Burgos, 09001 Burgos, Spain;
                                          cquilezcervero@educa.jcyl.es (C.Q.-C.); mdojeda@ubu.es (M.D.-O.); aalgallego@ubu.es (A.A.L.G.)
                                          * Correspondence: maqueiruga@ubu.es
                                          † These authors contributed equally to this work.

                                          Abstract: The image that students have of scientists and their context appears distorted by multiple
                                          factors. The detection and modification of this image is important because this is related to scientific
                                          vocations. This research analyzes the drawings made by 128 early primary school–aged students
                                          (58 girls and 70 boys) from 6 to 8 years to determine the image they have regarding the scientist,
                                          their activity, and their environment, and how the current situation due to COVID-19 may affect this
                                          image. The analysis rubric defined in the modified Draw A Scientific Test-prompt was used. Results
                                          indicate that the image that the students have, in general, is far from the traditional one. Thus, the
                                          students draw both young women and men working in science, the girls being the ones who most
                                          habitually represent scenes broader than traditional. In addition, the influence of the COVID-19 crisis
                                is perceived in some of the illustrations.
         

Citation: Quílez-Cervero, C.;             Keywords: scientist image; early Primary; COVID-19; draw a scientist; gender; mDAST
Diez-Ojeda, M.; López Gallego, A.A.;
Queiruga-Dios, M.Á. Has the
Stereotype of the Scientist Changed in
Early Primary School–Aged Students        1. Introduction
Due to COVID-19? Educ. Sci. 2021, 11,
                                                The scientific education that students receive occurs in a great diversity of places,
365. https://doi.org/10.3390/
                                          therefore, the image that students have with respect to the person who is dedicated
educsci11070365
                                          to science and their work, appears strongly influenced by the information they receive
                                          from popular culture and the media [1–3]. Currently, news about the crisis triggered
Academic Editor: Beth L. MacDonald
                                          by COVID-19 has flooded the media for more than a year, with the world presently
                                          involved in a situation of information overload. The news are disseminated through
Received: 5 June 2021
Accepted: 17 July 2021
                                          internet media, friends, traditional media, academic courses, medical staff in healthcare
Published: 20 July 2021
                                          institutions, coworkers, and family members. However, it is not only the large amount
                                          of information that can have an impact on families and children. On the contrary, this
Publisher’s Note: MDPI stays neutral
                                          information overload, especially mixed with false information, causes continuous concern
with regard to jurisdictional claims in
                                          in families and is a cause of stress [4]. Early Primary students are no strangers to this
published maps and institutional affil-   information, and what they are seeing every day on televisions, listening to their parents,
iations.                                  friends and siblings, should, therefore, influence the image they have of science and
                                          scientists’ work.
                                                This image that students are forging with respect to the person who is dedicated to
                                          science and around their environment, is an aspect to take into account in the development
Copyright: © 2021 by the authors.
                                          of attitudes towards science and future scientific vocations [5]. Traditionally, confusing
Licensee MDPI, Basel, Switzerland.
                                          and inappropriate images of science and scientists are considered associated with negative
This article is an open access article
                                          attitudes towards science [6–9], while more realistic conceptions of scientists are necessary
distributed under the terms and           for understanding the nature of science, in addition to helping students make decisions
conditions of the Creative Commons        about their careers [10].
Attribution (CC BY) license (https://           It is therefore necessary to know the image that the students have of the scientists and
creativecommons.org/licenses/by/          their work, and to find a way to make students aware of what the reality of the person who
4.0/).                                    is dedicated to science is like. This can serve to get students excited about science and its

Educ. Sci. 2021, 11, 365. https://doi.org/10.3390/educsci11070365                                         https://www.mdpi.com/journal/education
Has the Stereotype of the Scientist Changed in Early Primary School-Aged Students Due to COVID-19? - MDPI
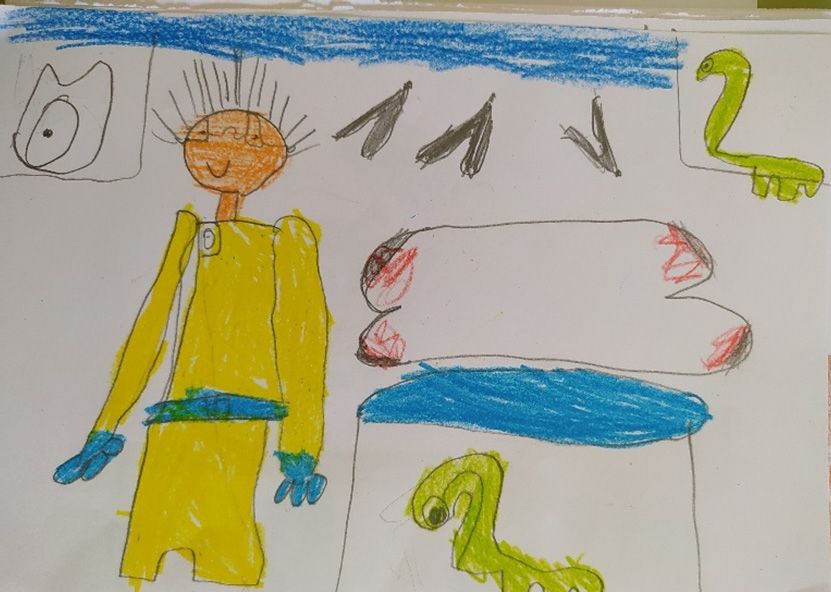
Educ. Sci. 2021, 11, 365                                                                                            2 of 21

                           nature so they see science careers as a possibility [10–13]. In addition, these images that
                           are formed become persistent, remaining in time and strengthening as students’ progress
                           takes place through the academic years [6,8,9,14–17]. This stereotype of the scientist affects
                           women with greater intensity. They are not represented at all in the images that are usually
                           shown, which finally affects their choice of scientific-technological studies, negatively
                           influencing the construction of their self-esteem [18–20]. However, this stereotypical image
                           of the person who is dedicated to science is changing in such a way that in recent studies
                           there are more representations of women scientists [16,21,22].
                                  One of the first studies in which the image of the scientist is analyzed is Mead and
                           Metraux’s [23] p. 384, carried out with American Secondary-school students. In this study,
                           the students showed an interest in “finding out confidentially what you think about science
                           and scientists”. The students had to write answers to a series of incomplete questions,
                           which showed the students’ views of scientists. They found the image of the scientists as
                           that of an old or middle-aged man with glasses, wearing a white robe and working in a
                           laboratory. That person is surrounded by bubbling test tubes and bottles, and he spends
                           his days doing experiments. This image of the scientist shows two sides, one is positive,
                           as an intelligent man, who is interested in his work and takes it seriously, and another
                           negative side: he is a brain that spends his days locked up, sitting in a laboratory throwing
                           things from one tube to another in a monotonous work. Many other subsequent studies
                           confirmed this stereotypical image of the scientist [24–27].
                                  However, expressing their visions through written texts is difficult for young students.
                           So, one technique that can be used to understand students’ ideas is to use drawings. This
                           is due to the fact that the students are immersed in contexts that are rich in images, which
                           makes many of them “visual thinkers” [28]. It is accepted that the illustrations that children
                           make are a representation of how they see the world, so that the images of children contain
                           information that they wish to convey. On the one hand, drawing allows the early student to
                           express ideas and thoughts with limited time and vocabulary [29], creating the possibility
                           of connecting the internal students’ translations of external experiences through symbolic
                           representations [30], and, in addition, students can verbalize a lot of information about their
                           drawing that can be useful to the researcher [7]. Therefore, depending on the information
                           that wants to be obtained, this should be the approach to the activity and the subsequent
                           dialogue with the children. It is for all this that the experience of drawing is very common
                           to obtain information from students about how they see some aspects of reality.
                                  Among the different scales used to evaluate the image that students have of scien-
                           tists [3,28], is the Draw A Scientific Test (DAST), a projective test proposed by Chambers [31]
                           inspired by the investigations of Mead and Metraux [23]. In this test, students are asked to
                           draw a scientist, so that, from the interpretation of this drawing, experts can obtain infor-
                           mation about the image that students have of the scientist. In the Chambers test [31] p. 258,
                           seven indicators of the standard image of a scientist are sought:
                           (1)   Lab coat (usually but not necessarily white).
                           (2)   Eyeglasses.
                           (3)   Facial growth of hair (including beards, moustaches, or abnormally long sideburns).
                           (4)   Symbols of research: scientific instruments and laboratory equipment of any kind.
                           (5)   Symbols of knowledge: principally books and filing cabinets.
                           (6)   Technology: the “products” of science.
                           (7)   Relevant captions: formulae, taxonomic classification, the “eureka!” syndrome, etc.
                                This method has been widely used in research about what image students have of the
                           person devoted to science [5,8,9,14,17,26,31–35].
                                Subsequently, Finson et al. [21] designed the Draw A Scientific Test Checklist, DAST-C,
                           with which they tried to facilitate the interpretation of the drawings made by the students,
                           and added to these seven items eight more, thus including new stereotypes that had not
                           been considered in DAST, such as race or gender [21] p. 199:
                           (8)   Male gender.
                           (9)   Caucasian.
Has the Stereotype of the Scientist Changed in Early Primary School-Aged Students Due to COVID-19? - MDPI
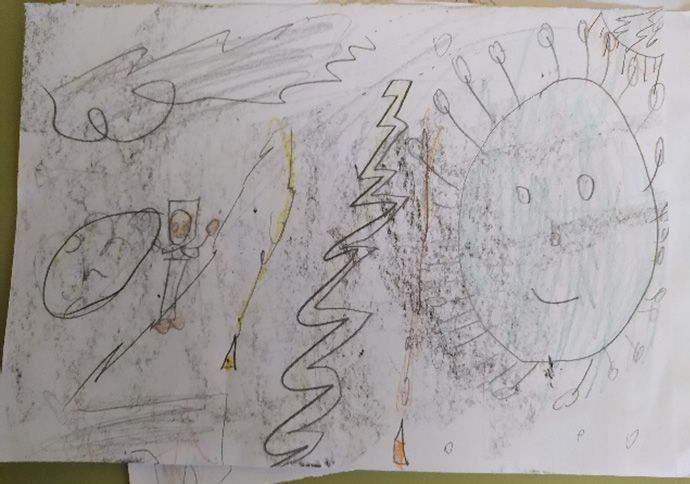
Educ. Sci. 2021, 11, 365                                                                                             3 of 21

                           (10) Indications of danger.
                           (11) Presence of light bulbs.
                           (12) Mythical stereotypes (Frankenstein, Jekyll/Hyde, etc.).
                           (13) Indications of secrecy (“Private”, “Keep Out”), “Do not Enter”, “Go Away”, “Top
                                Secret”, etc.).
                           (14) Scientist doing work indoors.
                           (15) Middle aged or elderly scientist.
                                 Then, to complete the test, these authors added a question to gather comments from
                           the student, which can give more information about the meaning of the elements shown
                           in the drawing. Subsequently, different modifications were made to this test by different
                           researchers [36]. This test, DAST, and its versions modified by other researchers, have
                           been the most widely used tools for the analysis of drawings made by students in recent
                           decades [6,28,37].
                                 Of the different adaptations produced in the Dast, the mDAST (modified DAST) [38]
                           has been used in this research. mDAST has an initial approach (prompt) with the aim of
                           directing the student towards three aspects: appearance, location, and activity. Thus, a
                           more complex prompt, referring specifically to these three aspects encouraged students to
                           show more ideas about the person devoted to science [7]. This prompt was as follows:
                                 Imagine that tomorrow you are going on a trip (anywhere) to visit a scientist in a
                           place where the scientist is working right now. Draw the scientist busy with the work this
                           scientist does. Add a caption, which tells what this scientist might be saying to you about
                           the work you are watching the scientist do. Do not draw yourself or your teacher. (p. 111).
                                 That is to say, it allows to extract more information about the student’s perceptions
                           than the single instruction of “draw a scientist”. Thus, mDAST directs the student to
                           represent the “appearance” of the scientist, the “location” in which he works and the
                           “activity” he performs. This test, like the one developed by Chambers [31], requires that
                           the student has the ability to write about what he has drawn. The reason for using mDAST
                           in this study is due to the interest in using the rubric defined by Farland-Smith [38], that
                           allows to analyze the stereotype of the person who is dedicated to science quantifying the
                           aspects of appearance, location, and activity. However, the prompt was modified, since
                           in times of social distancing it is not possible to travel. Furthermore, traveling can make
                           it seem like a distant profession. However, referring to professions that are closer to the
                           student (the profession of a firefighter, a butcher,) can lead the student to the representation
                           that she or he considers real of a person who dedicates to science and their job. To assess
                           these three categories mentioned in the students’ illustrations (appearance, location, and
                           activity), Farland-Smith [38] created a rubric with scoring ranges from 0 to 3.
                                 It must be borne in mind that the way in which the drawing task is carried out
                           may affect the students’ results, therefore this statement should bring as close as possible
                           to a situation that does not induce concrete responses in the students. This is because
                           the student, in general, does not have a unique conception of the scientists and their
                           environment, and can be affected by how the instructions are given [39].
                                 However, a rigorous analysis cannot be made from only the illustration of the student’s
                           drawing. An image represents a static situation. It is true that it will be possible to
                           distinguish some aspects on many occasions (fanciful drawing, explosions, wears glasses,
                           is a male, etc.). However, on many other occasions, the drawings will not reveal what
                           the student intends to represent (many times it depends on their ability) or what the
                           drawn context represents, much less the actions it claims to represent (the “what is the
                           scientist doing”). This is why the researcher must obtain more information from written
                           and oral narratives, obtained from questions asked or from interviews, depending on the
                           ages and characteristics of the students [33,36]. In this way, more detailed and relevant
                           information can be obtained about the images that students have [40]. Thus, in order not
                           to guide the students’ responses or be limited by their ability to express themselves in
                           writing, the information to complete the drawing was carried out through the teacher-
                           student conversation.
Has the Stereotype of the Scientist Changed in Early Primary School-Aged Students Due to COVID-19? - MDPI
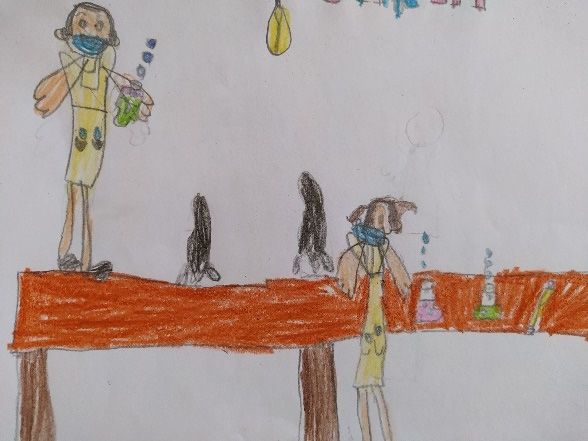
Educ. Sci. 2021, 11, 365                                                                                         4 of 21

                                The objective of this research is to determine the image of early Primary students,
                           attending to the gender variable, with respect to the person who works in science and
                           how the current COVID-19 pandemic situation is affecting the students’ appreciation of
                           the scientist.

                           2. Materials and Methods
                           2.1. Participants
                                 The study was conducted on a sample formed by 128 early Primary students (58 girls
                           and 70 boys) from 6 to 8 years from a school in a small town in northern Spain. The
                           socioeconomic status of the students’ parents was medium. These students were in the first
                           years of Primary Education: First Grade, 44 students (20 girls and 24 boys), Second Grade,
                           45 students (20 girls and 25 boys); and Third Grade, 39 students (18 girls and 21 boys). The
                           school was chosen because one of the authors teaches a class there. All the students from
                           the first years of Primary Education participated in the study.
                                 Consent was obtained from the Headmaster of the Centre where the study was carried
                           out. Likewise, all the students and their families were informed of the study objectives and
                           their consent was obtained.

                           2.2. Instruments
                                The following instruments were used to collect the information:
                           •   An illustration made by the students with their drawing about the person who is
                               dedicated to science, her or his workplace and activity.
                           •   Individual interviews with students to obtain explanatory information about what
                               they had represented in their illustrations.
                           •   For the analysis of the illustrations made by the students, we used:
                           •   Analysis rubric defined in the modified Draw A Scientific Test-prompt [38].
                           •   Classification Table of drawings based on: (a) the gender represented by the students:
                               female, male, both or not distinguished); (b) the age of the person represented (young
                               person, older person or indistinguishable); (c) the representation of clinical research
                               professionals: if you represent people researching COVID-19, researching in the
                               manufacture of drugs or vaccines, or conducting clinical trials, which has been called
                               “Investigating COVID”; (d) search for an explicit representation of COVID-19 in some
                               part of the drawing, even if it has no obvious connection to the rest of what the
                               drawing represents.
                                 These individual interviews were conducted when the students already had their
                           drawings partially completed. The teacher looked at the students’ drawings while they
                           drew and talked to them. These interviews lasted a few minutes, depending on the
                           information to be collected, and did not interrupt the work rhythm of the other students
                           who were already used to the teacher talking to them while they were carrying out the
                           tasks. The questions were intended to obtain information on those aspects that could not
                           be seen in the drawings. If the age or sex of the people was not perceived, the teacher
                           tried to ask the questions in this sense, but without guiding the answers. For example:
                           Who is . . . ? What is it like? What is it doing? What is this that you have drawn here? It
                           is also common that, from a drawing, the action that students are representing in their
                           drawings is not perceived. The teacher thus took notes of the student’s explanations and
                           then categorized the drawings. Some of the students’ responses were vague, and did not
                           allow for a classification. For example: they drew “people”, they had not defined gender
                           or age; or they did not provide information about the location or the actions they were
                           taking. In Appendix A it can be seen some examples of the categorization according to
                           the Farland-Smith rubric [38], and in Appendix B some examples of the drawings of the
                           students classified as “Investigating COVID-19” or “Allusion to COVID”.
Has the Stereotype of the Scientist Changed in Early Primary School-Aged Students Due to COVID-19? - MDPI
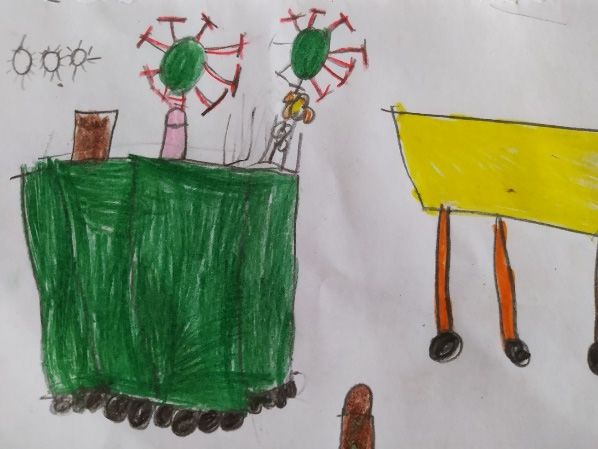
Educ. Sci. 2021, 11, 365                                                                                                          5 of 21

                            2.3. Development of the Activity
                                  The students were asked to make a drawing, based on the following directions: “You
                            know people who are dedicated to different professions, what the place where they work
                            is like and what they do (e.g., the fruit seller, the policeman, the teacher . . . ). On this
                            sheet of paper that I am going to give you, you are going to draw, as you wish, a person
                            who is dedicated to science, whose work is science. You should also imagine what that
                            person is doing and what their work environment is like”. All students had the same
                            type of materials to represent the person who is dedicated to science and what their work
                            environment is like. Subsequently, as indicated, in an interview the students were asked
                            information about their drawing, without indicating specific questions that could guide
                            the answers in any way in order to avoid the effect of “question dependence” [39].

                            2.4. Data Analysis
                                 A quasi-experimental design was applied without a control group. Data analysis was
                            performed using the SPSS v.24 statistical package and GraphPad Prism v9.
                                 The students’ drawings were analyzed according to the rubric of Farland-Smith [38],
                            shown in Table 1, and the Classification Table of drawings, taking into account the responses
                            of the students to the individual interview. The analysis of the drawings was carried out
                            by two researchers and a third researcher resolved the discrepancies.

                                   Table 1. Categories, score and description of the mDast.

          Category         Score                                                Description
                                         Cannot be categorized: stick figure, a historical figure, no scientist, or a teacher
                            0
                                         or student.
                                         Sensationalized: contain a man or a woman who may resemble a monster or who has a
        Appearance          1
                                         clearly odd or comic book appearance
                            2            Traditional: contain an ordinary-looking white male.
                            3            Broader than traditional: drawings include a woman or a minority scientist.
                            0            Cannot be categorized: may be difficult to determine or that of a classroom.
                                         Sensationalized: contain a location that resembles a basement, cave, or setting of secrecy,
                            1
                                         scariness, or horror, or with elaborate equipment not normally found in a laboratory
          Location
                                         Traditional: a traditional laboratory with a table and equipment (and possibly a
                            2
                                         computer) in a normal-looking room.
                                         Broader than traditional: include a scene that is not a basement laboratory and different
                            3
                                         from a traditional laboratory setting.
                            0            Difficult/unable to determine.
                                         Sensationalized: may include scariness or horror, often with elaborate equipment not
                            1
                                         normally found in a typical laboratory; or include fire, explosives, or dangerous work.
                                        Naive or traditional: an activity that the student believes may
          Activity
                                        happen, but in truth, the activity is highly unlikely to
                            2
                                        occur. Drawings where the student writes, “This scientist is studying . . . or trying to . . .
                                        ” but does not show how this is being done.
                                        Broader than traditional: realistic activities that reflect the work a scientist might
                            3           actually do with the appropriate tools needed to perform these activities. A student may
                                        write, “This scientist is studying . . . or trying to . . . ” and shows how this is being done.
                                              Note. Adapted from [38] pp. 111–112.
Has the Stereotype of the Scientist Changed in Early Primary School-Aged Students Due to COVID-19? - MDPI
Educ. Sci. 2021, 11, 365                                                                                                         6 of 21

                                   3. Results
                                   3.1. Results of the Analysis of the Students’ Illustrations by Grade and Gender
                                       Below are the results obtained by the students analyzing each Grade separately.
                                   Regarding First Grade students, the results of the analysis are shown in Table 2.

                           Table 2. Results of the analysis carried out on the drawings of 1st Grade students.

                                                                                                                      Statistical
       Category             Assessment                Total                  Girls                 Boys
                                                                                                                     Significance
                              Cannot be
                                                      22.7%                  25%                  20.83%               26.020%
                             categorized
     Appearance            Sensationalized            20.5%                  15%                  24.98%               59.313%
                             Traditional               9.1%                  0%                   16.68%               97.317%
                            Broader than
                                                      47.7%                  60%                  37.51%               87.694%
                              traditional
                              Cannot be
                                                      15.9%                  20%                   12.5%               48.931%
                             categorized
        Location           Sensationalized            20.5%                  15%                   25%                 59.404%
                             Traditional              52.3%                  45%                  58.33%               62.203%
                            Broader than
                                                      11.3%                  20%                   4.17%               89.694%
                              traditional
                              Cannot be
                                                      13.6%                  20%                   8.33%               73.089%
                             categorized
        Activity           Sensationalized            20.5%                  15%                   25%                 59.404%
                             Traditional              45.5%                  30%                  58.33%               95.416%
                            Broader than
                                                      20.5%                  35%                   8.33%               97.440%
                              traditional

                                        As can be appreciated, with respect to the appearance category, the highest percentage
                                  of students represents broader than traditional aspects, in particular this percentage is
                                  higher in girls (60%) than in boys (37.51%), but the differences are not significant (statistical
                                  significance: 87.694%). The traditional appearance stands out, representing 16.68% of the il-
                                  lustrations in boys, while 0% in girls; having a significant difference (significance: 97.317%),
                                  and the sensationalist appearance, which in boys presents a high percentage (24.98%)
                                  compared to girls (15%), although the difference is not significant (significance: 59.313%).
                                        Regarding the location, most of the illustrations have been classified in the traditional
                                  category (52.3%) and, although the percentage of boys representing a traditional location
                                  is also higher in this case, the difference is not significant (62.203%). However, in this
                                  category, there is a high number of girls who represent a broader than traditional scenario
                                  (20% vs. 4.17%), even though the difference is not significant (significance: 89.694%).
                                        With regard to the activity carried out by scientists in the illustrations, globally, the
                                  majority of the illustrations would be classified as traditional (45.5%). However, the
                                  percentages of the illustrations of the girls are more distributed, with a maximum in broader
                                  than traditional (35% compared to 8.33% in the boys) finding a significant difference
                                  (significance: 97.440%). In this category, the maximum score for boys is in traditional
                                  (58.33% vs. 30%) but the difference is not significant (significance: 95.416%).
                                        Regarding the analysis of the gender represented in the illustrations, the age of
                                  the scientists represented, and trying to find out whether a professional in clinical or
                                  pharmaceutical research professional is represented, or whether an explicit allusion to
                                  COVID-19 is made, Table 3 shows the results, for all students and by gender.
Has the Stereotype of the Scientist Changed in Early Primary School-Aged Students Due to COVID-19? - MDPI
Educ. Sci. 2021, 11, 365                                                                                                                 7 of 21

      Table 3. Results of the analysis of the represented gender, age of the scientists, representation of medical research profes-
      sionals and allusion to COVID-19, after the analysis of the illustrations of the 1st Grade students.

                                                                                                                             Statistical
        Variable                Value                   Total                   Girls                   Boys
                                                                                                                            Significance
                               Female                  22.7%                     25%                    20.83%                 26.020%
                                Male                   40.9%                     35%                    45.83%                 53.091%
        Gender
                                Both                   13.6%                     20%                    8.33%                  73.089%
      represented
Educ. Sci. 2021, 11, x FOR PEERCannot
                               REVIEWbe                                                                                                  7 of 21
                                                       22.7%                     20%                     25%                   30.753%
                             categorized
                                Young                   75%                      90%                    62.5%                 97.976%
                                Older                   6.8%                 0%
                                                                   Cannot be categorized          22.7%100%20% 25%            100.000%
                                                                                                                                30.753%
          Age                 Cannot be
                                                       18.18%             Young
                                                                             10%                   75%25%90% 62.5%               97.976%
                                                                                                                               38.014%
                             categorized
                                               Age                        Older                    6.8% 0% 100%                 100.000%
     Investigating
                                                       15.9%       Cannot be 25%
                                                                             categorized          18.18%   10% 25%
                                                                                                       8.33%                     38.014%
                                                                                                                               86.747%
        COVID
                                     Investigating COVID                                          15.9% 25% 8.33%                86.747%
 Allusion to COVID                                  29.5%                        40%                  20.83%                   84.113%
                                      Allusion to COVID                                           29.5% 40% 20.83%               84.113%

                                        As shown
                                        As   shown in in the
                                                         the results,
                                                              results, students
                                                                        students represent
                                                                                     represent aa higher
                                                                                                    higher proportion
                                                                                                            proportion of  of male
                                                                                                                              male scientists
                                                                                                                                     scientists
                                   (40.9%)  than  female  scientists  (22.7%),    although   the difference  is not significant
                                   (40.9%) than female scientists (22.7%), although the difference is not significant            (significance:
                                                                                                                                       (signifi-
                                   88.008%).
                                   cance:       A higher
                                           88.008%).       percentage
                                                       A higher           of girlsofrepresent
                                                                   percentage                    scientists
                                                                                       girls represent       of bothofsexes
                                                                                                         scientists     both(20%
                                                                                                                              sexesvs.   8.33%
                                                                                                                                      (20%   vs.
                                   of boys),  although    the  difference    is  not significant  (significance:    73.089%).
                                   8.33% of boys), although the difference is not significant (significance: 73.089%). On the   On   the  other
                                   hand, hand,
                                   other  a largeapercentage    of students
                                                    large percentage            represent
                                                                        of students         young scientists
                                                                                        represent              (75%), this
                                                                                                    young scientists        percentage
                                                                                                                         (75%),           being
                                                                                                                                 this percent-
                                   higher  in girls  (90%)  than  in  boys   (62.5%),   obtaining   a  significant  difference
                                   age being higher in girls (90%) than in boys (62.5%), obtaining a significant difference in  in  the results
                                   (significance
                                   the             97.976%). 97.976%).
                                       results (significance
                                        In  29.5%
                                        In 29.5% of of the
                                                       the illustrations    there is
                                                           illustrations there      is an
                                                                                       an allusion
                                                                                           allusion to
                                                                                                     to COVID-19,     with 40%
                                                                                                         COVID-19, with      40% ofof the
                                                                                                                                      the girls
                                                                                                                                           girls
                                   and  20.83%   of  the boys   making     an   allusion,   without   significant  difference
                                   and 20.83% of the boys making an allusion, without significant difference (significance:     (significance:
                                   84.113%). In
                                   84.113%).   In Figure
                                                  Figure 11 two
                                                             two illustrations
                                                                  illustrations made
                                                                                   made by by the
                                                                                              the students
                                                                                                  students cancan be
                                                                                                                  be seen.
                                                                                                                      seen.

                                      (a)                                                            (b)
      Figure 1.
      Figure 1. Illustrations
                Illustrations made
                              made by  1st Grade
                                    by 1st Grade students.
                                                  students. (a)
                                                              (a) Scientists
                                                                  Scientists (male
                                                                             (male and
                                                                                   and female)
                                                                                       female) doing
                                                                                               doing clinical
                                                                                                     clinical trials
                                                                                                              trials to
                                                                                                                     to find
                                                                                                                        find aa vaccine.
                                                                                                                                vaccine.
      (b) Some  students  refer to COVID-19  in their illustrations.
      (b) Some students refer to COVID-19 in their illustrations.

                                       The results of the analysis of the illustrations of the 2nd Grade students are shown in
                                   Table 4.

                                   Table 4. Results of the analysis carried out on the drawings of the 2nd Grade students.

                                      Category       Assessment          Total                  Girls      Boys Statistical Significance
                                                Cannot be categorized 2.22%                      0%         4%          69.163%
                                                   Sensationalized      22.22%                  15%        28%          72.095%
                                    Appearance
                                                     Traditional        42.23%                  20%        60%          99.726%
                                               Broader than traditional 33.33%                  65%         8%          99.999%
                                                Cannot be categorized 4.44%                      5%         4%          15.269%
                                                   Sensationalized      6.66%                    5%         8%          31.682%
Has the Stereotype of the Scientist Changed in Early Primary School-Aged Students Due to COVID-19? - MDPI
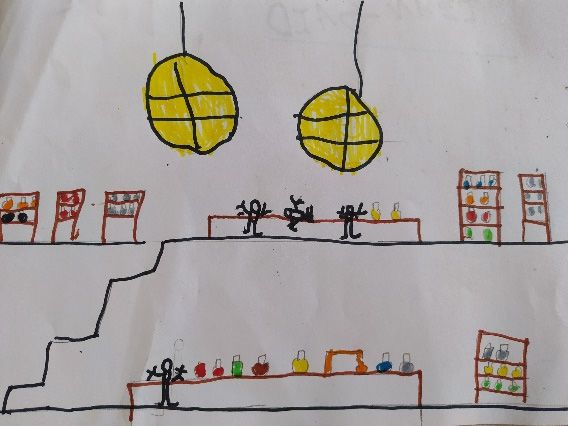
Educ. Sci. 2021, 11, 365                                                                                                         8 of 21

                           Table 4. Results of the analysis carried out on the drawings of the 2nd Grade students.

                                                                                                                      Statistical
       Category                Assessment               Total                 Girls                  Boys
                                                                                                                     Significance
                                Cannot be
                                                        2.22%                   0%                    4%               69.163%
                               categorized
                             Sensationalized           22.22%                  15%                   28%               72.095%
     Appearance
                               Traditional             42.23%                  20%                   60%               99.726%
                              Broader than
                                                       33.33%                  65%                    8%               99.999%
                                traditional
                                Cannot be
                                                        4.44%                   5%                    4%               15.269%
                               categorized
                             Sensationalized           6.66%                    5%                   8%                31.682%
        Location
                               Traditional             68.88%                  50%                   84%               98.934%
                              Broader than
                                                         20%                   40%                    4%               99.785%
                                traditional
                                Cannot be
                                                        2.22%                   5%                    0%               69.427%
                               categorized
                             Sensationalized           6.66%                    5%                   8%                31.682%
        Activity
                               Traditional             71.11%                  70%                   72%               14.466%
                              Broader than
                                                         20%                   20%                   20%               4.948%
                                traditional

                                           As can be seen, with respect to the appearance category, the highest percentage of
                                     students represents traditional aspects, in particular this percentage is higher in boys (60%)
                                     than in girls (20%), with a significant difference (statistical significance: 99.726%). On the
                                     other hand, the appearance represented by the girls is broader than traditional in 65%
                                     of the illustrations, compared to 8% in those of the boys, which represents a significant
                                     difference (statistical significance: 99.999%).
                                           Regarding the location, most of the illustrations have been classified in the traditional
                                     category, which appears more reflected in that of boys (84%) compared to girls (50%),
                                     (significance: 98.934%). However, 40% of girls place scientists in a broader than traditional
                                     location, compared to 4% of boys, with a significant difference (significant: 99.785%).
                                           Considering the activity of the scientist, the results are very similar for girls and boys,
                                     so that most students place them in a traditional activity.
                                           With respect to the other categories analyzed in the illustrations of the 2nd Grade
                                     students, the results are shown in Table 5.
                                           In this case, the students represent a greater proportion of male scientists (62.22%)
                                     than female scientists (22.22%), the difference being significant (significance: 99.848%).
                                     A higher percentage of girls represent scientists of both sexes (25% vs. 0% of boys), the
                                     difference being significant (significance: 99.042%).
                                           On the other hand, a large percentage of students represent young scientists (86.66%),
                                     this percentage being higher in girls (90%) than in boys (84%), although the difference is
                                     not significant (significance 44.648%).
                                           Of the illustrations, 28% represent scientists related to medical research or conducting
                                     clinical trials, and 35.55% of the illustrations contain an allusion to COVID-19 (40% of girls
                                     and 30% of boys), without significant difference (significance: 50.906%).
                                           The results of the analysis of the illustrations of the 3rd Grade students are shown in
                                     Table 6.
Has the Stereotype of the Scientist Changed in Early Primary School-Aged Students Due to COVID-19? - MDPI
Educ. Sci. 2021, 11, 365                                                                                                           9 of 21

      Table 5. Results of the analysis of the represented gender, age of the scientists, representation of medical research profes-
      sionals and allusion to COVID-19, after the analysis of the illustrations of the 2nd Grade students.

                                                                                                                       Statistical
        Variable               Value                  Total                  Girls                 Boys
                                                                                                                      Significance
                               Female                22.22%                  40%                     8%                 99.685%
                                Male                 62.22%                  35%                    84%                 99.977%
        Gender
                                 Both                11.11%                  25%                    0%                  99.042%
      represented
                              Cannot be
                                                      4.44%                   0%                    8%                  86.392%
                             categorized
                                Young                86.66%                  90%                    84%                 44.648%
                                Older                 4.44%                   5%                     4%                 15.269%
          Age                    Both                2.22%                    5%                    0%                  69.427%
                              Cannot be
                                                      6.66%                   0%                    12%                 93.855%
                             categorized
     Investigating
                                                       28%                   35%                    24%                 57.371%
        COVID
 Allusion to COVID                                   35.55%                  30%                    40%                 51.236%

                           Table 6. Results of the analysis carried out on the drawings of 3rd grade students.

                                                                                                                       Statistical
       Category             Assessment                Total                  Girls                 Boys
                                                                                                                      Significance
                              Cannot be
                                                      2.56%                   0%                   4.76%                69.353%
                             categorized
                           Sensationalized           17.95%                 11.11%                23.81%                71.475%
     Appearance
                             Traditional             30.77%                 5.55%                 52.38%                99.982%
                            Broader than
                                                     48.72%                 83.33%                19.05%                100.000%
                              traditional
                              Cannot be
                                                     12.82%                 11.11%                14.28%                24.088%
                             categorized
                           Sensationalized           12.82%                   0%                  23.81%                98.988%
        Location
                             Traditional             61.54%                 72.22%                52.38%                81.236%
                            Broader than
                                                     12.82%                 16.66%                 9.52%                48.127%
                              traditional
                              Cannot be
                                                      5.13%                   0%                   9.52%                86.715%
                             categorized
                           Sensationalized           10.26%                   0%                  19.05%                97.520%
        Activity
                             Traditional             76.92%                 88.88%                66.66%                92.417%
                            Broader than
                                                      7.69%                 11.11%                 4.76%                52.552%
                              traditional

                                        In the case of Third Grade students, with respect to the appearance category, the
                                  highest percentage of students represents broader than traditional aspects (48.72%), due to
                                  the large percentage of girls who in their illustrations manifest this (83.33% compared to
                                  19.05% of boys), with a significant difference (significance: 100.000%). Meanwhile, most of
                                  the boys represent a traditional appearance of the scientist (52.38% compared to 5.55% of
                                  girls), finding a significant difference (significance: 99.982%).
                                        With respect to location, most representations (61.54%) suggest a traditional context
                                  in which the person doing science is found, with different percentages for boys and girls,
                                  but without significant differences. However, 23.81% of boys represent the scientist in a
                                  location that can be considered sensational (compared to 0% of girls), with a significant
                                  difference (significance = 98.988%).
                                        Regarding the activity carried out by the scientist, most of the illustrations would be
                                  categorized into traditional activity, for both boys and girls, without significant differences.
Has the Stereotype of the Scientist Changed in Early Primary School-Aged Students Due to COVID-19? - MDPI
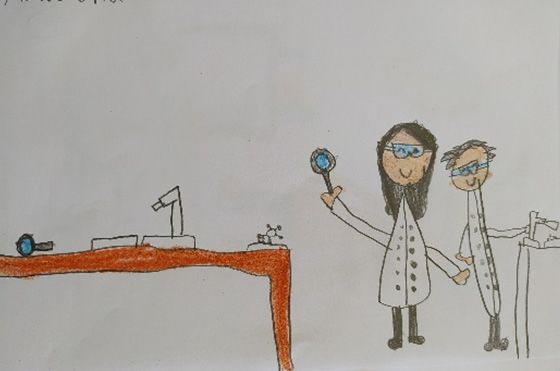
Educ. Sci. 2021, 11, 365                                                                                                       10 of 21

                                However, there is a significant difference between the percentage of boys (19.05%) vs. that
                                of girls (0%) who performed a sensationalist activity (significance: 97.520%).
                                     The results corresponding to the other categories analyzed are shown in Table 7.

      Table 7. Results of the analysis of the gender represented, age of the scientists, representation of medical research
      professionals and allusion to COVID-19, after the analysis of the illustrations of the 3rd Grade students.

                                                                                                                    Statistical
        Variable             Value                 Total                  Girls                    Boys
                                                                                                                   Significance
                             Female               33.33%                  66.66%                   4.76%            100.000%
                              Male                48.72%                  11.11%                  80.95%            100.000%
        Gender
                               Both               12.82%                  22.22%                  4.76%              89.691%
      represented
                            Cannot be
                                                   5.13%                   0%                      9.52%             86.715%
                           categorized
                              Young               89.74%                  100%                    80.95%             97.520%
                              Older                5.13%                   0%                      9.52%             86.715%
          Age
                            Cannot be
                                                   5.13%                   0%                      9.52%             86.715%
                           categorized
     Investigating
                                                   28.2%                  33.33%                   23.8%             48.197%
        COVID
 Allusion to COVID                                41.03%                  38.88%                  33.33%             28.209%

                                     As can be seen in the results, the students represent a greater proportion of male
                                scientists (48.72%) than female scientists (33.33%), the difference being not significant
                                (significance: 71.203%). A higher percentage of girls represent scientists of both sexes
                                (22.22% vs. 4.76% of boys), the difference being not significant (significance: 89.691%).
                                     Besides, a large percentage of students represent young scientists (89.74%), this per-
                                centage being higher in girls (100%) than in boys (80.95%), the difference being significant
                                (significance 97.520%).
                                     Of the illustrations, 28.2% represent scientists related to medical research or conduct-
                                ing clinical trials; and in 41.03% of the illustrations allude to COVID-19 appears (38.88% of
                                the girls and 33.33% of the boys), without significant difference between genders (signifi-
                                cance: 28.209%).

                                3.2. Results of the Comparison between Academic Years According to Category
                                      Taking into account the scores associated with each possible interpretation of the
                                illustrations according to the Farland-Smith rubric [38] (Table 1), the scores obtained for
                                each grade in each of the categories are shown below.

                                3.2.1. Appearance
                                    The scores, by academic year, that have been obtained in the appearance category are
                                shown in Table 8.

                                Table 8. Scores in the appearance category according to the Farland-Smith rubric [38].

                                     Grade                 Total                          Girls                    Boys
                                                  Mean             SD           Mean              SD       Mean            SD
                                  1st Grade        1.82            1.26            1.95           1.36      1.71          1.20
                                  2nd Grade        2.07            0.81             2.5           0.76      1.72          0.68
                                  3rd Grade        2.26            0.85            2.72           0.67      1.86          0.79

                                      Figure 2 shows the representation of the scores obtained from the interpretation of the
                                illustrations in the appearance category.
1st Grade           1.82            1.26           1.95            1.36            1.71             1.20
                                       2nd Grade           2.07            0.81            2.5            0.76            1.72             0.68
                                       3rd Grade           2.26            0.85           2.72            0.67            1.86             0.79

     Educ. Sci. 2021, 11, 365
                                           Figure 2 shows the representation of the scores obtained from the interpretation11ofof 21
                                     the illustrations in the appearance category.

                                     Figure 2. Scores
                                        Figure        in the
                                                2. Scores     appearance
                                                          in the         category
                                                                 appearance       by course
                                                                            category        andand
                                                                                     by course  by by
                                                                                                   gender.
                                                                                                      gender.

                                               It can
                                           It can   be be
                                                       seen seen
                                                               in in
                                                                  thethe   figure
                                                                        figure      that
                                                                                 that  thethe   average
                                                                                            average      value
                                                                                                      value   of of
                                                                                                                  thethe score
                                                                                                                       score  forfor
                                                                                                                                  thethe    appearance
                                                                                                                                        appearance
                                        category
                                     category        increases
                                                 increases       as the
                                                              as the      grade
                                                                       grade       increases,
                                                                               increases,   forfor  both
                                                                                                 both    girls
                                                                                                      girls andand    boys.
                                                                                                                  boys.      However,
                                                                                                                         However,      thethe  Kruskal-
                                                                                                                                            Kruskal-
                                        Wallis
                                     Wallis      statistic
                                              statistic     indicatesthat
                                                         indicates      thatthere
                                                                              thereareare no
                                                                                          no significant
                                                                                              significant differences
                                                                                                           differencesbetween
                                                                                                                          betweencourses
                                                                                                                                     coursesoror in in
                                                                                                                                                    girls
                                        (χ 2 =2 3.812; p = 0.1487) nor in boys (χ2 =2 0.3211; p = 0.8517). However, the Mann-Whitney U
                                     girls (χ = 3.812; p = 0.1487) nor in boys (χ = 0.3211; p = 0.8517). However, the Mann-Whit-
                                     neystatistic  revealed
                                          U statistic          that there
                                                        revealed            are differences
                                                                     that there                 between
                                                                                   are differences       the appearance
                                                                                                      between                score in
                                                                                                                 the appearance         illustrations
                                                                                                                                     score   in illus- of
                                                     girls,  not significant    in 1st  Grade   (U = 209.5, z  = −  0.70711,  p
                                     trations of boys and girls, not significant in 1st Grade (U = 209.5, z = −0.70711, p = significant
                                        boys    and                                                                             = 0.4777);   0.4777);
                                        in 2nd Grade
                                     significant   in 2nd(UGrade
                                                               = 112.5,
                                                                      (U z= =  −3.1293,
                                                                            112.5,         p = 0.00174);
                                                                                     z = −3.1293,         and significant
                                                                                                   p = 0.00174);             in 3rd Grade
                                                                                                                   and significant    in 3rd (U   = 74.5;
                                                                                                                                               Grade
                                     (U z= = −3.21159;
                                           74.5;           p = 0.0013).
                                                  z = −3.21159;    p = 0.0013).
                                       3.2.2. Location
Educ. Sci. 2021, 11, x FOR PEER REVIEW3.2.2.
                                           Location                                                                        11 of 21
                                             With regard to location, the scores, by grade, that have been obtained in the appearance
                                         With regard to location, the scores, by grade, that have been obtained in the appear-
                                       category, are shown in Table 9.
                                     ance category, are shown in Table 9.
                                   TableTable
                                         9. Scores in thein
                                               9. Scores  location category
                                                            the location     usingusing
                                                                         category  the Farland-Smith rubricrubric
                                                                                        the Farland-Smith   [38]. [38].

                                       Grade
                                           Grade         TotalTotal                        Girls Girls                     Boys Boys
                                                   Mean
                                                      Mean       SD SD                MeanMean SD             SD      MeanMean    SD          SD
                                    1st Grade      1.58         0.91                  1.65        1.04                1.54        0.78
                                         1st Grade      1.58         0.91                  1.65               1.04         1.54               0.78
                                    2nd Grade
                                         2nd Grade 2.04 2.04    0.67 0.67             2.25 2.25   0.79        0.79    1.88 1.88   0.53        0.53
                                    3rd Grade
                                         3rd Grade 1.74 1.74    0.85 0.85             1.94 1.94   0.80        0.80    1.57 1.57   0.87        0.87

                                         Figure 3 shows the representation of the scores obtained from the interpretation of
                                               Figure 3 shows the representation of the scores obtained from the interpretation of the
                                   the illustrations in the location category.
                                         illustrations in the location category.

                                   FigureFigure 3. Scores
                                          3. Scores in the in the location
                                                            location       category
                                                                     category       by course
                                                                               by course      and
                                                                                         and by   by gender.
                                                                                                gender.

                                         It can be seen that the scores of girls and boys in 2nd Grade are higher than those of
                                   their counterparts in other grades. Differences between courses are neither significant for
                                   girls (χ2 = 4.390, p = 0.1114) nor for boys (χ2 = 3.429, p = 0.1801). There is also no significant
                                   difference between the score of appearance in illustrations of children in each course (1st
Educ. Sci. 2021, 11, 365                                                                                                                   12 of 21

                                               It can be seen that the scores of girls and boys in 2nd Grade are higher than those of
                                         their counterparts in other grades. Differences between courses are neither significant for
                                         girls (χ2 = 4.390, p = 0.1114) nor for boys (χ2 = 3.429, p = 0.1801). There is also no significant
                                         difference between the score of appearance in illustrations of children in each course (1st
                                         Grade: U = 218, z = −0.50676, p = 0.61006; 2nd Grade: U = 166.5, z = −1.89585, p = 0.05744;
                                         and 3rd Grade: U = 139.5, z = −1.38042, p = 0.16758).

                                         3.2.3. Activity
                                             Regarding the activity category, the scores, by course, that have been obtained in the
                                         appearance category, are shown in Table 10.

                                         Table 10. Scores in the activity category using the Farland-Smith rubric [38].

                                             Grade                  Total                           Girls                           Boys
                                                            Mean              SD            Mean             SD             Mean             SD
                                          1st Grade          1.71            0.97            1.8             1.15            1.67            0.76
                                          2nd Grade          2.07            0.60            2.05            0.69            2.12            0.53
                                          3rd Grade          1.87            0.62            2.11            0.32            1.67            0.73
Educ. Sci. 2021, 11, x FOR PEER REVIEW                                                                                                    12 of 21

                                               Figure 4 shows the representation of the scores obtained from the interpretation of the
                                         illustrations in the activity category.

                                  Figure 4. Scores
                                       Figure      in theinactivity
                                               4. Scores            category
                                                            the activity     by course
                                                                         category      and by
                                                                                  by course   gender.
                                                                                            and by gender.

                                        It canItbe
                                                 can be seen
                                                   seen         thatscore
                                                          that the    the score
                                                                           in theinactivity
                                                                                     the activity   category,
                                                                                              category,         for girls,
                                                                                                          for girls,       increases
                                                                                                                     increases   fromfrom
                                                                                                                                        1st to1st
                                                                                                                                               3rdto 3rd
                                        Grade,    without    significant   differences       2 = 0.2511, p = 0.8820); and in boys it presents a
                                  Grade,    without    significant   differences    (χ2 = (χ
                                                                                           0.2511,   p = 0.8820); and in boys it presents a
                                        maximum                                                                                               2 = 6.636,
                                  maximum       scorescore
                                                       in thein2nd
                                                                the Grade,
                                                                     2nd Grade,
                                                                             with with    significant
                                                                                    significant         differences
                                                                                                  differences         between
                                                                                                                 between          courses
                                                                                                                             courses  (χ2 =(χ
                                                                                                                                            6.636,
                                        p = 0.0362).
                                  p = 0.0362).         Between
                                                 Between           1st2nd
                                                             1st and   and Grade
                                                                             2nd Grade     the difference
                                                                                     the difference     is notissignificant
                                                                                                                 not significant
                                                                                                                              (U = (U  = z205,
                                                                                                                                    205,       z = 1.89,
                                                                                                                                           = 1.89,
                                        p =  0.05876),   however,    between    2nd   and   3rd  Grade    the  difference
                                  p = 0.05876), however, between 2nd and 3rd Grade the difference is significant (U = 180.5,is significant  (U  = 180.5,
                                        z =  1.7973,  p
                                  z = 1.7973, p = 0.03593). Analyzing the differences between girls and boys in each grade, it it
                                                        =  0.03593).   Analyzing    the  differences    between    girls  and  boys  in each   grade,
                                  can becan  be seen
                                           seen        that there
                                                 that there        are neither
                                                              are neither        significant
                                                                            significant         differences
                                                                                          differences         inGrade
                                                                                                         in 1st  1st Grade
                                                                                                                         (U =(U  = 210,
                                                                                                                               210,      z = −0.69532,
                                                                                                                                    z = −0.69532,
                                        p = 0.24196)
                                  p = 0.24196)   nor innor2ndinGrade
                                                                2nd Grade     (U =z245,
                                                                        (U = 245,         z = 0.10279,
                                                                                      = 0.10279,          p = 0.46017);
                                                                                                   p = 0.46017);          but there
                                                                                                                   but there   are inare
                                                                                                                                      3rdinGrade
                                                                                                                                             3rd Grade
                                  (U = (U
                                        129,= z129, z = −1.67622,
                                                = −1.67622,           p = 0.04648).
                                                               p = 0.04648).
                                        4. Discussion
                                  4. Discussion
                                               As can be seen in this study, the image of the stereotype of the wacky or mad scien-
                                        As can be seen in this study, the image of the stereotype of the wacky or mad scientist
                                        tist [41] is far from being the image that early-age students have of the person who dedicates
                                  [41] is far from being the image that early-age students have of the person who dedicates
                                        to science. Nor is it the image of a mature white male working alone in the laboratory. Most
                                  to science. Nor is it the image of a mature white male working alone in the laboratory.
                                        of the students’ representations provide a broader than traditional image of the scientist,
                                  Most of the students’ representations provide a broader than traditional image of the sci-
                                        that is, one in which there are people of different ethnic groups, women or several scientists
                                  entist, that is, one in which there are people of different ethnic groups, women or several
                                       working together [11,40]. However, there is still a significant percentage of boys who make
                                  scientists working together [11,40]. However, there is still a significant percentage of boys
                                        a traditional representation of the person who works in science. However, a sensationalist
                                  who make a traditional representation of the person who works in science. However, a
                                  sensationalist conception of the image of the scientist persists in boys, despite the fact that
                                  previous researches indicate that these conceptions are minoritarian in older students
                                  [3,42], so, presumably, the image of the scientist adjusts with the age and experiences of
                                  the students, even though these stereotypes persist in every generation of students
Educ. Sci. 2021, 11, 365                                                                                             13 of 21

                           conception of the image of the scientist persists in boys, despite the fact that previous
                           researches indicate that these conceptions are minoritarian in older students [3,42], so,
                           presumably, the image of the scientist adjusts with the age and experiences of the students,
                           even though these stereotypes persist in every generation of students [6,8,9,14–17]. In
                           this sense, it is girls who most often represent female scientists or both genders working
                           together, in line with other studies [6,42]. It should also be noted that most of the students
                           represent young scientists as it also happens in Christidou et al.’s studies [6]. In fact, most
                           of the representations of the scientist show a young person, and, in only one case, a young
                           person was represented next to an older person. This situation proves to be very different
                           from the image that is represented in other studies on the stereotypes of the person who is
                           dedicated to science [3,15,16,35], which indicates that the stereotype of the scientist changes
                           over time [16].
                                 Regarding the gender represented in the illustrations, although the predominant
                           percentage represents a male scientist, there is also a significant percentage of women
                           represented or illustrations in which both genders appear. This change seems to be a
                           consequence of the constant and gradual transformation of roles that is taking place, and
                           was already foreseen in previous studies [16].
                                 Regarding the location, the laboratory context continues to prevail, where the scientist
                           performs his/her work surrounded by glass bottles, flasks and scientific instruments. It
                           can be seen in Figure 3 that 2nd Grade students have higher scores. This may be because
                           the students were confined when they were in 1st Grade. At this age, the evolutionary
                           development of the girl and the boy produces an advance in the understanding of the socio-
                           emotional world, so that the students begin to establish ties of friendship and attachment
                           relationship with other classmates and with the teacher [43]. Thus, it could be that they
                           were more attentive to the conversations of their parents and the information of the mass
                           media that showed information on the investigation of the vaccines and the production
                           systems. However, this point should be researched in depth.
                                 With respect to the activity carried out by the person who is dedicated to science, for
                           most of them, the scientist is represented in an activity that has been called traditional,
                           although the percentage of students who represent such a traditional broader activity is
                           important, especially in the first two grades.
                                 In all this analysis, it should be clarified, in view of the results obtained from the
                           application of the Farland-Smith rubric [38], that the scores of the illustrations of the girls
                           are higher in all grades and in all categories, although only in some items these differences
                           are significant. It is the girls who have a “less traditional” view of the appearance of the
                           person who is dedicated to science, their context and the activity they carry out, in general.
                           As indicated, the existence of scientific stereotypes affects women more intensely, and this
                           affects their choice of scientific-technological studies and has a negative influence on the
                           construction of their self-esteem [18,20]. Then, a greater representation of the female gender
                           in the vision of the person who is involved in science, presumably, will have repercussions
                           in a greater choice of scientific-technological careers and in a better development of self-
                           esteem. Thus, it is the girls who represent more female scientists, or of both sexes, and
                           young people.
                                 In other studies about the image of the scientist [42] a weakening of a stereotyped
                           image has been found in accordance with those obtained in this research. However, in
                           that case they were older students (from 7 years old) and participated in a scientific event,
                           which may be related to a better attitude towards science. A better attitude towards science
                           is accompanied by a less stereotypical image of scientists [42].
                                 Regarding the location, a traditional context predominates: a table with instruments
                           (which can be test tubes, computers, etc.) in a normal room [11]. With respect to the activity
                           carried out by the scientist, in the illustrations of the girls the traditional activity predomi-
                           nates (the scientist is inventing something or discovering something, which represents a
                           naive vision of the students) and then the broader than traditional (the scientist performs
                           an activity close to reality: testing, observing) [11]. On the other hand, the boys represent a
Educ. Sci. 2021, 11, 365                                                                                               14 of 21

                           traditional activity for the most part, and a part of them represent a sensationalist activity
                           (the vision that science has to do with magic, intrigue, world domination, explosions,
                           etc.) [11]. In the analysis of the scientist’s activity, it is worth highlighting the representation
                           of medical research professionals, searching and testing a prototype of a vaccine against
                           COVID-19. Students are immersed in a situation where they continually receive news
                           about research, trials, the search for a vaccine, etc. Thus, although some of the illustrations
                           do not refer to COVID research, this appears in some of the illustrations (e.g., the scientist
                           is in his traditional laboratory, with his traditional work; however, some students represent
                           a soap dispenser and the image of COVID somewhere in the illustration). In this sense, the
                           highest percentage of female students who represent scientists investigating COVID also
                           stands out. It is possible that girls are more sensitive to this issue and that the information
                           they receive from the media and from their family environment makes them build an image
                           of the scientist-researcher related to the investigation of a cure against COVID, clinical
                           trials, etc.
                                 However, the health crisis, presumably, has not only influenced the fact that a percent-
                           age of students represented health personnel, research on the development of vaccines,
                           experimental tests with patients, etc. It is also possible that the large amount of information
                           that reached the homes from the various media and that was present in family conversa-
                           tions [4], impacted on students, modifying their vision about the construction of science,
                           the person who is dedicated to science and the activity in which it is carried out, as well
                           as the scenarios in which scientific research is developed. Thus, studies conducted on
                           how children understand COVID-19 during confinement indicate that they saw it as an
                           enemy to be won and praised the work of doctors to defeat the virus. At the same time,
                           the children made representations of viruses in their drawings during confinement [44,45].
                           Thus, as it is obvious, COVID was in the children’s day-to-day during confinement, and
                           they were waiting for this situation to end to resume contact with their friends and other
                           family members, and return to school, which is their area of socialization par excellence.
                                 As for implications, the authors want to emphasize once again the importance of
                           the vision that students have of the person who works in science. Thus, improving the
                           vision of the scientist or researcher will presumably improve the attitude towards science
                           and scientific vocations [13]. In this sense, the policies of continuous teacher training,
                           particularly in the first grades of Primary Education, must modify the possible stereotypes
                           that the teacher can transfer to the students [2,10], and, on the other hand, as has happened
                           during this pandemic, students have been more expectant of scientific news, and they have
                           been closer to the functioning of science. It would therefore be appropriate for the training
                           of early Primary students to come into contact with scientists and research institutions that
                           allow them to progressively distinguish between school science and the science of scientists.

                           5. Conclusions
                                It is necessary to know the image that students have with respect to people who are
                           dedicated to science and the conceptions regarding the work they carry out from the earliest
                           ages. This will allow actions focused on their modification, which will improve scientific
                           vocations by eradicating various existing stereotypes [13]. The data provided in this
                           research with First Grade Primary students reflect a not excessively distorted conception
                           with respect to the person who is dedicated to science: it is appreciated that the students
                           do not have a sensationalist view, in general, of the scientists or of their work. The students
                           do not usually represent “mad scientists” locked in caves or cellars, and, at the same time,
                           they do not represent exclusively male scientists, but rather a broad female representation
                           appears or both sexes are represented; and, in most cases they represent young people.
                           Considering that scientific stereotypes are formed in early ages, starting at 8 [6,8,9,14–17], it
                           would be advisable that educational interventions were orientated to stop the development
                           of these stereotypes at those early ages.
                                On the other hand, as it can be seen, the current health situation derived from the
                           COVID-19 crisis also influences the perception of students about the work carried out by
Educ. Sci. 2021, 11, 365                                                                                              15 of 21

                           the scientist. Some studies show that there has been a positive change after confinement
                           in the social perception of science in adults [46]. Taking into account that much of the
                           information that students of these ages received during confinement and later has been
                           through their parents, it is presumable that this change is not only in stereotypes about
                           science and scientists, but also in a more positive appreciation of science and scientists.
                                 Among the limitations of the study, the location of the educational center should
                           be indicated: an educational center in a small city at the time after returning to school
                           after confinement caused by the pandemic. It would have been relevant to carry out a
                           study of greater geographic scope. Future research will be directed towards the analysis
                           of larger and more diverse samples. Another possible limitation could be due to the
                           presentation of the prompt. It is possible that some students understood that they should
                           draw a single person, a man or a woman, as analyzed in other studies [6]. However,
                           by instructing them to also describe their location and their activity, this invites them to
                           represent the usual situation of a science person, who may or may not be surrounded
                           by people, depending on the student’s conception. In fact, many of the drawings depict
                           various people working together.
                                 In the future, the research will be expanded by increasing the sample and expanding
                           the study to other courses and stages, which will make it possible to analyze how the current
                           situation is modifying the stereotypes of students with respect to the people who devote
                           themselves to science and their context. It is likely that the current situation is changing the
                           image of science and the scientist in younger students, and perhaps is also influencing the
                           attitude of students towards science and their interest in scientific-technological disciplines.
                                 At present, the situation is gradually returning to a normal situation. Girls and boys
                           are with their classmates and their teachers, while maintaining social distancing. As
                           vaccination increases within the population, they are also more in contact with relatives
                           and their social interaction is resuming values of “normality”. However, an important
                           research question would be to analyze what will happen when some time has passed and
                           the situation is similar to that before the pandemic, when girls and boys had no limitations
                           or fear of a virus of which “only could be saved by science”. Will the perception of people
                           who are dedicated to science and their work continue to improve towards more realistic
                           values, or will it decline to more traditional values?

                           Author Contributions: Conceptualization, C.Q.-C., M.D.-O. and M.Á.Q.-D.; methodology, M.D.-O.;
                           formal analysis, C.Q.-C.; investigation, C.Q.-C., M.D.-O. and M.Á.Q.-D.; resources, C.Q.-C.; data
                           curation, A.A.L.G. and M.D.-O.; writing—original draft preparation, C.Q.-C. and M.D.-O.; writing—
                           review and editing, A.A.L.G. and M.Á.Q.-D.; supervision, M.D.-O. and M.Á.Q.-D. All authors have
                           read and agreed to the published version of the manuscript.
                           Funding: This research received no external funding.
                           Institutional Review Board Statement: The investigation was conducted with the permission of the
                           parents and the Heads of the educational center where it was carried out.
                           Informed Consent Statement: Informed consent was obtained from all subjects involved in the study.
                           Data Availability Statement: The data are not publicly available for confidentiality reasons. They
                           are only available on request from the corresponding author.
                           Conflicts of Interest: The authors reported no potential conflict of interest.

                           Appendix A
                                In this appendix you can find different examples of the drawings of the students
                           classified according to the rubric of [38] pp. 111–112.
                                Appearance 0: Cannot be categorized: stick figure, a historical figure, no scientist, or
                           a teacher or student.
Conflicts of Interest: The authors reported no potential conflict of interest.

                                   Appendix A
                                        In this appendix you can find different examples of the drawings of the students clas-
Educ. Sci. 2021, 11, 365           sified according to the rubric of [38] pp. 111–112.                                 16 of 21
                                        Appearance 0: Cannot be categorized: stick figure, a historical figure, no scientist, or
                                   a teacher or student.

 Educ. Sci. 2021, 11, x FOR PEER REVIEW                                                                                    16 of 21
                                     Student  comment:I Ihave
                                      Studentcomment:
 Educ. Sci. 2021, 11, x FOR PEER REVIEW                   haverepresented
                                                               representedscientists  ...
                                                                            scientists…                           16 of 21
                                      Appearance 1: Sensationalized: it contains a man or a woman who may resembleaa
                                     Appearance  1: Sensationalized:   it contains  a man or a woman who may resemble
                                  monster
                                  monsteror
                                          orwho
                                             whohas
                                                 hasaaclearly
                                                       clearlyodd
                                                               oddororcomic
                                                                        comicbook
                                                                               bookappearance
                                                                                      appearance

                                          Student comment: A wacky scientist.
                                           Studentcomment:
                                          Student  comment:
                                          Appearance         AAwacky
                                                                wackyscientist.
                                                      2: Traditional:  scientist.
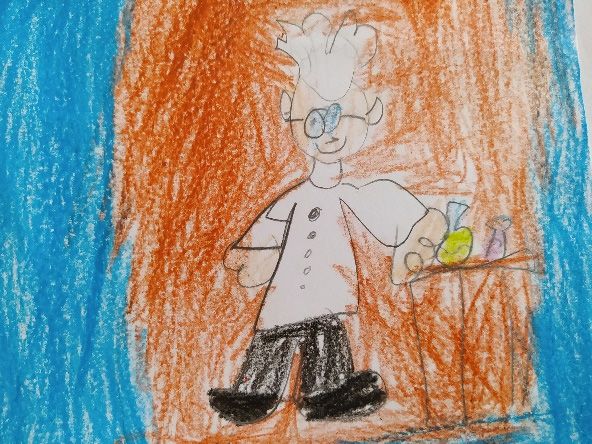
                                                                       it  contains an ordinary-looking white male.
                                           Appearance2:2:Traditional:
                                          Appearance      Traditional:ititcontains
                                                                           containsan
                                                                                    anordinary-looking
                                                                                       ordinary-lookingwhite
                                                                                                        whitemale.
                                                                                                              male.

                                        Studentcomment:
                                       Student  comment: AAresearcher
                                                             researcher…...
                                        Student comment:
                                       Appearance
                                        Appearance         A researcher…
                                                   3:3:Broader
                                                        Broaderthan traditional:
                                                                 than            drawings
                                                                       traditional:       include
                                                                                     drawings     a woman
                                                                                               include    or a minority
                                                                                                       a woman          scientist.
                                                                                                                  or a minority
                                        Appearance 3: Broader than traditional: drawings include a woman or a minority
                                   scientist.
                                   scientist.
Educ. Sci. 2021, 11, 365               Student comment: A researcher…                                         17 of 21
                                       Appearance 3: Broader than traditional: drawings include a woman or a minority
                                  scientist.

Educ. Sci. 2021, 11, x FOR PEER REVIEW                                                                                            17 of 21
                                     Student  comment:AAyoung
                                      Studentcomment:     youngresearcher
                                                                 researchergirl.
                                                                              girl.
                                      Location0:0:Cannot
                                     Location     Cannotbe
                                                         becategorized:
                                                            categorized: itit may
                                                                              may bebe difficult
                                                                                       difficult to
                                                                                                  to determine
                                                                                                     determine or
                                                                                                               or that
                                                                                                                   that of
                                                                                                                        of aa class-
                                                                                                                              class-
                                 room.
                                  room.

                                         Student comment: I don’t know…
                                         Student
                                         Location comment:     I don’t know…
                                                    1: Sensationalized:     it contains  a location that resembles a basement, cave, or
                                         Student
                                        Student
                                         Location comment:
                                                 comment:
                                                   1:         II don’t
                                                                 don’tknow
                                                       Sensationalized:know…    ...
                                                                           it contains   a location  thatequipment
                                                                                                           resembles anot
                                                                                                                       basement,  cave, or
                                  setting   of secrecy,
                                        Location
                                         Location  1:    scariness,
                                                   1: Sensationalized:or
                                                       Sensationalized:  horror,    or
                                                                          itit contains
                                                                               containswith   elaborate
                                                                                        aa location
                                                                                           location that  resembles
                                                                                                          resemblesaanot
                                                                                                     thatequipment        normally
                                                                                                                       basement,
                                                                                                                       basement,    found
                                                                                                                                 cave,
                                                                                                                                  cave,or
                                                                                                                                        or
                                  setting   of secrecy,
                                  in a laboratory        scariness,   or horror,    or with   elaborate                   normally  found
                                 setting
                                  setting  of
                                            ofsecrecy,
                                               secrecy,scariness,
                                  in a laboratory        scariness,ororhorror,
                                                                         horror,  oror
                                                                                     with
                                                                                       withelaborate  equipment
                                                                                              elaborate  equipmentnotnot
                                                                                                                       normally found
                                                                                                                          normally     in
                                                                                                                                    found
                                 ainlaboratory
                                      a laboratory

                                        Student comment: They are in a secret military base.
                                       Student
                                       Student comment:
                                        Locationcomment:    They
                                                            Theyare
                                                 2: Traditional:   are in
                                                                        inaasecret military
                                                                                    militarybase.
                                                                             secretlaboratorybase.
                                       Student
                                       Location
                                       Location comment:
                                                 2:
                                                 2:         They aaare
                                                    Traditional:
                                                    Traditional:
                                                                     traditional
                                                                        in a secretlaboratory
                                                                    atraditional
                                                                       traditional  military   with a table and equipment (and pos-
                                                                                             base.
                                                                                     laboratory   with
                                                                                               with    a table
                                                                                                    a table andand equipment
                                                                                                                equipment (and(and
                                                                                                                               pos-
                                  siblyLocation
                                        a computer)
                                                 2:   in a normal-looking
                                                    Traditional: a   traditionalroom.
                                                                                   laboratory  with a table and equipment (and pos-
                                 possibly  a computer)   in a normal-looking
                                 sibly a computer) in a normal-looking room.       room.
                                 sibly a computer) in a normal-looking room.

                                       Student comment: Man and woman are working in the laboratory.
                                       Student
                                       Locationcomment:    Man
                                                 3: BroaderMan
                                                             thanand  woman areitworking
                                                                   traditional:    includesin the  laboratory.
                                       Student
                                       Locationcomment:
                                                 3: Broader  thanand  woman areit
                                                                   traditional:   working
                                                                                   includesinaathe
                                                                                                scene  that is not a basement labor-
                                                                                                   laboratory.
                                                                                                scene  that is not a basement labor-
                                  atoryLocation
                                        and different  from
                                                3: Broader   a traditional laboratory   setting.
                                  atory and different  from athan  traditional:
                                                               traditional      it includes
                                                                           laboratory        a scene that is not a basement labor-
                                                                                        setting.
                                  atory and different from a traditional laboratory setting.
You can also read