THE CAVIAR MARKET PRODUCTION, TRADE, AND CONSUMPTION IN AND OUTSIDE THE EU - AN UPDATE OF THE 2018-REPORT - EUMOFA
←
→
Page content transcription
If your browser does not render page correctly, please read the page content below
THE CAVIAR MARKET

                        PRODUCTION, TRADE,
                         AND CONSUMPTION
                     IN AND OUTSIDE THE EU

                   AN UPDATE OF THE 2018-REPORT

                                         MAY 2021

                                  WWW.EUMOFA.EU
Maritime Affairs
and Fisheries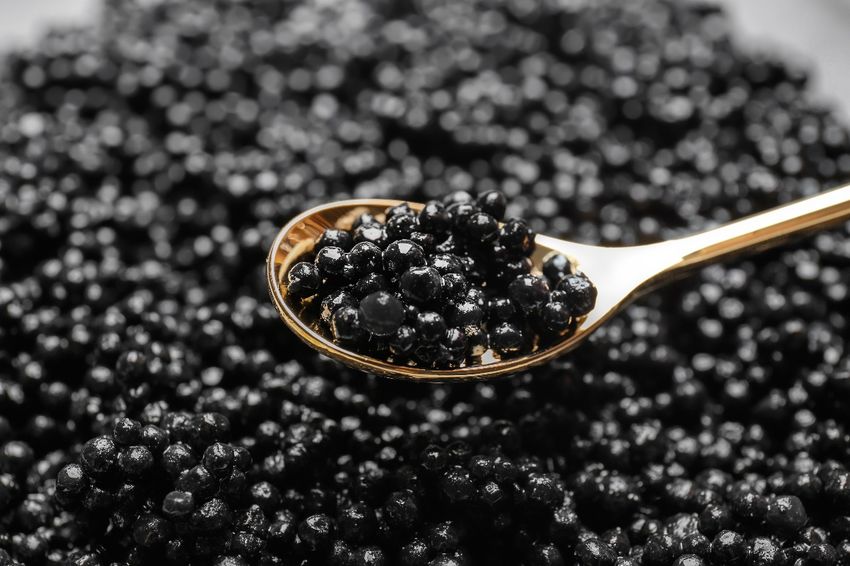
Manuscript completed in May 2021.
The European Commission is not liable for any consequence stemming from the reuse of this publication.
Luxembourg: Publications Office of the European Union, 2021
© European Union, 2021

The reuse policy of European Commission documents is implemented based on Commission Decision
2011/833/EU of 12 December 2011 on the reuse of Commission documents (OJ L 330, 14.12.2011, p. 39).
Except otherwise noted, the reuse of this document is authorised under a Creative Commons Attribution 4.0
International (CC-BY 4.0) licence (https://creativecommons.org/licenses/by/4.0/). This means that reuse is allowed
provided appropriate credit is given and any changes are indicated.

For any use or reproduction of elements that are not owned by the European Union, permission may need to be
sought directly from the respective rightholders. The European Union does not own the copyright in relation to
the following element:
cover photo: ©New Africa. Source: Shutterstock
PDF     ISBN 978-92-76-28914-2        KL-02-21-037-EN-N

FOR MORE INFORMATION AND COMMENTS:
Directorate-General for Maritime Affairs and Fisheries
B-1049 Brussels
Tel: +32 229-50101
E-mail: contact-us@eumofa.eu

                                                                                                                 i
CONTENTS

SUMMARY ............................................................................................................................................................. 1
DEFINITIONS ........................................................................................................................................................ 2
0.       METHODOLOGY .......................................................................................................................................... 3
     0.1.   METHODOLOGY .......................................................................................................................................................................... 3
       0.1.1 Brexit ..................................................................................................................................................................................... 3
     0.2.   DATA ............................................................................................................................................................................................. 3
       0.2.1 CITES Trade Database ................................................................................................................................................. 3
       0.2.2 EUMOFA – EU trade data from EUROSTAT-Comext ................................................................................... 5
       0.2.3 EUMOFA – data from IHS Markit on trade flows between third countries .................................... 6
1.       PRODUCTION ............................................................................................................................................... 7
     1.1    STURGEONS AND CAVIAR ......................................................................................................................................................... 7
       1.1.1 Production cycle .............................................................................................................................................................. 8
     1.2    EU PRODUCTION OF CAVIAR................................................................................................................................................. 10
     1.3    PRODUCTION IN OTHER REGIONS ........................................................................................................................................ 12
       1.3.1 China .................................................................................................................................................................................. 13
       1.3.2 Armenia ............................................................................................................................................................................ 14
       1.3.3 Russia ................................................................................................................................................................................ 14
       1.3.4 USA ...................................................................................................................................................................................... 15
       1.3.5 Uruguay ............................................................................................................................................................................ 16
2.       INTERNATIONAL TRADE OF CAVIAR ................................................................................................... 17
     2.1    INTRA-EU TRADE .................................................................................................................................................................... 17
     2.2    EXTRA-EU TRADE – EUROSTAT/EUMOFA ................................................................................................................... 19
       2.2.1 Import ................................................................................................................................................................................ 19
       2.2.2 Export ................................................................................................................................................................................. 22
     2.3    EXTRA-EU TRADE -CITES .................................................................................................................................................... 25
       2.3.1 Import ................................................................................................................................................................................ 25
       2.3.2 Export ................................................................................................................................................................................. 27
3.       CONSUMPTION.......................................................................................................................................... 29
     3.1    GENERAL MARKET DESCRIPTIONS ....................................................................................................................................... 29
     3.2    CONSUMPTION IN THE EU .................................................................................................................................................... 30
     3.3    CONSUMPTION IN OTHER REGIONS..................................................................................................................................... 31
       3.3.1 USA ...................................................................................................................................................................................... 31
       3.3.2 Japan.................................................................................................................................................................................. 32
       3.3.3 Russia ................................................................................................................................................................................ 33
       3.3.4 China .................................................................................................................................................................................. 34
       3.3.5 Other main consumption markets outside the EU ................................................................................... 35
4.       PERSPECTIVES AND FUTURE DEVELOPMENT ................................................................................. 36
APPENDIX 1 – DELETED OBSERVATIONS FROM CITES DATA ............................................................. 37

                                                                                                                                                                                                             ii
EUMOFA - European Market Observatory for Fisheries and Aquaculture Products

                                           The caviar market: production, trade, and consumption in and outside the EU

        SUMMARY
This report is an update of the first EUMOFA report on the caviar market from 20181. In the previous
edition, the latest updated data on production referred to 2016 while this report contains data for 2018.
In addition, it should be remarked that since 2018 EUMOFA has expanded the scope of its international
trade database, which now covers trade flows of fishery and aquaculture products between almost 100
countries. Consequently, this report provides more analyses of other regions compared to the previous
report.
Caviar is roe from sturgeons. Historically, sturgeons were harvested in the Caspian Sea and their roe sold
as caviar, mainly by Russia and Iran. Overfishing of sturgeons has led to the near-extinction of several
of the species. Globally, the largest capture was recorded in 1977 at 31.800 tonnes2. The first FAO-
recorded harvest from aquaculture was in 1984 at 150 tonnes. Since then, the rearing of sturgeons
gradually increased until the beginning of the 2000s, when it started increasing rapidly year by year. In
2018, the global aquaculture production of sturgeons was about 115.168 tonnes. Subsequently, nearly
all caviars on the market today are harvested from farmed sturgeon.
According to the Federation of European Aquaculture Producers (FEAP), EU Member States produced 164
tonnes of caviar in 2018, an increase of 12% from 145,8 tonnes in 2017. The largest producers were
Italy, France, Poland, and Germany, accounting for 84% of the total production in 2018. The global
production of caviar in 2018 has been estimated as 380 tonnes3.
According to EUROSTAT-COMEXT data, the intra-EU trade of caviar increased from 37,4 tonnes in 2014
to 61,6 tonnes in 2018, before decreasing over the following two years, ending at 48,4 tonnes in 2020.
In addition, extra-EU imports doubled from 25 tonnes in 2014 to 54,5 tonnes in 2019 but decreased by
16% to 45,7 tonnes in 2020. The main supplier of caviar to the EU market is China by a large margin,
responsible for between 65% and 84% of extra-EU imports over the past five years.
The EU is also an important supplier of caviar globally. According to EUROSTAT-COMEXT data, 43,7
tonnes of caviar were exported outside the EU in 2014. By 2019, the extra-EU export volume had
increased by 55% to 67,5 tonnes. With the COVID-19 pandemic in 2020, the export volume decreased
by 27% to 49,2 tonnes.
Compared to intra-EU trade, exporting Member States achieve higher prices when exporting outside the
EU, although price fluctuate significantly. The yearly weighted average extra-EU export prices over the
past seven years have been between 422 EUR/kg and 538 EUR/kg, on average 17% higher than the
intra-EU export prices and 54% higher than the extra-EU import prices. Although the long-term trend is
negative, prices have shown signs of recovery since 2018.
According to EUMOFA estimates, the total EU apparent consumption of caviar 2018 was between 121
tonnes and 126 tonnes depending on the source4. of extra-EU trade5 Compared to similar calculations
for 2016, EU production of caviar have increased by 30% while apparent consumption in the EU have
increased by 20%6. France is the largest consumer market for caviar in the EU, followed by Germany
and Spain. Other main caviar consuming countries are the USA, Japan, Russia, and China as well as
Canada, Switzerland, the United Kingdom, the United Arab Emirates, Singapore, and Australia.

1
    https://www.eumofa.eu/documents/20178/84590/The+caviar+market_EU.pdf
2
    Source: FAO
3
    First World Caviar Forum, 7th May 2019
4
    Data collected from FEAP, CITES, and EUROSTAT. See chapter 3.2 Consumption in the EU
5
    Note that the UK is excluded from analysis of the EU, see section 0.1.1
6
 In the 2018-edition of this report, the reported production in 2016 was 126 tonnes and the calculated apparent
consumption in the EU, excluding the UK, was between 101 and 106 tonnes.

                                                                                                                    1
EUMOFA - European Market Observatory for Fisheries and Aquaculture Products
The caviar market: production, trade, and consumption in and outside the EU
DEFINITIONS
CITES The Convention on International Trade in Endangered Species of Wild Fauna and Flora
CN Combined Nomenclature7
EU The European Union as of 1st January 2021, i.e. excluding the United Kingdom
EUMOFA European Market Observatory for Fisheries and Aquaculture Products
FAO Food and Agriculture Organization of the United Nations
FEAP Federation of European Aquaculture Producers
HS Harmonised System8
MS EU Member States as of 1st January 2021, i.e. excluding the United Kingdom
7
Council Regulation (EEC) No 2658/87 of 23 July 1987 on the tariff and statistical nomenclature and on the Common
Customs Tariff
8
World Customs Organization http://www.wcoomd.org/en/topics/nomenclature/overview/what-is-the-harmonized-system.aspx
2EUMOFA - European Market Observatory for Fisheries and Aquaculture Products
The caviar market: production, trade, and consumption in and outside the EU
0. METHODOLOGY
0.1. Methodology
The study is based on publicly available literature, research, news articles, and data sources. Through
contact details received from FEAP, the major caviar stakeholders in the EU have been contacted and
asked to contribute to the study. Two interviews were conducted, contributing both general and specific
insight regarding production, trade, and market outlets.
0.1.1 Brexit
This report analyses data for the years 2014-2020. The UK formally left the EU on 31st January 2020
and entered a transition period that lasted until 31st December 2020. Starting from February 2020, trade
data reported by the UK are not available in EUROSTAT. For the sake of consistency, the UK is excluded
from the EU aggregate and treated as an extra-EU country throughout the whole period in all analyses
in this report.
0.2. Data
The main data sources for this study concerning production of sturgeons and caviar are FAO and FEAP,
while data from EUMOFA (based on EUROSTAT and IHS Markit – Global Trade Atlas) and CITES are used
when analysing the trade of caviar.
Since the first edition of this report in 2018, EUMOFA has expanded the coverage of its international
trade database which now includes volumes and values of imports and exports of fishery and
aquaculture products from almost 100 reporting countries.
Although both EUROSTAT-COMEXT and IHS data are comprehensive, it must be underlined that imports
and exports of goods are reported in line with the Harmonised System9 (HS) and the Combined
Nomenclature10 (CN), which do not include detailed information on caviar products. On the other hand,
CITES trade data provide more details in terms of species, origin, trade purpose, etc. However, the CITES
data only include trade volumes and not values.
From a global point of view, production of sturgeons, and especially of caviar, is very small. Generally,
as the volumes get smaller, the data deviations in relative terms increase and are consequently harder
to interpret. There are large deviations both between and within the different data sources used in this
study. It is not within the scope of this study to confirm one or the other source or to establish a
benchmark for the sturgeon and caviar markets. Instead, the different sources are presented as they
are, following the methodologies introduced in the following sub-chapters.
0.2.1 CITES Trade Database
The Convention on International Trade in Endangered Species of Wild Fauna and Flora (CITES) is an
international agreement between governments aimed at ensuring that international trade in specimens
of wild animals and plants does not threaten their survival. CITES consists of 18311 parties who all
implemented the convention. CITES provides a legal framework for regulating international trade in
species threatened or potentially threatened by that trade. The framework is based on a system whereby
9
World Customs Organization http://www.wcoomd.org/en/topics/nomenclature/overview/what-is-the-harmonized-system.aspx
10
Council Regulation (EEC) No 2658/87 of 23 July 1987 on the tariff and statistical nomenclature and on the Common
Customs Tariff
11
List of Contracting Parties | CITES
3EUMOFA - European Market Observatory for Fisheries and Aquaculture Products
The caviar market: production, trade, and consumption in and outside the EU
permits and certifications are issued for international trade in specimens listed in the appendices of the
agreement12.
Each partner of the agreement must designate a “management authority” that is responsible for issuing
permits and compiling annual reports on their international trade in the listed species. The annual reports
regarding countries’ trade are due by October 31st the following year and are entered into the CITES
Trade Database upon submission. The data can be extracted from an online database, or through a bulk
download of the entire database.
Compared to the caviar study in 2018, the methodology for this edition of the study has changed. Instead
of downloading comparable tables from the online database, the entire CITES trade database was
downloaded13. Taxa were matched against the FAO common names of species (with hybrid names
manually created based on the FAO common names).
From the database, which includes data on all species, both fauna and flora, covered by the convention,
only observations where the variables “family” or “order” equalled “Acipenseridae” were kept. This
resulted in a dataset with 234.646 observations.
Further filtration and transformation of the dataset consisted of the following:
1. Trade terms other than “caviar” or “eggs” were excluded14. This amounted to 103.127
observations being deleted.
2. All units of measurements were converted to kilograms. Observations which could not be
converted (cm2, litres, millilitres, and blanks) were excluded. This amounted to 1.371 observations
being deleted.
3. Trade purpose other than “commercial” were excluded15, amounting to deletion of 3.196
observations.
4. The time-period was set to 2010-2018, excluding 44.915 observations. Although data from
2019 were available, these data were incomplete and therefore excluded.
5. Through working with the data, 66 observations were classified as outliers and removed.
Observations were first identified as possible outliers due to abnormal high volume. These
observations were only classified as outliers and removed after an overall assessment
comparing importer- and exporter-reported volumes, and other trade between the two trade
partners as well as comparisons with other sources concerning both production and trade. The
complete list of removed outliers is attached in Appendix 1.
The final dataset used for the analyses in this study consists of 81.971 observations.
When comparing CITES trade data in terms of total volume reported by importers and what is reported
by exporters, there are occasional large discrepancies. One explanation can be that the volumes reported
to CITES are the quantity for which the permits or certificates were issued, and not the actual trade.
According to CITES, “it is not uncommon for the quantity of specimens traded to be considerably less
than the amount specified on the permits, or for permits not to be used at all”16. Furthermore, due to
delays and other reporting problems, the database is constantly updated and “the most recent year for
which comprehensive trade statistics are available is normally two years before the current year”.
12
Read more about the CITES regulation in the convention texts available at https://cites.org/eng/disc/text.php
13
UNEP-WCMC (Comps.) 2020. Full CITES Trade Database Download. Version 2020.1. CITES Secretariat, Geneva, Switzerland.
Compiled by UNEP-WCMC, Cambridge, UK. Available at: trade.cites.org.
14
Bodies, bone pieces, bones, carapaces, carvings, cosmetics, derivates, eggs (live), extract, fingerlings, fins, genitalia,
jewellery, leather products, live, meat, medicine, oil powder, skeletons, skin pieces, skins, soup, specimens, swim bladders,
trophies, unspecified.
Personal, unknown, scientific, circus or travelling exhibition, breeding in captivity or artificial propagation, educational,
15
medical (including biomedical research), zoo, law enforcement/judicial/forensic.
16
https://trade.cites.org/cites_trade_guidelines/en-CITES_Trade_Database_Guide.pdf
4EUMOFA - European Market Observatory for Fisheries and Aquaculture Products
The caviar market: production, trade, and consumption in and outside the EU
Figure 1: Yearly CITES trade volumes of caviar by reporter type (tonnes)
250
200
150
Tonnes
100
50
0
2010 2011 2012 2013 2014 2015 2016 2017 2018
Importer reported volume Exporter reported volume
Source: CITES Trade Database
Except for 2010, exporter-reported volumes were higher than the volumes reported by importers. This
could imply that the issue of permits being only partially used or not used at all occurs more often for
exporters than for importers, so exporter-reported volumes may be greater than those actually traded.
0.2.2 EUMOFA – EU trade data from EUROSTAT-Comext
EUROSTAT (Comext) data available through EUMOFA monitors monthly trade flows within the EU and
between EU Member States and third countries. Based on literature and studies, contacts with
stakeholders and own analyses, the CN code 16043100 refers to caviar from sturgeons.
The data include several transactions with very low prices, and the EU export exceeds the production.
Between 2014 and 2020, the yearly total export volume (both intra and extra EU) varied between 260
and 670 tonnes. This indicates that products other than sturgeon caviar are also included in this CN code.
European stakeholders (producers and distributors) have indicated that caviar is traded with a “floor
price” ranging between 300 EUR/kg to 500 EUR/kg, depending on the species from which the caviar was
produced, the country of origin, and the volumes sold.
While stakeholders indicated a floor price of 300 EUR/kg for their caviar products, some old products
from storage could be sold at far lower prices. Furthermore, the average price of EU imports from China
has dropped from more than 400 EUR/kg in 2014 to just above 200 EUR/kg for the past three to four
years.
In the 2018 report, a floor price of 100 EUR/kg was used, meaning observations with prices below this
threshold were excluded. However, stakeholders have indicated that this threshold might be too low, so
for this year’s edition of the report, further tests have been made concerning the floor price. The tests
were made with three different minimum floor prices and comparing the trade volumes with other
sources:
- Floor price of 100 EUR/kg
- Floor price of 150 EUR/kg
- Floor price of 200 EUR/kg
With a floor price of 200 EUR/kg, the trade volumes were assessed as too low, meaning actual sturgeon
caviar products were excluded from the analysis. However, the effects on the trade volumes are small
5EUMOFA - European Market Observatory for Fisheries and Aquaculture Products
The caviar market: production, trade, and consumption in and outside the EU
when comparing a floor price of either 150 EUR/kg or 100 EUR/kg. After a general assessment
considering data analysis and stakeholders’ input, the floor price of 100 EUR/kg is used, keeping with the
methodology of the previous report. Consequently, transactions with a unit price lower than 100 EUR/kg
were disregarded. The floor price used could of course be subject for further discussion.
0.2.3 EUMOFA – data from IHS Markit on trade flows between third countries
EUMOFA collects monthly trade data reported by third countries from IHS Markit. These data have been
used when assessing production and consumption in other regions (chapter 1.3 and 3.3).
In line with the methodology used for EUROSTAT data, HS code 160431 has been used in the analysis.
However, other products in addition to sturgeon caviar is traded using this HS code. Between 2014 and
2020, the yearly total export volume from 27 non-EU countries was between 300 and 1.300 tonnes. To
exclude caviar products most likely from species other than sturgeon, and to ensure a consistent
methodology throughout the report, trade flows with an average price below 100 EUR/kg have been
disregarded.
Data on trade flows between third countries are publicly available at MCS17 level on the EUMOFA website.
17
Main Commercial Species are EUMOFA aggregates of CN and HS codes as part of the harmonisation rules. Read more about
EUMOFA data management methodologies (https://www.eumofa.eu/supply-balance-and-other-methodologies) and
harmonisation correlation tables (https://www.eumofa.eu/harmonisation).
6EUMOFA - European Market Observatory for Fisheries and Aquaculture Products
The caviar market: production, trade, and consumption in and outside the EU
1. PRODUCTION
1.1 Sturgeons and caviar
Caviar is roe from sturgeons. Historically, sturgeons were harvested in the Caspian Sea and their roe sold
as caviar, mainly by Russia and Iran. The most well-known and high prized caviars are Beluga from the
beluga sturgeon (Huso huso), Osetra from the Danube sturgeon (Acipenser gueldenstaedtii)18, and
Sevruga from the starry sturgeon (Acipenser stellatus). All species originate in Eurasia, primarily in the
Caspian Sea, the Black Sea and connected rivers.
Caviars differ in qualities and the grade, and thereby the price, is determined by factors such as pearl
size, texture, colour, lucidity, uniformity, separation, fragrance, firmness, taste, and maturity.
While these three species are the most well-known, most of the caviar on the market today is from
several other sturgeon species. More common varieties are from the white sturgeon (Acipenser
transmontanus), or the shortnose sturgeon (Acipenser brevirostrum) with more highly prized caviar
originating from Siberian sturgeon (Acipenser baerii) and the beluga-like kaluga sturgeon (Huso dauricus).
Overfishing of sturgeon has almost led to the extinction of several of these species. Globally, the largest
capture was recorded in 1977 at 31.800 tonnes. Since 1998, international trade of all sturgeon species
and related products has been regulated under CITES19. In 2006, Romania, as the first of several
countries, introduced a ban on sturgeon fishing in the Caspian and Black Sea. In 2018, a total global
capture of 222 tonnes was recorded.
The first FAO-recorded harvest from aquaculture was in 1984 at 150 tonnes. Since then, production
gradually increased to the beginning of the 2000s, at which point it started increasing rapidly year by
year. In 2018, the world aquaculture production of sturgeon was about 115.168 tonnes20. Subsequently,
nearly all caviars on the market today are harvested from farmed sturgeon.
Figure 2: Capture and aquaculture of sturgeons (1.000 tonnes)
140
120
100
1.000 tonnes
80
60
40
20
0
Capture Aquaculture
Source: FAO
18
Also known as the Russian sturgeon
19
See chapter 0.2.1 for more information about CITES regulation.
20
Note that FAO has updated their database adjusting quantities. Production numbers listed in the previous report are higher
than the current reported numbers.
7EUMOFA - European Market Observatory for Fisheries and Aquaculture Products
The caviar market: production, trade, and consumption in and outside the EU
1.1.1 Production cycle
Several different technologies are used for rearing sturgeon. Estimates from 2016 show that roughly
36% of sturgeons are reared in flow-through systems, followed by recirculating aquaculture systems21
(21%), and cages (18%)22. Ponds are also used, but only make up a small percentage (7%)23. The
remaining sturgeon rearing is undertaken using a combination of techniques.
Exploiting sturgeons for caviar production is costly because it takes many years for female sturgeons to
reproduce. Included in the cost is also the selection process of selecting females for caviar production.
The sex can be determined after an average of three years of farming, depending on the species, through
using ultrasound. During this period, both male and female sturgeons are reared, and after sex
determination, males are harvested.
To harvest the caviar, female fish are monitored through ultrasound to determine if they are ready to
spawn, and if the eggs are ready for harvesting. Females that are near harvest are purged in separate
tanks with fresh, colder water, and taken off feed for four to six weeks24. This mimics the natural breeding
habits of the fish and prevents undesired taste in the eggs. After purging, the fish are slaughtered, and
their egg sac is removed. Once removed, the egg sac is rolled by hand over a sieve/metal grate to
separate the eggs from the surrounding membrane. A control process then takes place to remove
discoloured eggs and other impurities as well as to determine the size of the eggs. The eggs are salted
by hand and either immediately placed in cans that are weighed down to press out excess air, allowing
the caviar to absorb salt, or directly placed in small cans placed under vacuum. Caviar that is only lightly
salted is entitled malossol and has a short shelf life, but higher value. Additives such as Borax and LIV-
1 can be added in small amounts to the caviar to extend the shelf life, in addition to pasteurising the
caviar25,26.
Several techniques for harvesting caviar without killing the fish have been tested. Two main methods
have emerged as no-kill alternatives: milking and c-section27. The milking method involves massaging
the eggs out of the sturgeon, without cutting into the fish. A hormone is administered to the fish, inducing
labour and releasing the eggs from the membrane of the fish allowing for the collection of the eggs.
However, the labour inducing hormones changes the texture and tase of the pearls and industry
stakeholders claim the quality is inferior to caviar produced through traditional methods2829. The c-
section method requires a small incision in the fish to access and remove the egg.. However, following a
c-section the fish are susceptible to infections and may in some cases not be able to produce eggs later.
The increased costs of labour and time required to utilize the non-kill caviar methods, alongside the risk
of poorer quality caviar and reduced fish welfare, currently makes traditional methods the preferred
alternative for industry stakeholders.
Below there is a short description of the common sturgeon species used in caviar production and time
for reaching maturity.30
21
Read more about RAS in the EUMOFA report Recirculating Aquaculture Systems, published in December 2020
22 Bronzi, P, Chebanov, M, Michaels, JT, Wei, Q, Rosenthal, H, Gessner, J. Sturgeon meat and caviar production: Global update
2017. J Appl Ichthyol. 2019; 35: 257– 266. https://doi.org/10.1111/jai.13870
23
Ibidem
24
https://roadsandkingdoms.com/2018/farmed-russian-sturgeon-caviar-in-the-united-states/
25
https://caviar-aquatir.de/faq/
26
https://www.careliancaviar.com/our-caviar/interesting-facts-about-caviar
27
https://www.nhpr.org/post/no-kill-caviar-aims-keep-treat-and-save-sturgeon#stream/0
28
Ibidem
29
https://caviarstar.com/blogcaviar-harvesting-how-to-make-caviar-where-does-caviar-come-from/
30
FAO FishFinder
8EUMOFA - European Market Observatory for Fisheries and Aquaculture Products
The caviar market: production, trade, and consumption in and outside the EU
Siberian: in the wild, it takes 19-20 years for the species to reach maturity in northern Siberia and 11-
12 years in southern Siberian rivers (namely the Lena River). In captivity, the time for reaching maturity
is 6-8 years. The species can spawn again after two or three years.
Kaluga: in the wild, maturity is reached after 14-23 years. The time is halved in captivity. Spawning
takes place once every four to five years. China has developed hybrid species of kaluga sturgeon and
production has increased rapidly over the past 10-15 years as it is more cost effective than the original
Kaluga species.
Beluga: maturity is reached after 19-22 years in the wild, with spawning occurring a minimum of five
years later. In captivity, the species reaches maturity after 16 - 18 years, making it the most expensive
sturgeon species to rear.
Danube: maturity is reached at 12-16 years, with spawning every four to five years. In captivity, maturity
is reached after 9-11 years.
White: in the wild, the species reaches maturity at 11-34 years of age. Young females spawn every four
years, and older females every 9-11 years. In captivity, maturity is reached during its tenth year. Caviar
is of a higher quality after 11-15 years.31
Starry: maturity in captivity is reached after 8 - 10 years. In the wild females mature with an average
age of 9.7 years and rarely spawn more than three times in their lives32.
Sterlet: matures faster than other sturgeon varieties. In the wild, males reach sexual maturity at an age
of 3-6 years old, one to two years earlier than the females33 while in captivity maturity is reached after
4 - 5 years.
31
https://www.cavaliercaviarclub.com/
32
http://www.fao.org/fishery/species/2071/en
33
http://www.fao.org/fishery/species/2070/en
9EUMOFA - European Market Observatory for Fisheries and Aquaculture Products
The caviar market: production, trade, and consumption in and outside the EU
1.2 EU production of caviar
According to FEAP, EU Member States produced 164 tonnes of caviar in 2018, an increase of 12% from
145,8 tonnes in the year before, and a 55% increase from 106 tonnes in 2015 when FEAP first started
disseminating production volumes. The largest producers were Italy, France, Poland and Germany,
accounting for 84% of total production in 2018.
Table 1: Caviar production by MS as reported by FEAP members (tonnes)34
Producing MS 2015 2016 2017 2018 Growth (2015-2018)
Italy 35 38 43 54 54%
France 23 30 37 45 96%
Poland 10 15 20,4 24 140%
Germany 17 15 16,1 15 -12%
Spain 4 6 5 7 65%
Bulgaria 6 7 8 6 0%
Belgium 3 3 3,8 5 67%
Finland 4 4 3,5 5 25%
Latvia 0 0 3 3 N/A
Netherlands* 2 2 1 -100%
Hungary 2 3 2 -100%
Greece 2 N/A
Austria* 1 N/A
Total 106 123 145,8 164 55%
*Currently does not have any caviar producers as FEAP members
Source: FEAP
FEAP does not publish information about which sturgeon species are reared by their respective members,
but assumptions can be made by analysing CITES trade data. It is important to note that the CITES trade
data includes exports of caviar products which have been imported, repackaged and then re-exported.
The caviar exported by a country may therefore not necessarily reflect the production of the different
sturgeon species in the MS.
Of the caviar exporting MS, Spain mainly exports caviar from the Adriatic sturgeon (53%) and Siberian
Sturgeon (34%). Bulgaria mainly exports caviar from the Danube sturgeon (95%), while Belgium
primarily exports caviar from a Siberian/Danube sturgeon hybrid (61%) followed by Danube sturgeon
(23%). Finland only exports caviar from the Siberian sturgeon, while Latvia mainly exports caviar from
the Siberian sturgeon (81%) and Sterlet sturgeon (17%).
34
FEAP only collects information from its members. Therefore, If a sturgeon producer is not a member of FEAP their production
is not taken into consideration. The numbers present in the table may therefore not fully represent the caviar production in MS.
10EUMOFA - European Market Observatory for Fisheries and Aquaculture Products
The caviar market: production, trade, and consumption in and outside the EU
Table 2: Export of caviar by sturgeon species in each caviar producing MS*, 2018
Germany
Bulgaria
Belgium
Finland
Poland
France
Latvia
Spain
Italy
Siberian sturgeon
X X X X X X X X
Acipenser baerii
Danube sturgeon
X X X X X X X X X
Acipenser gueldenstaedtii
Kaluga/Amur sturgeon hybrid
X X X X
Huso dauricus x acipenser schrenckii
White sturgeon
X X X X
Acipenser transmontanus
Beluga
X X X X X X
Huso huso
Acipenseridae hybrid
X X
Acipenseridae hybrid
Starry sturgeon
X X X X
Acipenser stellatus
Siberian/Danube sturgeon hybrid
X X X
Acipenser baerii x gueldenstaedtii
Adriatic sturgeon
X X X
Acipenser naccarii
Beluga/Siberian sturgeon hybrid
X
Huso huso x acipenser baerii
Acipenser hybrid
X
Acipenser hybrid
Sterlet sturgeon
X X X X X
Acipenser ruthenus
Siberian/Adriatic sturgeon hybrid
X X X
Acipenser baerii x naccarii
Kaluga
Huso dauricus
Amur sturgeon
X X
Acipenser schrenckii
Danube/Siberian sturgeon hybrid
Acipenser gueldenstaedtii x baerii
* as reported by FEAP members
Source: Own elaboration of CITES export data
11EUMOFA - European Market Observatory for Fisheries and Aquaculture Products
The caviar market: production, trade, and consumption in and outside the EU
1.3 Production in other regions
The global production of caviar in 2018 has been estimated to be 380 tonnes35.
Over the past 20 years, there has been a steep growth in aquaculture production of sturgeons, mainly
driven by China. According to FAO, the world production was 4.100 tonnes in 2002, half of which took
place in Russia and the remaining part in the EU. In 2003, the world production more than tripled when
China reported a production of over 9.000 tonnes. Since then, Chinese production has increased by
tenfold to almost 97.000 tonnes in 2018.
In 2018, China accounted for 84% of global sturgeon production, followed by Armenia at 3% (3.900
tonnes), and Russia at 3% (3.800 tonnes). Data from CITES supports the FAO data as massive Chinese
imports of live sturgeon eggs started in 2001. From that time, China obviously built production and own
stocks of Siberian sturgeon. Chinese stock building matches CITES data which shows a significant decline
in Chinese imports of live eggs from 2013 onwards.
Figure 3: Sturgeon production by top producing countries (1.000 tonnes)
120
100
80
1.000 tonnes
60
40
20
0
China Armenia Russia EU Iran Other
Source: FAO
Table 3: Sturgeon production (tonnes)
2010 2011 2012 2013 2014 2015 2016 2017 2018
China 35.324 44.211 55.184 64.652 75.920 82.436 78.764 83.058 96.914
Armenia 550 830 1.636 2.170 2.931 4.115 4.649 3.798 3.910
Russia 2.078 3.020 3.270 3.430 3.560 3.845 2.517 2.584 3.791
EU 1.793 1.821 2.092 2.317 2.473 2.731 2.699 3.152 3.366
Iran 251 312 456 564 650 1.071 2.146 2.618 2.839
Vietnam 600 1.000 1.200 1.200 693 785 939 1.331 1.400
USA 200 300 300 947 947 947 947 947 1.166
Other 265 342 535 671 681 779 741 1.332 1.763
Total 41.061 51.836 64.673 75.951 87.855 96.709 93.402 98.819 115.149
Source: FAO
35
First World Caviar Forum, 7th May 2019.
12EUMOFA - European Market Observatory for Fisheries and Aquaculture Products
The caviar market: production, trade, and consumption in and outside the EU
1.3.1 China
According to the China Fishery Statistical Yearbook 2020, the production of sturgeon reached 102.042
tonnes in 201936. Much of the sturgeon meat is produced exclusively for consumption37, but China still
supplies an estimated one third of global caviar volumes38. There are no reports of the total caviar
production in China. However, the Chinese company Kaluga Queen reportedly produced 86 tonnes of
caviar in 201839. Roughly half of Kaluga’s production is sold to Europe, 20% to the USA, and 10% to
Russia40. At present, Kaluga Queen produce about 200.000 sturgeon fry each year, claiming a survival
rate of each batch as high as 99%41.
In 2020, China exported 123 tonnes of caviar, down from 140 tonnes in 2019. The largest export market
for Chinese caviar in 2020 was the EU (38%), closely followed by the USA (36%). As the volumes of
Chinese caviar export has increased year by year, the price level decreased by almost 40% between
2014 and 2018 but seems to have stabilised at around 200 EUR/kg since.
Figure 4: Chinese export of caviar. Volume and weighted average price* (left-hand side).
Main export markets in 2020 (right-hand side)
2020
350 160
Kazakhstan
3% Other
300 140 12 %
120 Russia
250 5%
100
200
Tonnes
EUR/kg
80 EU
150 38 %
60
100
40
Ukraine
50 20 6%
0 0
2014 2015 2016 2017 2018 2019 2020 USA
36 %
Volume Weighted avg. price
*Nominal values
Source: EUMOFA/IHS Markit
36
China Fishery Statistical Yearbook 2020 pg. 33
37
World Caviar Forum 2019
38
https://www.businessinsider.com/china-caviar-prices-kaluga-queen-2020-2?r=US&IR=T
39
https://gulfnews.com/photos/news/caviar-queen-chinese-roe-reigns-around-the-world-1.1576149388350
40
Ibidem
41
https://www.kalugaqueen.com/gywm
13EUMOFA - European Market Observatory for Fisheries and Aquaculture Products
The caviar market: production, trade, and consumption in and outside the EU
1.3.2 Armenia
Although sturgeon production is high in Armenia, these volumes are most likely due to production of
meat for consumption, and not primarily from caviar production. Industry stakeholders have estimated
that Armenia produces between 10 tonnes and 20 tonnes of caviar. Armenian reported trade data is not
available but, considering imports from Armenia by the other reporting countries, the yearly Armenian
export volume between 2014 and 2019 is around 1 tonne with an increasing average price (205 EUR/kg
in 2014 and 337 EUR/kg in 2019). In the CITES trade data, yearly Armenian export of caviar varies
between 0 and 3 tonnes.
1.3.3 Russia
It is estimated that Russia produced between 40 and 50 tonnes of sturgeon caviar in 2019 and 202042,43.
In 2019, there were 80 farms in Russia producing sturgeon and caviar. There are some disagreements
about whether the Russian caviar production numbers contain falsely labelled caviar obtained through
imports from China and Uruguay, before being reexported as Russian products44. A solution proposed to
combat the issue with counterfeited caviar is electronic labelling of caviar in cooperation with the Union
of Sturgeon Breeders45.Observations of the Russian caviar black market show a fall in the domestic
market from 420 tonnes to 170 tonnes of illegal caviar over the past six years46.
In 2020, Russia exported around one tonne of caviar, which is low compared to previous years where
exports had been relatively stable between seven tonnes and eight tonnes. The trade statistics do not
specify which countries Russia exports caviar to. Prices of Russian caviar exports have been relatively
stable for the last seven years, fluctuating between 237 EUR/kg (2018) and 326 EUR/kg (2014). The
Russian Federal Agency for Fishery has set a goal of increasing its export of sturgeon caviar to 38 tonnes
by 202547.
Figure 5: Russian export of caviar. Volume and weighted average price*
350 9
8
300
7
250
6
200 5
Tonnes
EUR/kg
150 4
3
100
2
50
1
0 0
2014 2015 2016 2017 2018 2019 2020**
Volume Weighted avg. price
*Nominal values
**January-November
Source: EUMOFA/IHS Markit
42
https://www.seafoodsource.com/news/supply-trade/russian-caviar-production-up-23-percent-but-skeptics-claim-mislabeling
43
https://rskrf.ru/tips/rassledovaniya/roskachestvo-issledovalo-osetrovuyu-ikru-vyyavleny-zapreshchennaya-bura-kontrafakt-i-
drugie-narusheniya-/
44
https://www.seafoodsource.com/news/supply-trade/russian-caviar-production-up-23-percent-but-skeptics-claim-mislabeling
45
https://rosng.ru/post/rossiya-v-pyat-raz-uvelichit-eksport-chernoy-ikry-za-rubezh-za-pyat-let
46
http://varpe.org/analytics/rossiyskiy-i-mirovoy-rynok-chernoy-ikry/
47
https://rosng.ru/post/rossiya-v-pyat-raz-uvelichit-eksport-chernoy-ikry-za-rubezh-za-pyat-let
14EUMOFA - European Market Observatory for Fisheries and Aquaculture Products
The caviar market: production, trade, and consumption in and outside the EU
1.3.4 USA
It is estimated that the USA produced 18 tonnes of caviar in 201848, and the FAO reports 1.166 tonnes
of sturgeon production for the same year. In 2020, the USA exported around one tonne of caviar, down
from four tonnes in 2019 and 10 tonnes in 2018. Looking at 2019, which may be a more representative
year for exports, the USA exports were primarily destined to Japan (39%), Canada (27%), and the EU
(22%). The price level of American caviar exports has experienced a downward trend, dropping from 303
EUR/kg in 2014 to 188 EUR/kg in 202049.
Figure 6: US exports of caviar. Volume and weighted average price* (left-hand side). Main
export markets in 2019 (right-hand side)
2019
350 10
9
300
8
250 7 Other
12 %
6
200
Tonnes
EUR/kg
5
150 Japan
4 EU 39 %
3 22 %
100
2
50
1
0 0
2014 2015 2016 2017 2018 2019 2020 Canada
27 %
Volume Weighted avg. price
*Nominal values
Source: EUMOFA/IHS Markit
48
World Caviar Forum 2019
49
Feedback from stakeholders indicate that prices in recent years are too low and not representative for the US exports of
sturgeon caviar. Analyses of the US export data indicate large amounts of products other than sturgeon caviar being traded
under HS code 160431 which increases the uncertainty in the methodology of using a floor price of 100 EUR/kg in this study.
With no floor price the yearly US export volume over the period varies between 80 and 545 tonnes. For US exports, a floor price
of 150 EUR/kg or even 200 EUR/kg is more likely to capture the real export of sturgeon caviar. Compared to the analyses with
a floor price of 100 EUR/kg, a floor price of 150 EUR/kg reduces the total export volume over the 7-year period by 36%, and
the yearly weighted average price declines from 308 EUR/kg in 2014 to 222 EUR/kg in 2020. A floor price of 200 EUR/kg reduces
the total 7-year export volume by 58%, and the yearly weighted average price declines from 314 EUR/kg in 2014 to 248 EUR/kg
in 2020.
15EUMOFA - European Market Observatory for Fisheries and Aquaculture Products
The caviar market: production, trade, and consumption in and outside the EU
1.3.5 Uruguay
Uruguay is the leading caviar producer in South America. It is estimated that Uruguay produced 19 tonnes
of caviar in 201950 and 94 tonnes of sturgeon51. In 2020, Uruguay exported seven tonnes of caviar. The
largest shares of Uruguay’s caviar export went to the USA (31%), followed by Russia (23%) and the EU
(18%). Until 2016, Uruguay experienced a growth in its export prices, reaching a peak of 455 EUR/kg.
Since then, prices have trended downward reaching 284 EUR/kg in 2020.
Figure 7: Uruguayan export of caviar. Volume and weighted average price* (left-hand
side). Main export markets in 2020 (right-hand side)
2020
500 12
450 Other
10 14 %
400
Japan
350
8 5%
300
USA
Tonnes
EUR/kg
250 6 31 %
200
4
150 Australia
9%
100
2
50
EU
0 0 18 % Russia
2014 2015 2016 2017 2018 2019 2020
23 %
Volume Weighted avg. price
*Nominal values
Source: EUMOFA/IHS Markit
50
https://www.bloomberg.com/news/articles/2016-05-13/uruguay-is-betting-size-doesn-t-matter-in-global-caviar-market
51
FAO, 2018
16EUMOFA - European Market Observatory for Fisheries and Aquaculture Products
The caviar market: production, trade, and consumption in and outside the EU
2. INTERNATIONAL TRADE OF CAVIAR
As clarified in chapter 0.1.1, for the sake of consistency in the time series, the United Kingdom is excluded
from the EU aggregate.
The intra-EU trade analysed in chapter 2.1 is based on EUROSTAT (Comext) trade data.
The extra-EU trade is analysed based on two different sources. Chapter 2.2 analyses EU imports and
exports with third countries based on EUROSTAT (Comext), while these trade flows are also analysed
based on CITES data in chapter 2.3. The two data sources are complementary: Comext data includes
values which makes it possible to analyse price developments, while CITES data only contains volumes
but are more detailed inter alia in terms of species. A more thorough description of the sources,
methodologies and assumptions are available in chapter 0.0.2.
The data concerning 2020 is not complete in terms of data submission for December from all reporting
countries. However, of the main caviar producing and trading countries, only trade data from Russia is
missing. The analyses on trade are therefore assessed as representative for the development in 2020.
Still, the analyses concerning 2020 should be interpreted with care as they do not necessarily represent
a lasting change in export volumes or shares. With travel restrictions, closed HoReCa segments and social
distancing measures due to the COVID-19 pandemic, more caviar products were sold domestically (ref.
chapter 3.1). It is too soon to conclude whether this is a short-term shift in trade patterns or whether it
represents a long-term trend.
2.1 Intra-EU trade
Reported intra-EU export of caviar, which consists of both caviar of EU origin and re-export of imported
caviar, increased by 65% between 2014 and 2018 from 37,4 tonnes to 61,6 tonnes. The total export
volume decreased by 11% in both 2019 and 2020 to 54,5 and 48,4 tonnes, respectively. There is a clear
seasonality with increased volumes around holidays, especially towards the end of the year during the
Christmas season and around Easter.
Table 4: Monthly intra-EU export volume (tonnes) and weighted average price* (EUR/kg)
2014 2015 2016 2017 2018 2019 2020
Month Volume Price Volume Price Volume Price Volume Price Volume Price Volume Price Volume Price
1 1,9 407 2,3 388 1,9 427 3,0 365 3,3 352 3,3 378 2,3 424
2 1,6 419 2,0 373 1,5 404 2,0 377 2,5 373 3,3 395 5,0 292
3 4,1 299 2,1 390 3,5 348 3,4 409 7,8 333 4,0 391 1,6 400
4 1,8 409 2,2 358 2,1 369 2,2 376 4,0 345 4,6 358 1,2 398
5 1,8 462 2,1 373 2,3 400 3,1 376 3,1 372 3,4 415 1,4 451
6 1,8 489 1,9 422 2,4 430 2,6 416 2,4 432 2,4 446 2,9 375
7 2,0 377 2,5 394 2,0 431 1,7 466 2,7 410 2,2 468 2,0 398
8 1,8 439 2,1 403 2,9 346 1,8 443 3,0 388 3,2 365 3,2 379
9 3,1 389 2,4 401 2,3 379 4,7 361 3,4 351 4,8 367 6,8 516
10 5,6 403 5,0 369 4,8 389 5,5 362 6,9 335 6,8 354 7,4 324
11 5,7 412 5,2 404 5,3 427 12,4 355 11,7 343 8,3 364 10,7 385
12 6,3 506 6,8 493 7,6 452 9,8 420 10,7 433 8,2 450 4,0 319
Total 37,4 418 36,6 408 38,8 406 52,3 385 61,6 369 54,5 391 48,4 383
*Nominal values
Source: EUMOFA/EUROSTAT
17EUMOFA - European Market Observatory for Fisheries and Aquaculture Products
The caviar market: production, trade, and consumption in and outside the EU
From January 2014 to December 2020, the monthly average export price fell from 407 EUR/kg to
319 EUR/kg (-21%). However, with all the price fluctuations, these two price points are not necessarily
representative. The long-term downward trend in the export price corresponds to a compound monthly
growth rate of -0,08%.
Figure 8: Monthly intra-EU export volume (tonnes) and weighted average price* (EUR/kg)
600 14
500 12
10
400
8
Tonnes
EUR/kg
300
6
200
4
100 2
0 0
jan
jan
jan
jan
jan
jan
jan
apr
apr
apr
apr
apr
apr
apr
okt
okt
okt
okt
okt
okt
okt
jul
jul
jul
jul
jul
jul
jul
2014 2015 2016 2017 2018 2019 2020
Volume (right axis) Weighted avg. price Linear ( Weighted avg. price)
*Nominal values
Source: EUMOFA/EUROSTAT
Although the long-term linear trend is negative, the intra-EU export price actually shows an increasing
trend from 2018 towards 2020. The yearly weighted average prices declined by 12% from 418 EUR/kg
in 2014 to 369 EUR/kg in 2018, before increasing by 4% to 383 EUR/kg in 2020.
Figure 9: Yearly intra-EU export volume (tonnes) and weighted average price* (EUR/kg)
450 70
400
60
350
50
300
250 40
Tonnes
EUR/kg
200 30
150
20
100
10
50
0 0
2014 2015 2016 2017 2018 2019 2020
Volume (right axis) Weighted avg. price
*Nominal values
Source: EUMOFA/EUROSTAT
18EUMOFA - European Market Observatory for Fisheries and Aquaculture Products
The caviar market: production, trade, and consumption in and outside the EU
Italy is the main intra-EU exporting MS, but has lost market shares over the past two years. Between
2014 and 2018, Italy accounted for between 44% and 54% of the total intra-EU export. Increased trade
from other MS, combined with a sharp decrease in Italy’s export volumes, has seen Italy’s share of total
intra-EU exports decrease to 41% in 2019 and further to 33% in 2020.
Figure 10: Intra-EU export by main MS (tonnes on the left-hand side and export shares on
the right-hand side)
35 100 %
90 %
30
80 %
25 70 %
% share of exports
60 %
20
Tonnes
50 %
15 40 %
10 30 %
20 %
5
10 %
0 0%
2014 2015 2016 2017 2018 2019 2020 2014 2015 2016 2017 2018 2019 2020
Italy France Poland Germany Belgium Others
Source: EUMOFA/EUROSTAT
2.2 Extra-EU trade – EUROSTAT/EUMOFA
2.2.1 Import
According to EUMOFA elaborations of EUROSTAT-COMEXT data, EU imports of caviar from third countries
more than doubled in volume from 25 tonnes in 2014 to 54,5 tonnes in 2019. Extra-EU import volume
decreased by 16% to 45,7 tonnes in 2020. Compared with intra-EU trade, the seasonality of extra-EU
imports - peaking in December - is far clearer. The highest monthly import volume of 12,2 tonnes was
recorded in December 2019.
Table 5: Monthly extra-EU import volume (tonnes) and weighted average price* (EUR/kg)
2014 2015 2016 2017 2018 2019 2020
Month Volume Price Volume Price Volume Price Volume Price Volume Price Volume Price Volume Price
1 2,1 413 0,4 454 1,9 303 1,9 421 2,2 249 4,5 297 4,6 239
2 1,5 531 0,4 376 1,0 290 3,4 234 1,5 224 5,4 256 2,5 248
3 1,1 423 0,4 416 0,6 454 1,4 303 1,8 271 2,9 240 2,7 243
4 0,9 385 0,5 429 0,9 420 0,6 334 1,6 249 2,3 264 0,2 229
5 1,3 376 0,6 401 0,9 339 0,8 335 1,5 251 1,6 236 0,4 221
6 0,7 438 0,6 395 0,9 408 2,2 261 2,5 299 3,1 255 2,1 219
7 1,3 351 0,5 477 2,3 341 1,1 291 1,6 262 2,4 286 2,8 235
8 0,9 355 0,8 371 0,8 317 0,8 355 2,1 243 3,4 253 2,1 245
9 1,4 392 1,4 349 1,3 353 3,1 256 1,9 309 3,4 302 3,3 238
10 2,7 422 2,5 369 3,2 357 3,8 326 5,2 269 5,5 248 6,0 225
11 2,8 459 3,4 302 4,1 366 4,5 274 6,7 259 7,6 262 8,8 267
12 8,3 448 5,6 356 6,0 314 6,5 291 7,1 266 12,2 254 10,0 241
Total 25,0 430 17,2 360 23,9 344 30,1 293 35,8 264 54,5 262 45,7 243
*Nominal values
Source: EUMOFA/EUROSTAT
19EUMOFA - European Market Observatory for Fisheries and Aquaculture Products
The caviar market: production, trade, and consumption in and outside the EU
Comparing January 2014 with December 2020, the average price decreased by 43% from 413 EUR/kg
to 241 EUR/kg. The long-term downward linear trend corresponds to a compound monthly growth rate
of -0,84%, meaning that the average price has decreased by close to one percent each month over the
past seven years.
Figure 11: Monthly extra-EU import volume (tonnes) and weighted average price* (EUR/kg)
600 14
500 12
10
400
8
Tonnes
EUR/kg
300
6
200
4
100 2
0 0
jan
jan
jan
jan
jan
jan
jan
apr
apr
apr
apr
apr
okt
apr
apr
okt
okt
okt
okt
okt
okt
jul
jul
jul
jul
jul
jul
jul
2014 2015 2016 2017 2018 2019 2020
Volume (right axis) Weighted avg. price Linear ( Weighted avg. price)
*Nominal values
Source: EUMOFA/EUROSTAT
The price decrease was strongest between 2014 and 2018, when the yearly weighted average price fell
from 430 EUR/kg to 264 EUR/kg - a compound annual growth rate of -11%. From 2018 to 2020 the
compound annual growth rate was -4%, leading to the lowest price over the past seven years of 243
EUR/kg.
Figure 12: Yearly extra-EU import volume (tonnes) and weighted average price* (EUR/kg)
500 60
450
50
400
350
40
300
Tonnes
EUR/kg
250 30
200
20
150
100
10
50
0 0
2014 2015 2016 2017 2018 2019 2020
Volume (right axis) Weighted avg. price
*Nominal values
Source: EUMOFA/EUROSTAT
20EUMOFA - European Market Observatory for Fisheries and Aquaculture Products
The caviar market: production, trade, and consumption in and outside the EU
The main supplier of caviar to the EU market by far is China, with an increasing share of imports between
65% and 84% over the past five years. The highest volume was recorded in 2019, when the EU imported
43,2 tonnes of caviar from China. Other suppliers of caviar to the EU are Uruguay, Israel, and the USA.
In 2017, a producer in Madagascar harvested caviar for the first time, and in 2019, France started
importing it. In 2020, the French import of caviar from Madagascar amounted to 1,9 tonnes, making
Madagascar the second largest extra-EU supplier to the EU.
Figure 13: Extra-EU import by main suppliers (tonnes on the left-hand side and import
shares on the right-hand side)
50 100 %
45 90 %
40 80 %
35 70 %
% share of imports
30 60 %
Tonnes
25 50 %
20 40 %
15 30 %
10 20 %
5 10 %
0 0%
2014 2015 2016 2017 2018 2019 2020 2014 2015 2016 2017 2018 2019 2020
China Madagascar Uruguay Israel USA Others
Source: EUMOFA/EUROSTAT
The main importing MS are Germany and France, with a combined share of between 61% and 72% of
the imported volume over the past seven years. Their combined import volume has more than doubled,
from 15,2 tonnes in 2014 to 32,7 tonnes in 2020. Belgium is the third largest importing MS with 8,1
tonnes in 2020, further followed by Luxembourg (2 tonnes) and Spain (1,3 tonnes).
Figure 14: Extra-EU import by main importing MS (tonnes on the left-hand side and percent
of market shares on the right-hand side)
25 100 %
90 %
20 80 %
70 %
% share of imports
15 60 %
Tonnes
50 %
10 40 %
30 %
5 20 %
10 %
0 0%
2014 2015 2016 2017 2018 2019 2020 2014 2015 2016 2017 2018 2019 2020
Germany France Belgium Luxembourg Spain Others
Source: EUMOFA/EUROSTAT
21You can also read