How will Tight Oil Impact Global Oil Prices this Decade? - December 2012
←
→
Page content transcription
If your browser does not render page correctly, please read the page content below
How will Tight Oil Impact Global Oil
Prices this Decade?                                                            December 2012
© Kimmeridge 2012 - How will Tight Oil Impact Global Oil Prices this Decade?                   1
Can Tight Oil Do To the Oil
Price What Shale Gas Did to
the Gas Price?

One of the major concerns among oil industry                    become a major gas exporter, with several LNG
investors is the potential impact of the shale                  liquefaction plants already being permitted. We
revolution on global oil prices. After all, look                believe that exports of gas from the US could
at the impact of shale gas production on US                     help restore balance in the US natural gas market
gas prices (Figure 1), which have averaged less                 and help lift prices above the marginal cost in the
than $3/mcf so far in 2012, having reached                      medium term (in the near term falling production
highs of over $12/mcf in 2005 and 2008. The                     in high cost plays such as the Haynesville should
precipitous drop and subsequent stagnation of                   help restore gas prices above the marginal cost).
US gas prices have been a direct result of surging              However, one key difference to note in the US
US domestic gas production, driven by a rapid                   between the oil and gas markets is that oil exports
increase in production from shale gas plays due                 are not allowed under US law, while gas exports
to overcapitalization (see our report “Creeping to a            are allowed (albeit controlled by FERC such as the
Correction? Why the US Gas Market May be Poised                 historical export of LNG from Alaska to Japan).
to Recover”), fuelled by plays such as the Barnett,
                                                                Nevertheless, given the surge in US gas
Haynesville, Marcellus, Fayetteville and Eagle Ford.
                                                                production and more recent ramp up in US
US gas production has increased from 50-55 Bcf/d
                                                                oil production, resulting from rapidly rising
from 1997-2007, to over 65 Bcf/d currently.
                                                                production in the Bakken (now over 600 kbopd),
Not only will the US be self-sufficient in gas                  Eagle Ford (over 300 kbopd) and Permian Basin
production for many decades to come, if                         (over 1.6 Mbpd), there are real concerns over
investment continues in shale gas plays, but there              future US oil prices, as WTI is already heavily
is also the very real possibility that the US will              discounted versus Brent (Figures 2 & 3).

                       Figure 1: US natural gas price vs. US natural gas production (Source: EIA)

© Kimmeridge 2012 - How will Tight Oil Impact Global Oil Prices this Decade?                                          2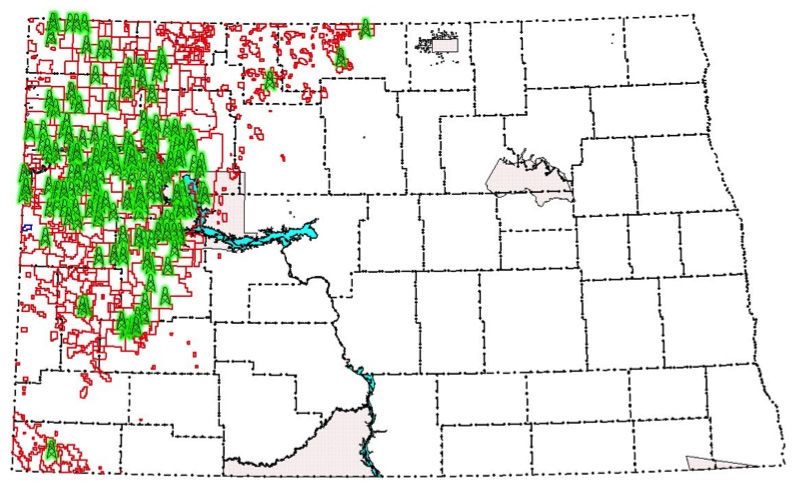
Indeed, as recently as the US Presidential                     resulting in a disconnect between inbound
election both candidates appeared to envisage                  volumes into the Cushing hub and Rockies region
a world where the US was self-sufficient in oil,               and outbound disposition of crude. Another
not requiring any OPEC volumes, with the result                important factor was the surge in light, sweet
that US foreign policy could change dramatically.              crude production from the Bakken and Permian
Although as ever, politicians may appear to inhabit            Basin tight oil plays, which further exacerbated the
a parallel universe, the sudden growth in US oil               excess supply situation and resulted in discounted
production courtesy of new completion technology               oil prices in these regions.
has to be studied and also projected on other oil
                                                               When you think about it most of the onshore
producing regions across the globe.
                                                               regions seeing new oil production from tight
Furthermore, investors and oil companies may                   reservoirs were themselves the main oil producing
be concerned that surging US oil production will               areas from decades ago, and with the decline in
result in a similar scenario as the US gas market,             their conventional production over the past 30
with prices dropping below the marginal cost and               years, the midstream and downstream industry
severely pressuring gas production economics.                  had to evolve, prior to the current about-turn.
Additionally, without the ability to export oil, there
                                                               In the near term we do expect to see continued
is currently no long term solution to rebalancing
                                                               discounts of WTI to Brent and other seaborne
the US oil market if oil production increases to the
                                                               crudes of similar quality. However, with new
point where the US becomes self-sufficient.
                                                               pipeline and rail capacity being built to cope
It is important to note that although rising oil               with growing supply from areas like the Bakken
production from US shale plays has contributed                 and Texas, we expect that in the medium term
to the discount of WTI relative to Brent, this has             bottlenecks in the transportation system will be
more to do with bottlenecks in the US crude                    resolved allowing WTI to trade closer to Brent.
transportation system that have resulted in excess             Therefore, while the current discount of WTI
supply in inland regions such as Cushing and little            to Brent is not driven by oversupply in the US,
to do with oversupply in the US as a whole. Indeed,            rather by regional bottlenecks, the key question
the discount of WTI initially began when crude                 is whether increasing tight oil production could
pipelines were reversed to cope with increased                 impact oil prices through the rest of this decade
volumes of Canadian crude, which also coincided                in the same way that surging US gas production
with refinery outages and lower utilization,                   has impacted US gas prices.

                          Figures 2 & 3: North Dakota and Texas oil production (Source: EIA)

© Kimmeridge 2012 - How will Tight Oil Impact Global Oil Prices this Decade?                                          3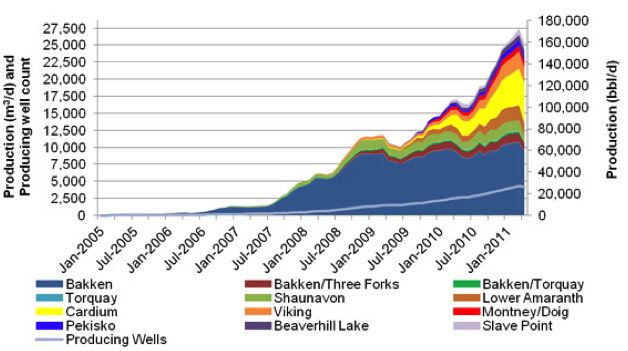
The Simple Answer

The simple answer to the “will it, won’t it” debate
on tight oil leading to oversupply, is no – we do
not believe oil prices will be impacted in the
same way as US gas prices. For now, tight only
is a US-only phenomenon and US production is
simply too small to influence global oil prices in
the way that US gas production can influence US
gas prices.
It is worth pointing out the fundamental
differences between oil and gas as commodities.
Specifically, gas is a regional commodity, with
prices driven by local supply and demand.
Because gases have much higher volume than
liquids, natural gas is predominantly transported                                Figure 4: Prices for global light sweet crude oils (Source: EIA)
through pipelines, since the cost of transporting
gas via tanker is much higher than oil (gas needs
to be super-cooled, liquefied and compressed for
export and then regasified on arrival).
In contrast oil is a global commodity, with prices
set in the global market, as cheap transportation
of crude oil can occur across the globe in VLCC’s.
This means that regional discrepancies in price
tend to be quickly arbitraged away, resulting in
convergent prices for crude oils of similar quality
e.g. Brent, Arab Light, Nigerian Light and WTI.
But before we progress further, let us interject
with a quick guide to crude types. Crude is
typically described using two measures – sweet
vs. sour (sulphur content) and light vs. Heavy (API
gravity). Sour crude has a higher percentage of
sulphur, making it harder to refine, thus lowering
its price. The light versus heavy distinction refers
to the chemical composition of the hydrocarbons,
as is measured by API Gravity (inverse relation
to Specific Gravity), where higher API numbers
indicate higher proportion of light hydrocarbons
constituting the crude oil, and thus lower density
(or lower specific gravity). Oil contains a mixture                            Figure 5: Louisiana Light Sweet crude price vs. Brent (Source: EIA)
of lighter, more valuable hydrocarbon compounds,
such as gasoline and diesel, as well as heavier
compounds, like asphalt. Thus the best (and
therefore most expensive) type of oil would be a
light sweet crude, while the least valuable would
be a heavy sour crude.

© Kimmeridge 2012 - How will Tight Oil Impact Global Oil Prices this Decade?                                                                        4
Over the past 15 years, the world (and especially
US refining companies) have been preparing
for a world dominated by heavy (1%) crude
from countries such as Canada, Venezuela and
Saudi Arabia. However, the “tight oil” found in
unconventional reservoirs is typically higher
quality light (>35 deg API) and sweet (
The above makes it clear that even modest                    Consequently, with the US being the only major
changes in US gas supply can have material                   producer of tight oil currently, and potentially
impact on US gas prices, while increases in                  only Canada able to replicate this volume
US oil supply will have a much more marginal                 growth anytime soon, we do not anticipate a
impact on global oil prices. Indeed, in the last             major impact on global oil prices in the near
3 years US oil supply (crude and other liquids)              to medium term, despite the frenzy in shale
has increased by more than 1 Mbbl/d, but this is             appraisal activity globally.
only 1% of the global market, so this has done
                                                             Key point 1: Tight oil production has a long
little to prevent oil prices increasing consistently
                                                             way to go in the near to medium term, before it
over this period. One major controlling factor in
                                                             impacts global crude prices. However, regional oil
the oil market is OPEC supply, which is managed
                                                             prices such as WTI, will continue to be affected by
according to a quota system and is designed
                                                             transportation bottlenecks due to the renaissance
to control prices at levels that maximize OPEC
                                                             of old production centres and insufficient existing
member revenues without hampering global
                                                             takeaway capacity.
economic growth. Therefore, OPEC acts as a
release valve in the global oil market. Such a
release valve is absent from the US gas market
(until a time when sufficient LNG export capacity
exists) – US production is eventually shut-in
when prices are low enough to make some gas
supply uneconomic, as is the case currently
(albeit slowly).

© Kimmeridge 2012 - How will Tight Oil Impact Global Oil Prices this Decade?                                       6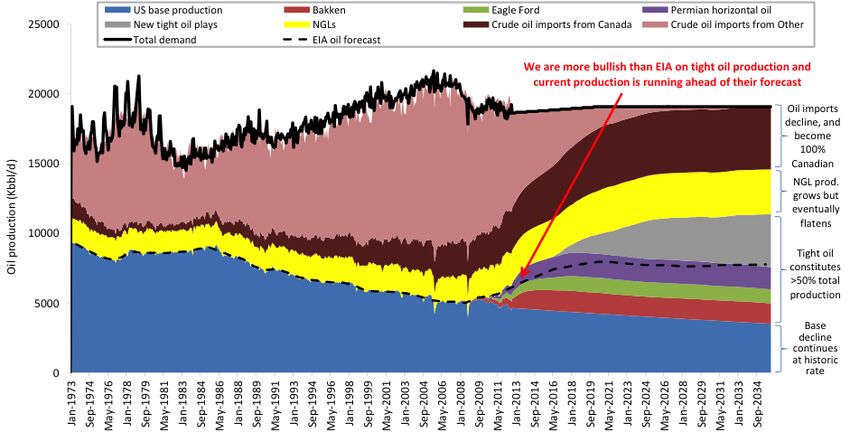
Lessons from Shale Gas – Will Oil
Follow the Same Path?

When analysing and forecasting commodity prices,               of gas storage is increasingly believed to be
it is often tempting to focus on macroeconomic                 within the kerogen network. Despite the kerogen
trends and analogous scenarios for similar                     having only nano-porosity, the smaller size of gas
commodities. While these are useful, we also                   molecules enables gas to be stored in these tiny
believe that accurate forecasting requires a                   pore spaces. The process of hydraulic fracturing
fundamental understanding of what drives                       and proppant embedment, results in an order of
economics for a specific commodity, which can                  magnitude increase in permeability of the shale
mean going all the way down to the molecular level.            reservoir, which allows the flow of gas into the
                                                               wellbore to occur.
Oil molecules are typically 10-20 times the size of
a gas molecule, so extracting oil from tight rocks             Therefore, we believe that the set of potential
such as shale can be many times harder than                    economic shale oil plays is more restricted than
extracting gas. Consequently, for a shale oil play to          gas plays (at least with current technology),
work with the same technology that works for shale             due to the inherent difficulties in extracting
gas, the oil needs to be located in more porous and            a larger molecule from tiny pore spaces, and
permeable associated lithofacies (i.e. rocks that              thus the need to find more particular geological
are adjacent to or interbedded in the shale). For              circumstances in a tight oil play for economic
today’s technology, the dolomitic Middle Bakken or             production to occur.
carbonate-rich Eagle Ford, are plays where tight oil
                                                               Nevertheless, the industry has come a long
has worked on a commercial scale.
                                                               way since pioneering horizontal gas wells with
In comparison, most shale gas production does                  hydraulic fracturing in the Barnett shale since
come directly from areally extensive black,                    2001. The learning curve in the Barnett with this
organic-rich shales, where the primary mode                    new technology was slow, with the Barnett well

                          Figure 8: Well count in the Barnett shale gas play (Source: Texas RRC)

© Kimmeridge 2012 - How will Tight Oil Impact Global Oil Prices this Decade?                                        7
count only rising significantly after 7/8 years of           in production, due to the targeting of tight oil
testing and fine-tuning of the optimal completion            plays which are typically a combination of a
method (Figure 8).                                           shale and an adjacent tight carbonate interval
                                                             that is oil saturated.
In contrast, using modern completion methods
enabled material ramp-up in production in                    The technology that has enabled targeting of
the Bakken to occur much more rapidly, with                  source rock intervals, which themselves present
production rising from 2,000 bpd to over 100,000             a huge potential resource, has also enabled
bpd in less than 4 years. Further evidence of                companies to revisit marginal conventional
industry’s move up the learning curve has been               plays and to boost recovery rates from existing
the Eagle Ford, which ramped up production from              fields. Therefore, while we believe that US liquids
around 2,000 boepd to over 100,000 boepd in                  (crude, condensate and NGLs) production has
only 20 months (Figure 9). So although the set of            plenty more scope to grow from its current level
potential tight oil plays may be more restricted             of around 8 Mbpd and is very likely to exceed
than shale gas, the rapid progression of US                  its previous peak of over 10 Mbpd in the 1970s,
technology should continue to expand the set of              we do not believe that the US will be flooded by
potential plays and also enable faster ramp-up to            oil from shale plays, largely because oil is much
commercial production.                                       harder to produce from tight rocks than gas.
Indeed, throughout the US, previously marginal               Key point 2: Although lessons from shale gas can
historic plays in e.g. the Mississippi Lime, have            and have been applied to tight oil, it is important
sprung back to life with the application of                  to remember that oil is not gas. It is a big molecule
long laterals and hydraulic fracturing. In many              (C7+) versus a single carbon atom for dry gas, and
instances, oil production was limited by porosity            therefore the criteria necessary for a successful
and permeability cut-offs in tight dolomites                 economic tight oil play are narrower than for gas.
(carbonate rocks similar to limestone, but with              So although new technology has allowed a faster
higher porosity), despite the fact that the rock             ramp-up in new tight oil plays like the Eagle Ford,
may have been oil saturated. Thus, the ability to            the set of tight oil plays is more restricted than
improve reservoir properties has enabled areas               shale gas plays.
like the Permian Basin to undergo a renaissance

     Figure 9: Comparison of production ramp-up in Bakken and Eagle Ford (Source: Texas RRC & North Dakota DMR)

© Kimmeridge 2012 - How will Tight Oil Impact Global Oil Prices this Decade?                                         8
The Impact of Tight Oil on US
Production … Returning to the Halcyon
Days of Old

Currently, three plays/areas are already                     tight oil plays achieve commercial production.
contributing material tight oil volumes in the US.           Additionally, we assume that US base production
These are the Bakken, Eagle Ford and Permian                 from conventional fields continues to decline at
Basin. Plays like the Niobrara, Woodford and Utica           the historic rate of around 0.1% per month.
are also contributing, but currently to a lesser
                                                             Given the lack of type curves for new tight oil
extent. New tight oil plays will be discovered, and
                                                             plays, we have used the following methodology
some currently marginal ones may ramp-up if a
                                                             to forecast volumes. Depending on the type of
commercial completion method is figured-out.
                                                             play, we use either the Bakken (oil play) or Eagle
We forecast that US liquids production (crude,               Ford (combo play) as an analogue. Using our
condensate and NGLs) could surpass 10 Mbbl/d                 mass balance-derived unconventional resource
next year, and exceed the previous peak of >11               estimates, we apply a Probability of Exploration
Mbbl/d (in 1973) by 2016 (see Figure 10). Our                Success and Probability of Commercial Success,
forecast has US liquids production getting to >13            to risk the potential resource size. We then apply
Mbbl/d by 2021. This is driven by our expectation            recovery rates (according to play type) to derive
that the Bakken ramps up to 1.5 Mbbl/d, the Eagle            estimates for recoverable oil reserves.
Ford reaches >1 Mbbl/d of liquids, the Permian
Basin horizontal plays reach >1.7 Mbbl/d, and new

         Figure 10: Forecast US liquids production (Source: EIA, Kimmeridge Energy, Texas RRC, North Dakota DMR)

© Kimmeridge 2012 - How will Tight Oil Impact Global Oil Prices this Decade?                                       9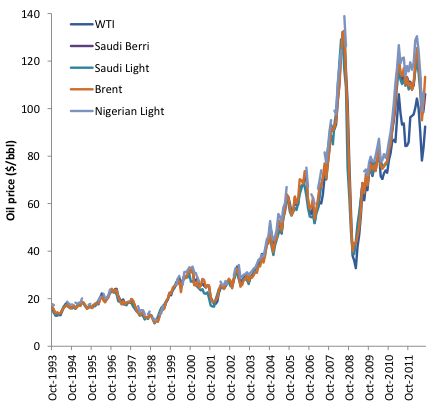
The production profile for a given new play is
then simply the recoverable reserves of that
play, divided by the recoverable reserves of the
analogue play (Bakken or Eagle Ford), multiplied
by the monthly production rate of the analogue
play. This essentially scales new tight oil plays
versus proven analogues, to derive estimated
production profiles that incorporate both
potential resource size and the risks associated
with achieving commercial production.
Overall, our forecast is more bullish than the EIA
(US Energy Information Administration), but in
line with other industry estimates (see Figure 11).
Furthermore, the phenomenal increase in the US
oil rig count (see Figure 12) gives us confidence
that the surge in US oil production will be
sustained going forward, as operators continue to
shift their focus from gas to oil/liquids plays due
to poor gas economics and technology continues
to improve.
                                                                               Figure 11: Comparison of US oil production estimates
Such bullish forecasts for US oil production are
                                                                                  (Source: EIA, Kimmeridge Energy, Baker Hughes)
now credible, due to the booming production in
plays such as the Eagle Ford, Bakken and Permian
Basin. Furthermore, our forecasts assume only a
modest contribution from plays such as the Utica,
which we estimate could contain massive in-place
resources >600 Bnboe – the uncertainty with the
Utica is how much is economically recoverable
and what percentage of this is liquids and more
specifically, how much of this liquids is equivalent
to crude and not NGLs.
This leads us onto a broader issue, which is the
substitutability of NGLs and crude. While natural
gas condensate can be considered a substitute
for crude oil, since it is similar in composition
to gasoline (it is often called casinghead or
natural gasoline, due to the fact that it usually
has a C5-C9 composition, and has high content
of C8 octane which is a primary constituent of
gasoline), NGL cannot be considered a direct
substitute, because it is primarily composed of
lighter hydrocarbons such as ethane, propane
and butane. These lighter hydrocarbons are used
as petrochemical feedstocks to produce plastics,
rather than refinery feedstocks to produce                                           Figure 12: US oil production vs. rig count
                                                                                  (Source: EIA, Kimmeridge Energy, Baker Hughes)
fuels. So, while surging US gas production from
shales has greatly boosted NGL production, and
thus overall US liquids production, this has not
resulted in a one-for-one reduction in crude oil
imports for the US.

© Kimmeridge 2012 - How will Tight Oil Impact Global Oil Prices this Decade?                                                          10
Therefore, assuming a significant ramp-up in existing unconventional plays like the Bakken and Eagle Ford; that new material tight oil plays are discovered and commercialized; Canadian import volumes continue to increase; and NGL production grows further, we do not expect that the US to become completely self-sufficient, although it should become independent from “foreign oil” (ex-Canada). Such strong growth in domestic production may continue to drive discounted US crude prices versus Brent, especially in areas with transportation bottlenecks such as Cushing. However, this discount does not result from oversupply in the US as a whole, rather from temporary regional oversupply. Ultimately, since oil is a global commodity, we need to model global tight oil production to understand the likely impact of the shale revolution on oil prices. In the next section we look at the main technical bottlenecks that will slow the pace of the tight oil industry outside the US; which countries are most likely to contribute meaningful tight oil volumes; and ultimately forecast global unconventional oil production and its likely impact on the oil price. Although we are sure that tight oil will become a global phenomenon, it will take time, due to the nature of the industry outside the US. © Kimmeridge 2012 - How will Tight Oil Impact Global Oil Prices this Decade? 11
Bottleneck 1: Knowledge is King
Looking at drilling density in countries around seen a decent amount of drilling, but not on
the globe, it is clear that the US and Canada have the same scale as North America. Additionally,
significantly more wells drilled over time than much of the data in the US is publically available
most other countries. Indeed, the number of wells and often free, which allows easier entry for
in a mature US basin is often in the hundreds of new players, and thus greater competition for
thousands, versus e.g. the Lower Saxony Basin in resources and more rapid development.
Germany, which although one of the most prolific
One interesting example of this lack of
onshore basins in Europe has comparatively few
knowledge is the Permian shales of the Junggar
wells drilled at around 18,000.
basin in Northwestern China. There has been
The most useful data for learning about the much speculation about the potential tight oil
viability of unconventional projects are results production from Chinese shale deposits, but the
and scientific measurements from wells that have lack of well penetrations in some basins means
penetrated the potential tight reservoir in the that resource estimates could be off by orders of
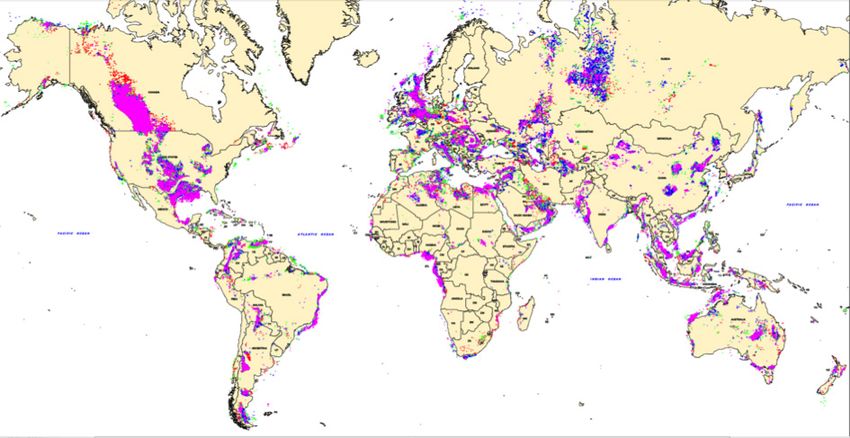
area of interest. Based on wildcat drilling activity magnitude due to scarce existing data. Permian
in the last 4-5 decades (See Figure 13), it is clear shales in the Junggar Basin are quite possibly the
that the US and Canada have a huge advantage richest known shales in the world, with a much
in terms of availability of well data versus other higher Source Potential Index (SPI) than almost
countries. Basins in Russia and China have also any other known source rocks on the planet,
Figure 13: Wildcat exploration wells drilled 1965-2005 (note the very high density in the US & Canada)
(Source: IHS)
© Kimmeridge 2012 - How will Tight Oil Impact Global Oil Prices this Decade? 12including established US shale plays (See Figure migration, mineralogy, etc. This obviously makes
14). SPI measures the generative potential of accurate assessment of resource size very difficult
a source rock per m2, based on S1 (free liquid and thus by definition building a reasonable
hydrocarbons in place), S2 (remaining generative production profile is almost impossible. Thus far
potential), and thickness. our knowledge of this potentially world class
source rock comes largely from one outcrop where
However, the Permian Junggar shales are
the shale is extremely thick (>2000m with 800m
primarily lacustrine (type I kerogen, with some
net shale), early-mature for oil and organic-rich
terrestrial type III input), and all of the proven
(average TOC ~4%).
shale plays in the US so far have been type II
or mixed type II/III, which raises a big question This scarcity of data is not confined to the
mark over whether the Permian Junggar shales Junggar basin in China. Indeed looking outside
can work as a resource play. Since lacustrine of the US and Canada, where there is typically
source rocks expel much of the oil they generate, much lower well density, companies face a much
this typically leaves a much lower proportion longer learning curve, as existing knowledge of
of hydrocarbons in place, within or adjacent domestic shales and basins lags significantly
to the source rock interval (Permian Junggar behind North America.
shales do contain some type III kerogen, which is
Furthermore, once sufficient knowledge of
highly petroleum retentive, so may limit overall
potential resource size is gained, through
expulsion efficiency).
analysis of historic wells and modern science
Furthermore, looking beyond the immense wells plus seismic, the next major challenge is
richness of this Permian lacustrine shale, there is to understand optimal completion techniques
very little knowledge of areal extent (see Figure for a play. Again, there is a huge knowledge gap
15), lateral homogeneity, maturity, expulsion, between the US and every other country, except
Figure 14: Source potential index for global source rocks
(Source: USGS, AAPG, Kimmeridge Energy, numerous academic papers and industry reports)
© Kimmeridge 2012 - How will Tight Oil Impact Global Oil Prices this Decade? 13arguably Canada, due to cross border knowledge Poland, are now targeting the deeper Cambrian
exchange. Some may argue that “where there’s shales, as these are believed to have lower clay
demand, supply will materialize”, which certainly content than the previously targeted Silurian-
seemed to be the case in Poland. Ordovician shales, so may respond better to
hydraulic fracturing. Notably, we conducted
Initially no modern rigs or fraccing crews were
initial geologic screening and due diligence on
available in Poland but once sufficient critical
Poland, and visited several well sites in 2011, but
mass was achieved with E&Ps on the ground
we remained very uncomfortable about the lack
ready to test the shale gas concept, modern
of significant historic conventional production,
rigs and frac crews materialized, courtesy of
which greatly increases the geological risk of the
companies such as Schlumberger. Companies
play, as there is no certainty that the source rock
ranging from small E&Ps to supermajors
has generated large amounts of hydrocarbons.
subsequently drilled numerous test wells
Indeed, we believe that targeting mature
(horizontals and hydraulically fractured), but
petroleum provinces with significant historic
none of these achieved commercial flow rates.
production and reserves is the best place to
Failure was likely down to a combination of
look for unconventional deposits and certainly
insufficient historic knowledge of the geology and
reduces overall investment risk (see our report
inexperience with completion design.
“Brother From the Same Mother? The Relationships
While ExxonMobil has exited the play, smaller Between Unconventional and Conventional Oil and
players that have essentially “bet the farm” on Gas Resources”, Sep 2012).
Figure 15: Approximate areal extent and thickness of Permian shales in the Junggar basin
(Source: Carroll et al. 1992)
© Kimmeridge 2012 - How will Tight Oil Impact Global Oil Prices this Decade? 14Bottleneck 2: Quantity and Quality of
Oil Services
Another reason to expect a slower pace of heterogeneity of different shale plays, and thus the
unconventional production outside of the US very different optimal completion strategy for each
and Canada is the availability of rigs. According play, and consequently different service requirements
to Baker Hughes, there are over 2100 land rigs for each. And while Russia and China are believed
operating in the US and Canada, but only 1100 to have significant onshore rig fleets, neither is
land rigs operating in the rest of the world, comparable in quality to the US and Canada. For
excluding Russia and China. This means that E&Ps example, many of the rigs in Russia are Soviet era
in the US and Canada have a huge advantage and not suitable for drilling modern horizontal
due to the constant availability of rigs not only in wells. Additionally, there is limited availability of
the exploration phase, but more importantly in frac crews outside of the US and Canada. Added to
the development phase, where big plays like the this is a complete lack of experience in developing
Bakken and Eagle Ford require something like 200 unconventional resource plays.
rigs continuously operating in full development
Key point 3: Outside the US and Canada, the
mode. Indeed, according to the North Dakota
availability of historical well and geological data is
Mineral Resources Department, there are
significantly reduced and will slow the pace of new
currently 188 rigs active in North Dakota, 184 of
unconventional exploration. Coupled with this is the
which appear to be targeting the Bakken/Three
time delay to export oil field services and knowledge
Forks play (Figure 16).
outside the US and Canada, which means that the
Furthermore, the quality of the service industry pace of production growth of tight oil globally will
is crucial, as we are increasingly discovering the not be on a par with North America.
Figure 16: Current active rigs in North Dakota (North Dakota DMR)
© Kimmeridge 2012 - How will Tight Oil Impact Global Oil Prices this Decade? 15Ranking Countries with Meaningful
Tight Oil Production Potential This
Decade
We believe the five most prospective global 18), although it has no plays in full-scale
regions for tight oil production growth this decade development mode as per the Bakken and Eagle
outside of the US are Canada, China, Russia, Ford in the US.
Argentina and Western Europe, and we rank them
After the US and Canada, we believe the next
as follows (Figure 17):
country to produce material volumes of shale gas
Notably, these are pretty much the same places or oil could be Argentina, since around 100 wells
where the oil industry began for conventional have already been drilled into unconventional
exploration and production, in large part due to reservoirs in the Neuquen Basin in the last 18
the high quality of source rocks. There is of course months, with YPF (responsible for around 80%
significant geological potential in other regions of wells drilled) reporting “spectacular” results
such as the Middle East and North Africa, but we on 2 wells with multi-stage hydraulic fracturing.
believe that development of these resources will One of the wells is believed to have produced
significantly lag the above countries. “impressive” amounts of oil after a 10-stage frac,
but no production data has been released.
The US is already a major producer of shale
gas and oil, so is clearly ranked first. Canada Despite elevated expropriation risk following
is fast following suit and is already producing confiscation of YPF’s assets from Repsol, the
material shale gas and oil volumes (see Exhibit Neuquen Basin’s exceptional geology, similarities
Figure 17: Ranking of most prospective tight oil producing countries (Kimmeridge Energy)
© Kimmeridge 2012 - How will Tight Oil Impact Global Oil Prices this Decade? 16with the Eagle Ford and early successful Next could be Russia, due its enormous potential
completion results have attracted numerous US resource size, historic production from shales
oil companies into the play. (Bazhenov and Domanik), the new fiscal regime for
unconventionals, political support and deals by
After this, we believe that China could be next
the Majors with Russian oil companies to appraise
to produce material shale gas and oil volumes,
Russian shale plays (e.g. ExxonMobil and Rosneft).
primarily due to its rapidly growing energy
However, a major factor that could slow production
demand and desperate need to move away from
ramp-up from tight oil, is simply Russia’s large
coal, which continues to provide around 60-
remaining conventional reserves and production,
70% of its total energy needs. This has resulted
and the fact that it remains a large exporter.
in major political support for shale exploration;
JVs between Sinopec, Shell and ExxonMobil; and Finally, in Europe with recent moves by Germany
the US-China shale gas initiative announced by and the UK to allow hydraulic fracturing;
President Obama in 2009. Furthermore, Chinese companies already testing shale plays; increased
state oil companies have drilled many thousands political support; declining conventional
of wells in the past half century, offering production; a move away from nuclear; and the
significant amounts of data on potential shale desire to reduce dependence on Russian gas – all
plays (albeit less than the US or Canada). of these suggest that countries such as Germany
Research to date has focused on the lacustrine and the UK could see shale gas and oil production
black shales of eastern China, and the Ordos in the foreseeable future.
Basin has already seen economic production of
The real question is how significant volumes of
tight oil in the Changqing field. And according to
tight oil could be in a global context and could
PetroChina’s Research Institute, China has an
they affect the oil price, which we attempt to
estimated 300 billion barrels of recoverable tight
answer in the rest of the report.
oil reserves, with average production costs of
$50/bbl.
Figure 18: Oil production from Canadian tight oil plays (Canadian National Energy Board)
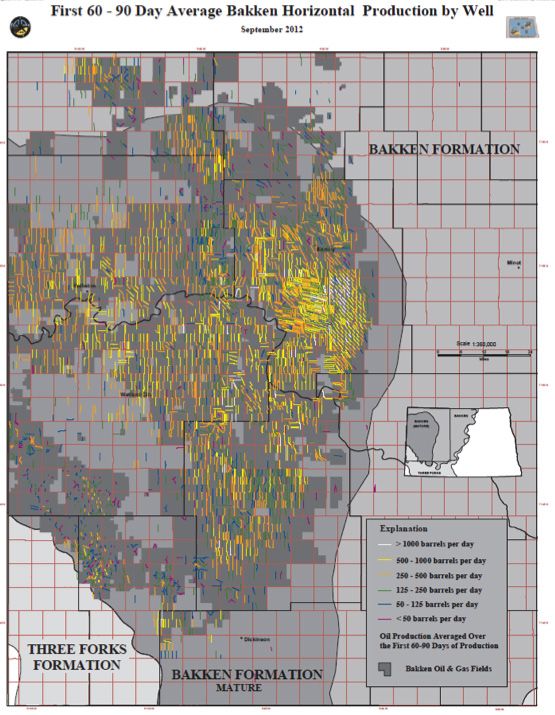
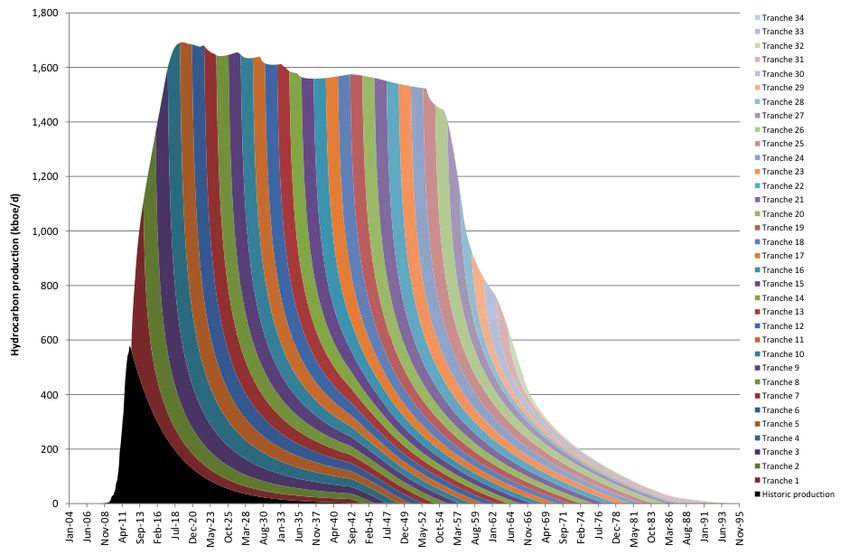
© Kimmeridge 2012 - How will Tight Oil Impact Global Oil Prices this Decade? 17The Bakken and Eagle Ford As Analogues For Predicting Global Tight Oil Production Constructing full field production profiles for the Bakken and Eagle Ford shale plays is admittedly a journey into the unknown. These are the first 2 development-scale tight oil plays on the planet, with less than 10 years of modern production history. Indeed, the USGS in 2008 estimated the Bakken’s technically recoverable reserves of around 3.6 Billion barrels of oil, which given cumulative production since 2005 of 400 Mbbls and continued rapid month-on-month growth in production, looks extremely conservative. Since then, the USGS has been tasked with improving their estimate, based on the incremental data gained from 4 extra years of production. In general the USGS estimates recoverable reserves for a continuous hydrocarbon accumulation by applying a type curve EUR and multiplying this Figure 19: Oil, condensate and gas production from the Eagle Ford by the number of potential drill locations, given (Texas RRC) the areal extent of the play. This approach seems reasonable in an established play like the Bakken, but less useful for new plays where limited wells have been drilled. Even for plays like the Eagle Ford, operators are still fine-tuning their completions, and defining the sweet spots of the play. Indeed, initially the Eagle Ford was a gas play with some liquids (see Figure 19). It is now primarily an oil play (due to current gas economics) with significant condensate and gas production. Our own approach to estimating recoverable reserves and production profiles for tight oil plays is to first assess the oil and gas in place, based on a geochemical mass-balance approach, and then apply a range of recovery rates according to the play type and characteristics, based on existing rates in established plays. Next we estimate recoverable reserves using a type curve (based on an average of modern development wells) multiplied by the number of potential drilling locations (based on our assessment of the areal extent of the play). If the latter estimate falls within our range of estimates from our mass- balance approach, we can then model a full field production profile, based on 2 different but consistent methodologies. For the Bakken, our mass-balance assessment indicates in place resources of around 276 Bnboe (primarily oil). Applying recovery rates of © Kimmeridge 2012 - How will Tight Oil Impact Global Oil Prices this Decade? 18
5-10% gets us a range of recoverable reserves
of 13.8-27.6 Bnboe, with a mean of 20.7 Bnboe.
This is around 5 times the amount of recoverable
reserves estimated by the USGS in 2008.
Next we used a type curve with the following
assumptions:
•   30-day IP of 500 boe/d
•   Well spacing of 320 acres
•   Decline exponent of 1.15
•   Nominal decline rate of 0.1
•   Well life of 30 years
•   This results in an EUR of 503 Kboe
To date well results in the play have been highly
variable, with the highest 24-hour IP at over
7,000 boe/d. However, the average in the play for
30-day IPs is much lower, and the following map
from the North Dakota DMR shows that the typical
range for 60-90 day IPs in the play is 250-1000
boe/d (Figure 20).
Therefore, we believe that an assumed IP of 500
boe/d and EUR of 500 kboe is reasonable, based
on existing data. Using our estimated play extent
(based on technical screening criteria) of 22,000
square miles, a prospective area of 95%, average
EUR of 503 Kboe and 320-acre spacing (roughly
42,000 wells for full field development), results
in an estimated EUR for the entire Bakken play of                              Figure 20: 60-90 day IPs in the Bakken (North Dakota DMR)
21 Bnboe. This is well within the range of
estimates from our mass-balance derived
recoverable reserves estimate, and very close to
the mean (see Figure 21). A full field production
profile can be constructed based on the
preceding estimates and assuming sufficient
active rigs to drill over 100 new wells per month
on average over the next 20 years (Figure 22).
This seems reasonable given the current active rig
count of over 180, and the fact that Bakken wells
now take as little as 25 days to drill.
Similarly for the Eagle Ford our mass-balance
assessment indicates in place resources of
around 147 Bnboe (mix of oil, condensate and
gas). Applying recovery rates of 10-30% (higher
than the Bakken due to higher gas content) gets
us a range of recoverable reserves of 14.7-44
Bnboe, with a mean of 29.3 Bnboe. This is more
than 4 times the amount of recoverable reserves
estimated by the EIA in July 2011.

© Kimmeridge 2012 - How will Tight Oil Impact Global Oil Prices this Decade?                                                               19
Figure 21: Estimated EUR for the Bakken based on mass balance approach and type curve analysis
                                               (Source: Kimmeridge Energy)

                              Figure 22: Modelled full field production profile for the Bakken
                                   (Source: North Dakota DMR and Kimmeridge Energy)

© Kimmeridge 2012 - How will Tight Oil Impact Global Oil Prices this Decade?                                  20
Next we used a type curve based on data from
an SPE report that analysed of over 1000 wells
drilled in the play, with the following assumptions:
• 30-day IP of 775 boe/d (average from
SPE dataset)
• Well spacing of 107 acres (6 per section)
• Decline exponent of 1.3
• Nominal decline rate of 0.35
• Well life of 30 years
• This results in an EUR of 277 Kboe (average
from SPE dataset)
In terms of pure recovery and flow rates, well
results to date have been highest in the dry gas
zone. And we can see a positive correlation
between the API gravity of liquids produced and
both IP and EUR (see Figures 23 & 24).
This is to be expected, since oil molecules
are 20-30 times larger than gas molecules so
correspondingly much harder to produce from
tight reservoirs. Additionally, gas is generated
at greater depths than oil, where pressures are
higher, which helps flow rates and EUR. However,
due to low gas and condensate prices, operators
have focused where wells have been most
economic, which is on the edge of the oil and
condensate zones where there is sufficient gas
in the system to help with recovery rates, but the
main product is oil.
Using our estimated play extent (based on technical
screening criteria) of over 18,000 square miles, a
prospective area of 95%, average EUR of 277 Kboe
and 107-acre spacing (over 100,000 wells for full
field development), results in an estimated EUR for
the entire Eagle Ford play of 29 Bnboe. This is also
well within the range of estimates from our mass-
balance derived recoverable reserves estimate, and
very close to the mean.
We expect hydrocarbon recovery from the Eagle
Ford to be broadly equal between liquids (oil and
condensate) and gas, over the lifetime of the play
(although it has recently been skewed towards
liquids). A full field production profile can be
Figures 23 & 24: IP and EUR vs. liquids API gravity in the
constructed based on the preceding assumptions Eagle Ford (Swindell 2012 and Kimmeridge Energy)
and estimates, and assuming sufficient active rigs
to drill between 150-250 new wells per month
on average over the next 40 years (see Figure 25).
This seems reasonable given that the rig count as
of mid-November 2012 was already at 270 (213
oil and 57 gas), the average level through 2012.
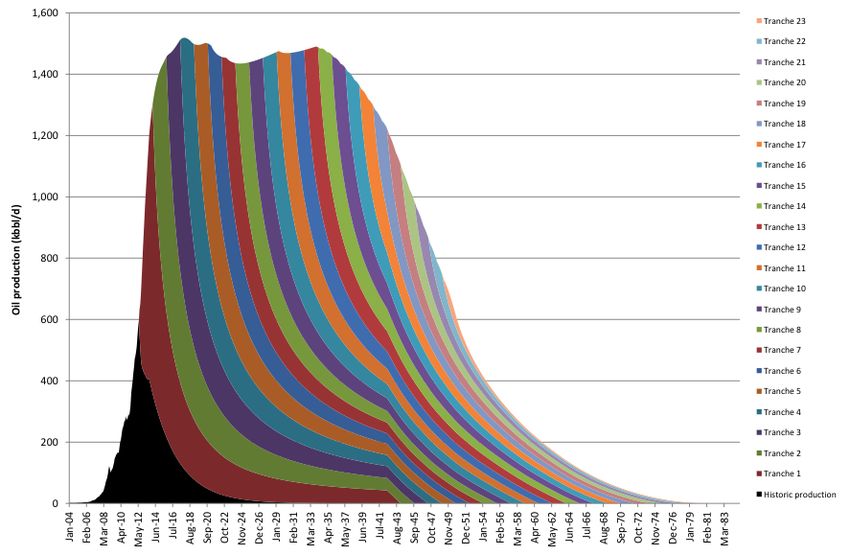
© Kimmeridge 2012 - How will Tight Oil Impact Global Oil Prices this Decade? 21Figure 25: Modelled full field production profile for the Eagle Ford (Texas RRC and Kimmeridge Energy) © Kimmeridge 2012 - How will Tight Oil Impact Global Oil Prices this Decade? 22
Forecasting Global Tight Oil
Production

We have assumed no meaningful unconventional                 Canada is highly questionable. However, we
volumes from OPEC countries in the near-to-                  have used our full-field production profiles for
medium term, due primarily to large remaining                the Bakken and Eagle Ford as basic analogues to
cheap-to-extract conventional reserves. Amongst              forecast country level volumes, since these are
Non-OPEC countries we have focused on countries              the only proven large development-scale tight oil
such as Russia, China, Argentina and Canada,                 plays on the planet.
which have potentially massive in-place tight oil
                                                             The key is really to determine the timing of
resources, and seem most likely to contribute
                                                             material tight oil volumes, from countries with
meaningful volumes within the foreseeable future,
                                                             sizeable in-place resources (assessed through
due to a combination of political will, improved
                                                             our mass-balance approach) and the right
fiscal regimes for unconventional resources, rapidly
                                                             circumstances above-ground for development
declining conventional production and growing per
                                                             in the near-to-medium term. We estimate that
capita energy consumption.
                                                             by 2020, around 2 Mbbl/d of tight oil could be
Given the lack of extensive drilling and therefore           produced outside of the US, and over 4.5 Mbbl/d
no credible type curves available, the validity              by 2029 (see Figure 26). Looking at the next 8
of detailed bottom-up modelling of production                years, based on our global supply/demand balance
profiles for individual plays outside the US or              for oil, and incorporating tight oil volumes for the

                            Figure 26: Forecast for non-US tight oil production volumes (Kimmeridge Energy)

© Kimmeridge 2012 - How will Tight Oil Impact Global Oil Prices this Decade?                                        23
US and 5 other countries, we could expect to see an
increase in OPEC spare capacity as a percentage of
global oil demand, which may give some downward
pressure to oil prices (see Figure 27). However,
in a historical context, OPEC spare capacity as
a percentage of global oil demand will remain
moderate at around 6% from 2018-20. And at the
same time, the marginal cost (long term driver of oil
prices) will continue to increase in a secular upward
trend, as per well EUR’s decline and the industry
requires more service intensity to arrest decline
rates at mature fields and exploit technology-
intensive tight oil resource plays. Furthermore, we
have used the EIA’s global oil demand forecasts,
which may be conservative, as they assume
demand growth of around 1.1% on average per
annum until the end of this decade. If demand
surprises to the upside, OPEC spare capacity would
diminish and the global oil market could tighten,
putting upward pressure on oil prices.
Key point 4: Even if we model in substantial tight
oil volumes from the US and countries like Canada
and Argentina, and use an optimistic timeframe for
development based on experience in successful US
plays, the impact on global supply should be limited
and thus suggests only a minor potential impact on
global oil prices within this decade.
Figure 27: OPEC spare capacity as a percentage of global oil demand vs. oil price (IEA, EIA and Kimmeridge Energy)
© Kimmeridge 2012 - How will Tight Oil Impact Global Oil Prices this Decade? 24Conclusion
In summary, the four key points from our From what we can see today, unconventional
analysis are: tight oil production will have at most a modest
impact on global oil prices this decade, especially
Key point 1: Tight oil production has a long
if oil demand surprises to the upside. Potentially
way to go in the near to medium term, before it
OPEC spare capacity could rise, but any resulting
impacts global crude prices. However, regional oil
substantial drop in oil prices would, as can now
prices such as WTI, will continue to be affected by
be seen with natural gas activity in the US, result
transportation bottlenecks due to the renaissance
in a collapse in the capital investment in the
of old production centres and insufficient existing
industry, which in turn would also lower new
takeaway capacity.
supply growth from tight oil. The much greater
Key point 2: Although lessons from shale gas can capital intensity of exploring and developing
and have been applied to tight oil, it is important tight oil means that it is not going to replace
to remember that oil is not gas. It is a big molecule conventional oil at the front of the cost curve.
(C7+) versus a single carbon atom for dry gas, and However, it will compete with other higher cost
therefore the criteria necessary for a successful oil categories, such as deepwater, Arctic and
economic tight oil play are narrower than for gas. new oil sands developments, and indeed many
So although new technology has allowed a faster of the modest sized conventional discoveries
ramp-up in new tight oil plays like the Eagle Ford, made in the past decade. There, tight oil will
the set of tight oil plays is more restricted than occupy an ever increasing position on the global
shale gas plays. oil production scene as long as demand for oil
remains robust – indeed the pricing environment
Key point 3: Outside the US and Canada, the
reflects that over the past five years. In this
availability of historical well and geological data is
scenario, the world may have found a saviour
significantly reduced and will slow the pace of new
for the decline cliff being faced by conventional
unconventional exploration. Coupled with this is the
oil fields over ten years old, but it has not found
time delay to export oil field services and knowledge
the “silver bullet” that will restore oil prices to
outside the US and Canada, which means that the
the level from a few decades ago and also thwart
pace of production growth from tight oil globally
OPEC’s significant global influence.
will not be on a par with North America.
Key point 4: Even if we model in substantial tight
oil volumes from the US and countries like Canada
and Argentina, and use an optimistic timeframe for
development based on experience in successful US
plays, the impact on global supply should be limited
and thus suggests only a minor potential impact on
global oil prices within this decade.
© Kimmeridge 2012 - How will Tight Oil Impact Global Oil Prices this Decade? 25References Energy Information Administration, 2012 “Annual Energy Outlook” Swindell, 2012 “Eagle Ford Shale - An Early Look at Ultimate Recovery” Society of Petroleum Engineers (158207) International Energy Agency, 2012 “IEA Monthly Oil Market Report” Mason, 2012 “Oil Production Potential of the North Dakota Bakken” Organization of the Petroleum Exporting Countries, 2012 “OPEC Monthly Oil market Report” National Energy Board, 2012 “Tight Oil Developments in the Western Canada Sedimentary Basin - Energy Briefing Note” Carroll et al., 1992 “Upper Permian Lacustrine Oil Shales, Southern Junggar Basin, Northwestern China” © Kimmeridge 2012 - How will Tight Oil Impact Global Oil Prices this Decade? 26
Notice & Disclaimer

•   This document and all of the information contained in it, including without limitation all text, data, graphs, charts
    (collectively, the “Information”) is the property of Kimmeridge Energy Management, LLC or its affiliates (collectively,
    “Kimmeridge”), or Kimmeridge’s licensors, direct or indirect suppliers or any third party involved in making
    or compiling any information (collectively, with Kimmeridge, the “Information Providers”) and is provided for
    informational purposes only. The information may not be reproduced or redisseminated in whole or in part without
    prior written permission from Kimmeridge.
•   The Information has been derived from sources believed to be reliable but is not guaranteed as to accuracy
    and does not purport to be a complete analysis of any security, company or industry involved. The user of the
    information assumes the entire risk of any use it may make or permit to be made of the information. NONE OF THE
    INFORMATION PROVIDERS MAKES ANY EXPRESS OR IMPLIED WARRANTIES OR REPRESENTATIONS WITH RESPECT
    TO THE INFORMATION (OR THE RESULTS TO BE OBTAINED BY THE USE THEREOF), AND TO THE MAXIMUM EXTENT
    PERMITTED BY APPLIABLE LAW, EACH INFORMATION PROVIDER EXPRESSLY DISCLAIMS ALL IMPLIED WARRANTIES
    (INCLUDING, WITHOUT LIMITATION, ANY IMPLIED WARRANTIES OF ORIGINALITY, ACCURACY, TIMELINESS, NON-
    INFRINGEMENT, COMPLETENESS, MERCHANTABILITY AND FITNESS FOR A PARTICULAR PURPOSE) WITH RESPECT TO
    ANY OF THE INFORMATION.
•   Information containing any historical information, data or analysis should not be taken as an indication or guarantee
    of any future performance, analysis, forecast or prediction. Past performance does not guarantee future results.
    Opinions expressed are subject to change without notice.
•   None of the Information constitutes an offer to sell (or a solicitation of any offer to buy), any security, financial
    product or other investment vehicle or any trading strategy.
•   Kimmeridge Energy Management, LLC is a Registered Investment Adviser. Nothing herein is intended to constitute
    investment advice or a recommendation to make (or refrain from making) any kind of investment decision and may
    not be relied on as such.
•   The Information has not been submitted to, nor received approval from, the United States Securities and Exchange
    Commission or any other regulatory body.

© Kimmeridge Energy Management, LLC

Contact Kimmeridge

New York                              Houston (Roxanna)
40 Worth Street, 10th FLoor           952 Echo Lane, Suite 364
New York, NY , 10013                  Houston, TX 77024
+1-646-527-7334                       +1-713-520-1153

© Kimmeridge 2012 - How will Tight Oil Impact Global Oil Prices this Decade?                                                  27
You can also read