Numerical Study toward Optimization of Spray Drying in a Novel Radial Multizone Dryer - MDPI
←
→
Page content transcription
If your browser does not render page correctly, please read the page content below
Article

Numerical Study toward Optimization of Spray Drying in a
Novel Radial Multizone Dryer
Umair Jamil Ur Rahman 1,*, Artur Krzysztof Pozarlik 1, Thomas Tourneur 2, Axel de Broqueville 2, Juray De Wilde 2
and Gerrit Brem 1

 1 Thermal Engineering Group, Department of Thermal and Fluid Engineering, University of Twente,
 P.O. Box 217, 7500 AE Enschede, The Netherlands; a.k.pozarlik@utwente.nl (A.K.P.); g.brem@utwente.nl (G.B.)
 2 Materials & Process Engineering Division, Université Catholique de Louvain, 1348 Louvain-la-Neuve,

 Beglium; thomas.tourneur@uclouvain.be (T.T.); axeldebroqueville@outlook.be (A.d.B.);
 juray.dewilde@uclouvain.be (J.D.W.)
 * Correspondence: u.jamilurrahman@utwente.nl; Tel.: +10-316-2262-8887

 Abstract: In this paper, an intensified spray-drying process in a novel Radial Multizone Dryer
 (RMD) is analyzed by means of CFD. A three-dimensional Eulerian–Lagrangian multiphase model
 is applied to investigate the effect of solids outlet location, relative hot/cold airflow ratio, and droplet
 size on heat and mass transfer characteristics, G-acceleration, residence time, and separation effi-
 ciency of the product. The results indicate that the temperature pattern in the dryer is dependent on
 the solids outlet location. A stable, symmetric spray behavior with maximum evaporation in the hot
 zone is observed when the solids outlet is placed at the periphery of the vortex chamber. The max-
 imum product separation efficiency (85 wt %) is obtained by applying high G-acceleration (at rela-
 tive hot/cold ratio of 0.75) and narrow droplet size distribution (45–70 µm). The separation of dif-
 ferent sized particles with distinct drying times is also observed. Smaller particles (
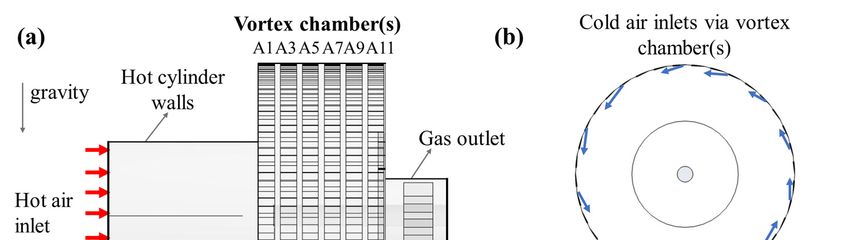
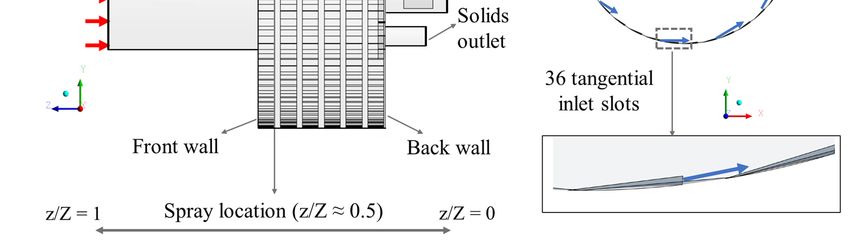
Energies 2021, 14, 1233 2 of 20

 capital costs [8,9]. Furthermore, the terminal velocities of the particles result in small gas–
 solid slip velocities, restricting the heat and mass transfer.
 In order to develop an alternative commercially viable and process-intensified spray-
 drying technology, high drying rates in a small volume must be achieved, while the resi-
 dence time of droplets/particles must be reduced to maintain product quality [8]. This can
 be done by operating the dryer as a multizone vortex chamber unit, which is the topic of
 this research.
 In a Vortex Chamber (VC), the rotational motion of the gas is achieved by the tan-
 gential injection of gas through multiple inlet slots located in the periphery of the chamber
 [10,11]. Droplets/particles can be fed and removed via one of the end walls in the chamber,
 while the gas, after particle separation, leaves the chamber through a centrally positioned
 gas outlet chimney. An example configuration of a VC is presented in Figure 1. The cen-
 trifugal forces in the VC can be much higher than the gravitational forces, resulting in high
 gas–solid slip velocities and the formation of a dense particle bed. These intensify the heat,
 mass, and momentum transfer [11–13].

 Figure 1. Schematic representation of vortex chamber

 The process intensification in a gas–solid VC has been experimentally and/or numer-
 ically demonstrated for many applications such as biomass gasification [14], biomass fast
 pyrolysis [15], fluid catalytic cracking [16], and drying [17–19]. The drying of polymer
 materials (polystyrene emulsion, sulfadiazine) for the removal of superficial moisture was
 experimentally demonstrated by Kochetov et al. [19,20]. Their study summarized optimal
 ratios for vortex chamber design. Lazar and Farkas [21] reviewed fluidized bed drying of
 food materials using a centrifugal field wherein the potential advantages and challenges
 were discussed. Eliaers and De Wilde [13] compared a conventional fluidized bed and a
 Rotating Fluidized Bed (RFB) for the drying of woody biomass particles. The authors
 showed the formation of a uniform and dense particle bed using high-G acceleration that
 gave substantial benefit, especially in the first drying stage. More recently, Eliaers et al.
 [22] studied the application of particle coating; their results suggested that VC allows for
 short contact time between particles and gas and promotes a small particle residence time
 in the reactor. Both are beneficial for process intensification.
 The evolution of a VC is a Radial Multizone Dryer (RMD) [23–26]. In this configura-
 tion, hot air enters axially into the central zone while the vortex is created via relatively
 cold airflow entering the RMD via the tangential channels; see Figure 2. The process in-
 tensification is an outcome of both multizone drying operation with high and low tem-
 perature air feeding zones and high-G acceleration. Consequently, the drying occurs in
 two steps: (i) the majority of drying takes place in the central hot zone where very small
 droplets/particles are exposed for few milliseconds to temperatures of 350–400 °C coming
Energies 2021, 14, 1233 3 of 20

 from counter-flowing hot air and (ii) at the peripheries of the RMD, where the particles
 are exposed to strong centrifugal forces coming from the rotating air at a temperature of
 80–120 °C. By rapid evacuation of dried particles to a colder rotating environment, prod-
 uct degradation due to high gas temperatures is avoided. This way, two drying zones are
 established: a fast drying zone in the radial center and a final slow drying zone in the
 periphery of the chamber. The former leads to enhanced drying rates, and the latter inten-
 sifies air–droplet contact and air–solid separation.

 Figure 2. Computational domain of a Radial Multizone Dryer: (a) side view; (b) front view of a
 single wheel of the vortex chamber with 36 tangential inlets.

 In order to prevent particle overheating (during the 1st drying step in RMD) and to
 minimize product losses via the gas outlet, the separation of the dried particles from the
 central hot zone to the cold peripheral zone of VC is of prime importance. The centrifugal
 forces in the reactor are a function of chamber dimensions, air inlet slot size, operating
 conditions, and particle properties [11]. Trujillo and De Wilde [27] experimentally demon-
 strated that particle losses via the central gas outlet could be significantly reduced by lo-
 cating the solids outlet to an optimum position for a given particle type and size. Further-
 more, with an increase of the injection velocity via the tangential inlets, higher centrifugal
 forces were observed in the chamber, improving particle retention. Weber et al. [28] con-
 ducted experiments on a binary mixture of granular materials and showed the effects of
 separation and segregation due to their different sizes and density. The authors concluded
 that for a fixed gas flow rate, different particle types (size and density) experience different
 centrifugal forces on them. Once the centrifugal forces are less than the inward drag
 forces, the particles will leave the VC. De Wilde et al. [29] further showed the potential of
 high-G gas–solid contact, gas–solid separation, and particle segregation in a rotating flu-
 idized bed. There, the particle losses via the gas outlet were reduced by increasing the gas
 flow rate. The large particles formed a dense uniform bed near the wall, whereas a less
 dense bed was seen for small particles. Thus, the high-G acceleration in the chamber could
 be varied by either increasing the gas flow rate or by adjusting the number or width of
 injection slots. Based on the above studies, an optimum design configuration of VC for a
 particular application, such as spray drying, requires a parametric investigation of the
 factors mentioned above [11,28].
 Experiments involving multiphase flows and high-temperature gradients are very
 challenging and time-consuming. Furthermore, often, the process conditions and meas-
 urement techniques are limited by the design of the experimental setup, as well as by the
 complexity and non-linearity of the process [30]. In recent years, Computational Fluid
 Dynamics (CFD) has proven to be an extremely useful tool in designing new dryers and
Energies 2021, 14, 1233 4 of 20

 optimizing existing processes for the food industry [31–33]. Hence, in this study, we em-
 ploy a CFD approach as well.
 Huang et al. [34,35] performed a comprehensive study of gas flow patterns, evapo-
 ration zones, and droplet impact positions at different operating conditions and different
 co-current spray dryer geometries. A steady-state axisymmetric model with the k-epsilon
 approach for the gas phase turbulence was employed. For the droplet phase, the authors
 used properties of water with varying solid content, while the droplet size range of ap-
 proximately 10–120 µm was prescribed. For model validation, the authors used the geom-
 etry and boundary conditions from previous works [36,37].The results showed that drop-
 lets have different trajectories and drying histories owing to the differences in the airflow
 dynamics and temperature patterns. Anandharamakrishnan et al. [38] performed three-
 dimensional, steady-state simulations to compare the drying trajectories in a short form
 and tall form spray dryer. The feed properties were assumed to be of maltodextrin solu-
 tion (42.5 wt %), assuming only surface moisture evaporation. The gas phase turbulence
 was resolved using the k-epsilon model. The model predictions corresponded well with
 the experimental measurements taken by Kievet [36]. The authors found short-form dry-
 ers to be more suitable for heat-sensitive materials due to the shorter particle residence
 times. The advantages of using superheated steam as a drying medium were demon-
 strated by Frydman et al. [39]. A 2D steady-state approach was employed while the tur-
 bulence was accounted for by the k-epsilon model. Different droplet sizes (12–83 µm)
 were injected using a constant velocity at the nozzle orifice and assuming a flow with
 water properties. The model predictions matched well with the measured temperature
 data in the dryer. The model was extended further by Ducept et al. [33] to predict the
 Residence Time Distribution (RTD) of dry particles by including 10 wt % of dry matter
 (KCl solution) in the liquid droplet; however, the drying kinetics were not included. In
 this way, once all the water was evaporated, solid particles could leave the dryer after a
 certain residence time. The authors validated this approach by comparing the experi-
 mental and numerical RTD with reasonable accuracy. The authors demonstrated the fea-
 sibility of using superheated steam with the advantages of higher drying rates.
 Recently, Ali et al. [6] studied a counter-current spray-drying tower with an inlet
 swirl for detergent production. Comparing the model predictions with the experimental
 measurements at the exhaust location revealed underprediction of the heat transfer rate
 resulting in higher exhaust temperature and particle moisture content by the CFD model.
 The authors owed the discrepancies to the differences in the initial droplet size distribu-
 tion and the underprediction of the particle residence times.
 In the above-presented studies, an Euler–Lagrangian multiphase model was em-
 ployed with two-way coupling between the gas and droplet phase via the particle-source-
 in-cell method of Crowe [40].
 In the VC-related CFD research, Broqueville and De Wilde [41] investigated the gas–
 solid heat transfer in a VC with an RFB and compared it to conventional fluidized beds
 using a 2D model. The presence of a uniform and dense bed as observed experimentally
 was confirmed via the CFD simulations. Furthermore, the results prove the heat and mass
 transfer intensification in a VC. Trujillo and De Wilde [16] applied 2D CFD simulations
 with reactions to demonstrate the use of RFB for the catalytic cracking of gas oil. Only
 qualitative validation was performed based on experimental observations. The authors
 reported significant process intensification (compared to conventional risers) despite uti-
 lizing a non-optimized VC. A detailed study on the operating conditions and different
 designs was carried out by Dutta et al. [42] to study the hydrodynamics behavior of dif-
 ferent Geldart group particles. Similar to previous authors, no direct validation was per-
 formed; nevertheless, the model showed similar trends to experimental observations of
 De Wilde and Broqueville [10]. The authors displayed the advantages of CFD in evaluat-
 ing different operating conditions and design scenarios of VC configuration. Niyogi et al.
 [43] performed 3D simulations of a vortex unit operating with a particle size of 0.5–2 mm.
 The authors examined the influence of gas flow rate, particle diameter, and solids density
Energies 2021, 14, 1233 5 of 20

 on the hydrodynamics behavior, optimizing the configuration and conditions for a given
 application.
 In the VC studies mentioned above, the authors used the Eulerian–Eulerian multi-
 phase model combined with the kinetic theory of granular flow (KTGF) for the solid phase
 equations. The gas phase turbulence was accounted for by using a k-epsilon-type ap-
 proach with standard wall functions. The wall boundary conditions for the gas phase were
 prescribed as no-slip, whereas partial slip or free slip conditions were used for the solid
 phase. Recently, an Euler–Lagrangian-based Computational Particle Fluid Dynamic
 (CPFD) model was studied by Dutta et al. [44]. From the study, the authors found a strong
 effect of particle size, number of gas inlet slots, and their width on the gas-particle hydro-
 dynamics in the VC. The predicted results showed similar trends with the reported exper-
 imental data.
 In the present paper, the application of spray drying in a VC technology is numeri-
 cally studied. The hypothesis, that high drying rates while maintaining small particle res-
 idence times can be achieved using high air inlet temperature and high-G acceleration in
 a multizone VC geometry, is tested by assessing the separation efficiency of the product.
 The results of temperature and moisture fields, high-G acceleration, and droplet drying
 histories are presented.

 2. CFD Methodology
 In this work, a novel application of spray drying in a RMD with vortex chambers
 located downstream of the hot air inlet is studied; see Figure 2 for details of the geometry.
 To reduce the turbulences and maintain a plug flow, the hot air enters the dryer axi-
 ally via a honeycomb. Furthermore, a secondary air with low temperature is supplied via
 air distribution jackets directly to the VC wheels. There are six VC wheels
 (A1/A3/A5/A7/A9/A11), each having 36 tangential inlets located along the periphery. The
 rotating cold air and the axial hot air exit via a centrally positioned gas outlet. The droplets
 are injected in a counter flow manner to the axial hot airflow, and after drying, the product
 is removed via the solids outlet located next to the gas outlet.
 The commercial CFD code FLUENT v14.5 is used to perform a three-dimensional
 steady-state simulation of the spray-drying behavior in a RMD. The multiphase CFD
 model accounting for two-way interaction between droplets/particles and the air is based
 on an Eulerian–Lagrangian approach.

 2.1. Gas Domain
 The gas flow is calculated using the Reynolds-averaged continuity and Navier–
 Stokes equations. As a result of low Mach number flows, the hot gas is assumed to be
 incompressible [45]. The three-dimensional conservation equations of mass (1), momen-
 tum (2), energy (3), and species (4) are given below [46]

 = (1)

 where is the density of the gas, is the gas velocity vector components, and is the
 mass source term added to the gas phase due to the evaporation of moisture from the
 droplets.
 The momentum equation is given by:

 = − + µ + − ́ ́ + + (2)

 where is the pressure of the fluid, µ is the viscosity, ́ ́ is the turbulent shear
 stress, is the gravitational acceleration, and is the source term originating from the
 exchange of momentum between droplets/particles and gas.
 The energy equation can be written as:
Energies 2021, 14, 1233 6 of 20

 ℎ µ ℎ
 = + (3)

 where ℎ is the specific enthalpy, and is the energy source term added to the dispersed
 phase (droplets/particles).
 The species conservation equation is given by:
 µ
 = + (4)

 where is the mass fraction of vapor in humid gas and is the species source term.
 Due to the high gas velocities investigated here, the flow is expected to be turbulent,
 and therefore, the Reynolds-average approach is employed. Based on the literature re-
 view, see Section 1, the classic two-equation k-epsilon turbulence model with standard
 wall functions is used to account for the gas phase turbulence [43–45]. The well-known
 transport equations for the standard k-ε model, along with the transport equation for
 kinetic energy, dissipation rate, and turbulence viscosity can be found in [46,47]. The re-
 quired model constant values for , , µ , , and are set to default values of 1.44,
 1.92, 0.09, 1.0, and 1.3, respectively [45,47].

 2.2. Droplets/Particle Domain
 The droplet/particle trajectories are computed in a Lagrangian domain, while the in-
 teraction of droplets/particles with the continuous gas phase is coupled two ways through
 the droplet’s source terms of heat, mass, and momentum. Since the volume fraction of the
 dispersed phase is in the range of 10−3–10−5, the particle–particle interactions are neglected
 [48]. The trajectories of the particles are calculated by solving Newton’s second law of
 motion for each droplet/particle (see Equation (5)).
 ⃗
 = ⃗ ⃗ − ⃗ + ⃗ − (5)

 Here, ⃗ is the instantaneous gas velocity. The first term on the right-hand side is the
 drag force per unit mass, and the second term represents gravity and buoyancy force per
 unit mass. The drag force is given by:
 18 µ
 ⃗ = (6)
 24
 where is the particle Reynolds number defined as:
 ⃗ ⃗
 = . (7)
 µ

 The heat transfer between the droplet and the hot gas is computed according to the
 heat balance equation given as:

 = ℎ − + ℎ . (8)

 In order to calculate the heat transfer coefficient (ℎ), the correlation of Ranz and Mar-
 shall [49] as given in Equation (9) is used.

 = = 2.0 + 0.6 (9)

 The mass transfer between the gas and the droplets is assumed to be governed by
 gradient diffusion, and it is calculated according to the following equation:

 =− − (10)
Energies 2021, 14, 1233 7 of 20

 where is the vapor concentration at the droplet surface, is the vapor concentration
 in the bulk phase (air), and kc is the mass transfer coefficient, which is calculated from the
 Sherwood number correlation [49].

 ℎ = = 2.0 + 0.6 (11)
 ,

 In order to reduce the complexity of the problem, only the first drying stage with
 surface moisture evaporation is considered [33,38,50]. Furthermore, a milk surrogate
 droplet with 40 wt % solid content (core) and 60 wt % moisture content (surface moisture)
 are used in the drying process. The solid core density is equal to the density of milk pow-
 der particles [51], while all the remaining material is water. Hence, after all the moisture
 has evaporated, a solid particle circulates in the chamber, leaving the dryer finally via
 either the gas or solids outlet. The further assumptions are (i) the droplets/particles are
 spherical, (ii) no concentration gradient exists within the droplet/particle (droplets are
 very small, in the range 20–95 µm), (iii) intraparticle temperature variations are neglected
 (Biot number is smaller than 0.1), and (iv) processes related to particle stickiness (e.g., wall
 deposition, coalescence, and agglomeration) are not taken into account.

 2.3. Test Cases
 For all investigated cases, a hollow cone spray pattern with an angle of 20° (as given
 by the nozzle manufacturer) is used. Atomization is modeled starting from the location of
 primary spray break up. The Sauter Mean Diameter (SMD) of the droplets is in the range
 of 30 to 85 µm and prescribed using Rosin–Rammler distribution with a spread parameter
 of 2.05. The values are obtained based on empirical correlation derived by Klaassen [52]
 and are in agreement with data reported by Kievet for similar pressure nozzles [36]. The
 injection velocity for all droplets is constant and equal to 70 m/s. The dispersion of drop-
 lets/particles caused by the turbulence is taken into account using the discrete random
 walk model [53]. No heat losses from the walls are considered, since the VC wheels are
 surrounded by air distribution jackets, and the hot cylinder is well insulated. The droplet–
 wall interaction is modeled using normal and tangential restitution coefficients, both
 equal to 0.2, except for the hot cylinder walls, where droplets can leave the domain. This
 is done to account for the stickiness of the wet droplets to the hot walls.
 The boundary conditions applied for the simulation cases are summarized in Table
 1. To find the optimum operational window of the RMD, we investigate different process
 conditions and geometrical changes. For cases “A–C”, the flow conditions are kept con-
 stant, while solids outlet location is varied. In case “B” and “C”, the distance of solids
 outlet from the gas outlet is twice of that in case “A”. This positioning is based on the
 hypothesis that placing the solids outlet away from the spray injection zone and gas outlet
 promotes symmetry of the spray pattern and minimizes product losses. Then, the best-
 performing case is investigated further by varying the relative hot/cold air ratio from 1.25
 (experimental conditions) to 1.0 and 0.75, cases “C–E,” respectively. The mass flow rates
 and temperatures from the VC wheels and hot air are adjusted such that the overall energy
 input to the chamber remains constant. In the last sensitivity study, the optimized case
 from the second parametric research is evaluated by varying the minimum and maximum
 droplet size with constant SMD. For case “E”, the droplet size range is 30–85 µm, for the
 case “F”, it is 20–95 µm, and for the case “G”, it is 45–70 µm.

 Table 1. Boundary conditions for all simulation cases.

 Boundary Conditions Case A–C Case D Case E–G
 Hot air mass flow rate (kg/h) 690 690 670
 Hot air temperature (°C) 345 350 350
 Cold air via A1 and A3 (kg/h) 151 180 306
 A1–A3 air temperature (°C) 125 130 110
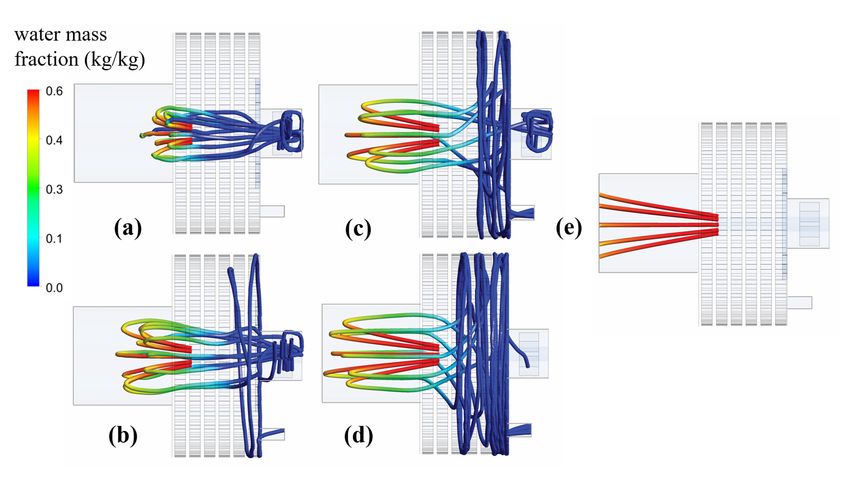
Energies 2021, 14, 1233 8 of 20

 Cold air via A5 and A7 (kg/h) 181 252 324
 A5–A7 air temperature (°C) 128 140 110
 Cold air via A9 and A11 (kg/h) 192 216 270
 A9–A11 air temperature (°C) 145 130 105
 Absolute humidity (kg H2O/kg dry air) 0.009 0.009 0.009
 Liquid feed rate (kg/h) 56 56 56

 2.4. Mesh and Solver
 The conservation equations for the continuous and discrete phases are solved for a
 three-dimensional steady-state CFD model using a commercial CFD package ANSYS Flu-
 ent version 14.5 [45]. For the pressure–velocity coupling, a SIMPLE (Semi-Implicit Method
 for Pressure Linked Equations) scheme [54] is employed in combination with a PRESTO!
 scheme [54] for pressure interpolation, as recommended for swirling flows [45]. A second-
 order upwind scheme is applied for the discretization of the convection terms [54].
 An unstructured tetrahedral mesh is used to discretize the geometry. In order to solve
 the flow field correctly near the small tangential inlets in VC, mesh refinement is done
 there. A grid-independent solution is verified by applying meshes with a resolution of
 3M, 6M, and 9M elements and examination of three radial temperature profiles. The over-
 all discrepancy between the solutions was found to be in the range of 1%; thus, for further
 research, a grid of 3M elements is used. The final mesh is presented in Figure 3.

 Figure 3. Computational mesh: (left) cross-sectional view in the X-Z plane, and (right) cross-sec-
 tional view in X-Y.

 3. Results
 In order to assess the performance of the model, first, a validation study is performed.
 The numerical results are compared with the temperature profiles of experiments con-
 ducted without and with droplet spray, see Figure 4 (left) and Figure 4 (right), respec-
 tively. The thermocouples V12 and V13 are located in the central core region of VC, and
 they measure the temperature at each VC wheel in the axial direction.
 The results show that the numerical temperature profile for only-gas flow corre-
 sponds well with the experimental measurements. The average error is equal to 1% for
 V12 and 4% for the V13 probe. The slight overprediction in temperature is attributed to
 the assumption of adiabatic walls, whereas some heat losses are expected during the ex-
 periment.
 The experimental data with water spray show a strong asymmetry between results
 from probes V12 and V13. This trend is not well pronounced in the numerical data; how-
 ever, the overall error is in the range of 4% and 8% for probes V12 and V13, respectively.
 It should be noted here that drying experiments with the utilization of spray are typically
 burdened with higher measurement error compared to gas-flow-only experiments. This
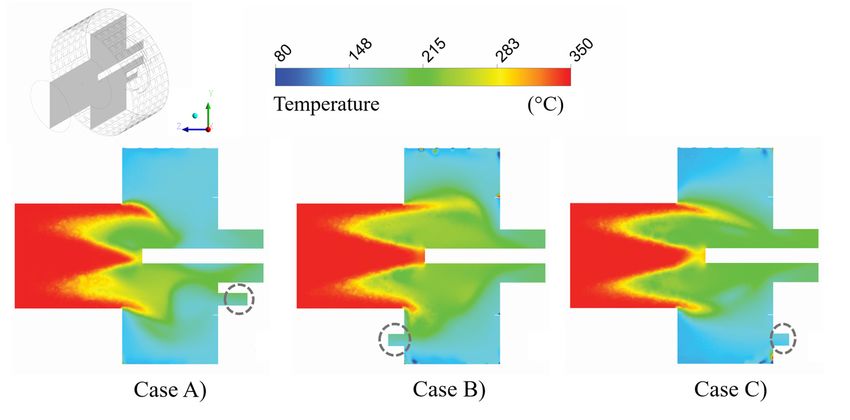
Energies 2021, 14, 1233 9 of 20

 is due to the possible wetting of the thermocouples and non-uniformity in the spray pat-
 tern.
 In conclusion, the predicted numerical results correspond sufficiently well with tem-
 perature measurements. A detailed discussion regarding the validation results is given in
 our former paper [23].

 Figure 4. Comparison of predicted temperature profiles against the experimental temperature
 measurements (left) without spray and (right) with spray.

 3.1. Effect of Solids Outlet
 The influence of the location of solids outlet on the performance of RMD is investi-
 gated for three cases “A–C”. In case “A”, the solids outlet is located close to the gas outlet,
 whereas in cases “B–C”, it is moved radially outwards, at the front and back wall, respec-
 tively; see Figure 5. Detailed boundary conditions are presented in Table 1.
 The predicted temperature and moisture fraction profiles of air are presented in Fig-
 ures 5 and 6. The temperature of the gas decreases along the chamber length due to the
 heat exchange between hot air coming from the inlet and counter-flowing evaporating
 spray. In general, the temperature profile for all three cases is similar. The same is true for
 the moisture profile. The maximum evaporation occurs in the hot zone, resulting in the
 most pronounced temperature drop. The temperature and moisture fraction values are
 fairly uniform in the radial peripheries of the VC, implying that almost no evaporation
 takes place in this zone. This behavior suggests that droplets upon reaching the VC are
 already dried.

 Figure 5. Gas temperature distribution with droplet injection at the Y-Z plane.

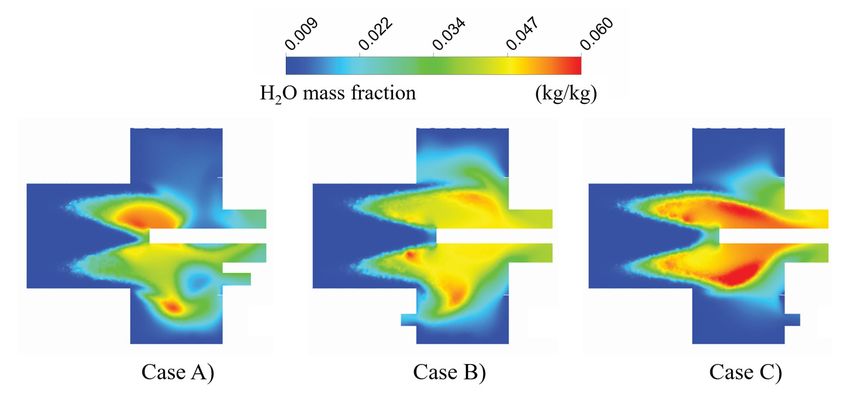
Energies 2021, 14, 1233 10 of 20

 All droplets are injected with a constant velocity. However, due to different diame-
 ters and mass, they exert different momentum on the counter-flowing hot gas. Thus, as a
 result, the penetration depth and stagnation point of the droplets in the hot zone vary
 significantly. Heavy droplets penetrate further into the hot cylinder compared to small
 droplets, whereas the small and light droplets are quickly deflected and move toward the
 radial peripheries of the VC. This way, RMD offers a unique feature wherein heavy drop-
 lets (least dry) meet the gas at the high temperature (approximately 350 °C) and fine drop-
 lets are exposed to the relatively low gas temperature (approximately 215 °C).

 Figure 6. Moisture fraction distribution at the Y-Z plane (to provide better insight into the evapo-
 ration process, the maximum value of moisture fraction has been restricted to 0.06).

 Although the general profiles of the investigated cases are similar, a detailed view on
 the temperature and air humidity profiles, see Figures 7 and 8, respectively, reveals dif-
 ferences in the drying behavior of the droplets.
Energies 2021, 14, 1233 11 of 20

 Figure 7. Radial temperature (a,c) and moisture (b,d) distribution at z/Z = 0.75 for centerlines of X-
 Z (a,b) and Y-Z (c,d) planes.

 Figure 8. Radial temperature (a,c) and moisture (b,d) distribution at location z/Z = 0.55 for center-
 lines of X-Z (a,b) and Y-Z (c,d) planes.

 From Figure 7, it is possible to note an asymmetric behavior of the spray, i.e., the
 penetration depth, and thus also the temperature and moisture profiles are different at the
 presented cross-sections. For case “A”, the droplets cannot penetrate further into the hot
 zone; thus, the temperature and moisture fraction profiles are relatively uniform with mi-
 nor heat and mass exchange (seen clearly in Figure 7c,d). The temperature and moisture
 fraction profiles for cases “B” and “C” show a temperature drop from 350 °C to approxi-
 mately 120–130 °C and maximum moisture fraction values of about 0.095 kg/kg.
 The plots also show a uniform distribution of temperature and humidity in the cen-
 tral region. This is due to the hollow cone spray pattern that creates a low-pressure region,
 forcing hot air to pass through. The hot air, due to the momentum transfer between air
 and droplet/particles, is forced radially toward the walls. Therefore, high temperatures
 are seen at and next to the walls with a gradual radial temperature drop as a result of heat
 transfer from the droplets. A maximum temperature drop and consequently the highest
 moisture fraction values are observed for the case “C”. This implies that the droplet pen-
 etration is maximum in case “C”. The lowest temperature drop and thus lowest air mois-
 ture fraction values are seen for case “A”.
 Figure 8 presents the radial gas temperature and moisture fractions profiles at the
 axial location z/Z = 0.55. Comparing the cases, the plot in Figure 8 depicts similar trends
 as shown earlier with hot air penetrating through the central low-pressure region of a
 hollow cone, therefore resulting in higher temperatures in the centerline of the chamber
 with a sharp decrease in temperatures in the outward radial direction, owing to the in-
 tense heat and mass transfer around the spray region. The peaks at r/R ≈0.3 and r/R ≈0.7
 are mainly due to momentum exerted by the spray on the hot air, forcing hot air to go
 around the hollow cone spray. The temperature of the air in the VC and near the walls is
Energies 2021, 14, 1233 12 of 20

 mainly uniform, revealing that no evaporation takes place in the VC region. The expan-
 sion of the hot zone for the case “B” (near the walls) arises due to the bending movement
 of the hot air toward the solids outlet located on the front end wall. Such high tempera-
 tures close to the product outlet can lead to product burning and should be avoided. The
 moisture fraction plots in Figure 8 show opposite behavior to the temperature fields with
 hot dry air passing through the centerline of the VC and a sharp increase in moisture
 fraction observed radially outward around the spray nozzle. This is mainly due to the
 evaporation of smaller/fine droplets that results in high heat and mass exchange, showing
 peaks of moisture fraction and low gas temperature. Finally, it can be seen that the peaks
 of water mass fraction in case “C” show the highest values. This depicts efficient evapo-
 ration in the central fast drying zone.
 Comparing the separation efficiency for cases “A–C”, see Figure 9, it can be seen that
 the highest weight percentage of the product recovered at solids outlet is for the case “C”.
 This is 42 wt %. Around 40 wt % is evacuated via gas outlet, and the remaining mass is
 lost via the boundary walls; see previous sections for details. For case “A”, the majority of
 the product is leaving via the gas outlet, which is highly undesirable. This is mainly a
 consequence of a low-pressure region created by the gas and solids outlet being next to
 each other. This also compromises the separation of bigger and smaller particles from each
 other. We observe similar behavior for case “B” when the solids outlet is located at the
 front wall. The reason for that is partly due to the fact that the gas flows via the VC air
 inlets are not optimized and drive the particles toward the front wall. Here, also, about 17
 wt % of the particles impinge the cylinder walls. Since these are still wet particles, they
 are removed from the domain.

 Figure 9. Comparison of weight percentage (%) of product recovered at the outlets for cases A-C.

 Based on the above-presented analysis, case “C” offers the most desired behavior,
 and hence, it is used for further investigations.

 3.2. Effect of Relative Hot/Cold Air Ratio
 An analysis of separation efficiency, see the previous section, revealed that approxi-
 mately 40 wt % of the product is lost via the gas outlet. Previously, it has been studied
 experimentally that the particle losses, via the central exhaust chimney, can be signifi-
 cantly reduced provided that the centrifugal forces in the VC are higher than the gas–solid
 radial drag forces [29,45]. Here, the average relative centrifugal force , is used to
 quantify the magnitude of the rotational motion of gas. It is expressed as a multiple of the
Energies 2021, 14, 1233 13 of 20

 gravitational force and is helpful in comparing different conditions [42]. The centrifugal
 acceleration is calculated from:

 , = (12)
 .
 where is the tangential velocity (m/s) in the chamber, r is the radius of the chamber,
 and g is the acceleration due to gravity. From Equation (1), it is evident that the G–accel-
 eration in VC is a function of the gas tangential velocity, which is dependent on either the
 gas volumetric flow rate or the number of gas inlet slots and/or slot width. Thus, to change
 the G-acceleration for a fixed design, the gas flow rates via the VC tangential inlets need
 to be adjusted. This is studied in terms of relative hot/cold airflow ratio of 1.25, 1.0, and
 0.75; case “C”, “D”, and “E”, respectively (see Table 1).
 Figure 10 presents the G-acceleration as a function of the radial distance. The corre-
 sponding average centrifugal force for cases “C”, “D”, and “E” is 81, 133, and 240 g, re-
 spectively. The centrifugal force is highest for the case “E” due to major airflow via the
 tangential inlets of the VC, resulting in high tangential velocities. This leads to a significant
 volume fraction of particles being radially pushed outwards to the periphery of the VC,
 causing high momentum transfer between the gas phase and particles, as presented in
 Figure 11, depicting the iso-surfaces of volume fraction at a value of 5 × 10⁻⁴. Here, the
 particles are instantly separated from the central axial hot airflow and entrained into the
 VC to form a rotating particle bed. In case “E”, the peripheries of the VC are almost com-
 pletely occupied with the particles, while in case “C” and “D”, the G-acceleration is not
 sufficient to separate the particles efficiently. Therefore, the particles tend to move axially
 toward either of the end walls—front or back. Consequently, in case “C” and “D”, parti-
 cles rotate adjacent to the back wall. In case “E”, it can be seen that a relatively large
 amount of particles are separated and rotate in the center of the chamber. This is because
 the tangential velocities are maximal in the central two wheels.

 Figure 10. Comparison of average relative centrifugal forces along the chamber radius for cases C–
 E in the presence of droplets/particles at z/Z = 0.5. Here, r/R = 0 represents the centerline of VC
 (where spray nozzle is located), and r/R = 1 represents the wall of VC.

 The findings of the above-presented discussion have confirmation in the separation
 efficiency where case “E” outperforms the other two cases with a total separation effi-
 ciency of 60 wt %; see Figure 12. From the figure 12, also a correlation between the average
 relative centrifugal forces in the VC and product obtained at the solids outlet is evident.
 A similar trend was also observed by other authors [44]. The reason, as explained in the
Energies 2021, 14, 1233 14 of 20

 preceding discussion, owes to the centrifugal forces being greater than the drag forces
 acting inwards and forcing the particles to leave axially via the gas outlet.

 Figure 11. Iso-surfaces of discrete volume fraction: (left) isometric view, (right) front view.
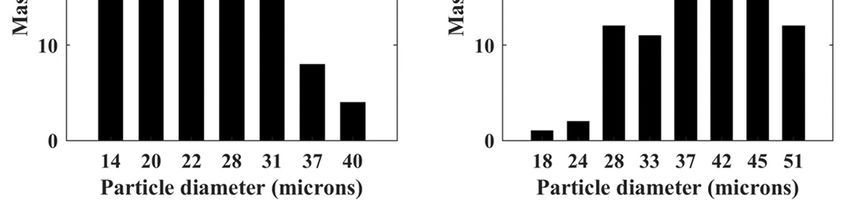
Energies 2021, 14, 1233 15 of 20

 Figure 12. Comparison of weight percentage (%) of product recovered at the outlets for cases C–E.

 3.3. Effect of Droplet Size Distribution
 Three simulation cases, with SMD kept constant at 52 µm, are presented here. Case
 “E” is the one discussed in the previous section with a droplet size distribution between
 30 and 85 µm, case “F” has a droplet size distribution between 20 and 95 µm, and case
 “G” has a droplet size distribution between 45 and 70 µm.
 Figure 13 shows the weight percentage of the product recovered at the outlet. As the
 droplet size range is narrowed down to 45–70 µm (case “G”), the separation efficiency
 increases to about 85 wt %. In contrast, the separation efficiency considerably drops down
 to approximately 26 wt % when a wider droplet size range is specified; see case “F”. Such
 behavior has an origin in the size of the biggest and smallest droplets and the paths they
 follow. The big droplets can travel deep toward the hot air inlet, whereas the small ones
 are instantaneously deflected back to the gas outlet. Thus, a narrow size distribution of
 the droplets is beneficial for good product separation.

 Figure 13. Comparison of weight percentage (%) of product recovered at the outlets for cases E–G.

 This has further confirmation in Particle Size Distribution (PSD); see Figure 14a, as
 discussed for the case “F”. Here, more than 90% of the mass is carried out by product
 particles smaller than 32 µm (corresponding to initial “wet” particle size of 47 µm). Only
 about 10 wt % of the particles come from big droplets. In contrast, at the solids outlet
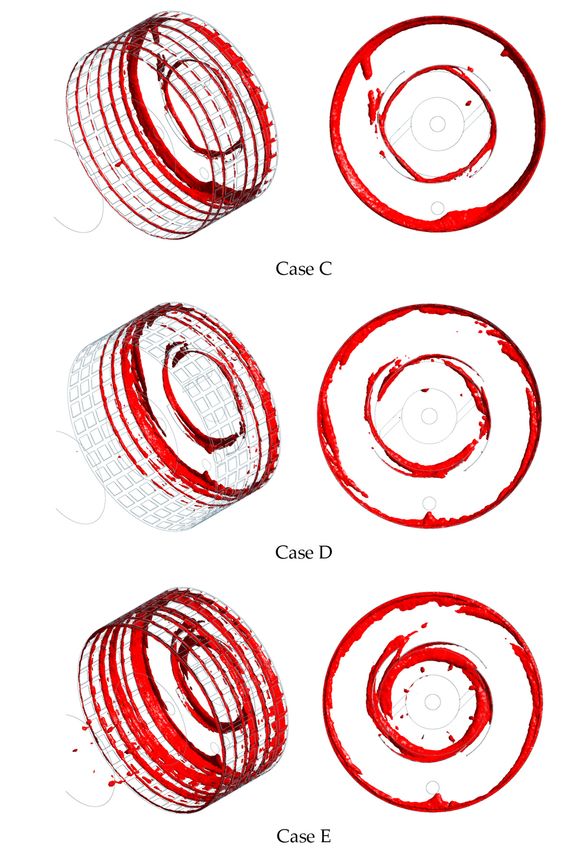
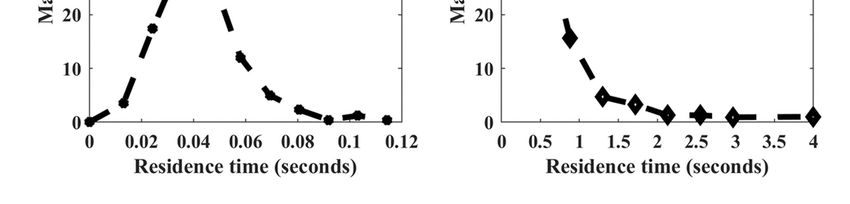
Energies 2021, 14, 1233 16 of 20

 (Figure 14b), approximately 85 wt % of the product particles are equal to or bigger than
 32 µm.

 Figure 14. Particle Size Distribution (PSD) of particles leaving the dryer in case “F”: (a) via gas
 outlet; (b) solids outlet.

 Figure 15a,b show the predicted RTD as a function of mass flow at the gas outlet and
 solids outlet, respectively. The mean residence time of the particles at the gas outlet is
 equal to 0.04 s, and at the solids outlet, it is equal to 0.67 s. Small droplets with small initial
 masses quickly dry and shrink in size. They have short relaxation times (low Stokes num-
 ber < 0.1), causing the particles to act as tracers in the central axial flow and leave via the
 gas outlet. Furthermore, due to the relatively smaller centrifugal forces acting on these
 fine particles, they are not separated, resulting in particle losses via the gas outlet and
 correspondingly short residence times.

 Figure 15. Residence Time Distribution (RTD) of particles leaving the dryer in case “F”: (a) via gas
 outlet; (b) solids outlet.

 The longer residence times of the big particles owe to their large inertia so they can
 penetrate deeper into the counter flowing hot air. After losing sufficient momentum, the
 particles, due to centrifugal forces, are separated radially outward to the periphery of the
 VC, where as a result of tangential momentum exchange, they start rotating and finally
 leave the reactor via the solids outlet; see also Figure 16. This analysis shows a key feature
 of spray drying in an RMD, i.e., the separation of bigger and smaller particles and hence,
 different drying histories for different droplet sizes.
Energies 2021, 14, 1233 17 of 20

 Figure 16. Droplet trajectories for case “F:” (a) initial droplet sizes < 30 µm; (b) 30–45 µm; (c) 45–60
 µm; (d) 60–75 µm; and (e) >75 µm.

 4. Conclusions
 Three-dimensional multiphase CFD simulations of counter-current spray drying
 process in a novel lab-scale RMD have been carried out. For modeling, a two-way coupled
 heat, mass, and momentum exchange between the discrete and gas phase (Euler–Lagran-
 gian approach) were used. The detailed information on temperature and moisture profile,
 G-acceleration, droplet/particle trajectory, drying history, particle residence time, and sep-
 aration efficiency were obtained.
 The results showed that it is possible to establish two separate and distinct tempera-
 ture zones within RMD: (i) a very hot, quick drying central zone in its center and (ii) a
 cold rotating zone, i.e., the final drying zone in the periphery of VC. The parametric study
 revealed a strong influence of solids outlet position, G-acceleration, and initial droplet size
 distribution on the separation efficiency of the product. The location of the solids outlet at
 the periphery of VC on the back wall gave the most promising results in terms of heat and
 mass transfer characteristics and separation efficiency, whereas its placement next to the
 gas outlet resulted in asymmetric spray behavior with minimal evaporation in the hot
 zone and compromised separation efficiency. Similarly, a direct correlation was noted be-
 tween separation efficiency and G-acceleration. A relative hot/cold airflow ratio of 0.75
 corresponding to average G-acceleration in the VC of about 250 g was found to be optimal.
 The separation of the product at the solids outlet was enhanced from 42 wt % to 60 wt %.
 In contrast, at higher relative hot/cold airflow ratios and consequently smaller G-acceler-
 ation, considerable particle losses occur via the gas outlet. This is due to smaller centrifu-
 gal forces in the VC. Finally, the influence of droplet size distribution was investigated.
 When a wide droplet size distribution (20–95 µm) is applied, a significant decrease in sep-
 aration efficiency is observed (26 wt %). Bigger particles (>75 µm) impinge the hot air inlet,
 whereas the smallest particles instantly leave the reactor via the gas outlet. By narrowing
 the droplet size distribution (45–70 µm), the total separation efficiency was increased to
 85 wt %; thus, depicting the strong correlation between the particle size and separation
 efficiency. Furthermore, results also revealed that the in situ separation of bigger and
 smaller particles leads to distinct drying histories. The majority of the bigger particles (>32
 µm) leave via the solids outlet and have a mean residence time of 0.67 s, whereas particles
 leaving via the gas outlet are mostly smaller particles (
Energies 2021, 14, 1233 18 of 20

 inlet temperatures and efficient particle separation using high-G acceleration, an intensi-
 fied spray-drying process with high drying rates and small particle residence times can
 be achieved in an RMD.

 Author Contributions: Conceptualization, U.J.U.R. and A.K.P.; Data curation, U.J.U.R., T.T. and
 A.d.B.; Formal analysis, U.J.U.R.; Funding acquisition, A.K.P. and J.D.W.; Investigation, U.J.U.R.;
 Methodology, U.J.U.R. and A.K.P.; Project administration, A.K.P. and J.D.W.; Resources, G.B.; Soft-
 ware, U.J.U.R.; Supervision, A.K.P. and G.B.; Validation, U.J.U.R.; Visualization, U.J.U.R.; Writing—
 original draft, U.J.U.R.; Writing—review and editing, A.K.P. and J.D.W. All authors have read and
 agreed to the published version of the manuscript.
 Funding: This project is co-funded by TKI-Energy with the supplementary grant ‘TKI- Toeslag’ for
 Topconsortia for Knowledge and Innovation (TKI’s) of the Ministry of Economic Affairs and Cli-
 mate Policy.
 Institutional Review Board Statement: Not applicable.
 Informed Consent Statement: Not applicable.
 Data Availability Statement: Not applicable.
 Acknowledgments: This research is conducted within the project RMD-Radial Multizone Dryer
 (DR-20-10), in collaboration with Institute for Sustainable Process Technology (within the Drying
 and Dewatering cluster), FrieslandCampina and Energy Research Center of the Netherlands (ECN)
 part of TNO. Authors would like to express their gratitude to all the project members for the fruitful
 discussions during the meetings.
 Conflicts of Interest: The authors declare no conflict of interest.

References
1. Percy, S.R. Improvement in Drying and Concentrating Liquid Substances by Atomizing. U.S. Patent 125,406, 9 April 1872.
2. Masters, K. Spray Drying Handbook; George Godwin Ltd.: London, UK, 1985.
3. Woo, M.W.; Bhandari, B. Spray drying for food powder production. In Handbook of Food Powders; Elsevier: Amsterdam, The
 Netherlands, 2013; pp. 29–56.
4. Zbicinski, I.; Piatkowski, M. Continuous and Discrete Phase Behavior in Countercurrent Spray Drying Process. Dry. Technol.
 2009, 27, 1353–1362, doi:10.1080/07373930903383661.
5. Wawrzyniak, P.; Jaskulski, M.; Piatkowski, M.; Sobulska, M.; Zbicinski, I.; Egan, S. Experimental detergent drying analysis in a
 counter-current spray dryer with swirling air flow. Dry. Technol. 2019, 38, 108–116, doi:10.1080/07373937.2019.1626878.
6. Ali, M.; Mahmud, T.; Heggs, P.J.; Ghadiri, M.; Bayly, A.; Ahmadian, H.; De Juan, L.M. CFD modeling of a pilot-scale counter-
 current spray drying tower for the manufacture of detergent powder. Dry. Technol. 2016, 35, 281–299,
 doi:10.1080/07373937.2016.1163576.
7. Pierrot, J.M. Decarbonisation Options for the Dutch Dairy Processing Industry. Master’s Thesis, Utrecht University, Utrecht,
 The Netherlands, 2020; TNO project no. 060.33956/Publication number TNO 2020 P11006.
8. Kudra, T.; Mujumdar, A.S. Advanced Drying Technologies; CRC Press: Boca Raton, FL, USA, 2009.
9. Frydman, A.; Vasseur, J.; Moureh, J.; Sionneau, M.; Tharrault, P. Comparison of superheated steam and air operated spray
 dryers using computational fluid dynamics. Dry. Technol. 1998, 16, 1305–1338, doi:10.1080/07373939808917464.
10. De Wilde, J.; De Broqueville, A. Experimental investigation of a rotating fluidized bed in a static geometry. Powder Technol. 2008,
 183, 426–435, doi:10.1016/j.powtec.2008.01.024.
11. De Wilde, J. Gas–solid fluidized beds in vortex chambers. Chem. Eng. Process. Process. Intensif. 2014, 85, 256–290,
 doi:10.1016/j.cep.2014.08.013.
12. Volchkov, E.P.; Dvornikov, N.A.; Yadykin, A.N. Characteristic Features of Heat and Mass Transfer in a Fluidized Bed in a
 Vortex Chamber. Heat Transf. Res. 2003, 34, 13, doi:10.1615/heattransres.v34.i7-8.40.
13. Eliaers, P.; De Wilde, J. Drying of Biomass Particles: Experimental Study and Comparison of the Performance of a Conventional
 Fluidized Bed and a Rotating Fluidized Bed in a Static Geometry. Dry. Technol. 2013, 31, 236–245,
 doi:10.1080/07373937.2012.726304.
14. Abdollahi, M.; Guy, C.; Chaouki, J. Biomass Gasification in Rotating Fluidized Bed. In Proceedings of The 13th International
 Conference on Fluidization - New Paradigm in Fluidization Engineering, May 16-21, 2010, Gyeong-ju, Korea. Available online:
 http://dc.engconfintl.org/fluidizationxiii/89 (Accessed July 5, 2017).
15. Gonzalez-Quiroga, A.; Reyniers, P.A.; Kulkarni, S.R.; Torregrosa, M.M.; Perreault, P.; Heynderickx, G.J.; Van Geem, K.M.;
 Marin, G.B. Design and cold flow testing of a Gas-Solid Vortex Reactor demonstration unit for biomass fast pyrolysis. Chem.
 Eng. J. 2017, 329, 198–210, doi:10.1016/j.cej.2017.06.003.
Energies 2021, 14, 1233 19 of 20

16. Trujillo, W.R.; De Wilde, J. Fluid catalytic cracking in a rotating fluidized bed in a static geometry: A CFD analysis accounting
 for the distribution of the catalyst coke content. Powder Technol. 2012, 221, 36–46, doi:10.1016/j.powtec.2011.12.015.
17. Pati, J.R.; Dutta, S.; Eliaers, P.; Mahanta, P.; Chatterjee, P.K.; De Wilde, J. Experimental study of paddy drying in a vortex cham-
 ber. Dry. Technol. 2016, 34, 1073–1084, doi:10.1080/07373937.2015.1093498.
18. Eliaers, P.; Pati, J.R.; Dutta, S.; De Wilde, J. Modeling and simulation of biomass drying in vortex chambers. Chem. Eng. Sci. 2015,
 123, 648–664, doi:10.1016/j.ces.2014.11.043.
19. Kochetov, L.M.; Sazhin, B.S.; Karlik, E.A. Hydrodynamics and heat exchange in vortex drying chambers. Chem. Pet. Eng. 1969,
 5, 688–690, doi:10.1007/bf01136999.
20. Kochetov, L.M.; Sazhin, B.S.; Karlik, E.A. Experimental determination of the optimal ratios of structural dimensions in the whirl
 chamber for drying granular materials. Chem. Pet. Eng. 1969, 5, 106–108, doi:10.1007/bf01146998.
21. Lazar, M.E.; Farkas, D.F. Centrifugal Fluidized Bed Drying—A Review of Its Application and Potential in Food Processing. IEE
 Conf. Publ. 1980, 1, 242–246.
22. Eliaers, P. High-G, low-temperature coating and granulation of cohesive powder in a vortex chamber (manuscript). Powder
 Technol. 2013, 258, 242–251.
23. Tourneur, T.; De Broqueville, A.; De Wilde, J. Experimental and CFD study of multi-zone vortex chamber spray dryers. In
 Proceedings of the 25th International Symposium on Chemical Reactor Engineering-ISCRE, Florence, Italy, 20–23 May 2018.
 Available online: www.aidic.it/iscre25 (Accessed April 20, 2018).
24. Rahman, U.J.U.; Baiazitov, I.; Pozarlik, A.; Brem, G. CFD study of air flow patterns and droplet trajectories in a lab scale vortex
 chamber spray dryer. In Proceedings of the 21st International Drying Symposium, València, Spain, 11–14 September 2018.
25. Rahman, U.J.U.; Pozarlik, A.K.; Baiazitov, I.; Tourneur, T.; de Broqueville, A.; De Wilde, J.; Brem, G. Stationary and transient
 aspects of air flow in a novel radial multi-zone dryer. In Proceedings of the 7th European Drying Conference, EuroDrying,
 Torino, Italy, 10–12 July 2019.
26. de Broqueville, A.; De Wilde, J.; Tourneur, T. Device for Treating Particles in a Rotating Fluidized Bed. WO/2018/203745, 2018.
27. Trujillo, W.R.; De Wilde, J. Influence of solids outlets and the gas inlet design on the generation of a gas-solids rotating fluidized
 bed in a vortex chamber for different types of particles. Chem. Eng. Sci. 2017, 173, 74–90, doi:10.1016/j.ces.2017.07.031.
28. Weber, J.M.; Stehle, R.C.; Breault, R.W.; De Wilde, J. Experimental study of the application of rotating fluidized beds to particle
 separation. Powder Technol. 2017, 316, 123–130, doi:10.1016/j.powtec.2016.12.076.
29. De Wilde, J.; Richards, G.; Benyahia, S. Qualitative numerical study of simultaneous high-G-intensified gas–solids contact, sep-
 aration and segregation in a bi-disperse rotating fluidized bed in a vortex chamber. Adv. Powder Technol. 2016, 27, 1453–1463,
 doi:10.1016/j.apt.2016.05.005.
30. Kerkhof, P.J. The role of theoretical and mathematical modelling in scale-up. Dry. Technol. 1994, 12, 1–46,
 doi:10.1080/07373939408959948.
31. Huang, L.; Mujumdar, A.S. Numerical Study of Two-Stage Horizontal Spray Dryers Using Computational Fluid Dynamics.
 Dry. Technol. 2006, 24, 727–733, doi:10.1080/07373930600685046.
32. Wu, Z.; Mujumdar, A.S. A Parametric Study of Spray Drying of a Solution in a Pulsating High-Temperature Turbulent Flow.
 Dry. Technol. 2006, 24, 751–761, doi:10.1080/03602550600685267.
33. Ducept, F. Superheated steam dryer: Simulations and experiments on product drying. Chem. Eng. J. 2002, 86, 75–83,
 doi:10.1016/s1385-8947(01)00275-3.
34. Huang, L.; Kumar, K.; Mujumdar, A.S. Use of Computational Fluid Dynamics to Evaluate Alternative Spray Dryer Chamber
 Configurations. Dry. Technol. 2003, 21, 385–412, doi:10.1081/drt-120018454.
35. Huang, L.; Kumar, K.; Mujumdar, A.S. A Parametric Study of the Gas Flow Patterns and Drying Performance of Co-current
 Spray Dryer: Results of a Computational Fluid Dynamics Study. Dry. Technol. 2003, 21, 957–978, doi:10.1081/drt-120021850.
36. Kieviet, F.G. Modelling Quality in Spray Drying; Eindhoven University of Technology: Eindhoven, The Netherlands, 1997.
37. Langrish, T.A.; Zbicinski, I. The Effects of Air Inlet Geometry and Spray Cone Angle on the Wall Deposition Rate in Spray
 Dryers. Chem. Eng. Res. Des. 1994, 72, 420–430. Available online: https://www.cheric.org/research/tech/periodi-
 cals/view.php?seq=51516 (Accessed November 5, 2018).
38. Anandharamakrishnan, C.; Gimbun, J.; Stapley, A.G.F.; Rielly, C.D. A Study of Particle Histories during Spray Drying Using
 Computational Fluid Dynamic Simulations. Dry. Technol. 2010, 28, 566–576, doi:10.1080/07373931003787918.
39. Frydman, A.; Vasseur, J.; Ducept, F.; Sionneau, M.; Moureh, J. Simulation of spray drying in superheated steam using compu-
 tational fluid dynamics. Dry. Technol. 1999, 17, 1313–1326, doi:10.1080/07373939908917617.
40. Crowe, C.T. Modelling spray-air contact in spray-drying systems. Adv. Dry. 1980, 1, 63–99.
41. De Broqueville, A.; De Wilde, J. Numerical investigation of gas-solid heat transfer in rotating fluidized beds in a static geometry.
 Chem. Eng. Sci. 2009, 64, 1232–1248, doi:10.1016/j.ces.2008.11.009.
42. Dutta, A.; Ekatpure, R.P.; Heynderickx, G.J.; De Broqueville, A.; Marin, G.B. Rotating fluidized bed with a static geometry:
 Guidelines for design and operating conditions. Chem. Eng. Sci. 2010, 65, 1678–1693, doi:10.1016/j.ces.2009.11.013.
43. Niyogi, K.; Torregrosa, M.M.; Pantzali, M.N.; Heynderickx, G.J.; Marin, G.B. Experimentally validated numerical study of gas-
 solid vortex unit hydrodynamics. Powder Technol. 2017, 305, 794–808, doi:10.1016/j.powtec.2016.10.049.
44. Dutta, S.; Loha, C.; Chatterjee, P.K.; Sadhukhan, A.K.; Gupta, P. Numerical investigation of gas-particle hydrodynamics in a
 vortex chamber fluidized bed. Adv. Powder Technol. 2018, 29, 3357–3367, doi:10.1016/j.apt.2018.09.014.
45. Fluent, A. Ansys Fluent Theory Guide; ANSYS Inc.: Canonsburg, PE, USA, 2011; Volume 15317, pp. 724–746.
Energies 2021, 14, 1233 20 of 20

46. Bird, R.B.; Stewai, W.E.; Lightfoot, E.N. Phenomena, 2nd ed.; John Wiley & Sons: Hoboken, NJ, USA, 2002.
47. Launder, B.E.; Spalding, D.B. Lectures in Mathematical Models of Turbulence; Academic Press: London, UK, 1972.
48. Elgobashi, S. An Updated Classification Map of Particle-Laden Turbulent Flows. In Proceedings of the IUTAM Symposium on
 Computational Approaches to Multiphase Flow, Lemont, IL, USA, 4–7 October 2004.
49. Ranz, W.E.; Marshall, W.R. Evaporation from drops. Chem. Eng. Prog. 1952, 48, 141–146.
50. Mezhericher, M.; Levy, A.; Borde, I. Modeling of Droplet Drying in Spray Chambers Using 2D and 3D Computational Fluid
 Dynamics. Dry. Technol. 2009, 27, 359–370, doi:10.1080/07373930802682940.
51. Tuohy, J. Some physical properties of milk powders. Irish J. Food Sci. Technol. 1989, 13, 141–152.
52. Klaassen, M. Near Filed Atomization in Pressure Swirl Nozzle. Experimental Investigation Regarding Inpact of Fluid Properties and
 Nozzle Specifications on Spray Characteristics; University of Twente: Enschede, The Netherlands, 2016.
53. Hutchinson, P.; Hewitt, G.; Dukler, A. Deposition of liquid or solid dispersions from turbulent gas streams: A stochastic model.
 Chem. Eng. Sci. 1971, 26, 419–439, doi:10.1016/0009-2509(71)83016-6.
54. Versteeg, H.K.; Malalasekera, W. An Introduction to Computational Fluid Dynamics: The Finite Volume Method; Prentice Hall: Lon-
 don, UK, 2007
You can also read