Lateral Flow Serodiagnosis in the Double-Antigen Sandwich Format: Theoretical Consideration and Confirmation of Advantages

Page created by Debra Tran
 
CONTINUE READING
Lateral Flow Serodiagnosis in the Double-Antigen Sandwich Format: Theoretical Consideration and Confirmation of Advantages
sensors
Article
Lateral Flow Serodiagnosis in the Double-Antigen
Sandwich Format: Theoretical Consideration and
Confirmation of Advantages
Dmitriy V. Sotnikov *, Anatoly V. Zherdev                            and Boris B. Dzantiev

                                                A.N. Bach Institute of Biochemistry, Research Center of Biotechnology of the Russian Academy of Sciences,
                                                Leninsky Prospect 33, 119071 Moscow, Russia; zherdev@inbi.ras.ru (A.V.Z.); dzantiev@inbi.ras.ru (B.B.D.)
                                                * Correspondence: sotnikov-d-i@mail.ru; Tel.: +7-495-9543142

                                                Abstract: Determination of the presence in the blood of antibodies specific to the causative agent of
                                                a particular disease (serodiagnosis) is an effective approach in medical analytical chemistry. Sero-
                                                diagnostics performed in the lateral flow immunoassay format (immunochromatography) meet
                                                the modern requirements for point-of-care testing and are supported by existing technologies of
                                                large-scale diagnostic tests production, thus increasing the amount of attention in a tense epidemio-
                                                logical situation. For traditional lateral flow serodiagnostics formats, a large number of nonspecific
                                                immunoglobulins in the sample significantly reduces the degree of detectable binding. To overcome
                                                these limitations, an assay based on the formation of immobilized antigen-specific antibody-labeled
                                                antigen complexes detection was proposed. However, the requirements for its implementation,
                                                providing maximum sensitivity, have not been established. This article describes the mathematical
                                                model for the above assay. The influence of the ratio of reagent concentrations on the analysis results
                                                is considered. It is noted that the formation of specific antibody complexes with several labeled
                                                antigens is the main limiting factor in reducing the detection limit, and methods are proposed to
                                                minimize this factor. Recommendations for the choice of the assay conditions, following from the
                                      analysis of the model, are confirmed experimentally.
       

Citation: Sotnikov, D.V.; Zherdev, A.V.;        Keywords: point-of-care assay; membrane tests; immunochromatography; lateral flow immunoassay;
Dzantiev, B.B. Lateral Flow Serodiagnosis
                                                immune response; detection of antibodies; antigen-antibody reactions; mathematical modelling;
in the Double-Antigen Sandwich
                                                assay sensitivity; limit of detection
Format: Theoretical Consideration and
Confirmation of Advantages. Sensors
2021, 21, 39. https://dx.doi.org/10.3390/
s21010039
                                                1. Introduction
Received: 19 November 2020                            The presence of antibodies specific to the causative agent of a certain disease in
Accepted: 16 December 2020                      the blood (serodiagnosis) indicates the contact between the organism and the pathogen,
Published: 23 December 2020                     and, for many diseases, it is considered an effective diagnostic parameter [1–3]. The ad-
                                                vantages of such diagnostics in comparison with the detection and identification of the
Publisher’s Note: MDPI stays neu-               pathogen itself consist in the relatively simple sampling, the reproducible results that do not
tral with regard to jurisdictional claims       depend on the choice of the sampling site or that slowly change for the patient over time,
in published maps and institutional             and the excluded need to grow the pathogen until it reaches the detectable concentration.
affiliations.                                   Serodiagnostics is actively used for many widespread and socially significant infections,
                                                including tuberculosis, human immunodeficiency virus, and more [4–8]. Particular interest
                                                in this diagnostic method has arisen this year due to the coronavirus pandemic [9–11].
Copyright: © 2020 by the authors. Li-
                                                      Serodiagnostics can be implemented in different formats; however, today two of
censee MDPI, Basel, Switzerland. This           them dominate in mass practice—microplate enzyme immunoassay and immunochromato-
article is an open access article distributed   graphic analysis—which correspond to their leading place in relation to immunodiagnostics
under the terms and conditions of the           in general [12–14]. At the same time, recent years have seen the accelerated development
Creative Commons Attribution (CC BY)            of point-of-care diagnostic tools, which make it possible to carry out methodically simple
license (https://creativecommons.org/           testing directly at the sampling site and quickly obtain results [15–18]. This requirement is
licenses/by/4.0/).                              fully met by immunochromatographic analysis (lateral flow immunoassay). All reagents

Sensors 2021, 21, 39. https://dx.doi.org/10.3390/s21010039                                                         https://www.mdpi.com/journal/sensors
Lateral Flow Serodiagnosis in the Double-Antigen Sandwich Format: Theoretical Consideration and Confirmation of Advantages
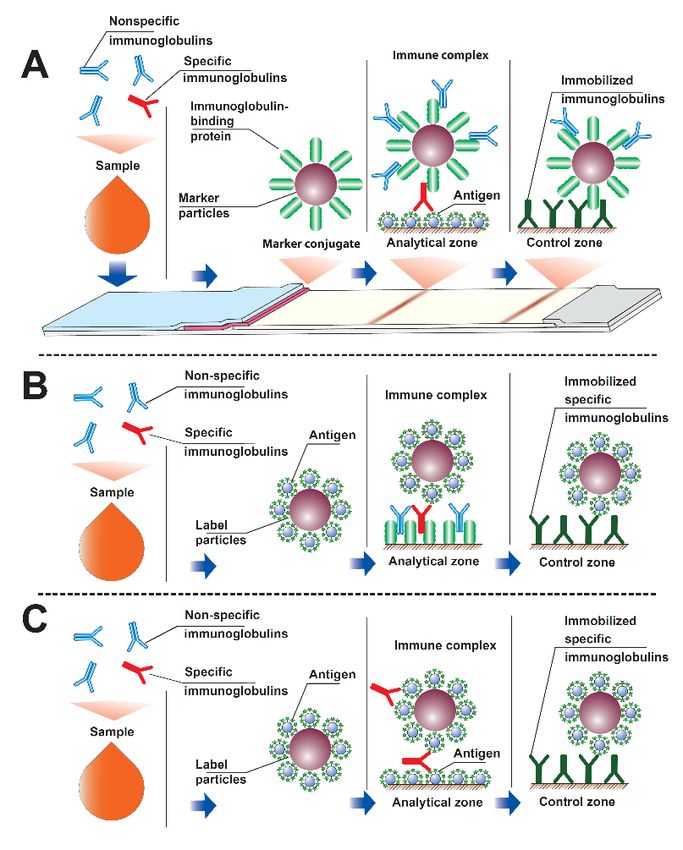
Sensors 2021, 21, x FOR PEER REVIEW                                                                                                                      2 of 16

Sensors 2021, 21, 39                                                                                                                                    2 of 16

                                 simple testing directly at the sampling site and quickly obtain results [15–18]. This require-
                                 ment is fully met by immunochromatographic analysis (lateral flow immunoassay). All
                                 reagentsfor
                                required       required
                                                   the assay forare
                                                                  thepre-applied
                                                                        assay are pre-applied          to the
                                                                                       to the test strip         test strip (a
                                                                                                            (a composite       of composite        of several
                                                                                                                                   several membranes).
                                 membranes).         Contact      of  the  sample     with    this  test  strip   initiates
                                Contact of the sample with this test strip initiates the movement of liquid along the         the   movement         of pores
                                                                                                                                                         liquid
                                 along
                                of         the pores ofand
                                    the membranes            the membranes          and analytical
                                                                  analytical reactions         with the reactions
                                                                                                           appliedwith       the applied
                                                                                                                       reagents,     including reagents,
                                                                                                                                                    reagents  in-
                                 cluding reagents
                                containing       a coloredcontaining
                                                                label. Mosta colored
                                                                                  often,label.   Most often,gold
                                                                                          nanodispersed           nanodispersed
                                                                                                                        particles are    gold
                                                                                                                                           used particles
                                                                                                                                                   as suchare  a
                                label
                                 useddue       to their
                                         as such         intense
                                                     a label   duecolor,     ease
                                                                      to their      of preparation,
                                                                                 intense   color, easeand      modification and
                                                                                                           of preparation,       [19–21].     As a result[19–
                                                                                                                                        modification          of
                                these
                                 21]. As processes,
                                            a result of labeled
                                                            thesecolored
                                                                     processes,immune
                                                                                    labeledcomplexes      are formed
                                                                                               colored immune             in certainare
                                                                                                                       complexes          zones   of the
                                                                                                                                             formed     in test
                                                                                                                                                             cer-
                                strip.   A visual
                                 tain zones           assessment
                                                 of the  test strip.ofAthe      presence
                                                                           visual           or absence
                                                                                     assessment      of theofpresence
                                                                                                               coloration orof   these zones
                                                                                                                               absence             allows us
                                                                                                                                            of coloration      of
                                to make      conclusions       about    the  test  results   [22,23].
                                 these zones allows us to make conclusions about the test results [22,23].
                                       For
                                        Forserodiagnostics,
                                               serodiagnostics,several severalformats
                                                                                  formatsare arepossible,
                                                                                                  possible, differing
                                                                                                                differingin in
                                                                                                                            thethelocation
                                                                                                                                       locationandandlabeling
                                                                                                                                                          label-
                                of immunoreagents.
                                 ing  of immunoreagents.       The The
                                                                     mostmost
                                                                            known      format
                                                                                   known         consists
                                                                                             format          of immobilizing
                                                                                                      consists     of immobilizing  an antigen      (specific
                                                                                                                                           an antigen      (spe-
                                for
                                 cifica for
                                         given    pathogen)
                                             a given    pathogen) in the    analytical
                                                                        in the  analyticalzonezoneandand labeling
                                                                                                           labelingananimmunoglobulin-binding
                                                                                                                           immunoglobulin-binding
                                reagent-anti-species
                                 reagent-anti-species antibodies,
                                                                antibodies, bacterial
                                                                                 bacterial immunoglobulin-binding
                                                                                              immunoglobulin-binding proteins      proteins (protein
                                                                                                                                                 (protein A,   A,
                                protein     G),  etc.  [24–29].     The   presence     of specific   antibodies      to the
                                 protein G), etc. [24–29]. The presence of specific antibodies to the pathogen in the sample  pathogen       in the   sample
                                leads
                                 leadsto  tothe
                                             theformation
                                                   formationof    ofaadetectable
                                                                         detectablecomplex
                                                                                       complexof    ofimmobilized
                                                                                                       immobilizedantigen antigenmolecules,
                                                                                                                                       molecules,specific
                                                                                                                                                       specific
                                antibodies
                                 antibodies and labeled immunoglobulin-binding protein (Figure 1A). Whencarrying
                                                 and   labeled     immunoglobulin-binding              protein     (Figure   1A).    When      carryingout   out
                                such
                                 suchserodiagnostics,
                                         serodiagnostics,a areliable reliabledifference
                                                                                 difference in results   is achieved
                                                                                                in results    is achievedfor samples
                                                                                                                               for samples containing
                                                                                                                                                  containingand
                                not
                                 andcontaining
                                       not containing  specific     antibodies.
                                                              specific    antibodies.However,
                                                                                          However,the intensity
                                                                                                        the intensity of the   recorded
                                                                                                                          of the    recorded color    is often
                                                                                                                                                  color    is of-
                                low,   which     prevents      a correct   assessment       of  the results    obtained.
                                 ten low, which prevents a correct assessment of the results obtained. The reason for this  The    reason     for this   effect
                                is that is
                                 effect    thethat
                                                labeled    immunoglobulin-binding
                                                    the labeled       immunoglobulin-binding     proteinprotein
                                                                                                            binds to    all immunoglobulins
                                                                                                                      binds   to all immunoglobulins    in the
                                tested     blood    or  serum,      of which     only   a few    percent    are   specific
                                 in the tested blood or serum, of which only a few percent are specific to this pathogen     to  this   pathogen       [30,31].
                                The    reaction
                                 [30,31].           of immunoglobulin-binding
                                             The reaction       of immunoglobulin-binding      proteins     with nonspecific
                                                                                                        proteins     with nonspecific immunoglobulins
                                                                                                                                              immunoglob-
                                reduces      the  proportion        of  the  label   that  is capable     of  participating
                                 ulins reduces the proportion of the label that is capable of participating in the formation     in   the  formation        of a
                                detectable complex of antigen-specific antibody-immunoglobulin-binding protein label
                                 of a detectable complex of antigen-specific antibody-immunoglobulin-binding protein la-
                                when the fluid passes through the analytical zone.
                                 bel when the fluid passes through the analytical zone.
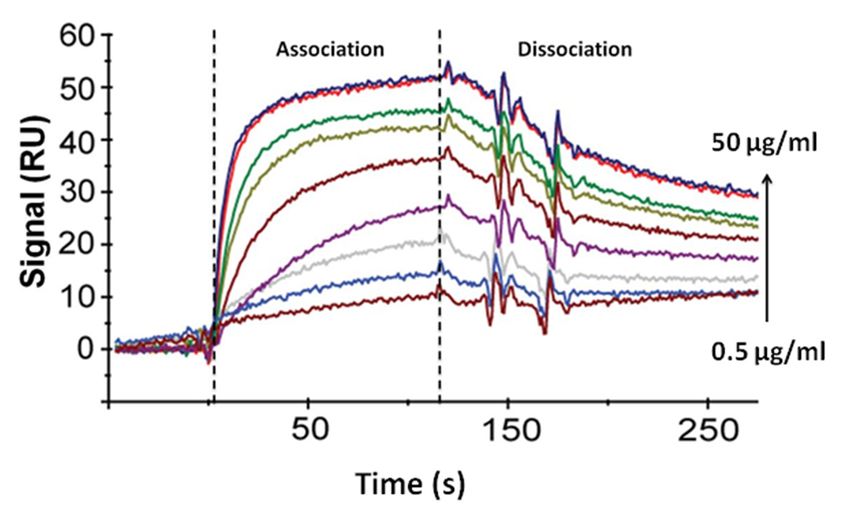
                                Figure  1. TheThe
                                 Figure 1.     threethree serodiagnostic
                                                     serodiagnostic         immunochromatography
                                                                     immunochromatography        formats:formats:    (A) with
                                                                                                          (A) with labeled        labeled
                                                                                                                             immuno-
                                immunoglobulin-binding     protein
                                 globulin-binding protein and       and immobilized
                                                                immobilized            antigen
                                                                              antigen in        in the analytical
                                                                                         the analytical  zone; (B)zone;
                                                                                                                   with (B)  withantigen
                                                                                                                         labeled  labeled
                                antigen and immobilized
                                 and immobilized          immunoglobulin-binding
                                                   immunoglobulin-binding      protein protein  in the analytical
                                                                                       in the analytical zone; (C)zone;
                                                                                                                    with(C)  with labeled
                                                                                                                          labeled antigen
                                antigen and immobilized
                                 and immobilized   antigenantigen  in the analytical
                                                           in the analytical         zone
                                                                             zone (see     (see additional
                                                                                        additional         comments
                                                                                                    comments           in the paper).
                                                                                                               in the paper).
Lateral Flow Serodiagnosis in the Double-Antigen Sandwich Format: Theoretical Consideration and Confirmation of Advantages
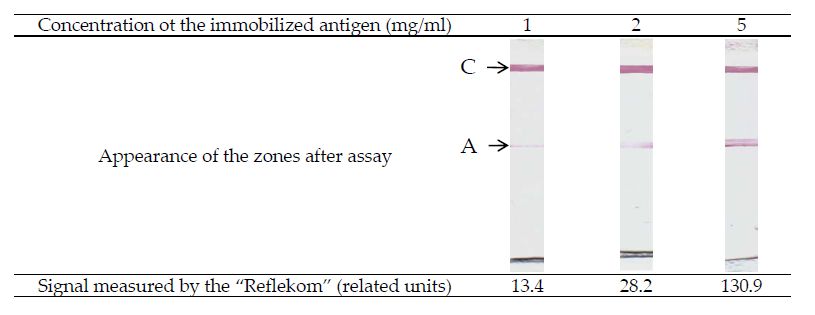
Sensors 2021, 21, 39                                                                                            3 of 16

                             To overcome this limitation, an alternative immunochromatographic serodiagnos-
                       tics format has been proposed, in which the label is conjugated to the antigen, and an
                       immunoglobulin-binding protein is sorbed in the analytical zone [32–37]. This approach
                       prevents the inclusion of the label in complexes with nonspecific immunoglobulins.
                       The problem of signal attenuation, however, remains, because nonspecific immunoglob-
                       ulins react with immunoglobulin-binding proteins in the analytical zone (Figure 1B).
                       However, the sorption capacity of this zone on the test strip is significantly higher (about an
                       order of magnitude) than the sorption capacity of the preparations of nanodispersed marker
                       particles [36]. Therefore, the binding in the analytical zone of nonspecific antibodies to
                       a lesser extent affects the formation of detectable complexes: immunoglobulin-binding
                       protein–specific antibody-antigen-label.
                             To eliminate the influence of nonspecific immunoglobulins in the sample on the results
                       of serodiagnostic immunochromatography, a third analysis format has been proposed,
                       in which antigen is present both in the analytical zone and in combination with the
                       label [33,38–40]. Due to several valencies of antibodies (2 for IgG, IgE and serum IgA,
                       10 for IgM), in this format, antigen-specific antibody-antigen-tag complexes can be formed
                       in the analytical zone (Figure 1C). This scheme excludes the interaction of nonspecific
                       immunoglobulins with components involved in the formation of a detectable complex.
                       However, obstacles to the inclusion of a label in the detected complex exist in this case
                       as well because a specific antibody can use its valences to bind only to labeled antigens.
                       There are currently no recommendations in the literature to minimize these effects.
                             Taking into account the relevance of the requirement to minimize cases of false neg-
                       ative serodiagnostics results, the task of increasing its analytical sensitivity is becoming
                       extremely important. However, the empirical variation of components concentrations and
                       conditions of their interaction is an extremely laborious task. In addition, the choice for
                       one test system may turn out to be far from optimal when switching to another test system
                       (working with another antigenic preparation or with another infection). The process of de-
                       veloping test systems can be intensified using mathematical models because examining the
                       model allows for identifying the key factors affecting the characteristics of the test system,
                       understanding the reasons for the observed negative effects, and proposing ways to elimi-
                       nate them. The practical application of the results of immunoanalytical systems modeling
                       have been considered in a number of recent works and are summarized in previous re-
                       views [41–46]; however, the regularities of the functioning of the test system with detected
                       immobilized antigen-specific antibody-labeled antigen complexes have not been previ-
                       ously analyzed. Due to the above-mentioned potential advantages of such serodiagnostics,
                       the presented work includes its theoretical consideration, identification, and verification
                       of the regularities of the formation of detected complexes, and characteristics of factors
                       influencing the analytical parameters of the test systems.

                       2. Materials and Methods
                       2.1. Reactants and Membranes
                            This study used recombinant protein A produced by Imtek (Moscow, Russia); Tween-
                       20, sodium azide; N-(3-dimethylaminopropyl)-N’-ethylcarbodiimide (EDC), sulfo-N-
                       hydroxysuccinimide (sulfo-NHS), and chloroauric from from Sigma-Aldrich (St. Louis,
                       MO, USA); and bovine serum albumin (BSA) from Boval BioSolutions (Cleburne, TX, USA).
                       Recombinant antigen of Mycobacterium tuberculosis with m.w. 38 kDa (Ag78, antigen 5,
                       PhoS, Rv0934) came from Arista Biologicals Inc. (Allentown, PA, USA). Monoclonal anti-
                       bodies HTM81 against the given protein came from the Center for Molecular Diagnostics
                       and Therapy (Moscow, Russia). All salts were of chemical or analytical grade. Water was
                       purified using a MilliQ unit from Millipore (Bedford, MA, USA).
Sensors 2021, 21, 39                                                                                       4 of 16

                             To prepare immunochromatographic test systems, an mdi Easypack kit (Advanced Mi-
                       crodevices, Ambala Cantt, India) was used, which included working membranes CNPH90
                       with pores of 15 µm, a support for conjugate PT-R5, a membrane for applying samples FR1
                       (0.6), a final adsorbent membrane AP045, and a laminating protective film on an adhesive
                       basis MT-1.

                       2.2. Gold Nanoparticles Preparation
                             To obtain gold nanoparticles with the expected average diameter near 20 nm, 2.95 mL
                       of 0.34% chloroauric acid was added to 97.5 mL of boiling deionized water. The mixture
                       was boiled for 2 min while stirring. Then 1.44 mL of 1% sodium citrate solution was added,
                       stirred, boiled for 30 min, and cooled for storage at +4 ◦ C.

                       2.3. Transmission Electron Microscopy
                            The gold nanoparticles preparation was applied onto nets (300 mesh) (Pelco Interna-
                       tional, Redding, CA, USA) covered with a polyvinyl formal film dissolved in chloroform.
                       To obtain the images, a CX-100 microscope (Jeol, Tokyo, Japan) was used at an acceleration
                       voltage of 80 kV. Photographs were digitally analyzed using the Image Tool software.

                       2.4. Immobilization of Rv0934 Antigen on Gold Nanoparticles
                            The antigen was dialyzed against 1000-fold of 10 mM carbonate buffer, pH = 9.0.
                       To the gold nanoparticles solution (D520 = 1.0), 0.1 M K2 CO3 was added until a pH = 9.0
                       was reached, and then the Rv0934 antigen at a concentration of 10 µg/mL was added.
                       The mixture was incubated for 10 min at room temperature and stirred, after which a 10%
                       aqueous BSA solution was added, for a final concentration of 0.25%.
                            The gold nanoparticles were separated from non-bound protein by 30-min centrifu-
                       gation at 6.000× g, resuspending in 50 mM K-phosphate buffer, pH 7.4, with 0.1 M NaCl
                       (PBS) containing 0.25% BSA. The preparations were stored at 4 ◦ C.

                       2.5. Application of Reagents to Immunochromatographic Membranes
                            To form the analytical zone on the CNPH90 working membrane, the M. tuberculosis
                       Rv0934 antigen was used. On 1 cm of the band, 1 µL of an antigen solution (1.0 mg/mL in
                       50 mM phosphate buffer, pH 7.4) was applied (according to Figure 1C “analytical zone”
                       compartment). To form the control zone, antibodies HTM81 were applied to the working
                       membrane at a concentration of 0.5 mg/mL (Figure 1C “control zone” compartment).
                       The gold nanoparticles conjugate with the Rv0934 antigen (according to Figure 1C “La-
                       beled antigen-nanoparticle” conjugate) was applied on the PT-R5 support at a dilution
                       corresponding to D520 from 1.25 to 10.0, in a volume of 8 µL per cm of band. To apply the
                       reagents, an IsoFlow dispenser (Imagene Technology, Hanover, NH, USA) was used.

                       2.6. Manufacturing of Immunochromatographic Test Systems
                            After applying the reagents, the membranes were dried in air at 20–22 ◦ C for at
                       least 20 h. A membrane composite was assembled, from which strips 3.5 mm wide were
                       obtained, using an Index Cutter-1 guillotine cutter (A-Point Technologies, Gibbstown, NJ,
                       USA). The test strips were placed in plastic cassettes, and the bags made of laminated
                       aluminum foil were hermetically sealed with silica gel as a desiccant. Cutting and packing
                       was implemented at 20–22 ◦ C in a special room with a relative humidity of not more than
                       30%. The packaged test strips were stored at 20–22 ◦ C.
Sensors 2021, 21, 39                                                                                             5 of 16

                       2.7. Immunochromatographic Analysis
                            The assay was carried out at room temperature. The bag was opened, and the test
                       strip was placed on a horizontal surface. One drop of blood serum and then 3 drops of
                       PBS containing 1% Tween-20 were added. After 10 min, the assay result was monitored.
                       The binding of the label was quantitatively assessed using a portable digital video analyzer
                       “Reflekom” (Synteco, Moscow, Russia).

                       2.8. Determination of Kinetic and Equilibrium Parameters of Interactions between Immunoreagents
                             To characterize the antigen-antibody interaction, a biosensor approach based on
                       surface plasmon resonance was used. Measurements were performed on a BIAcore X
                       (Biacore International, Uppsala, Sweden) using a CM5 chip with a carboxylated dextran-
                       coated surface. Initially, the carboxyl groups of dextran were activated using a mixture of
                       ethylcarbodiimide + hydroxysuccinimide (EDC + NHS), which formed short-lived ether
                       groups, which then reacted with the amino groups of the ligand to form an amide bond.
                       The activation was carried out by passing a mixture of activators from concentrations of
                       0.05 M EDC/0.2 M NHS through analytical and reference cells for 10 min at a flow rate of
                       10 µL/min.
                             Antibodies HTM81 against the Rv0934 antigen were dissolved in 10 mM sodium
                       citrate buffer, pH 4.0, to a concentration of 200 µg/mL. The solution was passed only
                       through the analytical cell; the reference cell remained closed. The passed volume of the
                       solution was 80 µL. Unreacted activated groups in the analytical cell and the reference cell
                       were blocked to prevent nonspecific interaction with 1 M ethanolamine passed for 10 min
                       at a flow rate of 10 µL/min. Antigen samples were passed over the surface of the modified
                       chip through the analytical and control cells at a flow rate of 10 µL/min. At the end of each
                       cycle, the surface was regenerated with a 0.1 M glycine-HCl solution at pH 2.
                             The equilibrium association constant was calculated in the approximation of
                       equilibrium conditions using the formula:

                                                     Req = (Ka·C·Rmax)/(1 + Ka·n·C)

                       where Ka is the equilibrium binding constant, Req is the level of binding (signal value on
                       the sensogram, Rmax is the maximum possible level of binding, C is the concentration of
                       the added antigen, and n is the steric factor.
                            The dependence of Req on C was reconstructed in the Scatchard coordinates (1/Req on
                       1/C). The obtained points were linearized on the Scatchard plot. The point of intersection
                       of the obtained line with the Y-axis gives 1/Rmax, and the tangent of the slope of the
                       linearized dependence is 1/(Ka × Rmax). Substituting the obtained 1/Rmax into the
                       expression 1/(Ka × Rmax), the equilibrium association constant was obtained: Ka.
                            The kinetic dissociation constant was calculated by the formula:

                                                         R = R0 e −kd(t-t 0 ) + Offset

                       where R is the signal at the time t, R0 is the signal at the beginning of the dissociation
                       section (at the time t0 ), and Offset is the background signal.
                             The kd was found from the R and R0 obtained from the analysis of the dissociation
                       site on the sensograms.
                             Considering the ratio Ka = ka /kd ; Kd = kd /ka, the values of ka and Kd were found.
Sensors 2021, 21, 39                                                                                            6 of 16

                       2.9. Determination of the Concentration of Binding Sites on the Gold Nanoparticles Conjugate
                            The conjugate of gold nanoparticles with the Rv0934 antigen, after synthesis and
                       purification from unbound antigen, was concentrated to an optical density of 5 (at a
                       wavelength of 520 nm) and mixed with a solution containing 80 µg/mL of monoclonal
                       antibodies HTM81. The mixture was incubated for an hour, then the conjugate with the
                       bound antibodies was separated by centrifugation at 8000× g. The supernatant containing
                       the antibodies unbound to the conjugate was collected and divided into two parts equal
                       in volume. HTM81 was added to the first solution to a concentration of 10 µg/mL as a
                       calibration. Then, the fluorescence of the solutions was measured upon excitation with
                       light at 280 nm and emission at 350 nm (the maximum fluorescence of tryptophan in the
                       protein). The difference in fluorescence in the first and second solutions corresponds to
                       fluorescence of 10 µg/mL HTM81. The fluorescence value in the second solution divided
                       by the fluorescence value of 10 µg/mL HTM81 and multiplied by 10 gives the concentration
                       of unbound antibodies in the sample. Subtracting this concentration from 80 µg/mL gives
                       the concentration of antibodies bound by the conjugate. This value characterizes the
                       concentration of binding sites on the conjugate.

                       2.10. Numerical Simulation of an Immunochromatographic Assay
                             Numerical simulation was implemented using COPASI 4.19 software (Biocomplexity
                       Institute of Virginia Tech, University of Heidelberg, and University of Manchester) [47].

                       3. Results and Discussion (Theoretical)
                       3.1. Modeling Interactions in an Immunochromatographic System
                            This paper provides a mathematical description of immunochromatographic serodi-
                       agnostics in a format with two antigens using analytical and numerical approaches. In the
                       models, only bivalent immunoglobulins were considered as an analyte, which includes the
                       main class of immunoglobulins: IgG.
                            At the first stage, a sample containing specific antibodies (Ab) was mixed with a
                       conjugate of an antigen with labeling particles (P) to form complexes of the labeled antigen
                       with one or two valencies of antibodies of PAb and P2 Ab composition, respectively:

                                                               P + Ab = PAb                                           (1)

                                                             P + PAb = P2 Ab                                          (2)
                             For simplicity, the formation of complexes of other compositions, potentially con-
                       taining any amount of P and Ab, were not considered. Until the analytical zone with the
                       immobilized antigen was reached, only those reactions were carried out proceed. In this
                       case, because the analytical zone is a thin line through which the reagents flows, it can be
                       assumed that the reactions in the analytical zone do not have time to affect the concen-
                       trations of free and labeled immunoglobulins. Therefore, the [P], [Ab], [PAb], and [P2 Ab]
                       concentrations are determined only by the reactions (1) and (2).
                             After reaching the analytical zone by the liquid front, three more reactions with the
                       immobilized antigen (Ag) began to proceed in it, expressed by the following Equations:

                                                            PAb + Ag = PAbAg                                          (3)

                                                             Ab + Ag = AbAg                                           (4)
                                                            P + AbAg = PAbAg                                          (5)
Sensors 2021, 21, 39                                                                                                                               7 of 16

                                       The complex of the composition PAbAg was examined. The rate of PAbAg formation
                                  determined the kinetic curve of the analysis, and the dependence of the final concentration
                                  [PAbAg] on the initial concentration of antibodies [Ab]0 provided the calibration curve
                                  of the analysis (here and below, the index 0 denotes the initial concentrations of the
                                  corresponding components). Each of the reactions, (1)–(5), is characterized by its own
                                  kinetic and equilibrium association and dissociation constants. Additionally, two time
                                  parameters are introduced to describe the system: t is the analysis time from the moment
                                  the sample contacts the labeled antigen, and T is the time from the contact of the sample
                                  with the labeled antigen to the contact of the sample with the analytical zone.
                                       To solve the differential equations describing the kinetics of the occurring reactions,
                                  a
Sensors 2021, 21, x FOR PEER REVIEW numerical approach was implemented in the COPASI program. The complete system       7 of of
                                                                                                                             16
                                  equations specified in the program is shown in Figure 2:

      Figure  2. The
      Figure 2.  The system
                     system of  differential equations
                             of differential equations describing
                                                       describing the
                                                                   the serodiagnostic
                                                                       serodiagnostic lateral
                                                                                      lateral flow
                                                                                              flow system
                                                                                                    system with
                                                                                                            with two
                                                                                                                  two antigens.
                                                                                                                      antigens. k1—
                                                                                                                                k1—
      kinetic constants of association of the  corresponding  reaction, k2—kinetic constants   of dissociation of the corresponding
      kinetic constants of association of the corresponding reaction, k2—kinetic constants of dissociation of the corresponding
      reaction, h—Heaviside function.
      reaction, h—Heaviside function.

                                  3.2. Formation of PAb and P2Ab Complexes
                                  3.2. Formation
                                        The antibody  of PAb    and P2 Absensitivity
                                                             detection        Complexesin the considered depends on the ratio of [PAb]
                                  and [PThe2Ab]   concentrations.
                                               antibody       detection   Assensitivity
                                                                              the P2Ab complex          does not depends
                                                                                           in the considered        have freeon   valences  forofthe
                                                                                                                                    the ratio         for-
                                                                                                                                                    [PAb]
                                  and [P2of
                                  mation     Ab]    concentrations.
                                                a detectable        PAbAgAs     the P2 Ab
                                                                              complex,     thecomplex
                                                                                                 formation  does
                                                                                                               of Pnot
                                                                                                                    2Abhave
                                                                                                                          is an free  valencesprocess.
                                                                                                                                 undesirable      for the
                                  formation
                                  For  highlyof     a detectable
                                                 sensitive             PAbAg
                                                                detection     ofcomplex,
                                                                                 antibodies  theinformation
                                                                                                     a sample,ofitPis 2 Ab  is an undesirable
                                                                                                                         necessary    to run theprocess.
                                                                                                                                                    assay
                                  For highly
                                  under           sensitive
                                           conditions       thatdetection
                                                                  maintainof     antibodies
                                                                               high   [PAb] and   in alow
                                                                                                        sample,
                                                                                                           [P2Ab]itconcentrations.
                                                                                                                      is necessary to run the assay
                                  under Theconditions       that maintain
                                              system simulated                 high
                                                                          in the      [PAb] program
                                                                                  COPASI      and low [P      2 Ab]
                                                                                                            for      concentrations.
                                                                                                                 arbitrarily   chosen concentrations
                                  [Ab]0The
                                         andsystem
                                               [P]0 gives simulated
                                                              the kinetic in the  COPASI
                                                                             curves    of PAb program
                                                                                                  and P2Ab forformation
                                                                                                                arbitrarily    chosen
                                                                                                                             shown   in concentrations
                                                                                                                                         Figure 3. From
                                  [Ab]data
                                  the   0 and    [P]0 gives
                                              obtained,          the kinetic
                                                             it follows     that,curves
                                                                                  for theof    PAb parameters,
                                                                                             given     and P2 Ab formation         shown in[PAb]
                                                                                                                       the concentration       Figure    3.
                                                                                                                                                      will
                                  From    the  data    obtained,      it follows   that,  for the   given    parameters,
                                  approach the equilibrium value by 90% in 76 s. At the same time, the concentration of       the concentration     [PAb]
                                  will
                                  [P   approach
                                     2Ab]             the equilibrium
                                            will approach                    value byby90%
                                                                 the equilibrium            96%.in Assuming
                                                                                                    76 s. At thethat
                                                                                                                   same thetime,  the concentration
                                                                                                                             concentrations    of [PAb] of
                                  [P
                                  and Ab]   will   approach       the  equilibrium      by  96%.    Assuming      that
                                     2 [P2Ab] further change insignificantly, the approximation of equilibrium conditionsthe  concentrations   of   [PAb]
                                  andbe
                                  can   [Papplied.
                                           2 Ab] furtherThis change        insignificantly,
                                                               approximation        is limited the   approximation
                                                                                                   because,               of equilibrium
                                                                                                              with a decrease               conditions
                                                                                                                                   of the components’
                                  can be applied. it
                                  concentrations,       Thiswillapproximation
                                                                   take more time    is limited
                                                                                        to reachbecause,       with conditions.
                                                                                                     equilibrium      a decrease of    the components’
                                                                                                                                    However,      the ap-
                                  concentrations,        it  will  take   more   time    to reach    equilibrium      conditions.
                                  proximation allows for the deriving of symbolic solutions of equations and determining             However,      the ap-
                                  proximation        allows    for   the
                                  regularities in the system functioning. deriving    of  symbolic      solutions   of  equations    and   determining
                                  regularities in the system functioning.
approach the equilibrium value by 90% in 76 s. At the same time, the concentration of
                        [P2Ab] will approach the equilibrium by 96%. Assuming that the concentrations of [PAb]
                        and [P2Ab] further change insignificantly, the approximation of equilibrium conditions
                        can be applied. This approximation is limited because, with a decrease of the components’
Sensors 2021, 21, 39    concentrations, it will take more time to reach equilibrium conditions. However,      the ap-
                                                                                                        8 of 16
                        proximation allows for the deriving of symbolic solutions of equations and determining
                        regularities in the system functioning.

                       Figure 3. Kinetics of changes in the concentrations of PAb and P2 Ab complexes (numerical model in
                       the COPASI program). Model parameters: T = 60 s; [P]0 = 2×10⁻⁶ M; [Ab]0 = 10−6 M; ka1 = ka2 =
                       105 1/(M×s); kd1 = kd2 = 2.5×10⁻³ 1/s. Dotted lines indicate equilibrium concentrations of [PAb]
                       and [P2 Ab].

                       3.3. Analytical Model of the Reactions (1) and (2) in Equilibrium Conditions
                            The equilibrium condition in the system is given by the expressions:

                                                                         [PAb]
                                                               Ka1 =                                                  (6)
                                                                        [P][Ab]

                                                                        [P2 Ab]
                                                              Ka2 =                                                   (7)
                                                                       [P][PAb]
                       where Ka1 and Ka2 are equilibrium constants of the reactions (1) and (2), respectively.
                            Together with the equations of the law of mass conservation, these equations set the
                       equilibrium concentrations of all components of the system:

                                                     [Ab]0 = [Ab] + [PAb] + [P2 Ab]                                   (8)

                                                      [P]0 = [P] + [PAb] + 2[P2 Ab]                                   (9)
                           After substituting into Equations (8) and (9) the expressions for PAb and P2 Ab obtained
                       from (6) and (7), the following was obtained:
                                                                                          
                                               [Ab]0 = [Ab] 1 + Ka1[P] + Ka1Ka2[P]2                             (10)

                                               [P]0 = [P](1 + Ka1[Ab] + 2Ka1Ka2[P][Ab])                             (11)
                            Substituting into equation (11) the expression for [Ab] obtained from (10), an equation
                       with one unknown [P] was obtained:
                                                                                           !
                                                                 Ka1 [Ab]0 (1 + 2Ka2[P])
                                             [P]0 = [P] 1 +                                                    (12)
                                                               1 + Ka1[P] + Ka1Ka2[P]2

                            This equation can be reduced to the form of a cubic equation:

                                                       [P]3 + a[P]2 + b[P] + c = 0                                  (13)
Sensors 2021, 21, 39                                                                                                                            9 of 16

                                     where a = Kd2 − [P]0 + 2[Ab]0 , b = Kd2×(Kd1 − [P]0 + [Ab]0 ) and c = −Kd1×Kd2×[P]0 .
                                          For convenience, the equilibrium association constants Ka1 and Ka2 were replaced by
                                     their reciprocal values—the equilibrium dissociation constants Kd1 and Kd2, respectively.
                                          To solve the cubic equation, Vieta’s trigonometric formulas was used, according to the
                                     recommendations of Wang [48].

                                                                                              a   2                       θ
                                                                                                      q
                                                                                    [P] = −     +         (a2 − 3b) cos                               (14)
                                                                                              3   3                       3
                                                                           3
                                     where θ = arc cos −2aq + 9ab − 27c
                                                                    3
                                                                        .
                                                                       2       ( a2 − 3b)
                                           This solution gives the equilibrium concentration [P]. Substituting it into equation
                                    (10), the equilibrium concentration [Ab] was found. Next, substituting the values [P] and
                                     [Ab] into equation (6), the equilibrium value [PAb] was found, and the obtained values
                                     [PAb] and [P] give the equilibrium concentration [P2 Ab] from Equation (7).
                                           Dependences of equilibrium concentrations [PAb] and [P2 Ab] on the initial concentra-
Sensors 2021, 21, x FOR PEER REVIEW  tion of labeled antigen [P]0 , shown in Figure 4, demonstrate that, if the [P]0 is close to 9theof 16
                                     concentration of the antibodies to be detected, then the equilibrium concentration of [PAb]
                                    will be maximum. At lower [P]0 , the [PAb] concentration decreases due to a lack of labeled
                                     antigen, and, at higher [P]0 , most of the antibodies and labeled antigen were contained
                                  byincurves
                                        the P21,Ab3,complex,
                                                      5, and 7 which
                                                                in Figure   4, thistodependence
                                                                       is unable                   is notzone.
                                                                                      bind in the assay   contingent   on the
                                                                                                                Moreover,     values by
                                                                                                                           as shown  and
                                  ratio  of the
                                     curves      equilibrium
                                              1, 3,             complexation
                                                    5, and 7 in Figure           constants of
                                                                        4, this dependence   is reactions  (1) and
                                                                                                not contingent  on (2).
                                                                                                                   the values and ratio
                                     of the equilibrium complexation constants of reactions (1) and (2).

                                                               1.0
                                        [Concentration] (μM)

                                                               0.8                                                            6
                                                                                                                              4
                                                               0.6
                                                                                                                   8          2
                                                               0.4                                                 7          1
                                                                                                                              3
                                                               0.2
                                                                                                                              5

                                                               0.0

                                                                 0.0   0.5                  1.0           1.5          2.0
                                                                                     [P]0 (μM)

                                      Figure
                                  Figure       4. Equilibrium
                                            4. Equilibrium       concentrationsofofPAb
                                                              concentrations            PAbandandPP2Ab
                                                                                                    2 Abcomplexes.
                                                                                                          complexes. Model
                                                                                                                        Model parameters:
                                                                                                                                parameters: [Ab]
                                                                                                                                             [Ab]00 =
                                                                                                                                                    = 11 µM;
                                                                                                                                                         μM;
                                      1. [PAb]
                                  1. [PAb]      at Kd1
                                             at Kd1       = Kd2
                                                      = Kd2  = 0.1= μM;
                                                                    0.1 µM;
                                                                         2. [P2.  [P2at
                                                                               2Ab]  Ab]  at =
                                                                                        Kd1    Kd1
                                                                                                Kd2= =Kd2  = 0.13.µM;
                                                                                                       0.1 μM;         3. [PAb]
                                                                                                                   [PAb]   at Kd1at=Kd1
                                                                                                                                    Kd2 == Kd2  = 0.01
                                                                                                                                           0.01 μM;   4. µM;
                                      4. [Pat
                                  [P2Ab]   2 Ab]
                                              Kd1at =Kd1
                                                      Kd2= =Kd2
                                                             0.01=μM;
                                                                    0.01 5.
                                                                         µM;   5. [PAb]
                                                                            [PAb]        at Kd1
                                                                                    at Kd1   = Kd2= Kd2  = 0.001
                                                                                                    = 0.001 μM;µM;6. [P6. [P2at
                                                                                                                       2Ab]  Ab] at Kd1
                                                                                                                                Kd1 = Kd2= Kd2  = 0.001
                                                                                                                                           = 0.001  μM;µM;7.
                                      7. [PAb]
                                  [PAb]         at Kd1
                                           at Kd1        = 0.001
                                                     = 0.001 μM,µM, Kd2Kd2    = 0.01
                                                                          = 0.01   μM;µM;   [P[P
                                                                                         8. 8. 2Ab]
                                                                                                 2 Ab]
                                                                                                     atat Kd1
                                                                                                        Kd1   == 0.001
                                                                                                                0.001   µM,
                                                                                                                       μM,   Kd2  = 0.01
                                                                                                                                    0.01 µM.
                                                                                                                                          μM.

                                          This
                                        This    modelpredicts
                                             model     predictsthe
                                                                theexistence
                                                                     existence of
                                                                                of an
                                                                                   an optimal
                                                                                      optimal relationship
                                                                                               relationshipbetween
                                                                                                             between[Ab][Ab]0 and [P]0 . 0.
                                                                                                                              0 and [P]
                                     However, it should be taken into account that the formation of a colored complex in the
                                  However, it should be taken into account that the formation of a colored complex in the
                                     analytical zone can also occur according to reaction (4), and the maximum concentration
                                  analytical zone can also occur according to reaction (4), and the maximum concentration
                                     of [PAb] promotes only the formation of PAbAg according to reaction (3). Therefore,
                                  of [PAb] promotes only the formation of PAbAg according to reaction (3). Therefore, the
                                     the optimal ratio of [Ab]0 and [P]0 in a real system will differ from 1:1. However, in any
                                  optimal   ratio
                                     case, the    of [Ab]0 of
                                                formation  anda [P] 0 in a real system will differ from 1:1. However, in any case,
                                                                P2 Ab   complex decreases the sensitivity of antibody detection.
                                  theOptimization
                                      formation ofofasystem
                                                       P2Ab complex
                                                              parameters decreases
                                                                            should bethe sensitivity
                                                                                       aimed         of antibody
                                                                                             at minimizing         detection.
                                                                                                             the effect          Optimi-
                                                                                                                        of reaction (2)
                                  zation  of system   parameters
                                     on the assay results.         should    be  aimed  at minimizing    the effect of  reaction  (2) on
                                  the assay results.

                                  4. Results and Discussion (Experimental)
                                  4.1. Overview
                                           For the model to adequately describe the real system, it is necessary to substitute into
Sensors 2021, 21, 39                                                                                                                            10 of 16

                               4. Results and Discussion (Experimental)
                               4.1. Overview
                                    For the model to adequately describe the real system, it is necessary to substitute into
                               the equations the parameters (complexation constants, component concentrations, time
                               parameters) that are as close as possible to real ones. For this, it is necessary to conduct an
                               experimental study of these parameters.
                                    Time parameters can be measured directly by observing the movement of the liquid
                               front and the colored marker along the test strip membranes. Determination of constants
                               and concentrations requires a more complex technique. To measure them, a model im-
                               munochromatographic test system was made for the determination of specific antibodies
                               against the Rv0934 protein. Solutions containing known concentrations of HTM81 mono-
                               clonal antibodies against this antigen were used as model samples.

                               4.2. Characterization of the Preparation of Gold Nanoparticles
                                        The dimensional parameters of the obtained gold nanoparticles were evaluated using
                                   the transmission electron microscopy. Particle images were obtained at a magnification of
 Sensors 2021, 21, x FOR PEER REVIEW                                                                                10 of 16
                                   66,000. Table 1 contains the data obtained after analyzing the photographs. The average
                                   particle diameter was 22.8 nm for a sample of 210 particles. The resulting preparation was
                                   stable, and no aggregates were observed.

                              Table 1. Characterization of the particle size and homogeneity of the obtained preparation of
                              gold nanoparticles.
                              Table 1. Characterization of the particle size and homogeneity of the obtained preparation of gold
                              nanoparticles.                 Major Axis Length (nm)    Minor Axis Length (nm)         Axis Ratio
                                 Average diameter (nm)                   22.8Length (nm)
                                                                  Major Axis                              18.5 Length (nm)
                                                                                                    Minor Axis                         0.845
                                                                                                                                     Axis Ratio
                                Standard deviation
                                Average  diameter (nm)
                                                   (nm)                   4.1
                                                                           22.8                            2.918.5                     0.095
                                                                                                                                       0.845
                                Standard deviation (nm)                     4.1                               2.9                      0.095
                              4.3. Determination of the Constants of Immune Interaction
                              4.3. Determination of the Constants of Immune Interaction
                                    Sensograms of the interaction of antigen with antibodies were obtained using the
                                   Sensograms
                              surface  plasmon of   the interaction
                                                 resonance   sensor of  antigen
                                                                      BIAcore X,with  antibodies
                                                                                 passing  over thewere obtained
                                                                                                   surface  of theusing  thechip
                                                                                                                   optical
                              surface plasmon   resonance  sensor  BIAcore  X, passing  over the surface of the optical
                              with immobilized antibodies HTM81 solutions containing from 0.5 to 50 µg/mL of Rv0934     chip
                              with  immobilized
                              antigen  (Figure 5).antibodies HTM81 solutions containing from 0.5 to 50 μg/mL of Rv0934
                              antigen (Figure 5).

                              Figure
                              Figure5.5.Sensograms
                                           Sensograms of the
                                                          of interaction of the of
                                                             the interaction    Rv0934   antigen antigen
                                                                                   the Rv0934      with the surface
                                                                                                               with the   of the  CM5 of
                                                                                                                              surface  chipthemodi-
                                                                                                                                               CM5 chip
                              fied with the
                              modified       HTM81
                                          with       antibodies.
                                                the HTM81         AntigenAntigen
                                                              antibodies.   concentration   0.5; 1; 3; 5;0.5;
                                                                                     concentration        10; 20;
                                                                                                              1; 3;30;5;40;
                                                                                                                         10;and
                                                                                                                              20; 50
                                                                                                                                  30;μg/mL.
                                                                                                                                      40; andDotted
                                                                                                                                               50 µg/mL.
                              lines
                              Dottedshow   the show
                                        lines  beginning
                                                     the and   end of the
                                                          beginning    andtime
                                                                             endinterval
                                                                                   of thefortime
                                                                                              the flow   of antigen
                                                                                                   interval    for the  solutions
                                                                                                                            flow ofthrough
                                                                                                                                      antigenthesolutions
                              sensor cell. The signal is the difference between RU values in the analytical cell and the compari-
                              through the sensor cell. The signal is the difference between RU values in the analytical cell and the
                              son cell.
                              comparison cell.
                                   Using the equilibrium conditions approximation, the equilibrium association con-
                              stant (Ka) was determined via the Scatchard method based on an analysis of association
                              sensograms. Then, the kinetic dissociation constant (kd) was found from the dissociation
                              curves of immune complexes. After finding Ka and kd, the kinetic association constant
                              (ka) and the equilibrium dissociation constant (Kd) were calculated using the expressions
Sensors 2021, 21, 39                                                                                               11 of 16

                            Using the equilibrium conditions approximation, the equilibrium association con-
                       stant (Ka) was determined via the Scatchard method based on an analysis of association
                       sensograms. Then, the kinetic dissociation constant (kd) was found from the dissociation
                       curves of immune complexes. After finding Ka and kd, the kinetic association constant
                       (ka) and the equilibrium dissociation constant (Kd) were calculated using the expressions
                       Ka = ka/kd; Kd = kd/ka. Table 2 provides the values of kinetic and equilibrium constants
                       for the studied antigen–antibody pair.

                       Table 2. Kinetic and equilibrium constants of the interaction of the Rv0934 antigen with monoclonal
                       antibodies HTM81.

                              ka (1/Ms)                 kd (1/s)                Ka (1/M)                 Kd (M)
                              1.08 × 10⁵              2.54 × 10⁻³              4.27 × 10⁷              2.34 × 10⁻⁸

                       4.4. Determination of the Concentration of the Labeled Antigen
                            When antigen is conjugated to label particles, excessive amounts of antigen are usually
                       used to maximize the binding capacity of the conjugate. In addition, part of the antigen
                       loses binding activity due to the covering of epitopes by label particles. For this reason,
                       the concentration of binding sites on the label conjugate is unknown. To determine this
                       value, a technique based on measuring the fluorescence of tryptophan residues in antibod-
                       ies was used. Determination of protein concentration based on tryptophan fluorescence
                       was described in detail in our previous work [49].
                            The Rv0934 protein conjugated to gold nanoparticles (optical density at 520 nm
                       was equal to 2) was mixed with a solution containing 80 µg/mL of antibodies (excessive
                       concentration, since Rv0934 was conjugated to nanoparticles at a concentration of 10 µg/mL
                       per 1 optical density unit). After incubation, the formed complexes with nanoparticles
                       were separated via centrifugation, and the fluorescence of tryptophan in the solution was
                       measured. Comparing the obtained value with the fluorescence of the calibration solution,
                       the concentration of the remaining antibodies was calculated, which was 66 µg/mL. That is,
                       the conjugate bound 14 µg/mL antibodies (93 nM) were at an optical density of 2.

                       4.5. Experimental Verification of Theoretical Relationships
                             Theoretical modeling of this system predicts the appearance of the so-called hook effect
                       on the calibration curve—a drop in the signal at high analyte concentrations (Figure 6A).
                       This effect, confirmed experimentally (see Figure 6B), is associated with the fact that the
                       antibodies block all antigen on the marker (gold nanoparticles), and the antibody excess
                       remains in the solution. After the solution reaches the analytical zone, free and label-bound
                       antibodies begin to compete to bind with the immobilized antigen, which leads to a decrease
                       in coloration. Experimental confirmation of the theoretically predicted effect demonstrates
                       the predictive capabilities of the developed model.
                             As seen in Figure 6, with the indicated parameters of the immunoreactants, the posi-
                       tion of the maximum on the calibration curve shifts with time toward lower concentrations,
                       but stabilizes in about 3 min. Note that the model predicts the position of the maximum
                       of the calibration dependence at lower concentrations than observed in the experiment.
                       This may be due to the simplifications introduced into the model, as well as the fact that
                       the concentration of active antibodies in the preparation is somewhat lower than their
                       total concentration.
nation of antibodies for three concentrations of the immobilized antigen. According to the
                                          study conducted by Merck-Millipore employees, the sorption capacity of immunochro-
                                          matographic nitrocellulose membranes varies in the range of 4–15 mg/mL
                                          (https://www.merckmillipore.com/RU/ru/products/ivd-oem-materials-reagents/lateral-
                                          flow-membranes/n6mb.qB.L0YAAAE_gut3.Lxi,nav). This study was carried out using
Sensors 2021, 21, 39                      the example of immunoglobulins G; however, since the molecular weight and volume are 12 of 16
                                          approximately proportional for globular proteins, this amount will be similar for other
                                          proteins.

                                                                                                                                                           40

                                                                                       analytical zone (arb. units)
                                                                                                                                                           30

                                                                                         Color intensity of the
                                                                                                                                                           20

                                                                                                                                                           10

       Sensors 2021, 21, x FOR PEER REVIEW                                                                                                                                                                         12 of 16
                                                                                                                                                           0
                                                                                                                                                           0.01          0.1                     1            10
                                                                                                                                                                               [Ab]0 (μM)
                                        Figure 8 shows the appearance of the analytical zones of the test strips after the determi-
                                         (A)                                                                     (B)
                                        nation of antibodies for three concentrations of the immobilized antigen. According to the
            Figure 6. Calibration dependences   of analyte determination.
                                        study conducted                        (A) Theoretical
                                                                by Merck-Millipore              calibration
                                                                                          employees,    the dependence    obtainedofbyimmunochro-
                                                                                                             sorption capacity         numeri-
      Figure 6. Calibration dependences of analyte determination.             (A) Theoretical    calibration   dependence −3obtained by numerical
            cal modeling. Model parameters:
                                        matographic          0 = 5 × 10⁻⁷ M; [Ag]
                                               T = 60 s; [P]nitrocellulose        0 = 10−5 M; ka =
                                                                                membranes          105 1/(M*s);
                                                                                                 varies     in kd
                                                                                                                the= 2.5 × 10 1/s.
                                                                                                                       range    of (B). Experi-
                                                                                                                                     4–15   mg/mL
                                                                          − 7                  − 5               5            kd = 2.5 × 10⁻³ 1/s.
      modeling.
            mentalModel    parameters:
                   values of               T = 60
                             the color intensity of s;
                                                    the[P] 0 = 5 ×zones
                                                        analytical     10 after
                                                                              M; the
                                                                                 [Ag]   0 = 10
                                                                                      assay (signalM;   ka the
                                                                                                     from   = 10   1/(M*s);
                                                                                                               Reflekom  analyzer).
                                        (https://www.merckmillipore.com/RU/ru/products/ivd-oem-materials-reagents/lateral-
      (B). Experimental values of theflow-membranes/n6mb.qB.L0YAAAE_gut3.Lxi,nav).
                                         color intensity of the analytical zones after the assay (signal             from the
                                                                                                             This study    wasReflekom    analyzer).
                                                                                                                                carried out   using
                                        the example of immunoglobulins G; however, since the molecular weight and volume are
                                            In real samples, the concentration of160            specific antibodies against individual antigens
                                        approximately proportional for globular proteins,                 this amount will be similar for other

                                                                                                                            analytical zone (arb. units)
                                     rarely   exceeds
                                        proteins.         2  µM,    even    in  hyperimmune   140   sera [36]. Therefore, a decrease in the color
                                                                                                                  Color intensity of the
                                       intensity to an undetectable limit is unlikely.            120   In addition, the influence of the hook effect
                                       on the analysis results can be eliminated by               100  diluting    the sample.
                                              As already noted, one of the ways to control       4080         the sensitivity of the assay is to optimize
                                       the concentration of the labeled antigen. To                60 verify this assumption, a series of test strips
                                                                                        analytical zone (arb. units)

                                       were made with different amounts of added                 3040 antigen-gold nanoparticle conjugate, and a
                                                                                          Color intensity of the

                                       solution containing 20 µg/mL of antibodies                  20 was analyzed. The theoretical dependence

                                       calculated in the COPASI program (see20Figure                 0        7A) predicts the appearance of a maxi-
                                                                                                          0      2       4        6     8     10
                                       mum at the point corresponding to a twofold excess of[P]0the                         (D )[P]0 concentration relative
                                                                                                 10                                                                                    520

                                       to the concentration of added antibodies. The experimental dependence had a similar
                                          (A)                                                                         (B)
                                       shape and confirmed the existence of the optimal concentration                                  of the labeled antigen
                                                                                                  0
             Figure 7. Dependences of(see
                                        analyte determination   at different  concentrations
                                              Figure 7B). However, according to the           of  labeled   antigen (A)  Theoretical
                                                                                                      calculated0.1concentration      dependence
                                                                                                                                          of the 10ob-
                                                                                                                                                 active antigen
                                                                                                   0.01                             1
             tained by numerical simulation.   Model  parameters:  T = 60 s; [P]0 = 5 × 10⁻⁷ M; [Ag]0 = 10−5 M; ka = 105 1/(M*s); kd = 2.5 × 10⁻³ 1/s.
                                       on nanoparticles, the maximum of the obtained dependence                        [Ab]0 (μMturned
                                                                                                                                 )        out to be lower than
             (B). Experimental values of the color intensity (signal from the Reflekom analyzer) of analytical zones after the assay at
                                       that
                                         (A) predicted
             different optical densities (D520)
                                                            by the model. This fact can also be associated
                                                 of the label conjugate.                                             (B)            with a partial loss of the
                                       antibody activity during storage, as well as with the influence of factors not taken into
             Figure 6. Calibration dependences of analyte determination. (A) Theoretical calibration dependence obtained by numeri-
                                       account by the model—for example, the possibility of the formation of complexes of a more
             cal modeling. Model parameters: T = 60 s; [P]0 = 5 × 10⁻⁷ M; [Ag]0 = 10−5 M; ka = 105 1/(M*s); kd = 2.5 × 10⁻³ 1/s. (B). Experi-
             mental values of the colorcomplicated       composition.
                                          intensity of the analytical zones after the assay (signal from the Reflekom analyzer).

                                                                                                                                                            160
                                                                                                       analytical zone (arb. units)

                                                                                                                                                            140
                                                                                                         Color intensity of the

                                                                                                                                                            120
                                                                                                                                                            100
                                                                                                                                                                80
                                                                                                                                                                60
                                                                                                                                                                40
                                                                                                                                                                20
                                                                                                                                                                0
                                                                                                                                                                     0   2       4           6       8   10
                                                                                                                                                                                [P]0 (D520)

                                         (A)                                                                                                                                   (B)
             Figure 7. Dependences of analyte determination at different concentrations of labeled antigen (A) Theoretical dependence ob-
      Figure 7. Dependences of analyte determination at different concentrations               of labeled antigen (A) Theoretical dependence
             tained by numerical simulation. Model parameters: T = 60 s; [P]0 = 5 × 10⁻⁷ M; [Ag]0 = 10−5 M; ka = 105 1/(M*s); kd = 2.5 × 10⁻³ 1/s.
      obtained    by numerical   simulation.    Model    parameters:    T =  60  s; [P]
             (B). Experimental values of the color intensity (signal from the Reflekom  0 =  5 ×  10−7ofM;
                                                                                             analyzer)                  10−5 after
                                                                                                             [Ag]0 =zones
                                                                                                          analytical           M; ka      105 1/(M*s);
                                                                                                                                    the=assay   at
      kd = 2.5  × 10−optical
             different 3 1/s. densities
                              (B). Experimental    values
                                        (D520) of the label of the color intensity (signal from the Reflekom analyzer) of analytical zones
                                                            conjugate.
      after the assay at different optical densities (D520) of the label conjugate.
Sensors 2021, 21, 39                                                                                                             13 of 16

                                         Another parameter that affects the sensitivity of the system is the concentration of
                                    the immobilized antigen in the analytical zone [Ag]0 . In this case, it is obvious that an
                                    increase in [Ag]0 leads to an acceleration of the formation of PAbAg both by reactions
                                    (3) and (5). Therefore, an increase in the sensitivity and assay signal presupposes the
                                    use of the maximum possible antigen concentrations in the analytical zone and is limited
                                    only by the sorption capacity of the working membrane (depending on the brand and
                                    manufacturer). This assumes, however, the complete absence of nonspecific interaction
                                    in the system. If there is such an interaction, it will limit the analytical characteristics
                                    of the assay. Figure 8 shows the appearance of the analytical zones of the test strips
                                    after the determination of antibodies for three concentrations of the immobilized anti-
                                    gen. According to the study conducted by Merck-Millipore employees, the sorption
                                    capacity of immunochromatographic nitrocellulose membranes varies in the range of
                                    4–15 mg/mL (https://www.merckmillipore.com/RU/ru/products/ivd-oem-materials-
                                    reagents/lateral-flow-membranes/n6mb.qB.L0YAAAE_gut3.Lxi,nav). This study was
                                    carried out using the example of immunoglobulins G; however, since the molecular weight
Sensors 2021, 21, x FOR PEER REVIEW                                                                                             13 of 16
                                    and volume are approximately proportional for globular proteins, this amount will be
                                    similar for other proteins.

          Figure
     Figure      8. Influence
            8. Influence      of concentrationofofthe
                           of concentration        the immobilized
                                                        immobilized antigen
                                                                     antigen onon
                                                                                thethe
                                                                                    coloration of analytical
                                                                                       coloration            zone (appearance
                                                                                                    of analytical             of working
                                                                                                                   zone (appearance   of work-
          membranes   for antibody concentration   200  ng/mL, D520  of the antigen conjugate with  gold nanoparticles—2).
     ing membranes for antibody concentration 200 ng/mL, D520 of the antigen conjugate with gold nanoparticles—2). A—      A—analytical
          zone; C—control
     analytical             zone. zone.
                zone; C—control

                                    5. Conclusions
                                       5. Conclusions
                                          Utilizing
                                            Utilizingimmunochromatographic               serodiagnostics
                                                        immunochromatographic serodiagnostics             withwith
                                                                                                                twotwo   antigens
                                                                                                                     antigens        appears
                                                                                                                               appears  to be to be
                                       effective for  detecting    specific immunoglobulins       against   the  background
                                    effective for detecting specific immunoglobulins against the background of a multiple ex-  of a multiple
                                       excess
                                    cess       of total
                                          of total       immunoglobulins
                                                   immunoglobulins           in in
                                                                                thethe sample.Unlike
                                                                                     sample.     Unlikeother
                                                                                                           otherformats
                                                                                                                  formatsofof immunochromato-
                                                                                                                               immunochro-
                                       matographic    serodiagnostics,    this format  has  not received   a theoretical
                                    graphic serodiagnostics, this format has not received a theoretical description.     description.  In ourIn our
                                       work, a mathematical model of immunochemical interactions in the system was proposed,
                                    work, a mathematical model of immunochemical interactions in the system was proposed,
                                       which makes it possible to assess the influence of the parameters of immunochemical
                                    which   makes
                                       reactions  on it
                                                      thepossible
                                                           analysisto   assessThis
                                                                      results.   the model
                                                                                     influence   of for
                                                                                            allows   thethe
                                                                                                          parameters
                                                                                                             formulationof of
                                                                                                                           immunochemical
                                                                                                                              predictions in      re-
                                    actions  on  the  analysis    results.  This   model   allows   for the  formulation
                                       the behavior of the analytical system and provides recommendations for increasing theof  predictions   in the
                                    behavior    of of
                                       sensitivity theantibody
                                                         analytical    systemThe
                                                                  detection.     and  provides
                                                                                   model         recommendations
                                                                                           predicts                      for increasing
                                                                                                     that the detection limit              the sen-
                                                                                                                               for antibodies
                                    sitivity
                                       can beof  antibody
                                               reduced         detection.
                                                          if the following The    model predicts that the detection limit for antibodies
                                                                            are done:
                                    can
                                      1. be reduced  if the following
                                            Use the concentration of theare done:antigen with approximately twice the concentra-
                                                                         labeled
                                    1.    Usetion
                                                theofconcentration
                                                      active antibodies of in the
                                                                            the   sample.antigen
                                                                                labeled    As the concentration of antibodies
                                                                                                  with approximately      twiceagainst the
                                                                                                                                 the concentra-
                                             antigen   used  is initially unknown,   it is necessary to experimentally titrate the
                                          tion of active antibodies in the sample. As the concentration of antibodies against the  amount
                                             of labeled antigen to achieve the target sensitivity.
                                          antigen used is initially unknown, it is necessary to experimentally titrate the amount
                                          of labeled antigen to achieve the target sensitivity.
                                    2.    Use the highest possible concentration of the immobilized antigen in the analytical
                                          zone, but not exceeding the sorption capacity of the working membrane.
                                          The stated regularities were demonstrated in the system for the determination of spe-
Sensors 2021, 21, 39                                                                                                                       14 of 16

                                    2.     Use the highest possible concentration of the immobilized antigen in the analytical
                                           zone, but not exceeding the sorption capacity of the working membrane.
                                         The stated regularities were demonstrated in the system for the determination of
                                    specific immunoglobulins against the Mycobacterium tuberculosis Rv0934 protein. However,
                                    the recommendations are of a general nature and can be applied to improve other analytical
                                    systems based on the principle of double-antigen sandwich immunochromatographic
                                    serodiagnostics.

                                    Author Contributions: Conceptualization, D.V.S., A.V.Z. and B.B.D.; investigation, D.V.S.; methodol-
                                    ogy, D.V.S., A.V.Z. and B.B.D.; resources, D.V.S.; validation, D.V.S.; visualization, D.V.S. and A.V.Z.;
                                    writing (original draft), D.V.S., A.V.Z. and B.B.D.; Writing (review and editing), D.V.S., A.V.Z. and
                                    B.B.D. All authors have read and agreed to the published version of the manuscript.
                                    Funding: The work was financially supported by the Ministry of Science and Higher Education
                                    of the Russian Federation (theoretical description of intermolecular interactions) and the Russian
                                    Science Foundation (grant 16-15-00245; experimental verification of theoretical relationships).
                                    Data Availability Statement: Data is contained within the article. The created COPASI file for mod-
                                    elling, data of calculations and verifications are available on request from the corresponding author.
                                    Acknowledgments: This study was conducted using the Shared-Access Equipment Centre
                                    “Industrial Biotechnology” of the Federal Research Centre “Fundamentals of Biotechnology” Russian
                                    Academy of Sciences (A.N. Bach Institute of Biochemistry), Moscow, Russia.
                                    Conflicts of Interest: The authors declare no conflict of interest.

References
1.    Parija, S.C. Textbook of Microbiology & Immunology-E-Book; Reed Elsevier India Pvt. Ltd.: Maharashtra, India, 2014; p. 684.
2.    Tille, P. Bailey & Scott’s Diagnostic Microbiology-E-Book; Elsevier Health Sciences: New York, NY, USA, 2013; p. 1056.
3.    Hamilton, R.G.; Hemmer, W.; Nopp, A.; Kleine-Tebbe, J. Advances in IgE testing for diagnosis of allergic disease. J. Allergy Clin.
      Immunol. Pract. 2020, 8, 2495–2504. [CrossRef]
4.    Mohiuddin, M. Tuberculosis–burden and serodiagnosis. IMC J. Med. Sci. 2020, 14, 59–69. [CrossRef]
5.    Jenabian, M.A.; Costiniuk, C.T.; Talla, P.; Robin, L.; Tonen Wolyec, S.; Mboumba Bouassa, R.S.; Bélec, L. Potential for False-Positive
      Results with Serological Assays for HIV in Central Africa: Implications for the HIV Serodiagnosis Algorithm According to the
      2015 Consolidated WHO Recommendations for Resource-Constrained Countries. AIDS Res. Hum. Retrovir. 2017, 33, 1077–1079.
      [CrossRef]
6.    Feng, X.; Xiu, B.; Chen, K.; Yang, X.; Zhang, H.; Yue, J.; Tan, Y.; Li, H.; Nicholson, R.A.; Tam, A.W.; et al. Enhanced serodiagnostic
      utility of novel Mycobacterium tuberculosis polyproteins. J. Infect. 2013, 66, 366–375. [CrossRef]
7.    Mani, V.; Paleja, B.; Larbi, K.; Kumar, P.; Tay, J.A.; Siew, J.Y.; Inci, F.; Wang, S.; Chee, C.; Wang, Y.T.; et al. Microchip-based ultrafast
      serodiagnostic assay for tuberculosis. Sci. Rep. 2016, 6, 35845. [CrossRef]
8.    Mezzasoma, L.; Bacarese-Hamilton, T.; Di Cristina, M.; Rossi, R.; Bistoni, F.; Crisanti, A. Antigen microarrays for serodiagnosis of
      infectious diseases. Clin. Chem. 2002, 48, 121–130. [CrossRef]
9.    Cheng, M.P.; Yansouni, C.P.; Basta, N.E.; Desjardins, M.; Kanjilal, S.; Paquette, K.; Caya, C.; Semret, M.; Quach, C.; Libman, M.;
      et al. Serodiagnostics for severe acute respiratory syndrome-related Coronavirus 2: A narrative review. Ann. Intern. Med. 2020,
      173, 450–460. [CrossRef]
10.   Pecora, N.D.; Zand, M.S. Measuring the serologic response to severe acute respiratory syndrome coronavirus 2: Methods and
      meaning. Clin. Lab. Med. 2020, 40, 603–614. [CrossRef]
11.   Bastos, M.L.; Tavaziva, G.; Abidi, S.K.; Campbell, J.R.; Haraoui, L.P.; Johnston, J.C.; Lan, Z.; Law, S.; MacLean, E.; Trajman, A.; et al.
      Diagnostic accuracy of serological tests for covid-19: Systematic review and meta-analysis. BMJ 2020, 370, m2516. [CrossRef]
12.   Lehman, D.C. Immunodiagnosis of Infectious Diseases. In Textbook of Diagnostic Microbiology, 4th ed.; Mahon, C., Lehman, D., Eds.;
      Saunders: Yonkers, NY, USA, 2014; p. 200.
13.   Kozel, T.R.; Burnham-Marusich, A.R. Point-of-Care testing for infectious diseases: Past, present, and future. J. Clin. Microbiol.
      2017, 55, 2313–2320. [CrossRef]
14.   Hanafiah, K.M.; Garcia, M.; Anderson, D. Point-of-care testing and the control of infectious diseases. Biomark. Med. 2013,
      7, 333–347. [CrossRef] [PubMed]
15.   Katoba, J.; Kuupiel, D.; Mashamba-Thompson, T.P. Toward improving accessibility of point-of-care diagnostic services for
      maternal and child health in low- and middle-income countries. Point Care 2019, 18, 17–25. [CrossRef] [PubMed]
16.   Riccò, M.; Ferraro, P.; Gualerzi, G.; Ranzieri, S.; Henry, B.M.; Said, Y.B.; Pyatigorskaya, N.; Nevolina, E.; Wu, J.; Bragazzi, N.L.; et al.
      Point-of-Care diagnostic tests for detecting SARS-CoV-2 antibodies: A systematic review and meta-analysis of real-world data.
      J. Clin. Med. 2020, 9, 1515. [CrossRef] [PubMed]
Sensors 2021, 21, 39                                                                                                                  15 of 16

17.   Reali, S.; Najib, E.Y.; Balázs, K.E.T.; Tan, A.C.H.; Váradi, L.; Hibbs, D.E.; Groundwater, P.W. Novel diagnostics for point-of-care
      bacterial detection and identification. RSC Adv. 2019, 9, 21486–21497. [CrossRef]
18.   Heidt, B.; Siqueira, W.F. Point of care diagnostics in resource-limited settings: A review of the present and future of PoC in its
      most needed environment. Biosensors 2020, 10, 133. [CrossRef]
19.   Quesada-González, D.; Merkoçi, A. Nanoparticle-based lateral flow biosensors. Biosens. Bioelectron. 2015, 73, 47–63. [CrossRef]
20.   Huang, X.; Aguilar, Z.P.; Xu, H.; Lai, W.; Xiong, Y. Membrane-based lateral flow immunochromatographic strip with nanoparticles
      as reporters for detection: A review. Biosens. Bioelectron. 2016, 75, 166–180. [CrossRef]
21.   Goryacheva, I.Y.; Lenain, P.; De Saeger, S. Nanosized labels for rapid immunotests. Trends Analyt. Chem. 2013, 46, 30–43.
      [CrossRef]
22.   Van Amerongen, A.; Veen, J.; Arends, H.A.; Koets, M. Lateral Flow Immunoassays. In Handbook of Immunoassay Technologies,
      1st ed.; Vashist, S.K., Luong, J.H.T., Eds.; Academic Press: Cambridge, MA, USA, 2018; pp. 157–182.
23.   Soh, J.H.; Chan, H.-M.; Ying, J.Y. Strategies for developing sensitive and specific nanoparticle-based lateral flow assays as
      point-of-care diagnostic device. Nano Today 2020, 30, 100831. [CrossRef]
24.   Abdoel, T.; Dias, I.T.; Cardoso, R.; Smits, H.L. Simple and rapid field tests for brucellosis in livestock. Vet. Microbiol. 2008,
      130, 312–319. [CrossRef]
25.   Sotnikov, D.V.; Byzova, N.A.; Zherdev, A.V.; Eskendirova, S.Z.; Baltin, K.K.; Mukanov, K.K.; Ramankulov, E.M.; Sadykhov, E.G.;
      Dzantiev, B.B. Express immunochromatographic detection of antibodies against Brucella abortus in cattle sera based on quantita-
      tive photometric registration and modulated cut-off level. J. Immunoass. Immunochem. 2015, 36, 80–90. [CrossRef] [PubMed]
26.   Nakano, S.; Tsukimura, T.; Togawa, T.; Ohashi, T.; Kobayashi, M.; Takayama, K.; Kobayashi, Y.; Abiko, H.; Satou, M.;
      Nakahata, T.; et al. Rapid immunochromatographic detection of serum Anti-α-Galactosidase A antibodies in fabry patients after
      enzyme replacement therapy. PLoS ONE 2015, 10, e0128351. [CrossRef] [PubMed]
27.   Janwan, P.; Intapan, P.M.; Yamasaki, H.; Rodpai, R.; Laummaunwai, P.; Thanchomnang, T.; Sanpool, O.; Kobayashi, K.;
      Takayama, K.; Kobayashi, Y.; et al. Development and usefulness of an immunochromatographic device to detect antibodies for
      rapid diagnosis of human gnathostomiasis. Parasit. Vectors 2016, 9, 14. [CrossRef] [PubMed]
28.   Struyf, F.; Lemmens, A.; Valadas, E.; Verhaegen, J.; Van Ranst, M. Usefulness of immunochromatographic detection of antibodies
      to mycobacterium tuberculosis as an adjunct to auramine staining for rapid diagnosis of tuberculosis in a low-prevalence setting.
      Eur. J. Clin. Microbiol. Infect. Dis. 1999, 18, 740–742. [CrossRef]
29.   Schrier, W.H.; Schoengold, R.J.; Baker, J.T.; Norell, J.L.; Jaseph, C.L.; Okin, Y.; Doe, J.Y.; Chandler, H. Development of FlexSure®
      HP—An immunochromatographic method to detect antibodies against Helicobacter pylori. Clin. Chem. 1998, 44, 293–298.
      [CrossRef]
30.   Sotnikov, D.V.; Berlina, A.N.; Zherdev, A.V.; Eskendirova, S.Z.; Mukanov, K.K.; Ramankulov, Y.M.; Eskendirova, S.Z.;
      Mukantayev, K.N.; Dzantiev, B.B. Comparison of three schemes of quantum dots-based immunochromatography for
      serodiagnosis of brucellosis in cattle. J. Eng. Stud. Res. 2019, 14, 3711–3718. [CrossRef]
31.   Kemper, M.J.; Altrogge, H.; Ganschow, R.; Müller-Wiefel, D.E. Serum levels of immunoglobulins and IgG subclasses in steroid
      sensitive nephrotic syndrome. Pediatr. Nephrol. 2002, 17, 413–417. [CrossRef]
32.   Rajerison, M.; Dartevelle, S.; Ralafiarisoa, L.A.; Bitam, I.; Tuyet, D.T.N.; Andrianaivoarimanana, V.; Nato, F.; Rahalison, L.
      Development and evaluation of two simple, rapid immunochromatographic tests for the detection of Yersinia pestis antibodies in
      humans and reservoirs. PLoS Negl. Trop. Dis. 2009, 3, e421. [CrossRef]
33.   Karakus, C.; Salih, B.A. Comparison of the lateral flow immunoassays (LFIA) for the diagnosis of Helicobacter pylori infection.
      J. Immunol. Methods 2013, 396, 8–14. [CrossRef]
34.   Martínez-Sernández, V.; Muino, L.; Perteguer, M.J.; Garate, T.; Mezo, M.; Gonzalez-Warleta, M.; Muro, A.; Correia da Costa, J.M.;
      Romaris, F.; Ubeira, F.M. Development and evaluation of a new lateral flow immunoassay for serodiagnosis of human fasciolosis.
      PLoS Negl. Trop. Dis. 2011, 5, e1376. [CrossRef]
35.   Ben-Selma, W.; Harizi, H.; Boukadida, J. Immunochromatographic IgG/IgM test for rapid diagnosis of active tuberculosis.
      Clin. Vaccine Immunol. 2011, 18, 2090–2094. [CrossRef] [PubMed]
36.   Sotnikov, D.V.; Zherdev, A.V.; Dzantiev, B.B. Theoretical and experimental comparison of different formats of immunochromato-
      graphic serodiagnostics. Sensors 2017, 18, 36. [CrossRef] [PubMed]
37.   Sotnikov, D.V.; Zherdev, A.V.; Avdienko, V.G.; Dzantiev, B.B. Immunochromatographic assay for serodiagnosis of tuberculosis
      using an antigen-colloidal gold conjugate. Appl. Biochem. Microbiol. 2015, 51, 834–839. [CrossRef]
38.   Wu, H.S.; Chiu, S.C.; Tseng, T.C.; Lin, S.F.; Lin, J.H.; Hsu, Y.H.; Wang, M.C.; Lin, T.L.; Yang, W.Z.; Ferng, T.L.; et al. Serologic and
      molecular biologic methods for SARS-associated coronavirus infection, Taiwan. Emerg. Infect. Dis. 2004, 10, 304–310. [CrossRef]
39.   Sato, N.S.; Melo, C.S.D.; Zerbini, L.C.; Silveira, E.P.; Fagundes, L.J.; Ueda, M. Assessment of the rapid test based on an
      immunochromatography technique for detecting anti-Treponema pallidum antibodies. Rev. Inst. Med. Trop. Sao Paulo 2003,
      45, 319–322. [CrossRef]
40.   Vrublevskaya, V.V.; Afanasyev, V.N.; Grinevich, A.A.; Skarga, Y.Y.; Gladyshev, P.P.; Ibragimova, S.A.; Krylsky, D.V.; Dezhurov, S.V.;
      Morenkov, O.S. A sensitive and specific lateral flow assay for rapid detection of antibodies against glycoprotein B of Aujeszky’s
      disease virus. J. Virol. Methods 2017, 249, 175–180. [CrossRef]
41.   Berli, C.L.A.; Kler, P.A. A quantitative model for lateral flow assays. Microfluid. Nanofluid. 2016, 20, 104. [CrossRef]
You can also read