The Functional Role of Zinc Finger E Box-Binding Homeobox 2 (Zeb2) in Promoting Cardiac Fibroblast Activation
←
→
Page content transcription
If your browser does not render page correctly, please read the page content below
International Journal of
           Molecular Sciences

Article
The Functional Role of Zinc Finger E Box-Binding
Homeobox 2 (Zeb2) in Promoting Cardiac
Fibroblast Activation
Fahmida Jahan 1,3 , Natalie M. Landry 2,3 , Sunil G. Rattan 2,3 , Ian M. C. Dixon 2,3
and Jeffrey T. Wigle 1,3, *
 1    Department of Biochemistry and Medical Genetics, University of Manitoba, Winnipeg, MB R3E0J9, Canada;
      fjaha037@uottawa.ca
 2    Department of Physiology and Pathophysiology, University of Manitoba, Winnipeg, MB R3E0J9, Canada;
      nlandry@sbrc.ca (N.M.L.); srattan@sbrc.ca (S.G.R.); idixon@sbrc.ca (I.M.C.D.)
 3    Institute of Cardiovascular Sciences, St. Boniface Hospital Albrechtsen Research Centre, Max Rady College
      of Medicine, Rady Faculty of Health Sciences, University of Manitoba, Winnipeg, MB R2H2A6, Canada
 *    Correspondence: jwigle@sbrc.ca; Tel.: +1-204-235-3953

 Received: 5 September 2018; Accepted: 5 October 2018; Published: 17 October 2018

 Abstract: Following cardiac injury, fibroblasts are activated and are termed as myofibroblasts,
 and these cells are key players in extracellular matrix (ECM) remodeling and fibrosis, itself a
 primary contributor to heart failure. Nutraceuticals have been shown to blunt cardiac fibrosis
 in both in-vitro and in-vivo studies. However, nutraceuticals have had conflicting results in clinical
 trials, and there are no effective therapies currently available to specifically target cardiac fibrosis.
 We have previously shown that expression of the zinc finger E box-binding homeobox 2 (Zeb2)
 transcription factor increases as fibroblasts are activated. We now show that Zeb2 plays a critical
 role in fibroblast activation. Zeb2 overexpression in primary rat cardiac fibroblasts is associated
 with significantly increased expression of embryonic smooth muscle myosin heavy chain (SMemb),
 ED-A fibronectin and α-smooth muscle actin (α-SMA). We found that Zeb2 was highly expressed
 in activated myofibroblast nuclei but not in the nuclei of inactive fibroblasts. Moreover, ectopic
 Zeb2 expression in myofibroblasts resulted in a significantly less migratory phenotype with elevated
 contractility, which are characteristics of mature myofibroblasts. Knockdown of Zeb2 with siRNA in
 primary myofibroblasts did not alter the expression of myofibroblast markers, which may indicate that
 Zeb2 is functionally redundant with other profibrotic transcription factors. These findings add to our
 understanding of the contribution of Zeb2 to the mechanisms controlling cardiac fibroblast activation.

 Keywords: Zeb2; cardiac fibroblast; activated myofibroblast; cardiac fibrosis; fibroblast contractility

1. Introduction
      Cardiac fibroblasts are essential for normal cardiac development, function and tissue homeostasis [1,2].
In addition, cardiac fibroblasts play a vital role in controlling both the inflammatory response and wound
healing following cardiac injury [3]. Cardiac fibroblasts are recruited to the damaged myocardium by
cytokines and growth factors that are secreted by circulating inflammatory cells [4,5]. As fibroblasts
infiltrate the injured area, they undergo rapid proliferation and phenoconversion into myofibroblasts,
a key step in fibrogenesis [6,7]. Myofibroblasts remodel the extracellular matrix (ECM) by the
de-novo secretion and organization of matrix proteins such as type I and III fibrillar collagens [7,8]
and polymerized fibronectin [9]. They also frequently (but not exclusively) express contractile
proteins such as α-smooth muscle actin (α-SMA), filamentous actin (F-actin) in stress fibres, and
embryonic smooth muscle myosin heavy chain (SMemb), which facilitate contraction and closure

Int. J. Mol. Sci. 2018, 19, 3207; doi:10.3390/ijms19103207                          www.mdpi.com/journal/ijms
Int. J. Mol. Sci. 2018, 19, 3207                                                                     2 of 14

of the wound [2,10]. In most cases of wound healing, the new scar is reduced by means of tissue
regeneration and the apoptotic removal of myofibroblasts [11]. However, following myocardial
infarction (MI), cardiomyocytes do not proliferate significantly and thereby lost myocytes are not
replaced. The presence of continued inflammation causes myofibroblasts to persist for many years
in the infarct scar [12], although deactivation of activated myofibroblasts in the heart is known to
occur [13]. Persistence of the infarct scar is associated with loss of normal ventricular geometry
that leads to eventual cardiac dysfunction including impaired inotropic and lusitropic function [14].
Cardiac fibrosis is a primary contributor to other cardiovascular diseases including hypertension,
dilated cardiomyopathy and ischemia. Various factors can lead to conversion of cardiac fibroblast to
myofibroblast including mechanical stress, hypoxia, signaling ligands such as transforming growth
factor-β (TGF-β), connective tissue growth factor (CCN2/CTGF), platelet-derived growth factor
(PDGF), angiotensin II, endothelin I, fibroblast growth factor (FGF) and insulin-like growth factor 1
(IGF1) [2,15–18].
     Despite its primary contributions to cardiac dysfunction, there are no effective therapies [2,4].
Common drug classes used to treat cardiovascular disease associated with cardiac fibrosis include
statins, angiotensin-converting enzyme inhibition (ACEi) and β-blockade which ameliorate plasma
cholesterol levels and hypertension [2,19–21]. Nutraceuticals such as resveratrol and omega-3
fatty acids have been shown to reduce cardiac fibrosis in rodent models of hypertension [22,23].
Similarly, lycopene derived from tomato skins has been shown to reduce the expansion of interstitial
fibrosis that occurs in rat models of myocardial infarction [24]. At a cellular level, resveratrol and
cyanidin-3-glucoside have been shown to blunt fibroblast activation in vitro [25,26]. However, these
approaches have not been effective yet clinically, potentially due to an inability to achieve an effective
therapeutic dose in patients [27]. Therefore, it is crucial to better understand the molecular mechanisms
leading to chronic fibrosis in order to discover new therapeutic agents that will improve outcomes
for patients.
     We investigated the role of the zinc finger E box-binding homeobox 2 (Zeb2) transcription factor
in modulating fibroblast activation. Zeb2 is a member of the zinc finger transcription factor family
that plays a crucial role in embryonic development, particularly during epithelial-to-mesenchymal
transition (EMT) [28]. Zeb2 has been previously shown to repress Meox2 expression, a homeodomain
transcription factor, by binding to its promoter [29]. We have previously reported that Ski (a Smad
repressor) can contribute to myofibroblast deactivation by downregulating Zeb2, which in turn causes
an upregulation of the transcription factor Meox2 [15]. The potential functional role of Zeb2 in
fibroblast activation has not yet been addressed in the literature. Herein we provide new evidence
that loss of Zeb2 did not alter the expression of myofibroblast-specific markers. However, ectopic
expression of Zeb2 promoted fibroblast activation as demonstrated by the increased expression of
myofibroblast markers, increased contractility and decreased migratory ability.

2. Results

2.1. Subcellular Distribution of Zeb2 during Fibroblast Activation
     To investigate the role of Zeb2 in regulating fibroblast activation, we first compared the subcellular
localization of the Zeb2 protein in P0 rat cardiac fibroblasts and P1 myofibroblasts. By Western blot
analysis, we determined that the Zeb2 protein was highly expressed in the nuclei of P1 myofibroblasts
versus its expression in the nuclei of P0 fibroblasts (n = 4, p ≤ 0.05) (Figure 1). Zeb2 protein was not
detected in the cytoplasmic fractions from either P0 or P1 cells.
Int. J. Mol. Sci. 2018, 19, 3207 3 of 14
Int. J. Mol. Sci. 2018, 19, x 3 of 13
Figure 1. Zeb2
Figure is localized
1. Zeb2 to the
is localized to nuclei of primary
the nuclei rat cardiac
of primary myofibroblasts.
rat cardiac Zeb2Zeb2
myofibroblasts. protein expression
protein expression
was was
enriched in the nuclear fraction from P1 rat cardiac myofibroblasts as compared to
enriched in the nuclear fraction from P1 rat cardiac myofibroblasts as compared to P0. Lamin P0. Lamin and and
GAPDHGAPDH werewere
used used
as nuclear and cytoplasmic
as nuclear loadingloading
and cytoplasmic controls,controls,
respectively. The dataThe
respectively. shown areshown
data from are
n = 4from
independent experiments,
n = 4 independent * p ≤ 0.05* vs.
experiments, p ≤ P0.
0.05Error bars
vs. P0. represent
Error SEM. Data
bars represent SEM.were analyzed
Data by
were analyzed
performing Student’s
by performing t-test. t-test.
Student’s
2.2. The Effect of Zeb2 on the Expression of Myofibroblast Markers
2.2. The Effect of Zeb2 on the Expression of Myofibroblast Markers
To determine the effects of Zeb2 gain of function on the myofibroblast phenotype, we generated
To determine the effects of Zeb2 gain of function on the myofibroblast phenotype, we generated
an adenoviral vector encoding Zeb2 (Ad-HA-Zeb2). We were able to achieve a five-fold increase
an adenoviral vector encoding Zeb2 (Ad-HA-Zeb2). We were able to achieve a five-fold increase in
in Zeb2 protein levels by infecting myofibroblasts at a MOI of 200 (Figure 2A). We first examined
Zeb2 protein levels by infecting myofibroblasts at a MOI of 200 (Figure 2A). We first examined the
the effect of ectopic Zeb2 expression on the protein levels of three key markers of the myofibroblast
effect of ectopic Zeb2 expression on the protein levels of three key markers of the myofibroblast
phenotype: α-SMA, SMemb and ED-A fibronectin [28]. Fibroblasts were activated by plating on stiff
phenotype: α-SMA, SMemb and ED-A fibronectin [28]. Fibroblasts were activated by plating on stiff
plastic substrates and transduced with either Ad-EGFP (200 MOI) or Ad-HA-Zeb2 (200 MOI) and
plastic substrates and transduced with either Ad-EGFP (200 MOI) or Ad-HA-Zeb2 (200 MOI) and
incubated for 96 h [29]. Our data shows that Zeb2 overexpression significantly increased the levels
incubated for 96 h [29]. Our data shows that Zeb2 overexpression significantly increased
of expression of α-SMA (n = 4, * p ≤ 0.05), SMemb (n = 4, * p ≤ 0.05) and ED-A fibronectin (n = 3,
the levels of expression of α-SMA (n = 4, * p ≤ 0.05), SMemb (n = 4, * p ≤ 0.05) and ED-A
* p ≤ 0.05) as compared to the Ad-EGFP infected viral control cells. Expression levels were normalized
fibronectin (n = 3, * p ≤ 0.05) as compared to the Ad-EGFP infected viral control cells. Expression
using α-tubulin as a loading control (Figure 2).
levels were normalized using α-tubulin as a loading control (Figure 2).Int. J. Mol. Sci. 2018, 19, 3207 4 of 14
Int. J. Mol. Sci. 2018, 19, x 4 of 13
(A)
(B) (C)
Figure
Figure 2. Zeb2overexpression
2. Zeb2 overexpression induces
induces expression
expressionofofproteins characteristic
proteins of the
characteristic of myofibroblast
the myofibroblast
phenotype
phenotype in primary
in primary ratcardiac
rat cardiacfibroblasts.
fibroblasts. P1
P1cells
cellswere
weretransduced withwith
transduced Ad-EGFP or Ad-HA-Zeb2
Ad-EGFP or Ad-HA-Zeb2
and incubated for 96 h prior to Western blot analysis. α-Tubulin was used as
and incubated for 96 h prior to Western blot analysis. α-Tubulin was used as a loading a loading control. Rabbit
control.
polyclonal anti-Zeb2 antibody was used to determine Zeb2 expression levels (Panel A). Ectopic
Rabbit polyclonal anti-Zeb2 antibody was used to determine Zeb2 expression levels (Panel A).
expression of Zeb2 increased the expression of (A) α-SMA, (B) SMEmb and (C) ED-A fibronectin.
Ectopic expression of Zeb2 increased the expression of (A) α-SMA, (B) SMEmb and (C) ED-A fibronectin.
Right panels are histographic representations of respective expression of markers relative to α-
Right panels are histographic representations of respective expression of markers relative to α-tubulin.
tubulin. The data shown are from n = 4 independent experiments for α-SMA and SMemb, and n = 3
Thefordata shown are from n = 4 independent experiments for α-SMA and SMemb, and n = 3 for ED-A
ED-A fibronectin. * p < 0.05 vs. Ad-EGFP. Error bars represent SEM. Data were analyzed by
fibronectin.
performing* pStudent’s
< 0.05 vs. Ad-EGFP. Error bars represent SEM. Data were analyzed by performing
t-tests.
Student’s t-tests.
2.3. Zeb2 Overexpression Inhibits the Migration and Contractility of P1 Myofibroblasts
2.3. Zeb2 Overexpression Inhibits the Migration and Contractility of P1 Myofibroblasts
Two major functional properties of cardiac myofibroblasts are that (a) they are less motile than
Two majorwhich
fibroblasts, functional properties
facilitates of cardiac
their deposition of myofibroblasts
matrix components arewithin
that (a)the
they are less
context motile than
of wound
fibroblasts, which facilitates their deposition of matrix components within the context
healing [28], and (b) they are more contractile than fibroblasts, which allows for the contraction of of
wound
healing
healing tissue,
[28], and inherent
(b) theyinarewound
morehealing processes
contractile thaninfibroblasts,
various tissues [4]. Thus,
which allows wefor
investigated the
the contraction of
effecttissue,
healing of Zeb2 on both in
inherent thewound
migration and contractility
healing processes ofinmyofibroblasts.
various tissues [4]. Thus, we investigated the
effect of Zeb2 on both the migration and contractility of myofibroblasts.
To determine the effect of Zeb2 on cardiac myofibroblast migration, P1 myofibroblasts were
transduced with Ad-EGFP or Ad-HA-Zeb2 and incubated for 96 h. After 96 h, culture inserts wereInt. J.Int.
Mol. Sci. 2018,
J. Mol. 19, 19,
Sci. 2018, 3207x 5 of 13 5 of 14
Int. J. Mol. Sci. 2018, 19, x 5 of 13
To determine the effect of Zeb2 on cardiac myofibroblast migration, P1 myofibroblasts were
removed, medium
transduced withwas changed
Ad-EGFP to 1% FBS-containing
or Ad-HA-Zeb2 mediumfor 96and images were taken. We found that
To determine the effect of Zeb2 onand incubated
cardiac myofibroblast h. migration,
After 96 h, culture
P1 inserts
myofibroblastswerewere
at 18removed,
h, transduced
significantly
medium fewer
withwas cells
changed
Ad-EGFP had
or tomigrated into the
1% FBS-containing
Ad-HA-Zeb2 wound
medium
and incubated area
forand in the
96 images Ad-HA-Zeb2
h. Afterwere
96 h, taken. infected
cultureWe found
inserts plates
were
thatremoved,
compared at 18 h, significantly
to the Ad-EGFP
medium fewer
infected
was cells
changed had
controlsmigrated
to 1% (Figureinto
3).the wound
FBS-containing mediumarea andinimages
the Ad-HA-Zeb2
were taken.infected
We found
plates compared
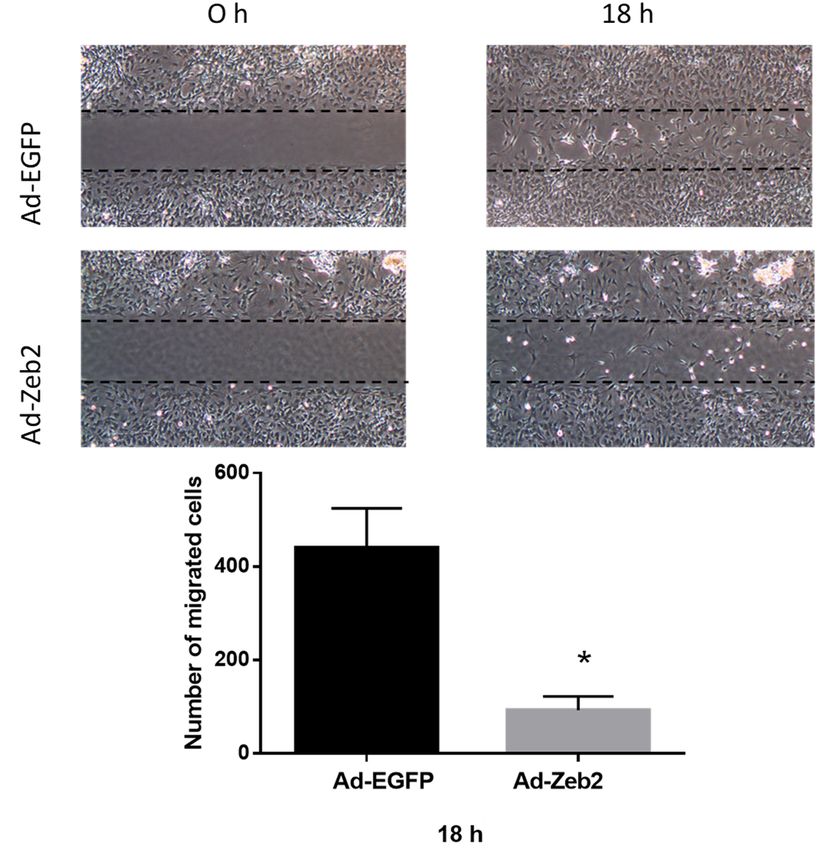
To that
determine to the
at 18 h, the Ad-EGFP
effect
significantly of fewer
Zeb2 infected controls
on myofibroblast
cells had (Figure
migrated 3).
contractility,
into the woundP1 myofibroblasts
area in the Ad-HA-Zeb2 were infected
plated on
To
collagenplatesdetermine
gels thetoeffect
and transduced
compared of Zeb2either
with
the Ad-EGFP on myofibroblast
Ad-LacZ
infected controls contractility,
or 3). P1 myofibroblasts
Ad-HA-Zeb2.
(Figure After 72 h, gelswerewere
plateddetached
on
collagen To
gels and transduced with either Ad-LacZ or Ad-HA-Zeb2. After 72 h, gels were detached
from the periphery of the plate and the entire gel allowed to “float” for 12 h. Our results showon
determine the effect of Zeb2 on myofibroblast contractility, P1 myofibroblasts were plated that
from the periphery
collagen gels andoftransduced
the plate and theeither
with entireAd-LacZ
gel allowed to “float” for 12
or Ad-HA-Zeb2. h. Our
After results showdetached
that
Zeb2 overexpression increased P1 myofibroblast contractility, as reflected by72theh,increased
gels were relative gel
Zeb2 overexpression
from the periphery increased P1 myofibroblast
and the entire contractility, as “float”
reflected
forby
12the increased
resultsrelative
contraction versus
gel contraction
controlofgels
versus control
the plate
seeded
gels seeded
withwith
Ad-LacZ gel allowed to
Ad-LacZ
infected cells, which
infected cells,
h. Our
is indicated
which is by
indicated show that
by reduced
by reduced
gel
Zeb2 overexpression increased P1 myofibroblast contractility, as reflected the increased relative
size gel
(Figure
size 4).
(Figure 4). versus control gels seeded with Ad-LacZ infected cells, which is indicated by reduced
gel contraction
gel size (Figure 4).
(A)
(A)
(B)
(B)
Figure 3. Zeb2
Figure 3. Zeb2overexpression inhibits
overexpression inhibits thethe migration
migration of P1of P1 myofibroblasts.
myofibroblasts. (A) P1 myofibroblasts
(A) P1 myofibroblasts were
weretransduced
transduced with Ad-EGFP
with Ad-EGFP or Ad-HA-Zeb2
or Ad-HA-Zeb2 and incubated
and for 96
incubated h. After
for 96 96
h. h, culture
After
Figure 3. Zeb2 overexpression inhibits the migration of P1 myofibroblasts. (A) P1 myofibroblasts 96 inserts
h, culturewereinserts
were
wereremoved
transduced with Ad-EGFP or Ad-HA-Zeb2 and incubated for 96 h. After 96 h, culture insertsinwere of
removed and images
and imageswere taken
were at the
taken indicated
at the time
indicated points
time (4× objective).
points (4 × (B) The number
objective). (B) of
The cells
number
cellsthe
in wounded
the wounded
removed area was
area
and images quantified
was using
werequantified
taken atImageJ
theusingsoftware.
ImageJ
indicated Histographic
time software. representation
points (4× Histographic
objective). shows the number
representation
(B) The number shows
of cells in
of migrated
the woundedcells in Ad-EGFP
area was (200
quantified MOI)
using and Ad-Zeb2
ImageJ (200
software. MOI) infected
Histographic plates. n
representation
the number of migrated cells in Ad-EGFP (200 MOI) and Ad-Zeb2 (200 MOI) infected plates. n = 3, = 3, * p
shows ≤ 0.05
the vs
number
Ad-EGFP
ofvs at 18 h.cells
migrated Error bars represent SEM. Data
and were analyzed by performing a Student’s
n = 3,t-test.
* p ≤ 0.05 Ad-EGFP atin18Ad-EGFP
h. Error (200
bars MOI)
represent Ad-Zeb2
SEM. Data(200 MOI)
were infected by
analyzed plates.
performing * pa≤Student’s
0.05 vs
t-test. Ad-EGFP at 18 h. Error bars represent SEM. Data were analyzed by performing a Student’s t-test.
(A)
(A)
Figure 4. Cont.Int. J. Mol. Sci. 2018, 19, x 6 of 13
Int. J. Mol. Sci. 2018, 19, 3207 6 of 14
(B)
Int. J. Mol. Sci. 2018, 19, x 6 of 13
(B)
Figure 4. Zeb2 overexpression increases contraction of P1 myofibroblasts—a characteristic of mature
Figure 4. Zeb2
myofibroblasts. (A)overexpression
Figure 4. Zeb2
P1 increases
cellsoverexpression
were plated contraction
increases
on collagen gelsofand
contractionP1of myofibroblasts—a
P1 myofibroblasts—a
transduced characteristic
with either ofofAd-
characteristic
Ad-LacZ or mature
mature
HA-Zeb2 and incubated for 72 h. After 72 h, collagen gels were cut and allowed to contract for 14 or
myofibroblasts.
myofibroblasts. (A) P1 (A)
cells P1 cells
were were
platedplated
on on collagen
collagen gels
gels and
and transduced
transduced with
with either Ad-LacZ
either Ad-LacZ h.Ad-
or
HA-Zeb2 and incubated for 72 h. After 72collagen
h, collagen gels were cut and allowedtotocontract
contract for
for 14
14 h.
Images were taken at the 0 h and 14 h timepoints (4× objective). (B) The gel size was quantified using h.
Ad-HA-Zeb2 and incubated for 72 h. After 72 h, gels were cut and allowed
Images wereImages
takenwere taken
at the 0 hatand
the 14
0 hhand 14 h timepoints
timepoints (4× objective).
(4× objective). (B) (B)
The The gel size was quantifiedusing
using
Measuregel software. Histographic representation shows the percentage ofgel size
change was quantified
of area in case of
Measuregel software. Histographic representation shows the percentage of change of area in case of
Measuregel
Zeb2 software.
infectedZeb2
gels comparedHistographic representation = shows
3, * pn ≤=the percentage of change of area in case of
infected gelsto Ad-LacZ
compared tocontrol.
Ad-LacZncontrol. 0.05
3, * pvs Ad-LacZ.
≤ 0.05 Error Error
vs Ad-LacZ. bars represent
bars represent
Zeb2 infected
SEM. Data were gels compared
analyzed to
byanalyzed Ad-LacZ
performing control.
a Student’s n = 3, * p ≤
t-test. t-test. 0.05 vs Ad-LacZ. Error bars represent
SEM. Data were by performing a Student’s
SEM. Data were analyzed by performing a Student’s t-test.
2.4.2.4.
Effect of siRNA-Mediated
Effect of siRNA-Mediated Zeb2 Knockdown
2.4. Effect of siRNA-Mediated
Zeb2 Knockdown on the
Zeb2 Knockdown Expression
on the of Myofibroblast
on the Expression
Expression Markers
of Myofibroblast
of Myofibroblast Markers
Markers
To To
determine Tothe
determine
effect ofthe effect
loss of lossfunction
of Zeb2 of Zeb2 function
on on on the expression
thethe
expression of myofibroblast
of myofibroblast markers,
markers, wewe
determine the effect of loss of Zeb2 function expression of myofibroblast markers, we
knocked downknocked
Zeb2 down
in P1 Zeb2 in P1 myofibroblasts
myofibroblasts and then and then measured
measured the the protein
protein expression
expression of of α-SMA
α-SMA andand
knocked down Zeb2 in P1Transfection
myofibroblasts and then measured
to Zeb2the protein expression of expression
α-SMA and
SMemb
SMemb 24 h24SMemb
later.
h later.
24 h later.
Transfection
Transfection with siRNA
with
with siRNA
siRNA specific specific
to
specific Zeb2
to Zeb2
significantly
significantly
significantly
reduced Zeb2
reduced
reducedZeb2 expression
Zeb2 expressionas as
as
compared to either control or scramble siRNA controls by 88.1% and 82.3%, respectively (Figure 5).
compared
compared to either
to control
either or scramble
control or scramblesiRNA
siRNA controls by 88.1%
controls by andand
88.1% 82.3%, respectively
82.3%, (Figure
respectively 5). 5).
(Figure
There were no differences detected in the levels of either α-SMA or SMemb between the different
There
Therewere
wereno differences
no
groups differencesdetected
by Western detected
in the levels
in (Figure
blot analysis the of either α-SMA or SMemb between the different
levels
5). of either α-SMA or SMemb between the different
groups
groupsby by
Western
Western blot analysis
blot analysis(Figure
(Figure5). 5).
Figure 5. Zeb2 knockdown in primary cardiac myofibroblasts. First-passage (P1) rat cardiac
myofibroblasts were subjected to 24 h of serum deprivation prior to treatment with 100 nM of either
scramble or FITC-tagged Zeb2-targeted siRNA in serum-free, antibiotic-free DMEM. Untreated cells
Zeb2 as
Figure 5. served knockdown in primary
negative controls; cardiac
transfection myofibroblasts.
efficiency was verified First-passage
by fluorescent (P1) rat cardiac
microscopy. Data
Figure 5. Zeb2 knockdown in primary cardiac myofibroblasts. First-passage (P1) rat cardiac
myofibroblasts
shownwere subjected toof24
is representative n =h3of serum deprivation
biological replicates. ** pprior to*treatment
< 0.01, p < 0.05. with 100 nM of either
myofibroblasts were subjected to 24 h of serum deprivation prior to treatment with 100 nM of either
scramble or FITC-tagged Zeb2-targeted siRNA in serum-free, antibiotic-free DMEM. Untreated cells
scramble or FITC-tagged Zeb2-targeted siRNA in serum-free, antibiotic-free DMEM. Untreated cells
served as negative controls; transfection efficiency was verified by fluorescent microscopy. Data shown
served as negative controls; transfection efficiency was verified by fluorescent microscopy. Data
is representative of n = 3 biological replicates. ** p < 0.01, * p < 0.05.
shown is representative of n = 3 biological replicates. ** p < 0.01, * p < 0.05.Int. J. Mol. Sci. 2018, 19, 3207 7 of 14
3. Discussion
In this study, we have demonstrated that Zeb2 regulates cardiac fibroblast activation. Zeb2
overexpression was associated with significant increases in the expression levels of three key
myofibroblast markers: α-SMA, SMemb and ED-A fibronectin. Ectopic Zeb2 expression was also
associated with reduced myofibroblast migration and a markedly contractile phenotype, which is
characteristic of mature myofibroblasts [3,28]. Our study indicates that Zeb2 has profibrotic effects in
cardiac fibroblasts, but that its function is not required for maintaining the myofibroblast phenotype.
Previously, we have shown that Ski, a negative regulator of TGF-β signaling, deactivates
myofibroblasts by downregulating Zeb2 expression, which in turn is associated with upregulation of
its target, the Meox2 homeobox transcription factor. We found that ectopic Meox2 expression led to
decreased α-SMA and ED-A FN expression levels [15]. Zeb2 has been previously shown to regulate
the TGF-β-mediated EMT process [30]. Moreover, we have observed that Zeb2 expression increases in
a post-MI rat model [15]. All of these findings point to a possible role of Zeb2 in regulation of cardiac
fibroblast phenotype, and a putative molecular regulatory point for controlling cardiac fibroblast
function in chronic remodeling of cardiac matrix deposition by activated fibroblasts.
3.1. Zeb2 Regulates Cardiac Myofibroblast Phenotype
Cardiac myofibroblasts characteristically express elevated levels of α-SMA, SMemb and ED-A
fibronectin [31–33]. Among these markers, SMemb and α-SMA are the two major contractile proteins
expressed by myofibroblasts [31,33]. ED-A fibronectin is considered to be one of the major drivers
of myofibroblast phenoconversion that plays a role in the induction of α-SMA expression, collagen
deposition and cell contractility [32]. We found that infection with adenovirus encoding Zeb2 induces
increased expression of these myofibroblast markers (Figure 2). Thus, it is evident that Zeb2 is sufficient
to increase the expression of the major myofibroblast markers, and plays a crucial role in driving the
phenoconversion of cardiac fibroblasts to myofibroblasts. The increased expression of the myofibroblast
markers may result from either increased expression via a Zeb2/SP1-dependent pathway or via
Zeb2-mediated repression of an inhibitor of the myofibroblast phenotype either in a SMAD-dependent
or -independent manner [30,34–36]. Although we have used a relatively high MOI, we have achieved
a five-fold induction of Zeb2 expression, which is physiologically relevant (Figure 2A). We have
previously shown that Ski overexpression leads to Zeb2 downregulation and that increased Meox2
expression leads to downregulation of α-SMA and ED-A fibronectin protein levels [15]. This finding
suggests that an increase in Zeb2 protein levels in cardiac myofibroblasts may lead to downregulation
of Meox2 expression, which in turn can increase α-SMA and ED-A fibronectin protein levels. However,
in Meox2 overexpression studies, we did not observe a decrease in SMemb expression levels,
which suggests that Zeb2 has the potential to regulate myofibroblast phenoconversion either directly
or via another pathway [15]. Zeb2 is also known as a Smad-interacting protein, which may reflect
Zeb2’s role in fibroblast activation via binding to the Smad transcriptional complex.
3.2. Zeb2 Regulates Cardiac Myofibroblast Migration
As myofibroblasts are hypersynthetic, their reduced motility results in increased deposition
of new matrix at the precise point of where it may be needed in the course of normal wound
healing [2]. Our current results using the wound healing assay show that Zeb2 regulates the migratory
properties of cardiac myofibroblasts. Zeb2 overexpression is associated with reduced migration of
myofibroblasts, as indicated by the decreased number of cells migrating into the cell-free gap region in
the wound healing assay (Figure 4). This result is consistent with the findings of our myofibroblast
phenotype marker analysis, where Zeb2 overexpression was shown to induce a hypersynthetic mature
myofibroblast phenotype.Int. J. Mol. Sci. 2018, 19, 3207 8 of 14
3.3. Zeb2 Regulates Cardiac Myofibroblast Contraction
Myofibroblasts have a characteristic contractile property that helps in the process of wound
closure. Myofibroblasts maintain the matrix in the wound area under tension, which helps reduce
wound size and ensures rapid healing [37]. Myofibroblasts synthesize large amounts of contractile
proteins such as α-SMA and SMemb, which generate tension by actively contracting to generate
force [33,38]. There are also other pathways that can contribute in inducing contractile property of
myofibroblasts, for example, Ca2+ signaling and Rho/ROCK signaling [39]. We have demonstrated
that Zeb2 overexpression in myofibroblasts leads to increased contractility as compared to the Ad-LacZ
control (Figure 5). Thus, the finding of increasing myofibroblast marker expression (α-SMA and
SMemb) reflects the induction of a more contractile mature cardiac myofibroblast phenotype.
3.4. Zeb2 Is Not Required to Maintain the Myofibroblast Phenotype
Fibroblast activation is controlled by a balance between opposing transcription factor signaling
pathways. For example, transcription factors such as Scleraxis promote fibroblast activation,
whereas transcription factors such as Ski and Meox2 inhibit fibroblast activation [15,40]. We showed
that expression of Zeb2 was sufficient to promote fibroblast activation, as shown by expression
of markers and functional changes in migration and contractility. However, siRNA-mediated
knockdown of Zeb2 had no effect on the expression of two proteins characteristic of the myofibroblast
phenotype. This finding may indicate that Zeb2 is not essential for maintenance of the myofibroblast
phenotype. Potentially, Zeb1 may compensate for the loss of Zeb2 in maintaining the myofibroblast
phenotype [41,42]. Zeb1 and Zeb2 were shown to be targets of miR200 and miR205. Loss of these
miRNAs resulted in the upregulation of both Zeb1 and Zeb2 and the subsequent activation of
epithelial-to-mesenchymal transition (EMT). The double knockdown of Zeb1 and Zeb2, but not
the individual knockdowns, was able to block this activation of EMT [42]. There may exist a similar
degree of functional redundancy for these transcription factors in cardiac fibroblasts. Additionally,
the knockdown of Zeb2 was effective but there was still 11.9% of Zeb2 protein left that may be
sufficient to maintain expression of these markers. Perhaps there is a threshold that needs to be reached
before a decrease in Zeb2 is correlated with decreased expression of myofibroblast markers. Finally,
the knockdown of Zeb2 was acute (24 h); perhaps an extended knockdown period may result in a
phenotypic change. Future studies will be carried out to investigate the importance and existence of
these different mechanisms.
Identification of novel regulators of fibrosis for developing selective antifibrotic strategies is
currently moving to the mainstream of cardiovascular research. Nutraceutical-based approaches to
reduce cardiac fibrosis have shown promise in preclinical models, but more understanding of the
underlying mechanisms will improve their clinical effectiveness. Thus, understanding factors that are
involved in cardiac fibroblast activation will enable therapeutic targeting to prevent persistent fibroblast
activation and progressive fibrosis in chronic stages of heart disease. Overall, the current data supports
the hypothesis that Zeb2 promotes cardiac fibroblast activation. We suggest that Zeb2 promotes
fibroblast activation, which is indicated by increased expression of myofibroblast markers—the
myofibroblastic phenotype is associated with a less motile and more contractile phenotype. Findings
from this study directly contribute to our understanding of the biological role of Zeb2 in modulating
cardiac fibroblast phenotype, and underscore its putative role in mediating cardiac matrix remodeling.
4. Materials and Methods
4.1. Cell Isolation and Culture
Approval for experimental protocols for the animal studies was received from the Animal Care
Committee of the University of Manitoba, Canada, and the protocols conform to the guidelines
established by the Canadian Institutes of Health Research and the Canadian Council on Animal Care
(Protocol: 14-049, approved 18 November 2014).Int. J. Mol. Sci. 2018, 19, 3207 9 of 14
Primary cardiac fibroblasts were isolated from the hearts of adult male Sprague-Dawley rats
(150–200 g) [43]. The retrograde Langendorff perfusion method was performed with Dulbucco’s
Modified Eagle’s Medium (DMEM)/F12 (Gibco, Thermo Fisher Scientific, Burlington, ON, Canada)
followed by Spinner Minimum Essential Medium (SMEM) (Gibco) [43]. After 10 min of perfusion,
hearts were digested with 0.1% w/v collagenase type 2 (Worthington Biochemical Corporation,
Lakewood, NJ, USA) in SMEM for 20 min at room temperature. Hearts were then transferred to
a 10 cm2 plate and the myocardium teased apart in 10 mL of diluted collagenase solution (0.05% w/v)
for 15 min. Then, growth medium (DMEM-F12 supplemented with 10% fetal bovine serum (FBS),
100 U/mL penicillin (Gibco), 100 µg/mL streptomycin (Gibco) and 1 µM ascorbic acid (Sigma-Aldrich,
Oakville, ON, Canada)) was added. To remove any large tissue pieces, the crude cell suspension was
gently passed through a 40 µm sterile cell strainer (Thermo Fisher) and collected in a 50 mL conical
tube which was then subjected to centrifugation at 200× g for 7 min. Cell pellets were resuspended in
growth medium and plated onto 10 cm2 plates. Cells were allowed to adhere for 3 h at 37 ◦ C in a 5%
CO2 incubator, then washed 2–3 times with 1× phosphate-buffered saline (PBS) prior to replacing the
growth medium. The following day, cells were washed with PBS twice and fresh medium was added
and cells were allowed to grow for 2–3 days before passaging.
4.2. Nuclear/Cytoplasmic Fractionation
P0 cardiac fibroblasts were allowed to grow for 72 h to achieve 70% confluency and were either
harvested or passaged to P1 myofibroblasts, which were allowed to grow for 48 h before harvesting.
Fractionation was then carried out using the NE-PER Nuclear and Cytoplasmic Extraction Reagents
(Pierce Biotechnology, Waltham, MA, USA) as previously described by us [15]. Protein assays were
performed using the DC protein assay [44].
4.3. Total Cell Lysate Preparation
Following incubation, cells were washed twice with PBS, and RIPA lysis buffer (50 mM, 150 mM
NaCl, 1 mM EDTA, 1 mM EGTA, 1% Triton X-100, 1% sodium deoxycholate, 1% SDS, pH 7.4),
containing completeTM protease inhibitor cocktail (Roche Life Sciences, Laval, QC, Canada), was added
to lyse cells. Cells were then mechanically scraped and the lysates were vortexed once, incubated on
ice for 45 min, revortexed and centrifuged in a tabletop centrifuge at 14,000 rpm at 4 ◦ C for 10 min.
Supernatants were transferred to new tubes and protein assays were performed using the DC protein
assay [44].
4.4. Western Blot Analysis
SDS-PAGE of 10–25 µg of protein was performed on either 8% or 10% reducing polyacrylamide
gels. Pre-Stained Standard (Bio-Rad Laboratories, Mississauga, ON, Canada) molecular mass markers
were used as a standard. Proteins were transferred to a 0.45 µM nitrocellulose membrane (Bio-Rad).
Membranes were blocked in 1× TBS containing 5% (w/v) skim milk powder for 1 h at room
temperature with constant shaking. The following primary antibodies were diluted in 1× TBS
with 5% skim milk:rabbit polyclonal anti-Zeb2 (1:1000; Sigma), mouse monoclonal anti-α-tubulin
(1:5000; Abcam Inc, Toronto, ON, Canada), rabbit polyclonal anti-β-tubulin (1:5000; Abcam), mouse
monoclonal anti-α-smooth muscle actin (1:5000; Sigma), mouse monoclonal anti-ED-A fibronectin
(1:1000; Millipore, Bedford, MA, USA), mouse monoclonal anti-SMemb (1:1000; Abcam), mouse
monoclonal anti-Lamin A+C (Millipore) and mouse monoclonal anti-glyceraldehyde 3-phosphate
dehydrogenase (GAPDH; 1:2000; Abcam). Zeb2, Lamin A+C, GAPDH and SMemb antibodies were
incubated overnight at 4 ◦ C while α-SMA, ED-A fibronectin and tubulin antibodies were incubated for
1 h at room temperature. Secondary antibodies were horseradish peroxidase (HRP)-conjugated goat
anti-rabbit or goat anti-mouse antibodies (Jackson ImmunoResearch Laboratories Inc., West Grove, PA,
USA), which were diluted at 1:5000 in 1× TBS containing 5% skim milk and incubated for 1 h at room
temperature with constant shaking. Equal protein loading was confirmed using α- and β-tubulin,Int. J. Mol. Sci. 2018, 19, 3207 10 of 14
GAPDH or Lamin A+C. Protein bands were detected using Western Blotting Luminol Reagent (Santa
Cruz Biotechnology, Santa Cruz, CA, USA) and images were developed on CL-Xposure blue X-ray
films using Flour S Max Multi Imager (Bio-rad, Hercules, CA, USA).
4.5. Adenoviral Constructs
The eGFP-expressing control vector (Ad-EGFP) was a gift from Grant Pierce (University of
Manitoba) and the LacZ vector (Ad-LacZ) was a gift from Michael Czubryt (University of Manitoba).
The HA-tagged human Zeb2 (Ad-HA-Zeb2) virus was constructed using the pAdEasy™ Adenoviral
Vector System protocol (Agilent Technologies, Palo Alto, CA, USA). Briefly, adenovirus encoding
N-terminal HA-tagged Zeb2 (mouse) was created by excising the Zeb2 cDNA from pcDNA 3.1 (A gift
from Anders Lund, University of Copenhagen) and the Zeb2 cDNA was cloned into the pShuttle-CMV
vector (Agilent Technologies, Palo Alto, CA, USA). Linearized pShuttle-Zeb2 plasmid DNA and
pAdEasy vector were cotransformed into BJ5183-competent E. coli cells. Recombined plasmids were
amplified in DH5α cells and transfected into HEK293 cells to prepare primary viral stock. Primary
stock was then amplified using HEK293 cells and viruses were purified. Finally, Ad-HA-Zeb2 virus
titration was performed in HEK293 cells using the Adeno-X™ Rapid Titer Kit (Clontech Laboratories,
Mountain View, CA, USA).
4.6. Analysis of Myofibroblast Marker Expression Following Adenoviral Infection
For Western blot analysis, 1.4 × 10⁵ P1 rat cardiac myofibroblasts were plated onto 6 cm2 plates in
2 mL of 10% FBS-containing DMEM/F-12 medium and infected with either Ad-EGFP or Ad-HA-Zeb2
at a multiplicity of infection (MOI) of 200 and incubated in a 5% CO2 incubator at 37 ◦ C. The following
day, feeding medium was replaced with 1% FBS containing DMEM F-12 medium and incubated for
another 72 h with 5% CO2 and subsequently harvested for protein analysis.
4.7. Wound Healing Migration Assay
P1 cardiac myofibroblasts (2.5 × 10⁴ cells in 70 µL of 10% FBS-containing DMEM-F12 medium)
were plated inside culture inserts (ibidi USA Inc., Madison, WI, USA) and grown overnight in a 5%
CO2 incubator at 37 ◦ C. The following day, cells were transduced with either Ad-EGFP (200 MOI) or
Ad-HA-Zeb2 (200 MOI) and incubated for 96 h. After 96 h, the culture inserts were carefully removed
and cells were washed with 1× PBS and the medium was replaced with 1% FBS-containing DMEM-F12
medium. Images were taken at 0 h and 18 h using a 4× objective. The number of cells in the wounded
area was quantified using ImageJ software (version 1.45; National Institutes of Health, Bethesda, MD,
USA) [45].
4.8. Collagen Gel Contraction Assay
To initiate this assay, 7 mL of cold collagen I solution (Worthington) was mixed with 2 mL of
5× culture medium (DMEM F-12 without serum and antibiotics) in a 50 mL centrifuge tube and the
pH was kept between 7 and 7.5. The volume was then adjusted to 10 mL with double-distilled water
(ddH2 O). After that, 500 µL of the mixture was added per well of a 24-well plate. Gels were allowed to
solidify by incubating at 37 ◦ C in a 5% CO2 incubator for minimum 3 h or overnight. P1 myofibroblasts
(5 × 10⁴ per well) were then plated onto wells and transduced with either Ad-LacZ (200 MOI) or
Ad-HA-Zeb2 (200 MOI) in 10% FBS-containing DMEM-F12 medium. The following day, medium was
replaced with 1% FBS-containing DMEM F-12 medium and incubated for another 48 h. After 48 h of
incubation, the medium was replaced with serum-free DMEM F-12 medium. Gels were cut around the
edges using pipette tips. Images were taken at 0 h and 14 h, and gel surface contraction was measured
using IDL Measure Gel software (University of Calgary, Calgary, AB, Canada).Int. J. Mol. Sci. 2018, 19, 3207 11 of 14
4.9. siRNA-Mediated Gene Knockdown
P1 cardiac myofibroblasts were seeded at 8.0 × 10⁴ cells in each well of a 6-well dish. Cells were
left to adhere overnight in DMEM:F-12 (1:1) supplemented with 10% FBS and 100 units/mL of
penicillin–streptomycin. The cells were then gently washed twice with 1× PBS, then starved overnight
in serum-free, antibiotic-free DMEM. The following day, the myofibroblasts were transfected for
24 h with 100 nM of either scrambled Zeb2 siRNA or Zeb2-targeting FITC-tagged siRNA (Table 1)
(Sigma-Aldrich, St. Louis, MO, USA) using Lipofectamine RNAiMax (ThermoFisher, Waltham, MA,
USA) as per the manufacturer’s protocol; negative control wells were left in DMEM alone. Whole cell
lysates were collected and analysed by Western blot.
Table 1. siRNA sequences.
Oligo ID siRNA Target Sequences Modification
rZeb2 sense Targets Rat Zeb2 mRNA [Flc]GCAAGAAAUGUAUUGGUUU[dT][dT] 50 FITC
rZeb2 antisense Targets Rat Zeb2 mRNA AAACCAAUACAUUUCUUGC[dT][dT] None
rZeb2 scramble Scrambled sense rZEB2 oligo GUACGUUAAGGUUAGAUAU[dT][dT] None
rZeb2scramble_as Scrambled Zeb2 antisense oligo AUAUCUAACCUUAACGUAC[dT][dT] None
Flc: Fluorescein label; dT: Deoxythymidine.
4.10. Statistical Analysis
All experiments were repeated with 3 biological replicates (n = 3). For primary cells, different rat
hearts were used as a source of primary fibroblasts and each heart equates to n = 1 [46]. Student’s t-test
was used to compare means between two samples (control and experimental groups) and one-way
ANOVA followed by a Tukey’s multiple comparison test was used to compare between 3 samples and
results, wherein a difference of p ≤ 0.05 was considered as statistically significant.
Author Contributions: The authors were responsible for the following aspects of this paper: Conceptualization,
F.J., N.M.L., I.M.C.D. and J.T.W.; methodology, F.J., N.M.L., and S.G.R.; formal analysis, F.J., N.M.L., and S.G.R.;
writing—original draft preparation, F.J.; review and editing, F.J., N.M.L., S.G.R., I.M.C.D. and J.T.W. visualization,
F.J., N.M.L., and S.G.R.; supervision, I.M.C.D. and J.T.W; project administration, J.T.W.; funding acquisition,
I.M.C.D and J.T.W.
Funding: The work in this project was supported by a Canadian Institutes for Health Research (CIHR) operating
grant to I.M.C.D. and J.T.W. F.J. was supported by a graduate studentship from Research Manitoba. N.M.L.
is supported by a CIHR Frederick Banting and Charles Best Canada Research Scholarship and a Graduate
Studentship (PhD) from Research Manitoba.
Acknowledgments: We are also grateful for infrastructure support from The St. Boniface Hospital Foundation as
well as Heart and Stroke Foundation of Canada (I.M.C.D.—with salary support for S.G.R.).
Conflicts of Interest: The authors declare no conflict of interest.
Abbreviations
ECM extracellular matrix
α-SMA α-smooth muscle actin
SMemb embryonic smooth muscle myosin heavy chain
ZEB2 zinc finger E box-binding homeobox 2
References
1. Krenning, G.; Zeisberg, E.M.; Kalluri, R. The origin of fibroblasts and mechanism of cardiac fibrosis.
J. Cell. Physiol. 2010, 225, 631–637. [CrossRef] [PubMed]
2. Travers, J.G.; Kamal, F.A.; Robbins, J.; Yutzey, K.E.; Blaxall, B.C. Cardiac Fibrosis: The Fibroblast Awakens.
Circ. Res. 2016, 118, 1021–1040. [CrossRef] [PubMed]
3. Baum, J.; Duffy, H.S. Fibroblasts and myofibroblasts: What are we talking about? J. Cardiovasc. Pharmacol.
2011, 57, 376–379. [CrossRef] [PubMed]Int. J. Mol. Sci. 2018, 19, 3207 12 of 14
4. Gabbiani, G. The myofibroblast in wound healing and fibrocontractive diseases. J. Pathol. 2003, 200, 500–503.
[CrossRef] [PubMed]
5. Moore-Morris, T.; Tallquist, M.D.; Evans, S.M. Sorting out where fibroblasts come from. Circ. Res. 2014, 115,
602–604. [CrossRef] [PubMed]
6. Czubryt, M.P. Common threads in cardiac fibrosis, infarct scar formation, and wound healing.
Fibrogenesis Tissue Repair 2012, 5, 19. [CrossRef] [PubMed]
7. Micallef, L.; Vedrenne, N.; Billet, F.; Coulomb, B.; Darby, I.A.; Desmouliere, A. The myofibroblast, multiple
origins for major roles in normal and pathological tissue repair. Fibrogenesis Tissue Repair 2012, 5 (Suppl. 1), S5.
[PubMed]
8. Souders, C.A.; Bowers, S.L.; Baudino, T.A. Cardiac fibroblast: The renaissance cell. Circ. Res. 2009, 105,
1164–1176. [CrossRef] [PubMed]
9. Valiente-Alandi, I.; Potter, S.J.; Salvador, A.M.; Schafer, A.E.; Schips, T.; Carrillo-Salinas, F.; Gibson, A.M.;
Nieman, M.L.; Perkins, C.; Sargent, M.A.; et al. Inhibiting Fibronectin Attenuates Fibrosis and Improves
Cardiac Function in a Model of Heart Failure. Circulation 2018, 138, 1236–1252. [CrossRef] [PubMed]
10. Gourdie, R.G.; Dimmeler, S.; Kohl, P. Novel therapeutic strategies targeting fibroblasts and fibrosis in heart
disease. Nat. Rev. Drug Discov. 2016, 15, 620–638. [CrossRef] [PubMed]
11. Weber, K.T.; Sun, Y.; Bhattacharya, S.K.; Ahokas, R.A.; Gerling, I.C. Myofibroblast-mediated mechanisms of
pathological remodelling of the heart. Nat. Rev. Cardiol. 2013, 10, 15–26. [CrossRef] [PubMed]
12. Willems, I.E.; Havenith, M.G.; De Mey, J.G.; Daemen, M.J. The α-smooth muscle actin-positive cells in
healing human myocardial scars. Am. J. Pathol. 1994, 145, 868–875. [PubMed]
13. Kanisicak, O.; Khalil, H.; Ivey, M.J.; Karch, J.; Maliken, B.D.; Correll, R.N.; Brody, M.J.; LIN, S.-C.J.;
Aronow, B.J.; Tallquist, M.D.; et al. Genetic lineage tracing defines myofibroblast origin and function
in the injured heart. Nat. Commun. 2016, 7, 12260. [CrossRef] [PubMed]
14. Vasquez, C.; Benamer, N.; Morley, G.E. The cardiac fibroblast: Functional and electrophysiological
considerations in healthy and diseased hearts. J. Cardiovasc. Pharmacol. 2011, 57, 380–388. [CrossRef]
[PubMed]
15. Cunnington, R.H.; Northcott, J.M.; Ghavami, S.; Filomeno, K.L.; Jahan, F.; Kavosh, M.S.; Davies, J.J.;
Wigle, J.T.; Dixon, I.M. The Ski-Zeb2-Meox2 pathway provides a novel mechanism for regulation of the
cardiac myofibroblast phenotype. J. Cell Sci. 2014, 127, 40–49. [CrossRef] [PubMed]
16. Khalil, H.; Kanisicak, O.; Prasad, V.; Correll, R.N.; Fu, X.; Schips, T.; Vagnozzi, R.J.; Liu, R.; Huynh, T.;
Lee, S.J.; et al. Fibroblast-specific TGF-β-Smad2/3 signaling underlies cardiac fibrosis. J. Clin. Investig. 2017,
127, 3770–3783. [CrossRef] [PubMed]
17. Wang, B.; Hao, J.; Jones, S.C.; Yee, M.S.; Roth, J.C.; Dixon, I.M. Decreased Smad 7 expression contributes
to cardiac fibrosis in the infarcted rat heart. Am. J. Physiol. Heart Circ. Physiol. 2002, 282, H1685–H1696.
[CrossRef] [PubMed]
18. Wang, B.; Omar, A.; Angelovska, T.; Drobic, V.; Rattan, S.G.; Jones, S.C.; Dixon, I.M. Regulation of collagen
synthesis by inhibitory Smad7 in cardiac myofibroblasts. Am. J. Physiol. Heart Circ. Physiol. 2007, 293,
H1282–H1290. [CrossRef] [PubMed]
19. Alehagen, U.; Benson, L.; Edner, M.; Dahlstrom, U.; Lund, L.H. Association Between Use of Statins and
Mortality in Patients With Heart Failure and Ejection Fraction of >/=50. Circ. Heart Fail. 2015, 8, 862–870.
[CrossRef] [PubMed]
20. Brilla, C.G.; Funck, R.C.; Rupp, H. Lisinopril-mediated regression of myocardial fibrosis in patients with
hypertensive heart disease. Circulation 2000, 102, 1388–1393. [CrossRef] [PubMed]
21. Shi, Y.; Li, D.; Tardif, J.C.; Nattel, S. Enalapril effects on atrial remodeling and atrial fibrillation in experimental
congestive heart failure. Cardiovasc Res. 2002, 54, 456–461. [CrossRef]
22. Eclov, J.A.; Qian, Q.; Redetzke, R.; Chen, Q.; Wu, S.C.; Healy, C.L.; Ortmeier, S.B.; Harmon, E.; Shearer, G.C.;
O’Connell, T.D. EPA, not DHA, prevents fibrosis in pressure overload-induced heart failure: Potential role of
free fatty acid receptor 4. J. Lipid Res. 2015, 56, 2297–2308. [CrossRef] [PubMed]
23. Thandapilly, S.J.; Louis, X.L.; Behbahani, J.; Movahed, A.; Yu, L.; Fandrich, R.; Zhang, S.; Kardami, E.;
Anderson, H.D.; Netticadan, T. Reduced hemodynamic load aids low-dose resveratrol in reversing
cardiovascular defects in hypertensive rats. Hypertens. Res. 2013, 36, 866–872. [CrossRef] [PubMed]Int. J. Mol. Sci. 2018, 19, 3207 13 of 14
24. Pereira, B.L.B.; Reis, P.P.; Severino, F.E.; Felix, T.F.; Braz, M.G.; Nogueira, F.R.; Silva, R.A.C.; Cardoso, A.C.;
Lourenco, M.A.M.; Figueiredo, A.M.; et al. Tomato (Lycopersicon esculentum) or lycopene supplementation
attenuates ventricular remodeling after myocardial infarction through different mechanistic pathways.
J. Nutr. Biochem. 2017, 46, 117–124. [CrossRef] [PubMed]
25. Aloud, B.M.; Raj, P.; McCallum, J.; Kirby, C.; Louis, X.L.; Jahan, F.; Yu, L.; Hiebert, B.; Duhamel, T.A.;
Wigle, J.T.; et al. Cyanidin 3-O-glucoside prevents the development of maladaptive cardiac hypertrophy and
diastolic heart dysfunction in 20-week-old spontaneously hypertensive rats. Food Funct. 2018, 9, 3466–3480.
[CrossRef] [PubMed]
26. Chen, T.; Li, J.; Liu, J.; Li, N.; Wang, S.; Liu, H.; Zeng, M.; Zhang, Y.; Bu, P. Activation of SIRT3 by resveratrol
ameliorates cardiac fibrosis and improves cardiac function via the TGF-β/Smad3 pathway. Am. J. Physiol.
Heart Circ. Physiol. 2015, 308, H424–H434. [CrossRef] [PubMed]
27. O’Connell, T.D.; Block, R.C.; Huang, S.P.; Shearer, G.C. omega3-Polyunsaturated fatty acids for heart failure:
Effects of dose on efficacy and novel signaling through free fatty acid receptor 4. J. Mol. Cell. Cardiol. 2017,
103, 74–92. [CrossRef] [PubMed]
28. Santiago, J.J.; Dangerfield, A.L.; Rattan, S.G.; Bathe, K.L.; Cunnington, R.H.; Raizman, J.E.; Bedosky, K.M.;
Freed, D.H.; Kardami, E.; Dixon, I.M. Cardiac fibroblast to myofibroblast differentiation in vivo and in vitro:
Expression of focal adhesion components in neonatal and adult rat ventricular myofibroblasts. Dev. Dyn.
2010, 239, 1573–1584. [CrossRef] [PubMed]
29. Masur, S.K.; Dewal, H.S.; Dinh, T.T.; Erenburg, I.; Petridou, S. Myofibroblasts differentiate from fibroblasts
when plated at low density. Proc. Natl. Acad. Sci. USA 1996, 93, 4219–4223. [CrossRef] [PubMed]
30. Vandewalle, C.; Comijn, J.; De Craene, B.; Vermassen, P.; Bruyneel, E.; Andersen, H.; Tulchinsky, E.;
Van Roy, F.; Berx, G. SIP1/ZEB2 induces EMT by repressing genes of different epithelial cell-cell junctions.
Nucleic Acids Res. 2005, 33, 6566–6578. [CrossRef] [PubMed]
31. Darby, I.; Skalli, O.; Gabbiani, G. A-smooth muscle actin is transiently expressed by myofibroblasts during
experimental wound healing. Lab. Investig. 1990, 63, 21–29. [PubMed]
32. Serini, G.; Bochaton-Piallat, M.L.; Ropraz, P.; Geinoz, A.; Borsi, L.; Zardi, L.; Gabbiani, G. The fibronectin
domain ED-A is crucial for myofibroblastic phenotype induction by transforming growth factor-β1.
J. Cell Biol. 1998, 142, 873–881. [CrossRef] [PubMed]
33. Frangogiannis, N.G.; Michael, L.H.; Entman, M.L. Myofibroblasts in reperfused myocardial infarcts express
the embryonic form of smooth muscle myosin heavy chain (SMemb). Cardiovasc. Res. 2000, 48, 89–100.
[CrossRef]
34. Nam, E.H.; Lee, Y.; Zhao, X.F.; Park, Y.K.; Lee, J.W.; Kim, S. ZEB2-Sp1 cooperation induces invasion by
upregulating cadherin-11 and integrin α5 expression. Carcinogenesis 2014, 35, 302–314. [CrossRef] [PubMed]
35. Postigo, A.A.; Depp, J.L.; Taylor, J.J.; Kroll, K.L. Regulation of Smad signaling through a differential
recruitment of coactivators and corepressors by ZEB proteins. EMBO J. 2003, 22, 2453–2462. [CrossRef]
[PubMed]
36. Verschueren, K.; Remacle, J.E.; Collart, C.; Kraft, H.; Baker, B.S.; Tylzanowski, P.; Nelles, L.; Wuytens, G.;
Su, M.T.; Bodmer, R.; et al. SIP1, a novel zinc finger/homeodomain repressor, interacts with Smad proteins
and binds to 50 -CACCT sequences in candidate target genes. J. Biol. Chem. 1999, 274, 20489–20498. [CrossRef]
[PubMed]
37. Gabbiani, G.; Ryan, G.B.; Majne, G. Presence of modified fibroblasts in granulation tissue and their possible
role in wound contraction. Experientia 1971, 27, 549–550. [CrossRef] [PubMed]
38. Hinz, B.; Celetta, G.; Tomasek, J.J.; Gabbiani, G.; Chaponnier, C. A-smooth muscle actin expression
upregulates fibroblast contractile activity. Mol. Biol. Cell. 2001, 12, 2730–2741. [CrossRef] [PubMed]
39. Follonier Castella, L.; Gabbiani, G.; McCulloch, C.A.; Hinz, B. Regulation of myofibroblast activities: Calcium
pulls some strings behind the scene. Exp. Cell Res. 2010, 316, 2390–2401. [CrossRef] [PubMed]
40. Espira, L.; Lamoureux, L.; Jones, S.C.; Gerard, R.D.; Dixon, I.M.; Czubryt, M.P. The basic helix-loop-helix
transcription factor scleraxis regulates fibroblast collagen synthesis. J. Mol. Cell. Cardiol. 2009, 47, 188–195.
[CrossRef] [PubMed]
41. Chilosi, M.; Calio, A.; Rossi, A.; Gilioli, E.; Pedica, F.; Montagna, L.; Pedron, S.; Confalonieri, M.; Doglioni, C.;
Ziesche, R.; et al. Epithelial to mesenchymal transition-related proteins ZEB1, β-catenin, and β-tubulin-III in
idiopathic pulmonary fibrosis. Mod. Pathol. 2017, 30, 26–38. [CrossRef] [PubMed]Int. J. Mol. Sci. 2018, 19, 3207 14 of 14
42. Gregory, P.A.; Bert, A.G.; Paterson, E.L.; Barry, S.C.; Tsykin, A.; Farshid, G.; Vadas, M.A.; Khew-Goodall, Y.;
Goodall, G.J. The miR-200 family and miR-205 regulate epithelial to mesenchymal transition by targeting
ZEB1 and SIP1. Nat. Cell Biol. 2008, 10, 593–601. [CrossRef] [PubMed]
43. Hao, J.; Wang, B.; Jones, S.C.; Jassal, D.S.; Dixon, I.M. Interaction between angiotensin II and Smad proteins
in fibroblasts in failing heart and in vitro. Am. J. Physiol. Heart Circ. Physiol. 2000, 279, H3020–H3030.
[CrossRef] [PubMed]
44. Smith, P.K.; Krohn, R.I.; Hermanson, G.T.; Mallia, A.K.; Gartner, F.H.; Provenzano, M.D.; Fujimoto, E.K.;
Goeke, N.M.; Olson, B.J.; Klenk, D.C. Measurement of protein using bicinchoninic acid. Anal. Biochem. 1985,
150, 76–85. [CrossRef]
45. Schneider, C.A.; Rasband, W.S.; Eliceiri, K.W. NIH Image to ImageJ: 25 years of image analysis. Nat. Methods
2012, 9, 671–675. [CrossRef] [PubMed]
46. Zeglinski, M.R.; Davies, J.J.; Ghavami, S.; Rattan, S.G.; Halayko, A.J.; Dixon, I.M. Chronic expression of Ski
induces apoptosis and represses autophagy in cardiac myofibroblasts. Biochim. Biophys. Acta 2016, 1863,
1261–1268. [CrossRef] [PubMed]
© 2018 by the authors. Licensee MDPI, Basel, Switzerland. This article is an open access
article distributed under the terms and conditions of the Creative Commons Attribution
(CC BY) license (http://creativecommons.org/licenses/by/4.0/).You can also read