Identification of Cancer Disease Using Image Processing Approahes
←
→
Page content transcription
If your browser does not render page correctly, please read the page content below
International Journal of Intelligent Information Systems
2020; 9(2): 6-15
http://www.sciencepublishinggroup.com/j/ijiis
doi: 10.11648/j.ijiis.20200902.11
ISSN: 2328-7675 (Print); ISSN: 2328-7683 (Online)

Identification of Cancer Disease Using Image Processing
Approahes
Saif Ali, Aneeqa Tanveer, Azhar Hussain, Saif Ur Rehman*
University Institute of Information Technology, PMAS Arid Agriculture University, Rawalpindi, Pakistan

Email address:

*
    Corresponding author

To cite this article:
Saif Ali, Aneeqa Tanveer, Azhar Hussain, Saif ur Rehman. Identification of Cancer Disease Using Image Processing Approahes. International
Journal of Intelligent Information Systems. Vol. 9, No. 2, 2020, pp. 6-15. doi: 10.11648/j.ijiis.20200902.11

Received: May 14, 2020; Accepted: June 2, 2020; Published: July 4, 2020

Abstract: Cancer, also called malignancy, is an abnormal growth of cells. There are more than 100 types of cancer, including
breast cancer, skin cancer, lung cancer, colon cancer, prostate cancer, and lymphoma. Symptoms vary depending on the type.
Cancer treatment may include chemotherapy, radiation, and/or surgery. According to American Cancer Society America will be
encountering 1,806,950 new cases of cancer in the year 2020 causing 606,520 deaths. Cancer is the leading cause of death in the
world. Cancer can be classified into two main categories malignant and benign. Early detection of cancer is the key to the
successful treatment of cancer. There are various methodologies for the detection of cancer some include manual procedures,
Manual identification is time-consuming and unreliable therefore computer-aided detection came into the research.
Computer-aided detection involves image processing for feature extraction and classification techniques for the recognition of
cancer type and stages. In this paper, several different algorithms have been discussed such as SVM, KNN, DT, etc. for the
classification of the different cancers. This paper also presents a comparative analysis of the researches done in the past.
Keywords: Image Processing, Acute Lymphoblastic Leukemia, ALL, Blood Cancer, Image Segmentation, Performance,
                  Efficiency

                                                                      they have also estimated to have 60,530 new cases of
1. Introduction                                                       leukemia and 23,100 death cases in 2020 [1].
   Cancer refers to one of many diseases characterized by the
development of abnormal cells that divide uncontrollably and
can infiltrate and destroy normal body tissue. Throughout our
lives, healthy cells in our bodies divide and replace
themselves in a controlled fashion. Cancer starts when a cell
is somehow altered so that it multiplies out of control. There
are more than 100 types of cancer, including breast cancer,
skin cancer, lung cancer, colon cancer, prostate cancer, and
lymphoma. Symptoms vary depending on the type.
   According to the American Cancer Society, Blood cancer
is considered the world's 7th most death-causing cancer.
From 2013 to 2017 approximately 15 people out of 100,000
were diagnosed with blood cancer and had a mortality rate of
50 percent. Approximately every 3 minutes one person in the                Figure 1. Estimated Incidents and Deaths of Cancer in 2020 [1].
United States (US) is diagnosed with blood cancer. An
estimated combined total of 176,200 people in the US is                 Blood Consists of four major components i.e. Red Blood
expected to be diagnosed with blood cancer. Furthermore,              Cells, White Blood Cells, Platelets, and Plasma. Red cells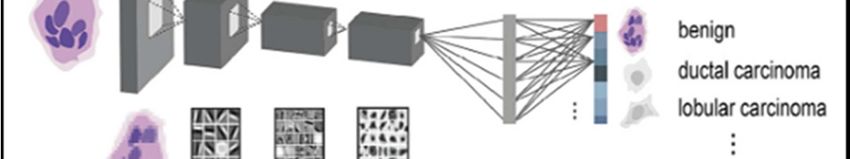
International Journal of Intelligent Information Systems 2020; 9(2): 6-15                                      7

contain a special protein called hemoglobin, which helps                   considered as the river of life. In the case of cancer, the blood
carry oxygen from the lungs to the rest of the body and then               test is not enough to identify the cancer type and propagation
returns carbon dioxide from the body to the lungs so it can be             ratio in the body of the victim.
exhaled. White blood cells protect the body from infection.                   The biopsy is the recent and one of the most advanced
They are much fewer in number than red blood cells,                        technologies to diagnose a problem or to help determine the
accounting for about 1 percent of your blood. Platelets help               best therapy option, especially in cancer. [24, 25]. A biopsy is
the blood clotting process (or coagulation) by gathering at the            a sample of tissue taken from the body in order to examine it
site of an injury. The main job of the plasma is to transport              more closely. A doctor should recommend a biopsy when an
blood cells throughout your body [2].                                      initial test suggests an area of tissue in the body isn't normal
   Leukemia is a blood cancer that originates in the blood and             [26]. Biopsies are most often done to look for cancer. But
bone marrow. It occurs when the body creates too many                      biopsies can help identify many other conditions.
abnormal white blood cells and interferes with the bone                       A: The biopsy instrument is ‘primed’ prior to insertion
marrow’s ability to make red blood cells and platelets. Two                under ultrasound guidance. Most disposable instruments
types of abnormal white blood cells can turn into leukemia:                offer the option of 1 or 2 cm core lengths. The biopsy needle
lymphoid cells and myeloid cells. When leukemia caused due                 is slowly advanced to the edge of the target lesion.
to lymphoid cells is called lymphocytic or lymphoblastic                      B: The central stylet is then slowly advanced through the
leukemia and if it is found in the myeloid cells, it is called             lesion whilst keeping the remainder of the instrument still.
myelogenous or myeloid leukemia [3]. The four major types                  The notch can usually be visualized easily and so the
of leukemia are:                                                           operator can confirm that the target tissue will fall within the
   1. Acute lymphoblastic leukemia (ALL)                                   biopsy specimen.
   2. Acute myelogenous leukemia (AML)                                        C: Once the operator is satisfied with the position of the
   3. Chronic lymphocytic leukemia (CLL)                                   central stylet/notch, the instrument is ‘fired’ by further firm
   4. Chronic myelogenous leukemia (CML)                                   forward pressure on the ‘plunger’, which rapidly advances
   Acute or chronic which are grouped on the basis of how                  the outer cutting sheath over the central stylet and samples a
fast the cells grow. Lymphoid or myeloid is another type of                core of tissue.
leukemia that is categorized depending on the type of white
blood cell that has turned into leukemia [4].
   The infected cells can be observed in the microscopic
image, manually by a trained expert where the unique
features are visually observed and the classification of the
type of cancer is done. The variety of features and often
unclear images results in missing data which can be a vital
indicator to differentiate the type of cancer, therefore
identification task becomes difficult. [5].
   According to the authors [23]. Many of the diseases can be
identified by the blood test of the patient as blood is
composed of a significant amount of chemicals and therefore                                     Figure 2. Steps Involved in Biopsy.

                                          Table 1. Various Classifiers for the Computer Aided Detection.

 S. No   Author                               Year         Methods                                                                    Accuracy
 1       Janee Alam 1 et at [27]              2018         SVM, GLCM                                                                  84.3%
 2       Moffy Vas et al [28]                 2017         Horlick feature, Artificial Neural Network                                 92%
 3       Suren Makaju [29]                    2017         SVM, GLCM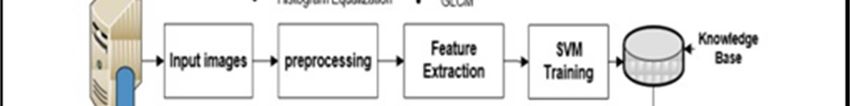
8                          Saif Ali et al.:   Identification of Cancer Disease Using Image Processing Approahes

for leukemia injected cells where the final aim is to generate          microcalcifications. Detecting masses are a more challenging
the elements which describe types of leukemia. The                      task than the detection of microcalcifications. As their size and
undertaken issues contain the cell segmentation [6] by using            shape vary in large variation and they often exhibit poor image
the watershed change, determination of distinct cells, and              contrast. Thus, image processing and feature extraction
texture quality, statistical and geometrical examination of the         techniques are used to assist radiologists in detecting tumors.
cells                                                                   The following steps are to be followed for the proposed
                                                                        system.
2.2. An Overview of Melanoma Detection in Dermoscopy                       Image Processing: The general methods for image
     Images Using Image Processing and Machine                          preprocessing are divided into various branches such as image
     Learning                                                           enhancement, noise removal, image smoothing, edge
   Mishra [7] has used image processing techniques to identify          detection and enhancement of contrast.
melanoma from the microscopic images of dermoscopy.                        Thresholding Techniques: Thresholding is an old, simple
Melanoma recognition using dermo copy images has the most               and popular technique for image segmentation.
probable for the distraction of the current clinical standard is a         Global Thresholding (GT): is one of the most common and
fast, accurate and cost-effective on-the-spot technology.               most used techniques in image segmentation. As masses
Dermoscopy        (also    known      as    dermatoscopy        or      usually have greater intensity than the surrounding tissue. A
epiluminescence microscopy) is a method of acquiring a                  global thresholding value can be found based on the histogram
magnified and illuminated image of a region of skin for                 of the image. On the histogram, the regions with an
increased clarity of the spots on the skin. The imaging                 abnormality impose extra peaks while a healthy region has
instrument used for this purpose is called a dermatoscope.              only a single peak.
Dermatoscopes are of two types: contact, using a layer of                  Image Segmentation: Partitioning an image into regions
gel/oil applied between skin and dermatoscopy, and                      such that each region is homogeneous with respect to one or
non-contact, with no skin contact and no fluid. Non-contact             more properties (such as brightness, color, texture, reflectivity,
images, and some contact images, use cross-polarized light              etc.). Common image segmentation methods are thresholding,
from the dermatoscope to acquire the image. Dermoscopy                  edge-based segmentation, region-based segmentation,
images, because of their illumination and magnification, are            clustering, classifier based segmentation, and deformable
widely used in the analysis and examination of skin lesions.            model-based segmentation.
Schematic steps involved in the identification of melanoma                 Feature Extraction and Selection: Feature extraction is a
using dermoscopy images:                                                very important process for the overall system performance in
   Lesion segmentation: Segmentation of the lesion means                the classification of micro-calcifications. The features
separating that region (lesion) from the normal skin region             extracted are distinguished according to the method of
   Feature segmentation: In this segment, the region is                 extraction and the image characteristics. The features which
observed closely and in addition to their presence, the                 are implemented here are texture features and statistical
distribution of a feature in the lesion area provides further           measures like Mean, Standard deviation, Variance,
diagnostic information.                                                 Smoothness, Skewness, Uniformity, Entropy, and kurtosis.
   Feature Generation and Classification: Predicting a lesion              Classification and Evaluation: Evaluation is done based on
to be benign or malignant is a binary classification problem. In        the acquired features and these features are compared to the
some cases, it is also important to examine the attributes of the       respective reference to draw a final conclusion.
surrounding regions for proper discrimination of melanoma.                 Neural Networks: All these values of the texture features
   Various Classifiers such as k-NN, SVM, ANNs can be                   are stored and passed through the Neural Network. Back
explored, the evaluation of classifier results are based on             Propagation algorithm can be used to find a pattern within the
overall accuracy, sensitivity, and specificity of the system [7].       datasets to automatically finding cancer. A backpropagation
                                                                        algorithm can be designed to self-learn and adjust the weight
2.3. Breast Cancer Detection Using Image Processing                     accordingly. As a greater number of data are entered into
     Techniques                                                         Neural Network the better the pattern recognition and
                                                                        accuracy.
   In another study [8], a novel system is proposed for the
early detection of breast cancer as it is the most common               2.4. Digital Image Analysis in Breast Pathology—from
among women and the second most death-causing cancer. The                    Image Processing Techniques to Artificial Intelligence
paper proposes the following framework for the identification
of the cancer. Mammography is currently the best method for                In [9], a deep learning paradigm is suggested for the early
detecting breast cancer at its early stage. The problem with            detection of Breast cancer. Authors claimed that the breast
mammography images is they are complex. Detecting                       cancer is the most common malignant disease in women
macrocalcification in dense breast tissue can be a difficult task       worldwide. Diagnosis by histopathology has proven to be
as both tend to depict white pixels on the mammogram. The               instrumental to guide breast cancer treatment, but new
number of false-positive cases on dense breast tissue is higher.        challenges have emerged as our increasing.
Indicators of cancer symptoms are generally, masses and                    The complexity of and demand for accuracy in
                                                                        histopathologic breast cancer diagnosis is increasing.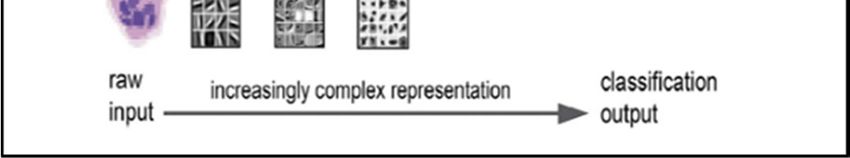
International Journal of Intelligent Information Systems 2020; 9(2): 6-15 9
However, the lack of pathologists is an evident issue in most will be counted and classified. The proposed computer-aided
parts of the world. As patient demand for personalized breast acute lymphoblastic leukemia diagnosis system aims to
cancer therapy grows, the world faces an urgent need for optimally select the most powerful features that can be used in
more precise biomarker assessment and more accurate the lymphoblastic leukemia diagnosis system. The proposed
histopathologic breast cancer diagnosis to make better lymphoblastic leukemia diagnosis system consists of three
therapy decisions. The digitization of pathology data has basic phases [10]: Image segmentation, feature extraction, and
opened the door to faster, more reproducible, and more classification.
precise diagnoses through computerized image analysis.
2.5.1. Cell Segmentation Phase
Unlike many methods in the literature, the proposed system
detects the nuclei and the entire membrane at the same time.
The images are in RGB color space which is difficult to be
segmented. So, the images were converted to CMYK color
space.
2.5.2. Feature Extraction Phase
Feature extraction in image processing is a technique of
transforming the input data into the set of features. Three types
of features were extracted from the segmented cells including
shape features, color features, and texture features.
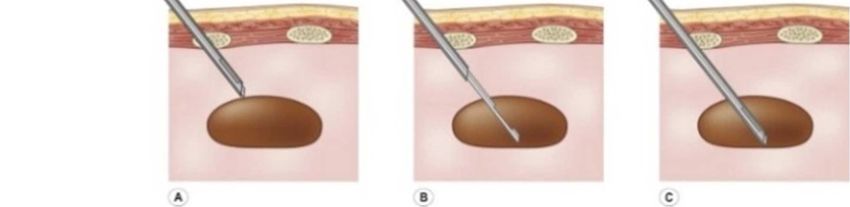
Figure 3. Fig From [9]. Deep Learning paradigm for the detection of Breast 2.5.3. Feature Normalization
Cancer. To narrow down the gap between the highest and the lowest
value of extracted features and to improve the classification
In contrast, deep learning is an end-to-end approach to results. Three different normalization techniques were applied;
learning that takes raw images as input and directly learns a they include grey-scaling, min-max, and Z-score techniques.
model to produce the desired output. Deep learning uses Grey-Scaling: It is an image normalization technique used
biologically inspired networks to represent data through to convert a matrix to a greyscale image. This can be
multiple levels of simple but nonlinear modules that transform performed by scaling the entire image to the range of
the previous representation into a higher, slightly more abstract brightness values from 0 to 1. It works by normalizing each
representation. The compositional nature of the architecture individual columns or rows to a range of brightness values
allows deep networks to form highly complex and nonlinear from 0 to 1.
representations as each layer forms a more abstracted Min-Max: Data are scaled to a fixed range usually 0–1. The
representation than the last. The result is a rich representation cost of having this bounded range in contrast to
that provides unprecedented discriminatory power. standardization is that it will be ended up with smaller
standard deviations, which can suppress the effect of outliers.
2.5. Computer-Aided Acute Lymphoblastic Leukemia
Z-Score: In this normalization method, the mean and the
Diagnosis System Based on Image Analysis
standard deviation of each feature are calculated. Next, the
The main objective of the study presented in [10] is to mean was subtracted from each feature. Finally, the product
identify the lymphocyte by segmenting the microscopic values were divided by the standard deviation.
images then diagnose (classify) each segmented cell to be
2.6. Detection of Blood Cancer in Microscopic Images of
normal or affected. Computer-Aided Acute Lymphoblastic
Human Blood Samples a Review
Leukemia (ALL) diagnosis system based on image analysis.
Leukemia is a kind of cancer that basically begins in the bone In [3], the authors have discussed the identification of
marrow. Children under 5 years and older people over 50 leukemia in the early phase, provide the appropriate
years are at higher risk of acute lymphoblastic leukemia, also, treatment for the patient. For this problem, the system sets
it can be fatal if it is not treated earlier as it is rapidly spread forth the solution that signifies the leucocytes in the blood
into some vital organs and the bloodstream too. Acute image and then selects the lymphocytes cells. It assesses the
lymphoblastic leukemia can be diagnosed by the morphological index from those cells and finally, it allocates
morphological identification of lymphoblasts by microscopy. the existence of leukemia. In their study an image processing
Blood samples can be observed and diagnosed with different techniques have been used to count the number of blood cells
diseases by doctors. Any human-based diagnosis suffers from in the biomedical image. The original image is converted to a
nonstandard precision as it basically depends on the doctor’s grayscale image for which a threshold value of intensity is set
skill; also it is unreliable from a statistical point of view. in order to differentiate WBC from RBC. The results
Automated diagnosing systems are more accurate and not acquired using the thresholding technique shows that the
temperamental like human-based systems. Also, they are ratio of RBC and WBC for a normal image to the abnormal
statistically reliable and can be generalized. So, the white image has a different range of ratio. For normal images, the
blood cell (WBS) affected by acute lymphoblastic leukemia ratio is 0 to 0.1 whereas for abnormal images its ratio range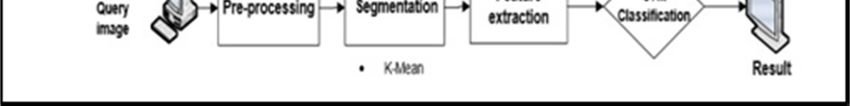
10                            Saif Ali et al.:   Identification of Cancer Disease Using Image Processing Approahes

is 0.2 to 2.5 for ALL and 0 to 14 for AML. Furthermore,                     calculated. The Methodology used for [3] is medical image
various image processing techniques have been used to detect                recognition.
blood cancer in biomedical images of human blood samples.                      1. Microscopic Image Acquisition
Like the thresholding technique. In addition to this, authors                  2. Image Enhancement (Preprocessing)
used an image processing techniques to count the number of                     3. Image Segmentation
blood cells in the biomedical image. With this counted value                   4. Image Feature Extraction
of blood cells, the ratio of blood cells for leukemia is                       5. Image Classification

                             Figure 4. From [10]. The proposed framework for computer-aided detection of Acute Leukemia.

                                                                            2.7. Automatic detection of Acute Lymphoblastic Leukemia
                                                                                 Using Image Processing

                                                                               The study proposed in [11] implemented a fully automated
                                                                            algorithm by using image processing to aid in the detection of
                                                                            acute lymphoblastic leukemia in identifying and counting the
                                                                            infected white blood cells present in the human blood sample.
                                                                            The early detection and treatment of blood cancer for recovery.
                                                                            Their work presents a method to automatically identify and
                                                                            count the lymphoblast cells in each blood sample, so as to
                                                                            eliminate human errors and most importantly facilitate earlier
                                                                            detection of acute lymphoblastic leukemia. MATLAB is used,
                                                                            with the image processing toolbox, for implementation. 108
                                                                            image samples are taken from healthy and infected patients,
                                                                            with optical laboratory microscope and Canon PowerShot G5
Figure 5. Fig From [3]. A proposed framework for computer-aided detection
of Acute Leukemia.                                                          camera. The images are in. JPG format with 24-bit color depth
                                                                            and a resolution of 2592x1944. The implementation occurs in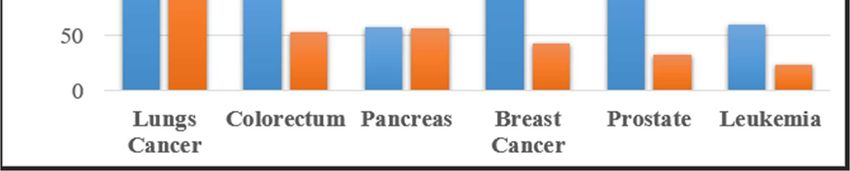
International Journal of Intelligent Information Systems 2020; 9(2): 6-15                                          11

five stages; (1)- The first stage identifies the lymphoblasts                     Separation of grouped and ungrouped lymphoblasts: The
based on its physical characteristics and separates it from the                next stage deals with separating grouped and ungrouped
rest of the blood sample.; (2)- The second stage is the                        lymphoblasts. The separation is done based on the roundness
separation of grouped and individual lymphoblasts; (3)- The                    ratio. The roundness ratio is the ratio of the square of
third stage involves the separation of clustered lymphoblasts                  perimeter and four times pi times its area.
by application of the distance transform of watershed                             Separation of grouped lymphoblasts: Separation of grouped
segmentation; (4)- The fourth phase involves removing                          cells offers great challenges due to the irregular shape of each
abnormal and unwanted cell components by shape control;                        cell. The separation can be done by the application of
(5)- Fifth and the final stage deals with the counting of                      watershed segmentation.
detected lymphoblasts and calculating the accuracy of the                         Removal of abnormal cell components: Removal of
method.                                                                        unwanted cell structures and other elements is performed as
   Background removal using the Zack algorithm: The                            explained in previous sections. The separated grouped
background is removed effectively using the Zack algorithm.                    lymphoblasts and ungrouped lymphoblasts are combined and
The Zack algorithm or triangular method is used to find the                    the number of cells in that blood sample is counted.
thresholding value required for image segmentation.

                                              Table 2. Comparative analysis of histopathology techniques.

 Authors Who Proposed
                            Algorithm For Analysis                                Accuracy Result      Difficulties With This Method
 The Algorithm
                            Active Contour model based on Color Gradient          89% segmentation
 Basavanhally et al. [14]                                                                              The false-positive rate is a little high
                            with Hierarchical Normalized cut                      accuracy
                            Gaussian Mixture Model-based spatial information      The overall
 Dundar et al. [15]                                                                                    Requires parameter optimization
                            and Expectation-Maximization (EM) Algorithm           accuracy of 87.9%
 Tosun and GunduzDemir                                                            99% accuracy for
                            Graph Run-length matrices                                                  High computational complexity
 [16]                                                                             segmentation
                                                                                                       Not suitable for specimens containing larger
                            Marker-controlled watershed algorithm and Fast        Accuracy of
 Veta et al. [17]                                                                                      numbers of nuclei with excessive overlapping
                            radial symmetry transform                             81.2%
                                                                                                       and touching of cells
                            Active Contour Model (Both region-based and
                                                                                                       ACM fails in images containing high noise and
 Jain et al. [18]           boundary-based) with General Classifier Neural        83.47% accuracy
                                                                                                       excessive overlapping nuclei
                            Network (GCNN)
                                                                                                       The region keeps growing without spatial
 Karsnas [19]               Intuitive Segmentation using vectorial data           Not mentioned
                                                                                                       constraint

                                                                               techniques proposed for early skin cancer detection using color
2.8. Early Skin Cancer Detection Using Computer-Aided                          constancy is provided and comparative analysis of various
     Diagnosis Techniques                                                      techniques proposed for early skin cancer detection using skin
   The key contribution of [20] is the comparative study done                  lesion analysis is provided. The performance of skin cancer
between color constancy and skin lesion analysis for early skin                detection using skin color constancy is evaluated considering
cancer detection on an EDRA database. Melanoma is a type of                    Sensitivity (SE), specificity (SP), and accuracy (ACC). SE
cancer that progresses from the pigment-containing cells known                 corresponds to the percentage of melanomas that are correctly
as melanocytes. There are two approaches usually used for early                classified. SP is the percentage of correctly classified benign
skin cancer detection include color constancy approach and skin                lesions and AAC is defined as follows:
lesion analysis. The objective is to hold comparison to evaluate
                                                                                                                   =                                   (1)
the best approach among these two so that the more accurate
results are obtained, and the better treatment is set for the cure of             K-fold cross-validation is used to optimize the
cancer. Researchers have suggested that extensive training is                  hyper-parameters of the color constancy system. The skin
required for a non-invasive systems approach in detecting and                  lesion analysis system was deployed in mobile phones using
subsequently treating melanoma. Due to the wrong treatment of                  an android application. In this method, the user needs to
melanoma, clinicians are discouraged from utilizing manual                     provide information such as age, UV exposure and estimated
techniques. Inaccurate detection of melanoma may lead to                       skin lesion age. The skin images are either browsed or they
erroneous treatment; hence doctors should use standardized and                 can be acquired with a camera. The app will segment the
automated system-based methods. In addition to this, automated                 images, features are extracted, and segmented images are
system-based methods are found to be effective for early                       presented to the user. In this method, no standard databases are
detection of melanoma. The modules of a portable real-time                     used. Authors use 3000 skin lesion image sets of manually
non-invasive skin lesion examination system are used for the                   classified images. The dataset contained about 800 images
initial detection of skin cancer. The framework used in the paper              with melanoma, 600 with dysplastic nevus and the rest 1600
is called a Bag of Features BoF is used to classify dermoscopic                images with benign nevi. Out of 11 methods, applied SVM
images in a single stretch (pass). Comparative analysis of various             outperforms with an accuracy rate of 77.06% with a 0.3911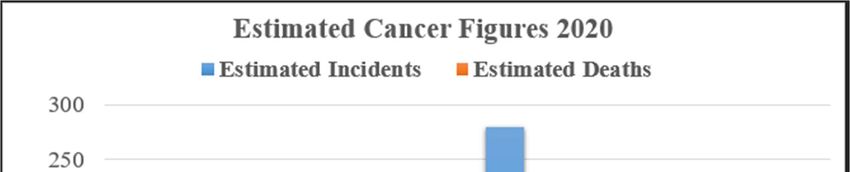
12                             Saif Ali et al.:   Identification of Cancer Disease Using Image Processing Approahes

Root Mean Square Error, 1.0 True Positive Rates, and 0.0                     analysis and reducing the cost of the treatment and helping the
False Positive Rates.                                                        pathologist to suggest effective medication. The proposed
                                                                             system has two parts, training and testing. Both parts undergo
2.9. Image Processing Based Leukemia Cancer Cell                             the following steps: Image acquisition is the initial step,
                                                                             collecting images of the blood from a microscope with proper
                                                                             magnification from any of the hospitals. The second step is
                                                                             image preprocessing, where the following steps are followed:
                                                                             Initially, color conversion takes place, a color image is
                                                                             converted to a grayscale. Followed by filtering the image,
                                                                             removal of noise from the image and finally histogram
                                                                             equalization is done to increase the quality of an image in
                                                                             terms of contrast. The third step is segmentation using k-mean
                                                                             clustering, and the nucleus is concentrated for the detection
                                                                             process. Segmentation is followed by feature extraction where
                                                                             features of the nucleus are extracted using GLCM and GLDM.
                                                                             In the training part features of the pure cancer cell are stored in
                                                                             the knowledge base. In the testing part, the cell which needs to
     Figure 6. Training and Testing Module of Proposed system in [21].       be tested is, taken as input.
   The objective of the paper [21] is to generate an element                 2.10. Lung Cancer Detection Using Medical Images
which describes, whether the cell is cancerous or not and also                     Through Image Processing
identifies the type of leukemia, where mainly leukemia are of
four types, they are acute myeloid leukemia, acute                              The aim of [22] is to design a system which can take any
lymphocytic leukemia, chronic myeloid leukemia, and                          one of the two images, Computed Tomography (CT),
chronic lymphocytic leukemia and to overcome drawbacks                       Magnetic Resonance Imaging (MRI) scan image and produces
such as time-consuming analysis, less accuracy and depending                 an output. Lung cancer is a type of tumor that gets bigger in
on operators’ skills. Microscopic pictures are reviewed                      size and enters other organs of the body. There are various
visually by hematologists and the procedure is tedious and                   ways to detect lung cancer by using Computed Tomography
time taking which causes late detection. Therefore, an                       (CT) scan image, Magnetic Resonance Imaging (MRI) scan
automatic image handling framework is required that can                      image, Ultrasound image. Image processing of the necessary
overcome related limitations in the visual investigation, which              part of the lungs is used for early diagnosis. For this, a system
provide early detection of disease and type of cancer. The                   is developed which will help the doctors to easily detect
proposed system is providing an environment that has a                       cancer in the lungs from any one of the two images given as
pre-processing strategy for target cells to tell whether the cell            input and gives proper analysis. Moreover, CT scan image and
is infected or not. K-means algorithm is used for segmentation.              MRI scan image are used for experimentations and analysis.
The proposed system reduces human error, time- consuming

                                 Figure 7. Process Diagram for detection of Cancer cells from MRI AND CT Images [22].

  Image pre-processing: Image pre-processing is used to                         Image enhancement: The various image enhancement
reduce noise and prepare the images for further steps such as                techniques can be categorized as spatial domain methods and
segmentation.                                                                Frequency domain methods. Different image enhancement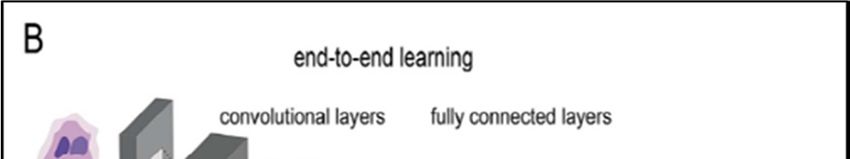
International Journal of Intelligent Information Systems 2020; 9(2): 6-15                           13

techniques are used for all the different images. This includes          process of converting the image into data so that these values
smoothing of image and, removal of noises, blurring, etc.                can be compared with the standard values and finally
Gabor filter was found to be suitable for both the CT and MRI            cancerous and noncancerous cells can be separated from the
images. The filtering of the image proves to be useful for               data. Some of the features which are necessary to be
further steps.                                                           calculated are listed below.
   Feature Extraction: The Image feature extraction stage is an
essential step that represents the final output and determines           3.4.1. Color Features
the normality and abnormality of an image using algorithms                 The mean color values of the grey images are acquired.
and techniques                                                           3.4.2. Geometric Features
                                                                            The perimeter, radius, area, rectangularity, compactness,
3. Methodology                                                           convexity, concavity, symmetry, elongation, eccentricity,
                                                                         solidity is obtained.
   After studying the literature, the following general method              Radius: measured by averaging the length of the radial line
for automatic blood cancer detection is proposed.                        segments defined by the centroid and border points.
                                                                            Perimeter: the total distance between consecutive points of
                                                                         the border
                                                                            Area: the number of pixels on the interior of the cell,
                                                                         defined separately for the nuclei and for the whole cell; as the
                                                                         features, let assume the area of the nucleus and the ratio of the
                                                                         areas of the nucleus and the whole cell.

                                                                                              Compactness = 〖perimeter〗^2/area (2)

                                                                            Concavity: the severity of concavities in a cell
                                                                            Concavity points: the number of concavities, irrespective of
                                                                         their amplitudes
      Figure 8. General Paradigm for Automatic Cancer Detection.            Symmetry: the difference between lines perpendicular to
                                                                         the major axis to the cell boundary in both directions Major
3.1. Microscopic Images                                                  and minor axis lengths
  Cancer infected blood cell images are collected from the               3.4.3. Texture Features
authorized laboratory or from any government hospital in                   The entropy, energy, homogeneity, correlation is obtained.
order to carry out further processing.
                                                                         3.4.4. Statistical Features
3.2. Enhancement                                                           The skewness, mean, variance and gradient matrix are
   Images may contain some artifacts initially, so there is a            obtained.
need to enhance the captured images. Most images contain                 3.5. Classifier
some sort of noise, so before proceeding further these artifacts
should be removed with the help of image enhancement                        In this final phase, the extracted features are used to
techniques like to remove noise use various kinds of operators           provide the final answer. All features extracted are listed in
i.e. Prewitt and Sobel, canny, etc.                                      the different columns with their values. When an image is
                                                                         provided as an input to the proposed system than the first
3.3. Segmentation                                                        step is to calculate the feature values. The values of the test
  Segmentation is a process of partitioning an image into                image features are checked with the previously calculated
subparts, so that proper each and every area is scanned properly.        values Based on the values of the input image the classifier
Microscopic images consist of red blood cells, white blood cells,        classifies that test image into either infected or not infected
and platelets. But in order to detect the presence of blood cancer,      class.
only the number of white blood cells are needed. So, with the
help of the segmentation process, the separation of the white            4. Conclusion
blood cells from red blood cells and platelets is achieved.
Various techniques used for segmentation are region-based                   Different categories of classification techniques and
segmentation, k-means Zack algorithm, morphological                      computing methodologies applied for cancer diagnosis using
operation, gradient magnitude, and watershed transform, etc.             images are presented in this paper. The categorization of these
                                                                         techniques with their advantages and disadvantages are
3.4. Feature Selection                                                   discussed.
                                                                            This work agrees with other researcher's findings such that
   In this phase, the main focus is to extract some of the               texture feature analysis is dependent on the quality of the
features from the processed image. Feature extraction is the             images of cancerous cells, and statistics modeling could be
14                          Saif Ali et al.:   Identification of Cancer Disease Using Image Processing Approahes

inaccurate in some specific situations. Each method own some             [11] V. Shankar, M. M. Deshpande, N. Chaitra, and S. Aditi,
sort of advantages and disadvantages. Diagnostic results of                   "Automatic detection of acute lymphoblastic leukemia using
                                                                              image processing," 2016 IEEE International Conference on
cancer using computer-aided detection methods are depends                     Advances in Computer Applications (ICACA), Coimbatore,
on the type of images and imaging techniques. The images                      2016, pp. 186-189. doi: 10.1109/ICACA.2016.7887948.
play foremost roles in determining the results of a cancer
diagnosis. In this work, we reviewed various statistical and             [12] Sarkar, S., & Das, S. (2016). A Review of Imaging Methods for
                                                                              Prostate Cancer Detection: Supplementary Issue: Image and
machine learning methodologies that perform analysis with a                   Video Acquisition and Processing for Clinical Applications.
texture feature of images and different data pre-processing                   Biomedical Engineering and Computational Biology.
techniques. We presented a comparative analysis of various                    https://doi.org/10.4137/BECB.S34255.
techniques based on their performance. This paper conclude
                                                                         [13] M a, Aswathy & Mohan, Jagannath. (2016). Detection of
based on our review results that a suitable selection of single               Breast Cancer on Digital Histopathology Images: Present
or combination of machine learning / soft computing                           Status and Future Possibilities. Informatics in Medicine
algorithms depends upon the data set, capable to yield results                Unlocked. 8. 10.1016/j.imu.2016.11.001.
with the accuracy of more or equal to 95% on the earlier
                                                                         [14] Basavanhally A, Yu E, Xu J, Ganesan S, Feldman M,
detection of cancer.                                                          Tomaszewski J, Madabhushi A. Incorporating domain
                                                                              knowledge for tubule detection in breast histopathology using
                                                                              O’Callaghan neighborhoods. Proc SPIE 2011; 7963: 796310–
References                                                                    25.

[1]   https://cancerstatisticscenter.cancer.org/#!/cancer-site/Leukemi   [15] Dundar M, Badve S, Bilgin G, Raykar VC, Jain RK, Sertel O,
      a [Accessed 5 Feb 2020].                                                et al. Computerized classification of intraductal breast lesions
                                                                              using histopathological images. IEEE Trans Biomed Eng 2011;
[2]   https://www.hematology.org/Patients/Basics/#[Accessed 5 Feb             58 (7): 1977–84.
      2020].
                                                                         [16] A. B. Tosun and C. Gunduz-Demir, C. Graph run-length
[3]   M. Saritha, B. Prakash, K. Sukesh and B. Shrinivas. (2016).             matrices for histopathological image segmentation, IEEE
      Detection of blood cancer in microscopic images of human                Transactions on Medical Imaging 30 (3), 2011, 732-566.
      blood        samples:       A       review.       596-600.
      10.1109/ICEEOT.2016.7754751.                                       [17] Veta M, van Diest PJ, Kornegoor R, Huisman A, Viergever MA,
                                                                              Pluim JPW. Automatic nuclei segmentation in H&E stained
[4]   R., Adollah, M. Y., Mashor, N. F. M, Nasir, H., Rosline, H.,            breast cancer histopathology images. PloS ONE 2013; 8 (7):
      Mahsin, H., Adilah. 2008). Blood Cell Image Segmentation: A             e70221.
      Review. Biomed2008, Proceedings 21, 2008, pp. 141-144.
                                                                         [18] Jain A, Atey S, Vinayak S, Srivastava V. Cancerous cell
[5]   Y. Chandni and Z. Shrutika. (2018). Automatic Blood Cancer              detection using histopathological image analysis. Int J Innov
      Detection Using Image Processing. International Journal of              Res Comput Commun Engng 2014; 2 (12): 7419–26.
      Recent Trends in Engineering & Research (IJRTER), vol. 04,
      no. 03, March 2018, ISSN 2455-1457.                                [19] Karsnas A. Image analysis methods and tools for digital
                                                                              histopathology applications relevant to breast cancer
[6]   S. Jagadeesh, E. Nagabhooshanam and S. Venkatachalam.                   diagnosis. Digit Compr Summ Upps Diss Fac Sci Technol
      (2013). Image processing based approach to cancer cell                  2014: 1128.
      prediction in blood samples. International Journal of
      Technology and Engineering Sciences 1.1 (2013): 1-10.              [20] Fernandes, Steven & Chakraborty, Baisakhi & Gurupur,
                                                                              Varadraj & Prabhu, Ananth. (2016). Early Skin Cancer
[7]   Mishra, Nabin K., and Mehemmed Emre Celebi. (2016). An                  Detection Using Computer-Aided Diagnosis Techniques.
      Overview of Melanoma Detection in Dermoscopy Images                     Journal of Integrated Design and Process Science. 20. 33-43.
      Using Image Processing and Machine Learning. ArXiv                      10.3233/jid-2016-0002.
      abs/1601.07843 (2016).
                                                                         [21] Rejintal, Ashwini & Aswini, N. (2016). Image processing
[8]   Sahni P., Mittal N. (2019) Breast Cancer Detection Using                based     leukemia  cancer   cell  detection.  471-474.
      Image Processing Techniques. In: Kumar M., Pandey R.,                   10.1109/RTEICT.2016.7807865.
      Kumar V. (eds) Advances in Interdisciplinary Engineering.
      Lecture Notes in Mechanical Engineering. Springer, Singapore.      [22] Neelima Singh, A. Asuntha (2016). L. Lung cancer detection
                                                                              using medical images through image Processing, Journal of
[9]   R. Stephanie, A. Hossein, S. Kevin and H. Johan (2017).                 Chemical and Pharmaceutical Sciences, pp 1558-1561
      Digital image analysis in breast pathology-from image
      processing techniques to artificial intelligence. Transl Res.      [23] Tamilmani, G. & Sivakumari, S. (2017). A survey on various
      2017 Nov 7 Published online 2017 Nov 7. doi:                            data mining methods for detecting cancer cells. 242-245.
      10.1016/j.trsl.2017.10.010.                                             10.1109/ICSTM.2017.8089160.

[10] Abdeldaim A. M., Sahlol A. T., Elhoseny M., Hassanien A. E.         [24] Cinalli, Giuseppe & Onorini, Nicola. (2020). Biopsy of the
     (2018) Computer-Aided Acute Lymphoblastic Leukemia                       Tumor. 10.1007/978-3-030-21299-5_4.
     Diagnosis System Based on Image Analysis. In: Hassanien A.,         [25] Candotto, Valentina & Pezzetti, F & Scarano, Antonio &
     Oliva D. (eds) Advances in Soft Computing and Machine                    Agazzi, A & Spadari, F & Palmieri, A. (2019). Liquid biopsy.
     Learning in Image Processing. Studies in Computational                   Journal of biological regulators and homeostatic agents. 33.
     Intelligence, vol 730. Springer, Cham.
International Journal of Intelligent Information Systems 2020; 9(2): 6-15                               15

[26] [Online] https://www.webmd.com/cancer/what-is-a-biopsy#1                Lung with K-NN Classification Using Genetic Algorithm,”
     [Accessed 12 Feb 2020].                                                 Procedia Mater. Sci., vol. 10, no. Cnt 2014, pp. 433–440, 2015.
[27] J. Alam, S. Alam, and A. Hossan, “Multi-Stage Lung Cancer         [31] M. Kurkure and A. Thakare, “Classification of Stages of Lung
     Detection and Prediction Using Multi-class SVM Classifie,”             Cancer using Genetic Candidate Group Search Approach,”
     Int. Conf. Comput. Commun. Chem. Mater. Electron. Eng.                 IOSR J. Comput. Eng., vol. 18, no. 05, pp. 07–13, 2016.
     IC4ME2 2018, pp. 1–4, 2018.
                                                                       [32] R. Tekade and K. Rajeswari, “Lung Cancer Detection and
[28] M. Vas and A. Dessai, “Lung cancer detection system using              Classification Using Deep Learning,” Proc. - 2018 4th Int.
     lung CT image processing,” 2017 Int. Conf. Comput. Commun.             Conf. Comput. Commun. Control Autom. ICCUBEA 2018, no.
     Control Autom., pp. 1–5, 2017.                                         2, pp. 259–262, 2018.
[29] S. Makaju, P. W. C. Prasad, A. Alsadoon, A. K. Singh, and A.      [33] A. Asuntha, A. Brindha, S. Indirani, and A. Srinivasan, “Lung
     Elchouemi, “Lung Cancer Detection using CT Scan Images,”               cancer detection using SVM algorithm and optimization
     Procedia Comput. Sci., vol. 125, no. 2009, pp. 107–114, 2018.          techniques,” J. Chem. Pharm. Sci., vol. 9, no. 4, pp. 3198–3203,
                                                                            2016.
[30] P. Bhuvaneswari and A. B. Therese, “Detection of Cancer in
You can also read