The keratin-filament cycle of assembly and disassembly
←
→
Page content transcription
If your browser does not render page correctly, please read the page content below
2266                                                                                                                      Research Article

                          The keratin-filament cycle of assembly and
                          disassembly
                          Anne Kölsch1,*, Reinhard Windoffer1,*,‡, Thomas Würflinger2, Til Aach2 and Rudolf E. Leube1,‡
                          1
                           Institute of Molecular and Cellular Anatomy, RWTH Aachen University, 52074 Aachen, Germany
                          2
                           Institute of Imaging and Computer Vision, RWTH Aachen University, 52056 Aachen, Germany
                          *These authors contributed equally to this work
                          ‡
                           Authors for correspondence (rwindoffer@ukaachen.de; rleube@ukaachen.de)

                          Accepted 9 April 2010
                          Journal of Cell Science 123, 2266-2272
                          © 2010. Published by The Company of Biologists Ltd
                          doi:10.1242/jcs.068080

                          Summary
                          Continuous and regulated remodelling of the cytoskeleton is crucial for many basic cell functions. In contrast to actin filaments and
                          microtubules, it is not understood how this is accomplished for the third major cytoskeletal filament system, which consists of
                          intermediate-filament polypeptides. Using time-lapse fluorescence microscopy of living interphase cells, in combination with
                          photobleaching, photoactivation and quantitative fluorescence measurements, we observed that epithelial keratin intermediate filaments
                          constantly release non-filamentous subunits, which are reused in the cell periphery for filament assembly. This cycle is independent
                          of protein biosynthesis. The different stages of the cycle occur in defined cellular subdomains: assembly takes place in the cell
                          periphery and newly formed filaments are constantly transported toward the perinuclear region while disassembly occurs, giving rise
                          to diffusible subunits for another round of peripheral assembly. Remaining juxtanuclear filaments stabilize and encage the nucleus.
                          Our data suggest that the keratin-filament cycle of assembly and disassembly is a major mechanism of intermediate-filament network
Journal of Cell Science

                          plasticity, allowing rapid adaptation to specific requirements, notably in migrating cells.

                          Key words: Cytokeratin, Network dynamics, Live-cell imaging

                          Introduction                                                               Pekny and Lane, 2007). Recent observations further revealed that
                          The cytoplasmic cytoskeleton of mammalian cells is composed                the keratin system affects many basic cellular processes, such as
                          of three major filament networks – actin filaments, microtubules           growth, proliferation, organelle transport, malignant transformation
                          and intermediate filaments (IFs). This scaffolding is not simply a         and stress response, further accentuating the dynamic properties of
                          static system conferring stability on cells, but is highly dynamic         the keratin network (Magin et al., 2007). Thus, interference with
                          and capable of rapid reorganization in response to various                 KF dynamics in human disease and transgenic mice leads to
                          extracellular and intracellular stimuli. Adjustment of actin               reduced resilience of epithelia to mechanical and other challenges
                          filaments and microtubules is accomplished through differential            with deleterious functional consequences (Arin, 2009; Vijayaraj et
                          regulation of polymerization at either end, depending on the               al., 2007). For this reason, elucidating the still-unresolved molecular
                          availability of nucleoside-triphosphate-bound soluble subunits             mechanisms of KF-network biogenesis and turnover is a pressing
                          and regulatory factors. One prominent mechanism of filament                issue.
                          remodelling is treadmilling, which exploits the structural                    At present, two conceptually different hypotheses are being
                          asymmetry of filament ends (Amann and Pollard, 2000; Margolis              discussed to explain IF assembly in living cells. The first model,
                          and Wilson, 1981; Pollard et al., 2000). Thus, subunits dissociate         which was recently termed dynamic co-translation, stresses the
                          from the minus end and are added to the plus end. IFs are                  integration of newly synthesized IF polypeptides at multiple sites
                          profoundly different from actin filaments and microtubules                 throughout the entire network (Chang et al., 2006; Goldman et al.,
                          because they lack polarity as a result of the symmetric                    2008). An alternative model suggests that keratin particles are
                          composition of their tetrameric subunits. Furthermore,                     preferentially generated at distinct loci in the cell periphery,
                          spontaneous self-assembly of tetramers into unit-length filaments          subsequently integrating into the peripheral keratin cytoskeleton
                          (ULFs), followed by compaction and longitudinal annealing,                 (Windoffer et al., 2006; Windoffer et al., 2004). Although both
                          occurs – at least in vitro – without nucleoside triphosphates and          scenarios provide concepts explaining how the network ‘grows’,
                          additional cofactors (Herrmann et al., 2007; Kim and Coulombe,             they do not address the problem of how the fully assembled
                          2007). How these in vitro observations relate to the in vivo               network changes over time. This is crucial for adaptation to varying
                          situation and how assembly is regulated is not understood.                 environmental conditions, for example, during development and
                             IFs are ubiquitous cytoskeletal components that are particularly        under mechanical stress.
                          abundant in epithelial cells. Epithelial IFs are composed of                  The goal of our study was to fill the existing gaps in these two
                          desmosome-anchored keratins, providing a mechanically resilient,           hypotheses and to evaluate their contribution to KF-network
                          complex scaffold (Sivaramakrishnan et al., 2008) that responds             dynamics. Using live-cell imaging, we discovered a protein-
                          quickly to various stimuli through specific structural adaptations.        biosynthesis-independent multistep disassembly and assembly cycle
                          Metabolic, thermal and mechanical stress therefore results in              that is continuously active and allows rapid keratin-network
                          considerable keratin IF (KF) reorganization (Magin et al., 2007;           adaptation, for instance in migrating cells.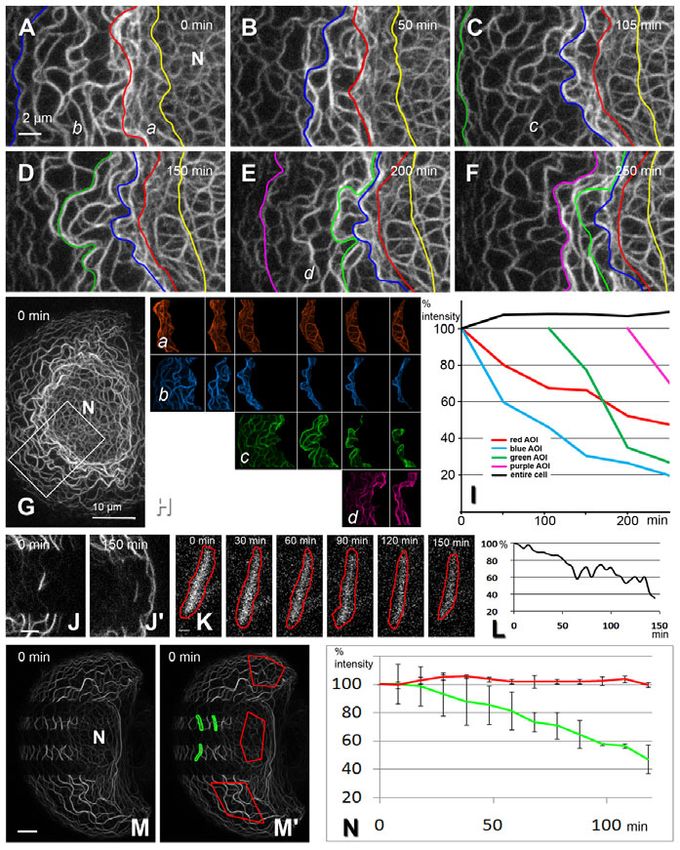
Keratin-filament cycle                  2267

                          Results                                                                 2009; Woll et al., 2005). To further track KFs after integration into
                          Keratin-filament network precursor formation occurs                     the peripheral network, image-processing algorithms were
                          preferentially in lamellipodia of migrating cells and                   developed and applied to motility analyses. First, global cellular
                          persists in the presence of protein biosynthesis inhibitors             movement was compensated for. Then, the medians of the
                          It was observed by time-lapse fluorescence recording of cell lines      translation vectors were computed for each grid point over time,
                          producing fluorescent epithelial KFs that KF formation occurs           assuming long-term local stability of keratin movement. This
                          preferentially at free cell edges and adjoining cell borders of         revealed coordinated and continuous centripetal keratin movement
                          stationary cells (Kolsch et al., 2009; Windoffer et al., 2004). After   all the way to the nucleus at an average speed of ~250 nm/minute,
                          scratch wounding, abundant KF precursors (KFPs) were seen at            with local heterogeneities between 100 and 600 nm/minutes (Fig.
                          the leading edge of approaching cells, thereby extending the IF         3; supplementary material Movie 5). The motion stopped upon
                          cytoskeleton towards the gap (Fig. 1A; supplementary material           reaching the juxtanuclear region.
                          Movie 1). This was also noted in single migrating cells (Fig. 1B-
                          E; supplementary material Movie 2). KFPs grow by elongation             Inward-moving keratin filaments disassemble into
                          and fusion until integration into the peripheral KF network (for        non-filamentous subunits
                          details, see Windoffer et al., 2004; Woll et al., 2005).                Given the movement of the entire keratin system toward the
                             Considering the abundance of keratin particles in the cell           nucleus, one would expect an incremental build up of keratin
                          periphery of wounded and migrating cells, we wanted to know             fluorescence near the nucleus; this is obviously not the case. To
                          whether protein biosynthesis is sufficient to account for keratin       test the hypothesis that KFs disassemble, the fluorescence of
                          assembly, as predicted by the dynamic co-translation model (Chang       selected KF subsets was monitored (Fig. 4; supplementary material
                          et al., 2006). Treatment with the translation inhibitors                Movies 6 and 7). First, regions of interest (ROIs) were defined
                          cycloheximide and puromycin, however, did not prevent KFP               between prominent peripheral KF bundles. The enclosed KFs
                          formation (Fig. 2; supplementary material Movies 3 and 4). KFPs         translocated continuously towards the nucleus while fusing,
                          can therefore assemble from a pre-existing keratin pool that is         generating fewer and thicker bundles (Fig. 4A-F; supplementary
                          either of significant size or continuously replenished.                 material Movie 6). As a result, the ROI size shrank (Fig. 4H).
Journal of Cell Science

                                                                                                  Fluorescence quantification revealed gradual loss that was fast
                          Keratin filaments translocate continuously toward the                   during the first 1-2 hours (~40% loss/hour), affecting the younger
                          nucleus                                                                 peripheral filaments, and slow later (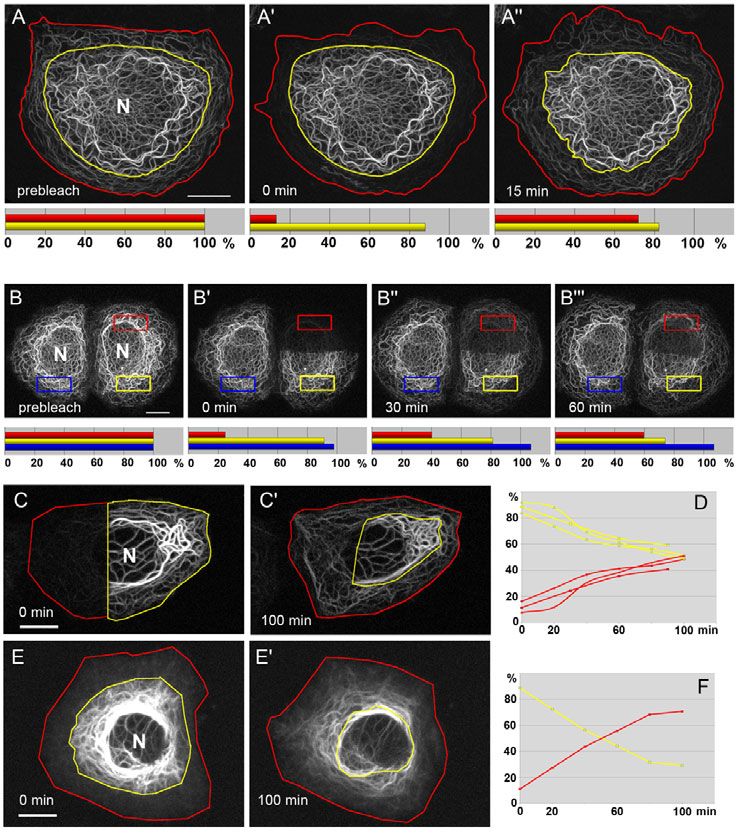
2268 Journal of Cell Science 123 (13)
best appreciated when the substantial initial fluorescence loss in which is in close agreement with the values for GFP measured by
the blue, green and pink ROIs is compared with the lower initial fluorescence correlation spectroscopy (FCS) (Dross et al., 2009).
loss in the red ROI, which was already more central when These findings reveal the existence of a mobile and diffusible
measurements began (Fig. 4). The apparent fluorescence loss is not cytoplasmic keratin pool whose precise composition and
caused by bleaching, because overall cellular fluorescence did not multimerization stage, however, still need to be determined by
decrease. Furthermore, degradation can also be excluded as a major more sensitive and accurate methods, such as FCS.
contributing factor, because the fluorescence decrease in entire
cells was less than 5% per hour in the presence of puromycin Disassembled keratin-filament subunits are reutilized for
(n4). peripheral keratin-filament assembly
To directly monitor disassembly of selected filament bundles, To demonstrate that assembling peripheral KFs are made from
short filament pieces were ‘isolated’ by bleaching the surrounding material that is derived from disassembled KFs, peripheral
areas (Fig. 4J-N; supplementary material Movie 7). These cytoplasmic zones of HK18-YFP-producing cells were bleached
experiments showed that fluorescence decreased continuously and (Fig. 5A). The mean fluorescence recovery in the peripheral
was not associated with filament fragmentation (i.e. particle cytoplasm was 72±24% after 15 minutes (n4). During the same
formation). We therefore conclude that KFs disintegrate on their time interval, 7.3±2.8% of the fluorescence was lost in the central,
way to the nucleus by the release of small, non-filamentous non-bleached region, presumably due to translocation of non-
oligomers that cannot be resolved as single particles, but appear as filamentous material to the cell periphery.
a diffuse weak signal throughout the cytoplasm. Next, an entire cell half was bleached (Fig. 5B). The appearance
of fluorescence predominantly in the periphery of the bleached
Cells contain a diffusible pool of keratins half and its subsequent movement to the cell interior are clearly
To examine the nature of the non-filamentous pool of disassembled seen in supplementary material Movie 8. Fluorescence intensities
KFs, fluorescence recovery after photobleaching (FRAP) analyses were measured within and outside of the bleached areas, and also
were performed. Filament-free regions were selected within in the neighbouring unbleached control cells. As expected,
bleached areas to measure the mobile fraction of non-filamentous fluorescence increased gradually in the bleached red ROI, with
Journal of Cell Science
keratins. The mobile fraction was 52.2±12.4% in PK18-5 cells ~60% recovery after 1 hour (Fig. 5B). The recovery rate in this
(n5). The diffusion coefficient of this mobile fraction was ROI is slower than that determined in the previous experiment
determined to be 0.88±0.08 m2/second for human keratin 18 (Fig. 5A), because of its more central location and the lower
(HK18)-YFP fusion protein (n9). Furthermore, the diffusion availability of material due to the much more extended bleaching.
coefficient was not significantly altered in the presence of Remarkably, fluorescence in the unbleached part of the cell
cytochalasin and nocodazole [1.06±0.31 m2/second for HK18- decreased during the 60 minute observation period and approached
YFP (n8); P0.1052]. In control experiments, the diffusion levels similar to those measured in the bleached area, thus providing
coefficient for YFP alone was 27.10±7.15 m2/second (n20), evidence of continuing KF-network turnover. In comparison, the
Fig. 2. KFP formation persists in the presence of
protein biosynthesis inhibitors. (A-D) Hepatocellular-
carcinoma-derived PLC cells of clone PK18-5 stably
producing keratin chimera HK18-YFP were treated at 20
minutes with the translation inhibitors cycloheximide
(17M; A-A; high magnifications of boxed region in B-
B) or puromycin (1g/ml; C-C; high magnifications of
boxed region in D-D). The images were taken from
supplementary material Movies 3 and 4. Note that KFP
formation and KFP integration into the KF network are not
prevented in either instance. Arrows in B-B and D-D
depict newly appearing KFPs, as determined from the
corresponding movies. (E,E⬘) Kymograms were prepared
from the fluorescence recorded along the dashed lines in B
and D, respectively, which further demonstrates ongoing
KFP formation (marked by arrows) and inward-directed
movement after drug application (addition of drugs at 20
minutes). N, nucleus. Scale bars: 10m.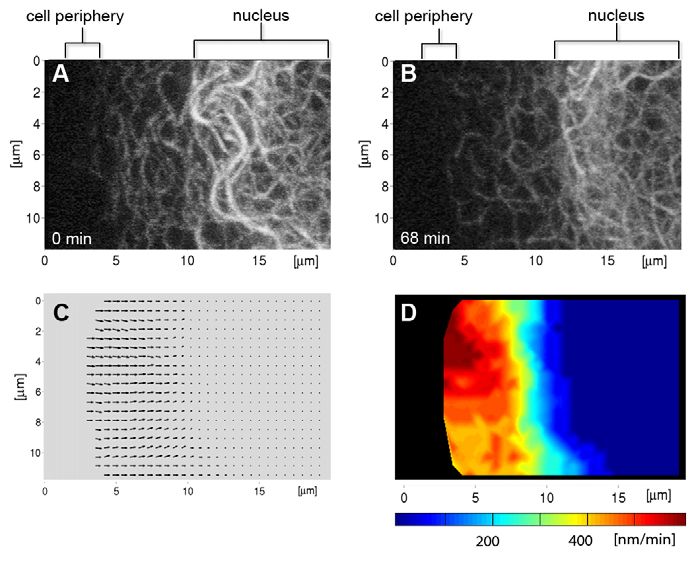
Keratin-filament cycle 2269
Fig. 3. The KF network translocates continuously towards the nucleus.
(A,B)Fluorescence micrographs showing a section of a PK18-5 cell (projected
images of 22 focal planes) at time points 0 and 68 minutes (cell periphery at
left, nucleus at right) observed by time-lapse imaging (60 second intervals; see
corresponding supplementary material Movie 5). (C)Vector visualization of
the direction and speed of KFs in this cell segment. Z-axis projections of all
Journal of Cell Science
volume were superimposed on grids of overlapping ROIs at 10-pixel spacing.
Between consecutive frames, each ROI was rigidly registered by the SSD
criterion using a weighted window to emphasize central parts. Assuming long-
term local stability of keratin movement, medians of the translocation vectors
were computed for each grid point over time. (D)Velocities from C depicted in
pseudo-colour representation.
Fig. 4. Inward-moving KFs disassemble into non-filamentous subunits.
(A-G)Images taken from a 250 minute time-lapse recording of HK18
fluorescence intensity in a corresponding ROI of the adjacent fluorescence in a PK18-5 cell (overview shown in G, with the boxed area
control cell remained almost the same, except for a slight increase delineating a region shown at high magnification in A-F). The confocal 4D data
that is most probably due to de novo protein biosynthesis (see also sets were recorded at 12 bit (recording interval 5 minutes; 11 planes each) for
250 minutes (supplementary material Movie 6). The coloured lines in A-F
Fig. 4I).
represent borders of ROIs that were defined in the outer part of the KF network
Photoactivation experiments were designed to obtain positive
between characteristic KF bundles. The borders were traced manually in the
proof that filament-bound keratin molecules are released and used projection images of each time point of the recording to ensure proper
for reassembly of new filaments without the need for de novo delineation. The individual ROIs are depicted in (Ha-d). Note that all ROIs
biosynthesis. After photoactivating human keratin 8 (HK8) hybrids moved from the cell periphery towards the nucleus (N), that is, from left to right,
in entire cell halves, new fluorescence appeared in the non-activated during the recording. The size of each ROI decreased continuously over time
parts, the source of which can only be the filament-bound (H). In addition, the relative fluorescence intensity in each ROI (or AOI)
photoactivated molecules from the other cell half (Fig. 5C-D). decreased over time, with a fast component in the beginning and a slow
Within 4 hours, an almost even distribution was noted throughout component later on (I; same colour code as in H). The black line in I shows the
the cytoplasm (not shown). This is in rough agreement with the fluorescence intensity of the entire cell over time. Scale bars: 2m (A), 10m
(G). (J-L)Projected fluorescence images (19 planes) and diagram from a time-
bleaching experiments, in which complete exchange of the KF
lapse series of a PK18-5 cell in which a single fluorescent KF fragment was
network was observed within 4 hours (supplementary material
‘isolated’ by bleaching the surrounding KFs. The nucleus (outside the depicted
Movie 8) (data not shown). Furthermore, photoactivated filaments area) is to the left, the cell periphery to the right. The isolated KF fragment is
concentrated around the nucleus, whereas inward-moving filaments shown at higher magnification at different time points in K. The red line depicts
re-appeared in the cell periphery (see Fig. 5D for quantifications). the border of the manually assigned ROIs, the intensities of which are plotted in
In support of this, photoactivating only perinuclear filaments L over time, revealing continuous fluorescence loss. Scale bars: 2m (J), 0.5m
resulted in the ‘spreading’ of fluorescence to the cell periphery (K). (M-N)Projected images (25 planes) at time point 0 minutes and a diagram
(Fig. 5E-F). derived from a subsequent time-lapse series (supplementary material Movie 7).
The PK18-5 cell (N, nucleus) was bleached in such a way that fluorescent
Discussion filament ‘fragments’ remained in two sectors. This allowed measurement of
fluorescence in these singled out KFs. ROIs that are shown in green in M⬘ were
Combining the current observations with previous reports on keratin
manually adjusted at each time point. The fluorescence of these mobile ROIs
dynamics, key steps of the KF assembly and disassembly cycle
was measured over time and compared to the fluorescence in fixed ROIs (red in
have begun to emerge. M⬘) within unbleached parts of the cell. The results for the three mobile and
fixed ROIs are summarized in the graph in N. Note the fluorescence decrease in
Nucleation the green ROIs due to filament disassembly, whereas it stays constant in the red
Nucleation of KFPs occurs preferentially in the cell periphery ROIs, where fluorescence loss from filament disassembly is compensated by
(Fig. 1 and Fig. 5B; supplementary material Movies 1, 2, 8) incoming new filaments. Scale bar: 10m (M).2270 Journal of Cell Science 123 (13)
Fig. 5. KFs disassemble to support KF assembly in the peripheral
cytoplasm. (A-B) Two representative FRAP experiments are depicted that
were performed in PK18-5 cells producing HK18-YFP. (A)The peripheral
network was bleached throughout the entire circumference in a zone extending
~5m from the plasma membrane to the cell interior (area between red and
yellow lines). The shape of the bleached and non-bleached areas was adjusted
by hand to account for cellular shape shifts. Within 15 minutes, considerable
fluorescence recovery was observed in the periphery (compare A⬘ and A⬙). The
histograms below summarize the results of fluorescence quantification in this
and three similarly treated cells. The red bars correspond to the average
fluorescence recovery in the cell periphery, whereas the yellow bars correspond
to the average fluorescence measured in the central cytoplasm. (B)Half of a
PK18-5 cell was bleached. Fluorescence recovery measured in the boxed ROI
(red), which encompasses mainly central filaments, was ~60% within 60
minutes (red bars in histograms below). By contrast, filaments in the
corresponding unbleached ROI (yellow box) decreased within the same time
period (yellow bars). For comparison, an ROI in a neighbouring cell that was
not bleached at all (blue box) shows slight increase in fluorescence, possibly
due to de novo synthesis (blue bars). Corresponding supplementary material
Movie 8 presents an image series of 3D reconstructions of the altering
fluorescence patterns. (C-F)Photoactivatable GFP fused to keratin 8 (HK8-
paGFP) was expressed in PLC cells. HK8-paGFP fluorescence was activated
with UV light (405 nm) in different cell regions. Subsequently, fluorescence
was monitored at 488 nm by time-lapse fluorescence microscopy. Note the
appearance of fluorescence in the non-activated parts of the cells (C⬘,E⬘). In
addition, fluorescence concentrated in the perinuclear domain, whereas
peripheral fluorescence was generated from new filament formation.
Journal of Cell Science
Quantification of fluorescence (in percent of total fluorescence) shows gradual
depletion of photoactivated regions (yellow) and simultaneous fluorescence
increase in non-activated areas (red). D, n3 and F (derived from E,E⬘). N,
nucleus. Scale bars: 10m.
(Windoffer et al., 2006; Windoffer et al., 2004; Yoon et al., 2001). Vectorial transport
Cells with increased KF-network reorganization, such as An intact actin-filament system is required for inward-directed
migrating cells, show a considerable increase in KFP formation KFP transport. The actin retrograde flow and ruffling activity
(Fig. 1) (Windoffer et al., 2006; Woll et al., 2005). Focal adhesions (Small and Resch, 2005) might provide the driving force for
are important regulators of keratin nucleation (Windoffer et al., centripetal KF movement (Kolsch et al., 2009; Windoffer et al.,
2006) by direct and/or indirect molecular association [(Steinbock 2006; Windoffer and Leube, 2001; Woll et al., 2005). Microtubules
et al., 2000); for other IFs, see the following references (Kreis et might also be needed, especially for the subsequent inward motion
al., 2005; Nikolic et al., 1996; Spurny et al., 2008; Steinbock et of the entire network (for a review, see Helfand et al., 2004).
al., 2000; Sun et al., 2008a; Sun et al., 2008b; Tsuruta and Jones,
2003)] and/or by signalling (e.g. Omary et al., 1998; Woll et al., Disassembly
2007). Inward-moving KFs dissolve without the appearance of distinct
particles (Fig. 4) either by degradation of KF polypeptides and/or
Elongation by disassembly into reusable non-filamentous subunits. Although
KFPs elongate by continuous integration of soluble oligomers at keratin ubiquitylation has been implicated in KF-network turnover
either end and mutual end-on fusion (Fig. 1B-D) (Windoffer et al., (Ku and Omary, 2000) and occurs in stress and disease (Jaitovich
2006; Windoffer et al., 2004; Woll et al., 2005) [for other IFs, see et al., 2008; Zatloukal et al., 2007), the second mechanism appears
the following references (Colakoglu and Brown, 2009; Kirmse et to be the major mode because pre-existing filaments are the source
al., 2007)]. of protein-biosynthesis-independent peripheral filament formation.
Of note, the static juxtanuclear filaments are quite stable, as is the
Integration case for desmosome-anchored KFs (Strnad et al., 2002).
End-on integration of KFPs into the peripheral KF network
terminates elongation and thereby introduces branch points into Diffusion
the filament network (Windoffer et al., 2006; Windoffer et al., A rather small though significant mobile fraction of fluorescent
2004; Woll et al., 2005). keratins with a fast recovery rate was identified in this study. This
diffusible keratin pool corresponds, at least in part, to the detergent-
Bundling soluble pool, which consists primarily of tetramers and also higher
The thickness of the KF bundles increases towards the nucleus order oligomers (Bachant and Klymkowsky, 1996; Chou et al.,
because of the lateral association of filament bundles (Figs 3-5; 1993; Soellner et al., 1985), as indicated by a diffusion coefficient
supplementary material Movies 5, 6 and 8). Bundling is regulated that was significantly lower than that of YFP alone. The
by IF-associated polypeptides (Listwan and Rothnagel, 2004) and identification of diffusing keratins shows that active transport
intrinsic properties of KFs (Lee and Coulombe, 2009). machinery is not needed to deliver disassembled keratins to theKeratin-filament cycle 2271
cell periphery for KF reassembly. This is also supported by the FRAP experiments
Two types of FRAP experiments were performed to either characterize fast processes
finding that KFP formation persists, although at reduced levels, in concerning non-filamentous keratins or examine the comparatively slow KF
the presence of actin filament and microtubule disruptors (Kolsch dynamics.
et al., 2009; Woll et al., 2005). The soluble pool is also available To determine the mobile fraction of non-filamentous keratins, a Zeiss 710 confocal
laser-scanning microscope was used. Square regions of ~8⫻15 m were bleached
for lateral exchange into existing filaments (Miller et al., 1991), in the peripheral cytoplasm using the 488 nm laser at high intensity. Twenty frames
which might explain the slight recovery of bleached filaments in were recorded within the next 10-20 seconds. Within the respective bleached regions,
our recordings (e.g. supplementary material Movies 7 and 8). completely filament-free irregularly shaped ROIs of 1-2 m width were chosen and
fluorescence recovery in these ROIs was analyzed with the help of Zeiss Zen
The revealed keratin cycle is different from dynamic co- software.
translation (Chang et al., 2006), because it is independent of protein To determine diffusion coefficients, 5 m diameter ROIs were bleached in the cell
biosynthesis, does not require microtubules and occurs in a spatially periphery and recovery was measured at 0.668 second intervals for 30 seconds. The
recovery curves were fitted according to the following equation (Ellenberg et al.,
defined manner. Our data suggest that the turnover cycle accounts 1997):
for the vast majority of newly formed filaments. In contrast to the
estimated ~25% hourly turnover rate of the keratin cycle, I(t) I(final)(1 – (w2(w2 + 4Dt)–1)1/2),
biosynthesis appears to be less than 5% per hour, as inferred from where I(t) is intensity as a function of time, w is the width of ROI (diameter), D is
the diffusion constant and t is time. As negative control, cells were fixed with
the overall fluorescence increase (e.g. Fig. 5B; Fig. 3N; data not methanol/acetone to demonstrate loss of fluorescence recovery. To exclude active
shown). It will be of interest to determine the different contributions transport, cells were treated with 25 M cytochalasin D and 75 M nocodazole (both
of the keratin cycle and dynamic co-translation mechanisms to from Sigma) 30 minutes prior to bleaching. For statistical evaluation, a two-tailed t-
test was performed.
network plasticity in relation to IF type, cell specialization and
To characterize the slower KF dynamics, a Leica TCS SP5 confocal laser-scanning
specific situation. microscope was employed. Complete fluorescence was measured in single cells and
The keratin cycle maintains a stationary network at steady state. stacks of images containing 4096 grey values (12 bit) were recorded with the 488
Preferential assembly at the leading edge of migrating cells leads nm laser excitation line prior to bleaching. Step size was between 300 and 500 nm.
For bleaching, the 488 nm laser line was applied to different ROIs at high intensity
to an imbalance and subsequent extension of the network towards until the fluorescence was below 10% of the pre-bleach level. Starting directly after
the lamellipodium. The self-sufficient keratin cycle can be bleaching, stacks were recorded at regular intervals using the same parameters as for
pre-bleach image recording.
Journal of Cell Science
accelerated or slowed by external factors, depending on specific
requirements. In support of this, both assembly and disassembly of Image generation from 3D stacks and quantification of fluorescence
wild-type and mutant keratins are slowed by p38 mitogen-activated To measure fluorescence intensities in 3D stacks of time series, maximum intensity
protein kinase inhibitors (Woll et al., 2007). This observation projections were first generated using ImageProPlus software (Media Cybernetics).
The projected images were used for preparing figures and movies. For quantification,
indicates the presence of a basic mechanism whereby signalling ROIs were selected from these projected images. Then, the sum of the grey values
affects network reorganization. It exemplifies how keratin-network was determined in the corresponding ROIs of each image of the z-stack. The values
cycling can be modulated by various types of stress, most notably determined for the ROIs in all planes of a stack were then added to calculate the
complete 3D fluorescence intensity of a ROI. For comparison of ROI intensities at
mechanical stress. Furthermore, regional regulation of the keratin different time points, it was often necessary to re-define ROIs to account for shifting,
cycle facilitates network restructuring in specific cell topologies. size changes and deformation. To correct measurements for background noise, the
This is needed, for example, in wounded tissues, in which migrating mean of the grey level per pixel was measured in cell-free regions and subtracted
from the grey values determined for pixels measured inside the ROI. Measurements
cells not only have to maintain a functional transcellular network were analyzed with the help of Excel spreadsheets.
but also need to modulate their network architecture during wound
closure. Kymograms
To represent movement of KFPs, kymograms were prepared from time-lapse
fluorescence recordings. Regions were selected extending from the cell edge to the
Materials and Methods central cytoplasm. Amira software (Visage Imaging) was used to project the enclosed
DNA cloning fluorescence and plot it over time.
Preparation of expression vectors pHK18-YFP and pHK8-CFP, which contain cDNA
encoding fusion proteins HK18-YFP and HK8-CFP, respectively, has been described Tracking of filaments
previously (Strnad et al., 2002; Windoffer and Leube, 2004). Plasmid clone paGFP- Confocal 4D data sets were recorded at 12 bit in cells producing fluorescent keratins.
N1, encompassing a CMV-promoter-driven cDNA encoding photoactivatable green Projections of each time point were used for tracking. ROIs containing a distinct
fluorescent protein (paGFP), was kindly provided by George Patterson (NIH, population of filaments were manually defined and Amira software was used to
Bethesda, MD) (Patterson and Lippincott-Schwartz, 2002). To prepare cDNA adapt the edges of the chosen ROIs to altered shape in the following frames by visual
encoding HK8-paGFP, HK8 cDNA was excised with BamHI and EcoRI from inspection. From selected time points, the fluorescence intensity of all ROIs was
plasmid pHK8-CFP and inserted into the paGFP-N1 vector. determined by adding their grey values in all 11 planes using ImagePro Plus macros.
In some instances, global cellular movement was compensated by an image-
Cell-culture experiments and manipulation intensity-based registration method (Würflinger et al., 2008) using the normalised
The human hepatocellular-carcinoma-derived epithelial cell line PLC and the stable sum of squared intensity differences (SSDs). Robustness was increased by embedding
HK18-YFP-producing subclone PK18-5 were described previously (Strnad et al., the registration in a multiscale Gaussian pyramid framework. Visual assessment of
2002). Spontaneously immortalized mouse mammary epithelial cells of line EpH4 the results revealed no misalignments. Based on the aligned image series, analyses
and stable transfectants synthesizing HK18-YFP have been presented elsewhere could be restricted to intracellular keratin motion. A z-axis projection of each volume
was superimposed by a grid of ROIs at 10-pixel spacing. The overlapping ROIs were
(Kolsch et al., 2009).
of 41-pixel width. Each ROI was rigidly registered to the previous frame by SSD
For assessment of drug-induced keratin alterations, cells were seeded in glass-
criterion using an exhaustive search for translations of ±20 pixels. SSD was modified
bottom Petri dishes (MatTek) and treated with 17 M cycloheximide (Windoffer et
by a weighted window function on the ROIs, which dropped linearly from the centre
al., 2000) (Sigma) or 1-2 g/ml puromycin (Sigma).
to zero. Thus, the non-rigid character of the data was accounted for and enough
Scratch-wounding assays were performed in completely confluent cell monolayers structural information was captured by the ROIs, similarly to the work of Wilkie and
producing homogenously labelled KF networks using a microinjection needle. KF- Vrscay (Wilkie and Vrscay, 2005). Assuming long-term local stability of the keratin
network reorganization during wound closure was monitored by recording time- flow, the medians of the translation vectors were computed for each grid point over
lapse fluorescence images. time.
Live-cell imaging
Cells were imaged by epifluorescence and confocal laser-scanning microscopy as We thank Ursula Wilhelm for expert technical assistance and George
described (Windoffer and Leube, 2004). Conversion of paGFP was done by irradiation Patterson (NIH, Bethesda, USA) for the plasmid encoding paGFP. We
with five successive scans of 405 nm light at 100% laser intensity. also thank Stéphanie Portet (University of Manitoba), Bernd Hoffmann2272 Journal of Cell Science 123 (13)
(IBN, Jülich) and Claudia Krusche (RWTH, Aachen) for help analyzing Patterson, G. H. and Lippincott-Schwartz, J. (2002). A photoactivatable GFP for
the data. This work was supported by the German Research Council selective photolabeling of proteins and cells. Science 297, 1873-1877.
Pekny, M. and Lane, E. B. (2007). Intermediate filaments and stress. Exp. Cell Res. 313,
(LE 566/10, WI 731/6-1). 2244-2254.
Supplementary material available online at Pollard, T. D., Blanchoin, L. and Mullins, R. D. (2000). Molecular mechanisms
controlling actin filament dynamics in nonmuscle cells. Annu. Rev. Biophys. Biomol.
http://jcs.biologists.org/cgi/content/full/123/13/2266/DC1
Struct. 29, 545-576.
Sivaramakrishnan, S., DeGiulio, J. V., Lorand, L., Goldman, R. D. and Ridge, K. M.
References (2008). Micromechanical properties of keratin intermediate filament networks. Proc.
Amann, K. J. and Pollard, T. D. (2000). Cellular regulation of actin network assembly. Natl. Acad. Sci. USA 105, 889-894.
Curr. Biol. 10, R728-R730. Small, J. V. and Resch, G. P. (2005). The comings and goings of actin: coupling
Arin, M. J. (2009). The molecular basis of human keratin disorders. Hum. Genet. 125, protrusion and retraction in cell motility. Curr. Opin. Cell Biol. 17, 517-523.
355-373. Soellner, P., Quinlan, R. A. and Franke, W. W. (1985). Identification of a distinct soluble
Bachant, J. B. and Klymkowsky, M. W. (1996). A nontetrameric species is the major subunit of an intermediate filament protein: tetrameric vimentin from living cells. Proc.
soluble form of keratin in Xenopus oocytes and rabbit reticulocyte lysates. J. Cell Biol. Natl. Acad. Sci. USA 82, 7929-7933.
132, 153-165. Spurny, R., Gregor, M., Castanon, M. J. and Wiche, G. (2008). Plectin deficiency
Chang, L., Shav-Tal, Y., Trcek, T., Singer, R. H. and Goldman, R. D. (2006). Assembling affects precursor formation and dynamics of vimentin networks. Exp. Cell Res. 314,
an intermediate filament network by dynamic cotranslation. J. Cell Biol. 172, 747-758. 3570-3580.
Chou, C. F., Riopel, C. L., Rott, L. S. and Omary, M. B. (1993). A significant soluble Steinbock, F. A., Nikolic, B., Coulombe, P. A., Fuchs, E., Traub, P. and Wiche, G.
keratin fraction in ‘simple’ epithelial cells. Lack of an apparent phosphorylation and (2000). Dose-dependent linkage, assembly inhibition and disassembly of vimentin and
glycosylation role in keratin solubility. J. Cell Sci. 105, 433-444. cytokeratin 5/14 filaments through plectin’s intermediate filament-binding domain. J.
Colakoglu, G. and Brown, A. (2009). Intermediate filaments exchange subunits along Cell Sci. 113, 483-491.
their length and elongate by end-to-end annealing. J. Cell Biol. 185, 769-777. Strnad, P., Windoffer, R. and Leube, R. E. (2002). Induction of rapid and reversible
Dross, N., Spriet, C., Zwerger, M., Muller, G., Waldeck, W. and Langowski, J. (2009). cytokeratin filament network remodeling by inhibition of tyrosine phosphatases. J. Cell
Mapping eGFP oligomer mobility in living cell nuclei. PLoS One 4, e5041. Sci. 115, 4133-4148.
Ellenberg, J., Siggia, E. D., Moreira, J. E., Smith, C. L., Presley, J. F., Worman, H. J. Sun, N., Critchley, D. R., Paulin, D., Li, Z. and Robson, R. M. (2008a). Human alpha-
and Lippincott-Schwartz, J. (1997). Nuclear membrane dynamics and reassembly in synemin interacts directly with vinculin and metavinculin. Biochem. J. 409, 657-667.
living cells: targeting of an inner nuclear membrane protein in interphase and mitosis. Sun, N., Critchley, D. R., Paulin, D., Li, Z. and Robson, R. M. (2008b). Identification
J. Cell Biol. 138, 1193-1206. of a repeated domain within mammalian alpha-synemin that interacts directly with talin.
Goldman, R. D., Grin, B., Mendez, M. G. and Kuczmarski, E. R. (2008). Intermediate Exp. Cell Res. 314, 1839-1849.
filaments: versatile building blocks of cell structure. Curr. Opin. Cell Biol. 20, 28-34. Tsuruta, D. and Jones, J. C. (2003). The vimentin cytoskeleton regulates focal contact
Helfand, B. T., Chang, L. and Goldman, R. D. (2004). Intermediate filaments are size and adhesion of endothelial cells subjected to shear stress. J. Cell Sci. 116, 4977-
dynamic and motile elements of cellular architecture. J. Cell Sci. 117, 133-141. 4984.
Journal of Cell Science
Herrmann, H., Bar, H., Kreplak, L., Strelkov, S. V. and Aebi, U. (2007). Intermediate Vijayaraj, P., Sohl, G. and Magin, T. M. (2007). Keratin transgenic and knockout mice:
filaments: from cell architecture to nanomechanics. Nat. Rev. Mol. Cell Biol. 8, 562-573. functional analysis and validation of disease-causing mutations. Methods Mol. Biol.
Jaitovich, A., Mehta, S., Na, N., Ciechanover, A., Goldman, R. D. and Ridge, K. M. 360, 203-251.
(2008). Ubiquitin-proteasome-mediated degradation of keratin intermediate filaments Wilkie, K. P. and Vrscay, E. R. (2005). Mutual information-based methods to improve
in mechanically stimulated A549 cells. J. Biol. Chem. 283, 25348-25355. local region-of-interest image registration. In Image Analysis and Recognition (Lecture
Kim, S. and Coulombe, P. A. (2007). Intermediate filament scaffolds fulfill mechanical, Notes in Computer Science), Vol. 3656 (ed. M. Kamel and A. Campilho), pp. 63-72.
organizational, and signaling functions in the cytoplasm. Genes Dev. 21, 1581-1597. Berlin/Heidelberg: Springer.
Kirmse, R., Portet, S., Mucke, N., Aebi, U., Herrmann, H. and Langowski, J. (2007). Windoffer, R. and Leube, R. E. (2001). De novo formation of cytokeratin filament
A quantitative kinetic model for the in vitro assembly of intermediate filaments from networks originates from the cell cortex in A-431 cells. Cell Motil. Cytoskeleton 50, 33-
tetrameric vimentin. J. Biol. Chem. 282, 18563-18572. 44.
Kolsch, A., Windoffer, R. and Leube, R. E. (2009). Actin-dependent dynamics of keratin Windoffer, R. and Leube, R. E. (2004). Imaging of keratin dynamics during the cell cycle
filament precursors. Cell Motil. Cytoskeleton 66, 976-985. and in response to phosphatase inhibition. Methods Cell Biol. 78, 321-352.
Kreis, S., Schonfeld, H. J., Melchior, C., Steiner, B. and Kieffer, N. (2005). The Windoffer, R., Beile, B., Leibold, A., Thomas, S., Wilhelm, U. and Leube, R. E.
intermediate filament protein vimentin binds specifically to a recombinant integrin (2000). Visualization of gap junction mobility in living cells. Cell Tissue Res. 299,
alpha2/beta1 cytoplasmic tail complex and co-localizes with native alpha2/beta1 in 347-362.
endothelial cell focal adhesions. Exp. Cell Res. 305, 110-121. Windoffer, R., Woll, S., Strnad, P. and Leube, R. E. (2004). Identification of novel
Ku, N. O. and Omary, M. B. (2000). Keratins turn over by ubiquitination in a principles of keratin filament network turnover in living cells. Mol. Biol. Cell 15, 2436-
phosphorylation-modulated fashion. J. Cell Biol. 149, 547-552. 2448.
Lee, C. H. and Coulombe, P. A. (2009). Self-organization of keratin intermediate filaments Windoffer, R., Kolsch, A., Woll, S. and Leube, R. E. (2006). Focal adhesions are
into cross-linked networks. J. Cell Biol. 186, 409-421. hotspots for keratin filament precursor formation. J. Cell Biol. 173, 341-348.
Listwan, P. and Rothnagel, J. A. (2004). Keratin bundling proteins. Methods Cell Biol. Woll, S., Windoffer, R. and Leube, R. E. (2005). Dissection of keratin dynamics:
78, 817-827. different contributions of the actin and microtubule systems. Eur. J. Cell Biol. 84, 311-
Magin, T. M., Vijayaraj, P. and Leube, R. E. (2007). Structural and regulatory functions 328.
of keratins. Exp. Cell Res. 313, 2021-2032. Woll, S., Windoffer, R. and Leube, R. E. (2007). p38 MAPK-dependent shaping of the
Margolis, R. L. and Wilson, L. (1981). Microtubule treadmills-possible molecular keratin cytoskeleton in cultured cells. J. Cell Biol. 177, 795-807.
machinery. Nature 293, 705-711. Würflinger, T., Bergmeister, M., Böcking, A., Meyer-Ebrecht, D. and Aach, T. (2008).
Miller, R. K., Vikstrom, K. and Goldman, R. D. (1991). Keratin incorporation into Image registration for multimodal cell analysis. Cell. Oncol. 30, 166.
intermediate filament networks is a rapid process. J. Cell Biol. 113, 843-855. Yoon, K. H., Yoon, M., Moir, R. D., Khuon, S., Flitney, F. W. and Goldman, R. D.
Nikolic, B., Mac Nulty, E., Mir, B. and Wiche, G. (1996). Basic amino acid residue (2001). Insights into the dynamic properties of keratin intermediate filaments in living
cluster within nuclear targeting sequence motif is essential for cytoplasmic plectin- epithelial cells. J. Cell Biol. 153, 503-516.
vimentin network junctions. J. Cell Biol. 134, 1455-1467. Zatloukal, K., French, S. W., Stumptner, C., Strnad, P., Harada, M., Toivola, D. M.,
Omary, M. B., Ku, N. O., Liao, J. and Price, D. (1998). Keratin modifications and Cadrin, M. and Omary, M. B. (2007). From Mallory to Mallory-Denk bodies: what,
solubility properties in epithelial cells and in vitro. Subcell. Biochem. 31, 105-140. how and why? Exp. Cell Res. 313, 2033-2049.You can also read