Substrate Stiffness Increases Twitch Power of Neonatal Cardiomyocytes in Correlation with Changes in Myofibril Structure and Intracellular Calcium
←
→
Page content transcription
If your browser does not render page correctly, please read the page content below
Biophysical Journal Volume 101 November 2011 2455–2464                                                                                  2455

Substrate Stiffness Increases Twitch Power of Neonatal Cardiomyocytes in
Correlation with Changes in Myofibril Structure and Intracellular Calcium

Anthony G. Rodriguez,† Sangyoon J. Han,‡ Michael Regnier,† and Nathan J. Sniadecki†‡*
†
    Department of Bioengineering and ‡Department of Mechanical Engineering, University of Washington, Seattle, Washington

ABSTRACT During neonatal development, there is an increase in myocardial stiffness that coincides with an increase in the
contractility of the heart. In vitro assays have shown that substrate stiffness plays a role in regulating the twitch forces produced
by immature cardiomyocytes. However, its effect on twitch power is unclear due to difficulties in measuring the twitch velocity of
cardiomyocytes. Here, we introduce what we consider a novel approach to quantify twitch power by combining the temporal
resolution of optical line scanning with the subcellular force resolution of micropost arrays. Using this approach, twitch power
was found to be greater for cells cultured on stiffer posts, despite having lower twitch velocities. The increased power was attrib-
uted in part to improved myofibril structure (increased sarcomere length and Z-band width) and intracellular calcium levels.
Immunofluorescent staining of a-actin revealed that cardiomyocytes had greater sarcomere length and Z-band width when
cultured on stiffer arrays. Moreover, the concentration of intracellular calcium at rest and its rise with each twitch contraction
was greater for cells on the stiffer posts. Altogether, these findings indicate that cardiomyocytes respond to substrate stiffness
with biomechanical and biochemical changes that lead to an increase in cardiac contractility.

INTRODUCTION
During development, the elastic modulus of heart tissue                    because it reflects the heart’s rate of work during the ejec-
increases threefold from embryonic to neonatal stages in                   tion phase of systole (18,19). However, measuring twitch
mice (1) and doubles from neonatal to adult stages in rats                 power in response to stiffness requires improved cell culture
(2). This stiffening of the myocardium coincides with an                   assays with well-defined stiffnesses that allow for simulta-
increase in the capacity of the heart to pump blood (3–5).                 neous measurement of twitch velocity and force. Because
At the cellular level during development, cardiomyocytes                   force and velocity are not constant throughout a twitch
have improved contractility that is associated with a hyper-               contraction, capturing the dynamics of a twitch requires a
trophic growth phase, leading to cells that are larger in size             high degree of temporal resolution in the measurement
and that have increased myofibril density, alignment, and                  approach. This limits the application of previous approaches
resting sarcomere length (4–6). These cells also exhibit a                 that analyzed contractility in primarily isometric or isotonic
high degree of plasticity, enabling them to adapt to changes               conditions (14,18–21).
in their physical environment (7,8). Similar observations of                  In this study, we developed what we consider a novel
myodifferentiation and myofibrillogenesis in response to                   approach that combines high-speed line scanning with mi-
substrate stiffness have been seen in satellite cells (9),                 crofabricated arrays of flexible posts. This approach provided
mesenchymal stem cells (10), and other cardiac progenitors                 the temporal resolution necessary to measure the power
(11). Additionally, higher substrate stiffness can have a                  of neonatal rat cardiomyocytes cultured on post arrays of
positive effect on intracellular calcium transients (12),                  different stiffness. The microposts acted as force sensors
which in turn increases cardiac contractility (13,14). These               and line scanning was able to track the deflections of the posts
observations suggest that changes in myocardial stiffness                  at a frequency that was 20 times greater than video micros-
after birth may help improve the contractile power of the                  copy. Others have measured neonatal cardiomyocytes on
cardiomyocytes by affecting a change in myofibril structure                arrays of posts previously (22–24), but without sufficient
and performance.                                                           temporal resolution to assess twitch dynamics. Using our
   Studying how cardiac contractility responds to changes in               approach, cardiomyocytes were found to have a twitch power
stiffness has been difficult due to the inability to measure               that was greater when cultured on substrates with higher
twitch power. Others have used maximum twitch force as                     stiffness. Cardiomyocytes on these stiffer arrays had greater
a metric of contractility and reported that cardiomyocytes                 sarcomere length and Z-band width, indicating that orga-
produce more force in response to higher substrate stiffness               nization of myofibril structure was influenced by substrate
(10,12,15–17). Although force is an important component                    stiffness. We further determined that intracellular calcium
of contractility, twitch power is a more complete metric                   levels during a twitch contraction increased with stiffness,
                                                                           which matched with the higher twitch forces observed. Based
                                                                           on these findings, we propose that along with increased
Submitted July 8, 2011, and accepted for publication September 30, 2011.   calcium activation, neonatal rat cardiomyocytes undergo
*Correspondence: nsniadec@uw.edu                                           structural improvements within their myofibril array in
Editor: Andrew McCulloch.
Ó 2011 by the Biophysical Society
0006-3495/11/11/2455/10 $2.00                                                                                   doi: 10.1016/j.bpj.2011.09.057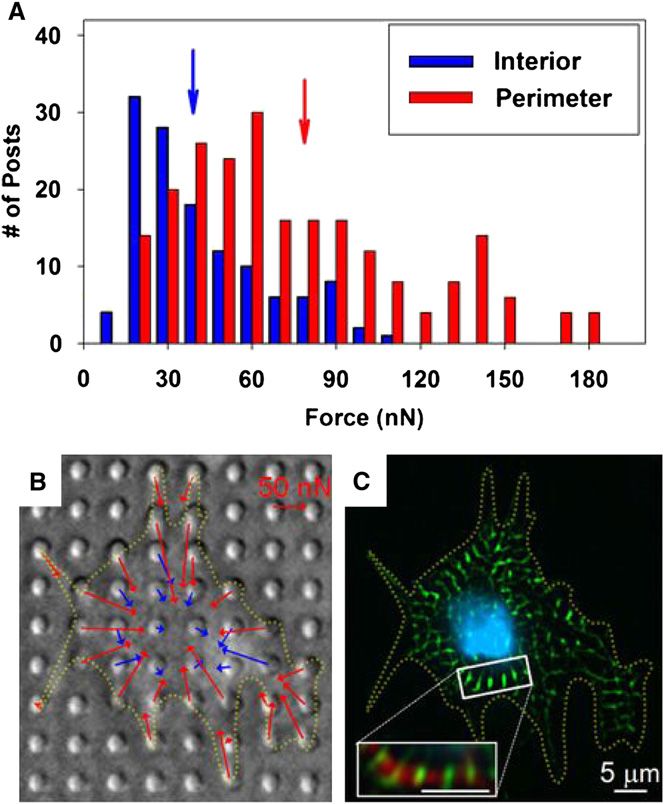
2456                                                                                                                                          Rodriguez et al.

response to the higher stiffness of their environment, result-                    20 ms. Consequently, using the Nyquist sampling theorem, a minimum
ing in a more powerful twitch contraction.                                        of 10.5 fps was required to record the maximum deflection in a post from
                                                                                  a twitch contraction.
                                                                                     A Gaussian fitting algorithm in IGOR (WaveMetrics, Lake Oswego, OR)
MATERIALS AND METHODS                                                             was used to identify the position of each post in a frame, as previously
                                                                                  described in Sniadecki et al. (28). From analysis of the videos, the deflec-
Microposts                                                                        tion of a post, d, during a twitch contraction was determined by

Polydimethylsiloxane (PDMS, Sylgard 184; Dow Corning, Midland, MI)                                              d ¼ xi  xref ;                               (2)
was used to produce arrays of microposts on glass coverslips through
                                                                                                                                th
a replica-molding process from silicon masters as previously reported             where xi is the position of a post in the i video frame during a twitch
(25). The thickness of the PDMS film underneath the microposts was                contraction and xref is its reference position taken a point in time between
35 5 5 mm. The spring constant of a post, k, was calculated by                    contractions, i.e., its resting state. The instantaneous twitch force, F, could
                                                                                  be calculated for each frame in the video by
                                     3pED4
                              k ¼          ;                               (1)                                      F ¼ kd:                                   (3)
                                      64L3
                                                                                  The force at a post that a cell produced during its resting state was calcu-
where E is the Young’s modulus of PDMS, D is the diameter, and L is height        lated from the difference in its resting position (xref) and its original, unde-
of the post. Four different arrays of microposts were used that had uniform       flected position. The undeflected positions of the posts were found by
spring constants of 29 5 16, 76 5 8, 103 5 14, and 142 5 30 nN/mm, as             determining the location of the intersections between best-fit lines through
estimated from the dimension of the posts and tensile measurements of             the rows and columns of nearby posts in the field of view that were not in
PDMS (26). These arrays had effective shear moduli of 3 5 2, 8 5 1,               contact with the cell. Additionally, the contractile work at a post, W, was
10 5 1, and 15 5 2 kPa, based upon the spacing, diameter, and height              estimated by the change in its strain energy, DU, during the shortening
of the microposts within the array (see Appendix). These shear moduli             phase of the twitch contraction,
were chosen because they closely matched the stiffness measured in
myocardial tissue during postnatal development (1,2,27). Arrays were                                                     1  2     2

prepared for cell culture by microcontact-printing fibronectin (50 mg/mL;                             W ¼ DU ¼             k xi  xref  :                     (4)
BD Biosciences, Franklin Lakes, NJ) onto the tips of the posts. The arrays                                               2
were then incubated in 0.2% Pluronics (Sigma-Aldrich, St. Louis, MO)
overnight at 4 C to block the adsorption of additional proteins to the surface
of the microposts.                                                                Measurement of velocity and power
                                                                                  As previously described for video microscopy, cells were placed in an Ion-
Cell culture                                                                      Optix field stimulation chamber, stimulated at 5 Vand at 0.5 Hz. Posts at the
                                                                                  perimeters of cells were measured with IonOptix’s line scanning software
Cardiomyocytes were isolated from 2- to 4-day-old newborn Fischer                 and IonOptix optical equipment. Briefly, the image of a post was positioned
344 rats, as previously described (27), under approval of the University          in the field of view of the camera such that its deflection was aligned with
of Washington Animal Care Committee and in accordance with federal                the axis of the scan line (see Fig. 3 A). The leading edge of the post was
guidelines. Before seeding, arrays were submerged in 2 mL of plating              represented by a local minimum in the light intensity profile and its position
media at a 4:1 ratio of Dulbecco’s modified Eagle’s medium (DMEM;                 along the scan line was tracked throughout the twitch contraction. On
HyClone, Logan, UT) and M199 (10% horse serum, 5% fetal bovine serum,             average, the duration at which the velocity of a post was >90% of its
20 mM HEPES, 100 U/mL penicillin G, 100 mg/mL streptomycin, and                   maximum velocity was 16 5 4 ms. Subsequently, using the Nyquist
4 mM glutamine). Harvested cells were resuspended in plating media at             sampling theorem, a minimum of 154 Hz was required to record the abso-
a density of 1000 cells/mL and transferred to the substrates in 200 mL            lute maximum velocity of a twitch contraction. In comparison, line scan-
aliquots for a total of 200,000 cells per substrate. Within 24 h of seeding,      ning with IonOptix provided 240 Hz of temporal resolution, which was
culture media was changed and supplemented with 10 mM arabinosylcyto-             adequate to capture maximum velocity of a twitch.
sine to remove proliferating cells (such as fibroblasts) in the culture. All         The data collected were filtered with a Butterworth low-pass filter.
reagents were purchased from Sigma-Aldrich unless specifically noted.             Instantaneous velocity, v, was calculated by

                                                                                                                dd   ðdiþ1  di1 Þ
Measurement of force and work                                                                            v ¼       ¼                 ;                        (5)
                                                                                                                dt    ðtiþt  ti1 Þ
After seeding, cardiomyocytes were cultured on micropost arrays for five
days before measurements were made. This time under culture allowed               where i is the frame number and t is time. From Eqs. 2, 3, and 5, the instan-
the cells to adhere to posts, fully spread, and develop their myofibrils.         taneous power, P, could be determined by
The arrays with cells were placed into a field stimulation chamber (IonOp-                d          dd  dF  dd  dðkdÞ     dd
tix, Milton, MA) with Tyrode’s buffer (10 mM HEPES, 138 mM NaCl,                   P¼        ðFdÞ ¼ F þ d ¼ F þ d      ¼ 2F : (6)
5.5 mM glucose, 12 mM NaHCO3, 0.36 mM Na2HPO4, 2.9 mM KCl,                                dt         dt  dt  dt    dt      dt
0.5 mM MgCl2, and 1 mM CaCl2 at pH 7.4). A stimulation field of 5 V               It should be noted that the first term is the conventional definition of power
and 0.5 Hz was applied to induce twitch contractions. Cardiomyocytes              whereas the second term accounts for the fact that the loading rate of force
that contracted against the posts in response to the stimulation were re-         on a post is not constant during a twitch contraction.
corded on a Ti-E microscope using a 40 objective (Nikon, Melville,
NY) under phase-contrast and a cooled charge-coupled device camera
(CoolSnap HQ2; Photometrics, Tucson, AZ). Cells were not analyzed if              Measurement of intracellular calcium
they were in contact with adjacent cells, did not contract under stimulation,
or failed to visibly deflect the posts. On average, the duration of time that     Cardiomyocytes on the softest (3 kPa) and stiffest (15 kPa) arrays were
posts were deflected for >90% of their maximum deflection was 190 5               loaded with 2 mM Fura-2 AM (Molecular Probes, Eugene, OR) in Tyrode’s

Biophysical Journal 101(10) 2455–2464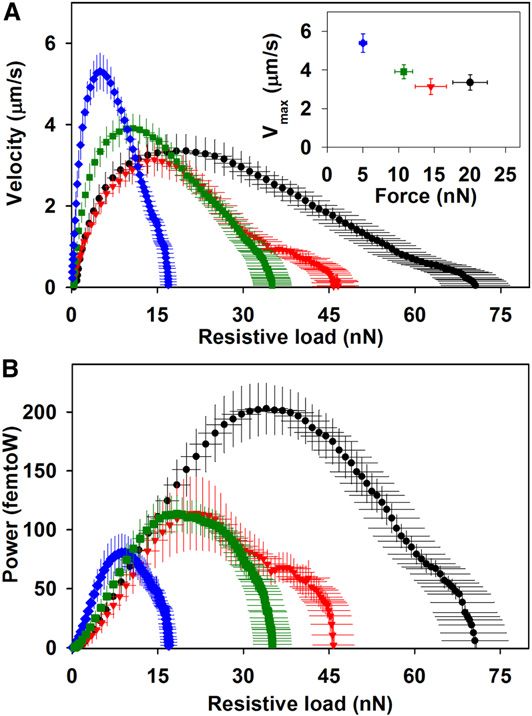
Stiffness Improves Neonatal Twitch Power 2457
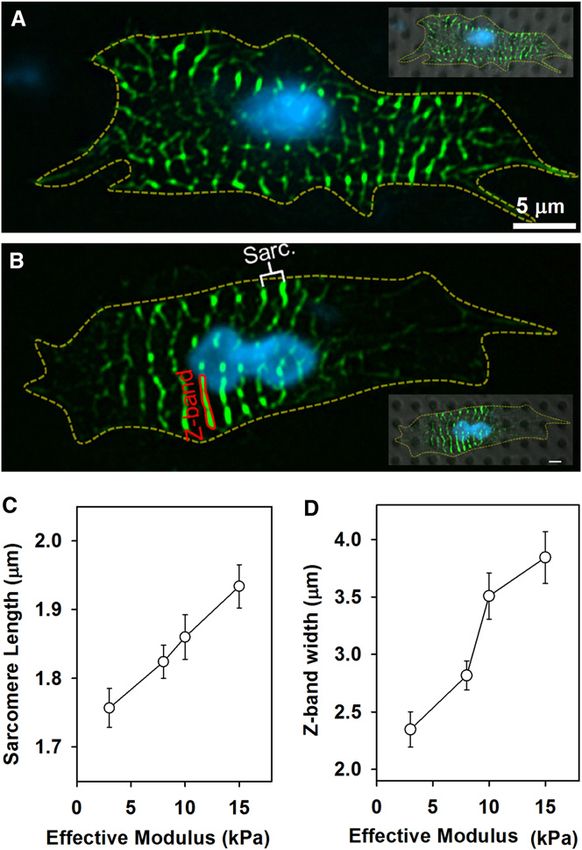
buffer and measured with the IonOptix system for intracellular calcium based upon their spatial location: 1), those at the perimeter
analysis. The ratio of fluorescent intensities between wavelengths of and 2), those within the interior of the cells (Fig. 1 A).
360 nm and 380 nm in a cell was used as an indicator of the free calcium
in its cytosol (see Fig. 6 A). The ratios were converted to intracellular
The largest twitch forces were measured at the perimeter
calcium concentrations by applying the Grynkiewicz equation, as described and had orientations that were directed centripetally (Fig. 1
previously (29). B). Twitch forces at the perimeter were determined to be
significantly greater than those in the interior (Wilcoxon
rank-sum test, p < 0.05). Furthermore, the average twitch
Comparison between video microscopy
force per post at the perimeter was twofold larger than those
and line scanning
within the interior. Because the perimeter twitch forces were
Deflections for a single post were measured by both video microscopy and largest, we focused our power analysis on these posts.
line scanning for a paired comparison of the two techniques. Measurements Immunofluorescent staining of a-actinin and actin re-
were made on the same post, but for different twitch contractions because
vealed the presence of myofibrils with regular sarcomeric
it was not possible to perform both approaches simultaneously. To assess
the variability in maximum force and maximum velocity between twitch patterns. The a-actinin staining highlighted regular stria-
contractions, measurements were acquired an individual post for 90 twitch tions that were indicative of sarcomeres (Fig. 1 C), whereas
contractions that occurred over 180 s (n ¼ 6 cells). The results indicated
that twitch-to-twitch variances for a cell were small: 6.7 5 2.0% for
maximum force and 6.6 5 2.0% for maximum velocity. The small varia-
tions suggested that a direct comparison could be made between the two
techniques, even though the comparison would be made on measurements
of different twitch contractions.
Immunofluorescence analysis
To assess myofibril structures, cells were treated with 0.5% Triton X-100 in
an ice bath with protease inhibitors (20 mg/mL aprotinin, 1 mg/mL leupep-
tin, and 1 mg/mL pepstatin from G-Biosciences/Genotech, Maryland
Heights, MO), fixed in 4% paraformaldehyde, and blocked with 10%
goat serum. Z-bands were stained by incubating cells with monoclonal
mouse antibodies against sarcomeric a-actinin (Sigma-Aldrich) and
Alexa-Fluor 647 goat anti-mouse IgG antibodies (Invitrogen, Carlsbad,
CA). Nuclear staining was conducted using Hoescht 33342 (Invitrogen).
Image analysis of circularity in cell shape, sarcomere length, and Z-band
width was performed with NIS-Elements software (http://www.
nis-elements.com/). Circularity was determined by calculating the spread
area of a cell, multiplying by 4p, and dividing by the square of its perimeter,
as similar to previous studies (12). Sarcomere length was quantified by
drawing an analysis line between two Z-bands and calculating the distance
between the peaks in the fluorescence intensities. Z-band width was quan-
tified by applying an edge-detection algorithm to segment the individual
bands and then measuring their end-to-end length. At least 10 cells were
analyzed per condition.
Statistical analysis
Statistical differences between the four groups of stiffness tested were
determined by applying an analysis of variance (ANOVA) with Tukey’s
post-hoc analysis. A p-value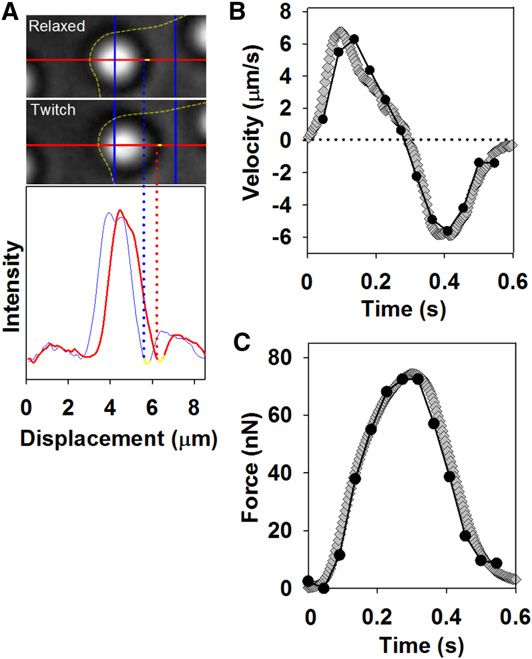
2458                                                                                                                                    Rodriguez et al.

costaining with phalloidin showed the greatest actin concen-                 Temporal resolution critical for measuring twitch
tration within the spacing between the striations (Fig. 1 C,                 velocity
inset). This regular arrangement of a-actinin and actin
                                                                             To gain insights into how twitch dynamics change with stiff-
denoted the myofibrils expected for a muscle cell. The
                                                                             ness, we developed a force analysis approach with an
orientation and development of these myofibrils were a
                                                                             improved rate of data sampling. Specifically, a line scanning
product of the cells adapting to their new environment as
                                                                             approach was used instead of video microscopy to track the
described previously (22). Taken together with the deflec-
                                                                             deflection of individual posts (Fig. 3 A). The necessity for
tion measurements of the posts, we could surmise that the
                                                                             greater temporal resolution was confirmed by comparing
forces measured at the posts on the perimeter are associated
                                                                             the deflections of the same post measured with both ap-
with myofibril structures developed in vitro.
                                                                             proaches (Fig. 3 B). The deviation between the two ap-
   To assess the effect of stiffness on cardiomyocyte
                                                                             proaches could be observed at the start of the contraction
contractility, cells were cultured on arrays of posts with
                                                                             phase, when the twitch velocity accelerates from zero to
different effective shear moduli (see Appendix). Twitch
                                                                             its maximum velocity. The maximum velocity measured
forces were calculated at individual posts along the perim-
                                                                             by the two approaches differed on average by 37.9 5
eter of the cell and averaged for each array. We found
                                                                             17.3% (n ¼ 10 posts), which was significantly greater
a statistically significant correlation between twitch force
                                                                             than the twitch-to-twitch variance in the maximum velocity
and stiffness (Fig. 2 A; ANOVA, p < 0.05). Additionally,
                                                                             (6.6 5 2.0%, in Materials and Methods). Furthermore, the
forces applied to the posts between twitch contractions,
                                                                             increase in precision was indicated by comparing the 95%
i.e., forces produced during the resting state, increased
                                                                             confidence intervals for maximum velocity for the two
with stiffness as well (Fig. 2 A, ANOVA, p < 0.05). By
                                                                             approaches. For line scanning, its confidence interval was
adding the twitch forces and resting forces together, the
resulting total force produced by cardiomyocytes was seen
to increase from 20 nN for cells on the softest arrays to
120 nN for those on the stiffest arrays. The increase in
twitch force also corresponded with an increase in the
contractile work of the cells (Fig. 2 B). Others have observed
similar results in force and work in response to substrate
stiffness (12,15,16,30), but measuring the twitch force using
microposts allowed us to directly link the effect of stiffness
to the myofibrils associated at the posts. Thus, these results
indicated that cardiomyocytes cultured on stiffer substrates
can produce greater force and work with their subcellular
arrangement of myofibrils.

                                                                             FIGURE 3 Comparison of the temporal resolution for line scanning
                                                                             versus video microscopy. (A) Under phase contrast, an analysis line (red
                                                                             line) was drawn to overlap with the direction of movement of a micropost
                                                                             by the twitch contraction of a cardiomyocyte. The deflection of the post was
                                                                             tracked from the cardiomyocyte’s resting state (top panel) to its twitch state
                                                                             (middle panel). For the post shown, the intensity profile along the analysis
                                                                             line was plotted (bottom panel) for the resting state (blue curve) and the
FIGURE 2 Contractility in cardiomyocytes increases with substrate stiff-     twitch state (red curve). The deflection of the post was tracked by moni-
ness. (A) Twitch force and (B) contractile work at the perimeter of cells    toring the change in the position of its leading edge, which was determined
increase with the effective shear modulus of the micropost arrays on which   by position of the local minimum (yellow segment) in the intensity profile.
they are cultured (solid circles). Panel A shows the forces measured for     (B) Twitch velocity versus time for twitch contraction at a representative
cardiomyocytes in the resting state (open triangles). All values represent   post measured with either line scanning (gray) or video microscopy (black).
the average per post measured by live cell video microscopy. Error bars      (C) Twitch force versus time for a representative post measured with either
represent the 95% confidence intervals.                                      line scanning (gray) or video microscopy (black).

Biophysical Journal 101(10) 2455–2464
Stiffness Improves Neonatal Twitch Power 2459
25% of the mean, whereas for video microscopy it was 38%
of the mean. Thus, the increased temporal resolution of
line scanning provided more accuracy and precision in
measuring twitch velocity.
Twitch force measured by line scanning was determined
to be slightly more accurate than video microscopy (Fig. 3
C). Maximum twitch force was measured by both ap-
proaches on the same post and found to differ by only
11.2 5 3.8% (n ¼ 10 posts). Again, the increase in data
sampling near the point of maximum force by line scanning
enables it to provide more accuracy in its measurement.
However, because the twitch-to-twitch variance in the
maximum force at a post was 6.7 5 2.0% (in Materials
and Methods), both methods were considered reasonable
for measuring the maximum twitch force. Thus, the results
presented here for absolute force and work can be compared
with those reported by others (12,16,30).
Stiffness increases twitch power
To determine the effect of substrate stiffness on twitch
power, we cultured cells on post arrays with different effec-
tive shear moduli and compared the relationship between FIGURE 4 Twitch power increases with stiffness. (A) The relationship
force and velocity during twitch contractions. The force- between twitch force and velocity was plotted for the twitch contraction of
velocity relationships were significantly different for cardi- cardiomyocytes cultured on arrays with stiffness of 3 kPa (blue diamonds),
omyocytes cultured on the different post arrays (Fig. 4 A). 8 kPa (green squares), 10 kPa (red triangles), and 15 kPa (black circles).
As observed with video microscopy, maximum twitch Higher substrate stiffness increased the maximum force reach during a twitch
contraction, but also decreased the maximum velocity. (Inset) Maximum
force increased for cells on the stiffer posts (Fig. 2 A, velocity versus the instantaneous force at which maximum velocity was
ANOVA, p < 0.001). However, by using line scanning, reached. (B) Twitch power was plotted as a function of the resistive load
maximum twitch velocity was found to decrease with and shows that maximum power (denoted by asterisks) increased with
post stiffness (Fig. 4 A, inset, ANOVA, p < 0.001). substrate stiffness. Error bars represent standard error of the mean.
Maximum velocity and its corresponding twitch force at
which maximum velocity was reached were compared for
Myofibril structures are altered with substrate
cells on arrays of different stiffness and were found to
stiffness
have an inverse relationship expected for muscle (Fig. 4 A,
inset, ANOVA, p < 0.001) (14,18,21). Thus, these re- To determine whether the change in twitch power could be
sults indicated that higher substrate stiffness can induce correlated with biomechanical changes in myofibril struc-
cardiomyocytes to modify their contractility by producing ture, images of a-actinin were analyzed to quantify sarco-
faster twitches with less force on the softest substrates, mere length and Z-band width. Cells on either the softest
and slower but more forceful twitches on the stiffer posts (Fig. 5 A) or the stiffest posts (Fig. 5 B) displayed
substrates. regular striations of a-actinin bands and did not have
The effect of higher substrate stiffness on the force- a significant difference in cell shape. Specifically, circularity
velocity relationship resulted in greater twitch power for in the shape of the cells was not seen to be significantly
the cardiomyocytes. Twitch power was defined as the altered by post stiffness (0.55 5 0.21 for 9 kPa and
product of the instantaneous velocity of a cardiomyocyte 0.52 5 0.09 for 15 kPa), which is similar to observations
pulling a post and the resistive load from the springlike made previously (12,16). Quantifying the spacing between
behavior of the post (19,21). The resistive load here was bands and the length of bands provided an indication of
not constant throughout a twitch contraction, but increased sarcomere length and Z-band width, respectively. Sarco-
linearly with the deflection of a post due to its behavior mere length is associated with the degree of thick and thin
as a Hookean spring. Subsequently, power curves were filament overlap, which affects the probability of actin-
generated with respect to the resistive load, and maximum myosin cross-bridge formation and thus the capacity to
twitch power was found to increase with substrate stiffness generate force (14,19,20). Here, sarcomere length increased
(Fig. 4 B; ANOVA, p < 0.001). Thus, higher stiffness significantly with stiffness from 1.76 5 0.06 mm on the soft-
promoted the cells to generate twitch contractions that had est posts to 1.95 5 0.06 mm on the stiffest post (Fig. 5 C,
more power, leading to improved cardiac contractility. ANOVA, p < 0.001). These sarcomere lengths were within
Biophysical Journal 101(10) 2455–24642460 Rodriguez et al.
ratiometric fluorescent intensity of Fura-2 in cardiomyo-
cytes was monitored throughout the twitch contractions.
Basal levels (resting state), maximum calcium concentra-
tions, and the amplitude of the calcium transient during a
contraction were significantly larger for cells on the stiffer
posts as compared to those on the softer posts (Fig. 6 A).
Similar to our observations, the amplitude of the calcium
transient has been observed to increase with stiffness for
neonatal rat cardiomyocytes cultured on polyacrylamide
gels (12). The increase in the basal calcium with stiffness
likely corresponded in part to an increase in forces during
the resting state (Fig. 2 A). Likewise, the increase in the
maximum calcium concentration and transient amplitude
with stiffness can be correlated with the increase in their
twitch forces (Fig. 2 A). Thus, higher stiffness leads to
changes in calcium concentrations that produce greater
forces at the resting state and during twitch contractions.
An advantage of our approach is that the dynamics in
calcium and twitch contraction can be compared directly.
Simultaneous measurements of force and calcium were con-
ducted for cells on arrays of either low (Fig. 6 B) or high
FIGURE 5 Resting sarcomere length and Z-band width increase with
stiffness. Cells on the (A) softest arrays (3 kPa) and on the (B) stiffest arrays
(15 kPa) were fixed and stained for a-actinin (green) and nuclei (blue).
(Insets) Same cell with a bright-field image showing the microposts. (C)
Sarcomere length and (D) Z-band width increased with substrate stiffness
(ANOVA p < 0.001). Error bars represent the 95% confidence intervals.
Scale bars, 5 mm.
the working range for cardiac muscle observed previously
(20). On the other hand, Z-band widths are associated
with increased uniformity and synchronicity of a contraction
because they maintain the alignment of parallel myofibrils
and hold adjacent sarcomeres in register during a twitch
contraction (31). Similar to sarcomere length, Z-band width
improved significantly with stiffness, increasing from
2.35 5 0.30 mm for cells on the softest post to 3.84 5
0.40 mm for those on the stiffest post (Fig. 5 D, p < 0.001
ANOVA). Taken together, these results indicate that cul-
turing cardiomyocytes on stiffer substrates led to a myofibril
FIGURE 6 Intracellular calcium increases with substrate stiffness. (A)
structure that helped to improve cardiac contractility.
Basal levels, maximum calcium concentration, and the amplitude of the
rise in calcium for a twitch contraction increase with substrate stiffness
(shaded, 3 kPa; solid, 15 kPa). (Asterisk) p < 0.05 tested between stiff-
Intracellular calcium levels are higher nesses. Examples of corresponding traces for calcium (shaded) and force
on stiffer posts (solid) for cardiomyocytes on (B) 3 kPa and (C) 15 kPa arrays of posts.
The duration of the steady-state concentration in intracellular calcium
To determine whether the effect of stiffness can also be (shaded bar, 120 ms) was defined by the time calcium levels remained
attributed to biochemical changes in intracellular calcium, >90% of the maximum concentration.
Biophysical Journal 101(10) 2455–2464Stiffness Improves Neonatal Twitch Power 2461
(Fig. 6 C) stiffness. For both arrays, calcium concentrations morphological differences between neonatal and adult
were observed to have a quasi-steady-state behavior at cardiomyocyte (7,8). Adult cardiomyocytes in vitro main-
maximum calcium (denoted by the bar above each calcium tain their cylindrical morphology found in vivo, whereas
trace in Fig. 6, B and C). However, higher substrate stiffness neonatal cardiomyocytes flatten and spread in all directions,
led to a longer duration of this quasi-steady state, indicating which complicates direct comparisons between the two. On
that stiffness can increase the duration of maximum calcium micropost arrays, neonatal cardiomyocytes still flatten and
(DtCa,90 in Table 1). A similar quasi-steady state in the spread, but the adhesion formed at the tip of a post is
calcium transient has been observed previously for neonatal associated with one-to-several myofibrils (Fig. 1 A). Thus,
cardiomyocyte and has been proposed to result from an measurements of twitch force, velocity, and power using
underdeveloped sarcoplasmic reticulum (32,33). In addi- microposts can be correlated with the contraction of myofi-
tion, comparing the temporal measurements of force and brils in a manner than is independent of cell shape.
calcium revealed that the time to maximum calcium In comparing twitch force and twitch velocity measured
(tCa,90) was reached before maximum force (t90), which is for cardiomyocytes on the stiffest posts, our results suggests
typical for a twitch contraction in muscle (Table 1). More- that the contraction of myofibrils in neonatal cardiomyocyte
over, the time to maximum velocity (tVmax) coincided with is similar to those in adults. Specifically, it is estimated from
maximum calcium, but only for cells on the stiffest arrays isolated myofibril measurements that adult myofibrils pro-
(Table 1). For cells on the softest arrays, maximum twitch duce ~71 nN of force during a twitch at submaximal calcium
velocity was reached before maximum calcium (Table 1), (18,34). Similarly, we observed on average of 77 nN of force
after which twitch velocity reduced to 57 5 12% of its per post for neonatal cells on the stiffest substrates (Fig. 2
maximum at same the time that maximum calcium was A). However, maximum velocity of shortening was an
reached (data not shown). Taken together, these results indi- order-of-magnitude slower for neonatal cardiomyocytes on
cate that maximum velocity is not limited by the maximum the stiffest substrates (3.3 mm/s; Fig. 4 A) as compared to
calcium concentration on the softest posts, which suggests adults measured under a similar resistive load (38 mm/s
stiffness effects cannot be accounted for by changes in (18)). This lower velocity in neonatal cardiomyocytes re-
calcium concentration alone. sulted in a twitch power per myofibril that was lower than
in adults. Specifically, an adult cardiomyocyte can generate
25 pW of power, which is produced by 40–50 parallel myofi-
DISCUSSION
brils contracting with the same velocity (18). Therefore, we
The major conclusions from this study on the contractile can estimate that a single adult myofibril generates, on
power of neonatal cardiomyocytes are that 1), line scanning average, between 500 and 625 fW of power, which is three-
with microposts can increase the measurement accuracy for fold more than the 203 fW per post measured for neonatal
both twitch velocity and force; 2), cardiomyocyte increase cardiomyocytes on the stiffest arrays (Fig. 4 B). As a conse-
their twitch power in response to higher substrate stiffness; quence, twitch power could be a better metric to resolve the
and 3), this increase in twitch power is correlated with differences in the contractile developmental of myofibrils
changes in the structure of the sarcomeres and increased between adult and neonatal stages.
intracellular calcium levels.
Myofibril and calcium changes yield increased
Subcellular dynamics as a metric of development twitch power
Arrays of microposts were used to quantify twitch forces at The increased twitch power on stiffer posts can be attributed
individual points of adhesion, which provided subcellular in part to the changes in the myofibril structure of neonatal
measurements of cardiac contractility. These subcellular cardiomyocytes. Here, one would expect an increase in
measurements can more directly assess the contractile power to develop from hypertrophic growth cues in the
nature of the myofibrils, which in turn, can offset the environment, e.g., post stiffness (15). Hypertrophy leads to
TABLE 1 Temporal parameters of the twitch contraction on each stiffness
Eeff (kPa) kpost (nN/mm) npost [ncell] t90 (ms)* tVmax (ms)* tca,90 (ms)* Dtca,90 (ms)
352 29 5 14 63 [21] 208 5 18 59 5 6 100 5 16 101 5 16
851 76 5 8 62 [15] 212 5 12 64 5 4 - -
10 5 1 103 5 14 49 [15] 236 5 20 75 5 10 - -
15 5 2 142 5 30 63 [20] 252 5 18 87 5 16 83 5 12 124 5 18
Values are means 595% confidence interval. Parameters: Eeff, substrate effective shear modulus; kpost, post spring constant; npost, number of posts;
ncell, number of cells; t90, time to 90% force; tVmax, time to maximum velocity; tca,90, time to 90% calcium; Dtca,90, duration of time calcium was >90%
(n ¼ 17 for 3 kPa and 10 for 15 kPa).
*Difference within the group at p < 0.005.
Biophysical Journal 101(10) 2455–24642462 Rodriguez et al.
myofibrils with more contractile protein content and/or with less calcium, but differences in the mechanical pro-
increased number of myofibrils at points of adhesion (4,5). perties of the posts cannot account for the altered temporal
However, previous studies have suggested that higher stiff- relationship between calcium and velocity observed on the
ness does not significantly affect the concentration of sarco- softest posts (Fig. 6, B and C, and Table 1). If the concentra-
meric proteins or their isoform expression (12,16). Our tion of intracellular calcium was the primary factor in deter-
analysis of the myofibril structure revealed sarcomeres mining twitch velocity, maximum velocity on the softest
had increased resting length as well as a greater degree of posts should have increased in tandem with calcium levels
coupling at their Z-disk with increasing post stiffness, and not preceded maximum calcium as we observed. There-
both of which are linked to improved contractility (Fig. 5, C fore, it is plausible that differences in myofibril structure
and D). Assuming that thick and thin filament lengths are associated with different post stiffness can affect twitch
not altered (not measured in this study), the increased velocity as well.
resting sarcomere length from 1.76 mm to 1.95 mm suggests
that during a contraction, there is a greater change in length
of the overlap between these filaments. Subsequently, longer CONCLUSION
sarcomeres should increase the number of binding events for
actin-myosin cross-bridges, which could at least partially We have developed what consider a novel in vitro approach
explain the increase in twitch force and power observed with sufficient temporal resolution to measure twitch force
with higher substrate stiffness (20). Additionally, increased and twitch velocity, allowing us to determine that twitch
myofibril coupling likely maintains uniformity in sarcomere power is sensitive to substrate stiffness for neonatal rat
length across the structural array by holding the Z-disks in cardiomyocytes. The increase in twitch power with higher
register through the lateral transmission of forces between substrate stiffness is correlated with modifications of myofi-
parallel myofibrils (31). The importance of this is demon- bril structure and intracellular calcium that work synergisti-
strated by several subcellular events that can lead to sarco- cally to improve the number of actin-myosin cross-bridges.
meric disarray and myofibril misalignment, such as 1), The effects of stiffness on twitch power suggest it may play
spontaneous oscillatory contraction events (35); 2), nonho- a role in the transition of neonatal cardiomyocytes to the
mogeneous rising phase of calcium (32,33); and 3), random more adult phenotype during development. However, the
sarcomeric yielding in response to increased stress (35). large difference that exists between twitch power for
Higher resistive load could potentially induce misalignment neonatal cardiomyocytes in this study and that of the adult
of myofibrils if not coupled. Maintaining sarcomeres in stage suggests that stiffness is only one of several factors
register can also synchronize myofibril contraction to pro- that play a role in the development of contractility.
duce a faster twitch velocity. Even though maximum
velocity decreased with stiffness, cardiomyocytes on the
stiffest posts contracted longer (Table 1) and at higher loads APPENDIX: DERIVATION OF EFFECTIVE SHEAR
relative to cells on the softer substrates resulting in greater MODULUS FOR POST ARRAYS
twitch power (Fig. 4 A). Thus, increased resting sarcomere Studies using elastomeric post arrays have reported the spring constant of
length and the degree of myofibril coupling are structural the posts as a way to evaluate the stiffness of a substrate (37). The spring
modifications that may explain greater twitch power on constant is an appropriate measure for the stiffness of an individual post
stiffer substrates. (usually having units of nN/mm), but it does not represent the compliance
of the overall array of posts underneath a cell. Here, the concept of effective
An increase in the intracellular calcium concentration shear modulus is presented to describe the substrate stiffness of the post
with stiffness likely contributed to an increase in maximal arrays.
twitch force, but calcium was seen to have a limited role The effective shear modulus (having units of N/m2 or Pa) is found by
in twitch dynamics on the softest posts. The larger baseline assuming that an array of discrete posts underneath a cell can be regarded
and peak calcium concentrations on the stiffest posts (Fig. 6 as a continuum. A force P acting on an individual post can be equated to a
transverse stress txz acting on the representative volume element (RVE) at
A) corresponded with increased resting and maximum its top surface (Fig. 7). It can also be assumed that there is a fixed boundary
twitch force (Fig. 2 A). Previous studies have demonstrated condition at the base of a post, which allows the post to deflect as a canti-
an increase in sarco/endoplasmic reticulum calcium ATPase lever beam.
expression with stiffness (12), which could explain the For the coordinate system shown, let x, y, and z be the coordinate direc-
increase in calcium concentration during twitches on stiffer tions and u, v, and w be deformations of the RVE in the x, y, and z directions,
respectively. The deformed state of the RVE can be regarded as a case of
posts (36). Increased intracellular calcium should increase simple shear in the x direction. The shear modulus of the RVE in the x direc-
the activation of thin filaments, resulting in more actin- tion on its top plane, whose normal is in the z direction, is given by
myosin cross-bridges, and therefore more force and velocity t xz
per myofibril (13,14). Contrary to these observations, how- Gxz ¼ ; (7)
2εxz
ever, maximum velocity was highest on the softest posts
despite the lower levels of calcium. The lower resistive where εxz is the shear strain in the x direction on the top plane. Because
load at the softest posts likely permitted a faster contraction the transverse stress is assumed to be uniformly distributed and thus is
Biophysical Journal 101(10) 2455–2464Stiffness Improves Neonatal Twitch Power 2463
1 vu v Pz2 Ph2
εxz ¼ ¼ ð3h zÞ ¼ :
2 vz vz 12Epdms Iz z¼h 4Epdms Iz
(12)
Substituting for Iz and P yields
t xy s2 h2
εxz ¼ : (13)
pEpdms r 4
Hence, substituting εxz into Eq. 7 produces
p Epdms r 4
Gxz ¼ : (14)
2 s 2 h2
From this relationship, the effective shear modulus of the RVE increases
with a radius of a post to the fourth order, whereas it decreases with s
and h to the second order.
We acknowledge helpful discussions in regard to twitch power from
FIGURE 7 Schematic of a transverse stress txz acting on the surface of
Dr. Steven Korte.
the array of posts in the x direction. The representative volume element
(RVE) is bounded by height h and area s2 and contains a single post with Imaging studies were supported in part by the Mike and Lynn Garvey Cell
radius r. The transverse stress txz is assumed to be uniformly distributed Imaging Lab at the University of Washington Institute for Stem Cell and
across the top surface of the RVE and is equal to a force P acting on the Regenerative Medicine. This work was also supported in part by grants
post divided by the area of the top surface s2. The force P acts in the from the National Institutes of Health, specifically HL097284 (to N.J.S.),
same direction as txz. Two-dimensional schematics of the RVE are shown HL65497 (to M.R.), and HL064387 (to M.R.). Additional funding was
in the undeformed and deformed states. provided under the National Institutes of Health-supported Bioengineering
Cardiovascular Training grant EB001650 (to A.G.R.), National Institutes of
Health supplemental grant HL61683 (to A.G.R.), and the National Science
Foundation CAREER award (to N.J.S.).
equivalent to a force P acting on the unit volume divided by the area of top
surface, it can be expressed as
REFERENCES
P
t xz ¼ 2: (8) 1. Jacot, J. G., J. C. Martin, and D. L. Hunt. 2010. Mechanobiology of
s cardiomyocyte development. J. Biomech. 43:93–98.
2. Prakash, Y. S., M. J. Cody, ., G. C. Sieck. 1999. Comparison of cross-
Likewise, the shear strain εxz is a component of Green’s strain tensor and is bridge cycling kinetics in neonatal vs. adult rat ventricular muscle.
J. Muscle Res. Cell Motil. 20:717–723.
1 vu vw vu vu vv vv vw vw
εxz ¼ þ þ þ þ : (9) 3. Hopkins, Jr., S. F., E. P. McCutcheon, and D. R. Wekstein. 1973. Post-
2 vz vx vx vz vx vz vx vz natal changes in rat ventricular function. Circ. Res. 32:685–691.
4. Rudolph, A. M., and M. A. Heyman. 1974. Fetal and neonatal circula-
It is important to note that for small displacements, the quadratic terms can tion and respiration. Annu. Rev. Physiol. 36:187–207.
be neglected. However, if these terms are retained for a deformation of the 5. Wu, Y., and E. X. Wu. 2009. MR study of postnatal development of
RVE that is not small, then for a case of simple shear, displacement in the y myocardial structure and left ventricular function. J. Magn. Reson.
direction and the derivatives of the displacements for all but vu/vz are zero Imaging. 30:47–53.
(v ¼ 0, vu/vx ¼ vw/vx ¼ vw/vz ¼ 0). Thus, this equation reduces to 6. Nassar, R., M. C. Reedy, and P. A. Anderson. 1987. Developmental
changes in the ultrastructure and sarcomere shortening of the isolated
1 vu
εxz ¼ : (10) rabbit ventricular myocyte. Circ. Res. 61:465–483.
2 vz 7. Claycomb, W. C. 1977. Cardiac-muscle hypertrophy. Differentiation
and growth of the heart cell during development. Biochem. J. 168:
The shear strain of the RVE is given by considering the defection of the 599–601.
post, which defines the deformed state of RVE. According to Euler-Ber- 8. Goss, R. J. 1966. Hypertrophy versus hyperplasia. Science. 153:1615–
noulli beam theory, the displacement of a cantilever u can be derived 1620.
from equation of the elastic curve as
9. Gilbert, P. M., K. L. Havenstrite, ., H. M. Blau. 2010. Substrate elas-
ticity regulates skeletal muscle stem cell self-renewal in culture.
Pz2
uðzÞ ¼ ð3h zÞ; (11) Science. 329:1078–1081.
6Epdms Iz 10. Zemel, A., F. Rehfeldt, ., S. A. Safran. 2010. Optimal matrix rigidity
for stress fiber polarization in stem cells. Nat. Phys. 6:468–473.
where Epdms is the elastic modulus of PDMS, Iz is the second moment of 11. Forte, G., F. Carotenuto, ., P. Di Nardo. 2008. Criticality of the bio-
area about the z axis, which for a cylindrical post is Iz ¼ p r4/4, and h is logical and physical stimuli array inducing resident cardiac stem cell
the height of a post. From Eq. 10, the shear strain εxz can be calculated as determination. Stem Cells. 26:2093–2103.
Biophysical Journal 101(10) 2455–24642464 Rodriguez et al.
12. Jacot, J. G., A. D. McCulloch, and J. H. Omens. 2008. Substrate 26. Liang, X. M., S. J. Han, ., N. J. Sniadecki. 2010. Platelet retraction
stiffness affects the functional maturation of neonatal rat ventricular force measurements using flexible post force sensors. Lab Chip.
myocytes. Biophys. J. 95:3479–3487. 10:991–998.
13. McDonald, K. S., L. J. Field, ., R. L. Moss. 1995. Length dependence 27. Moreno-Gonzalez, A., F. S. Korte, ., M. Regnier. 2009. Cell therapy
of Ca2þ sensitivity of tension in mouse cardiac myocytes expressing enhances function of remote non-infarcted myocardium. J. Mol. Cell.
skeletal troponin C. J. Physiol. 483:131–139. Cardiol. 47:603–613.
14. Sonnenblick, E. H. 1962. Force-velocity relations in mammalian heart 28. Sniadecki, N. J., C. M. Lamb, ., D. H. Reich. 2008. Magnetic
muscle. Am. J. Physiol. 202:931–939. microposts for mechanical stimulation of biological cells: fabrication,
15. Lammerding, J., R. D. Kamm, and R. T. Lee. 2006. Mechanotransduc- characterization, and analysis. Rev. Sci. Instrum. 79:044302.
tion in cardiac myocytes. Ann. NY Acad. Sci. 1015:53–70. 29. Grynkiewicz, G., M. Poenie, and R. Y. Tsien. 1985. A new generation
16. Engler, A. J., C. Carag-Krieger, ., D. E. Discher. 2008. Embryonic of Ca2þ indicators with greatly improved fluorescence properties.
cardiomyocytes beat best on a matrix with heart-like elasticity: scar- J. Biol. Chem. 260:3440–3450.
like rigidity inhibits beating. J. Cell Sci. 121:3794–3802. 30. Kajzar, A., C. M. Cesa, ., R. Merkel. 2008. Toward physiological
17. Jacot, J. G., H. Kita-Matsuo, ., A. D. McCulloch. 2010. Cardiac conditions for cell analyses: forces of heart muscle cells suspended
myocyte force development during differentiation and maturation. between elastic micropillars. Biophys. J. 94:1854–1866.
Ann. N. Y. Acad. Sci. 1188:121–127. 31. Campbell, K. S. 2009. Interactions between connected half-sarcomeres
18. Korte, F. S., and K. S. McDonald. 2007. Sarcomere length dependence produce emergent mechanical behavior in a mathematical model of
of rat skinned cardiac myocyte mechanical properties: dependence on muscle. PLOS Comput. Biol. 5:e1000560.
myosin heavy chain. J. Physiol. 581:725–739. 32. Escobar, A. L., R. Ribeiro-Costa, ., R. Mejı́a-Alvarez. 2004. Develop-
19. Woledge, R. C., N. A. Curtin, and E. Homsher. 1985. Energetic aspects mental changes of intracellular Ca2þ transients in beating rat hearts.
of muscle contraction. Monogr. Physiol. Soc. 41:1–357. Am. J. Physiol. Heart Circ. Physiol. 286:H971–H978.
20. Gordon, A. M., E. Homsher, and M. Regnier. 2000. Regulation of 33. Korhonen, T., S. L. Hänninen, and P. Tavi. 2009. Model of excitation-
contraction in striated muscle. Physiol. Rev. 80:853–924. contraction coupling of rat neonatal ventricular myocytes. Biophys. J.
21. Hill, A. V. 1938. The heat of shortening and the dynamic constants of 96:1189–1209.
muscle. Proc. R. Soc. Lond. B Biol. Sci. 126:136–195. 34. Stehle, R., J. Solzin, ., C. Poggesi. 2009. Insights into the kinetics of
22. Zhao, Y., and X. Zhang. 2007. Adaptation of myofibrils to a microstruc- Ca2þ-regulated contraction and relaxation from myofibril studies.
tured polymeric substrate. Sens. Actuators A Phys. 136:491–495. Pflugers Arch. 458:337–357.
23. Zhao, Y., and X. Zhang. 2006. Cellular mechanics study in cardiac 35. Shimamoto, Y., M. Suzuki, ., S. Ishiwata. 2009. Inter-sarcomere
myocytes using PDMS pillars array. Sens. Actuators A Phys. 125: coordination in muscle revealed through individual sarcomere response
398–404. to quick stretch. Proc. Natl. Acad. Sci. USA. 106:11954–11959.
24. Kim, K., R. Taylor, ., B. L. Pruitt. 2011. Calibrated micropost arrays 36. Stokke, M. K., K. Hougen, ., A. W. Trafford. 2010. Reduced
for biomechanical characterization of cardiomyocytes. Micro Nano SERCA2 abundance decreases the propensity for Ca2þ wave develop-
Lett. 6:317–322. ment in ventricular myocytes. Cardiovasc. Res. 86:63–71.
25. Sniadecki, N. J., and C. S. Chen. 2007. Microfabricated silicone elas- 37. Saez, A., A. Buguin, ., B. Ladoux. 2005. Is the mechanical activity
tomeric post arrays for measuring traction forces of adherent cells. of epithelial cells controlled by deformations or forces? Biophys. J.
Methods Cell Biol. 83:313–328. 89:L52–L54.
Biophysical Journal 101(10) 2455–2464You can also read