Effects of Quercetin Metabolites on Triglyceride Metabolism of 3T3-L1 Preadipocytes and Mature Adipocytes
←
→
Page content transcription
If your browser does not render page correctly, please read the page content below
International Journal of
           Molecular Sciences

Article
Effects of Quercetin Metabolites on Triglyceride
Metabolism of 3T3-L1 Preadipocytes and
Mature Adipocytes
Itziar Eseberri 1,2 , Jonatan Miranda 1,2, *, Arrate Lasa 1,2 , Andrea Mosqueda-Solís 1 ,
Susana González-Manzano 3 , Celestino Santos-Buelga 3 and Maria P. Portillo 1,2
 1    Nutrition and Obesity Group, Department of Nutrition and Food Science, University of the Basque
      Country (UPV/EHU) and Lucio Lascaray Research Institute, 01006 Vitoria, Spain;
      itziar.eseberri@ehu.eus (I.E.); arrate.lasa@ehu.eus (A.L.); andreamosqueda.s@gmail.com (A.M.-S.);
      mariapuy.portillo@ehu.eus (M.P.P.)
 2    CIBERobn Physiopathology of Obesity and Nutrition, Institute of Health Carlos III (ISCIII), 28029 Madrid,
      Spain
 3    Grupo de Investigación en Polifenoles (GIP-USAL), Facultad de Farmacia, Universidad de Salamanca,
      Campus Miguel de Unamuno s/n, 37007 Salamanca, Spain; susanagm@usal.es (S.G.-M.);
      csb@usal.es (C.S.-B.)
 *    Correspondence: jonatan.miranda@ehu.eus; Tel.: +34-945-014038

 Received: 26 November 2018; Accepted: 9 January 2019; Published: 11 January 2019

 Abstract: Quercetin (Q) has rapid metabolism, which may make it worthwhile to focus on the
 potential activity of its metabolites. Our aim was to evaluate the triglyceride-lowering effects
 of Q metabolites in mature and pre-adipocytes, and to compare them to those induced by Q.
 3T3-L1 mature and pre-adipocytes were treated with 0.1, 1 and 10 µM of Q, tamarixetin (TAM),
 isorhamnetin (ISO), quercetin-3-O-glucuronide (3G), quercetin-3-O-sulfate (3S), as well as with 3S
 and quercetin-4-O-sulfate (4S) mixture (3S+4S). Triglyceride (TG) content in both cell types, as well as
 free fatty acid (FFA) and glycerol in the incubation medium of mature adipocytes were measured
 spectrophotometrically. Gene expression was assessed by RT-PCR. In mature adipocytes, Q decreased
 TG at 1 and 10 µM, 3S metabolite at 1 and 10 µM, and 3S+4S mixture at 10 µM. 3S treatment modified
 the glucose uptake, and TG assembling, but not lipolysis or apoptosis. During differentiation, only
 10 µM of ISO reduced TG content, as did Q at physiological doses. In conclusion, 3S metabolite but
 not ISO, 3G, 4S and TAM metabolites can contribute to the in vivo delipidating effect of Q.

 Keywords: Quercetin; metabolites; adipocytes; triglycerides

1. Introduction
     Quercetin (Q) is a polyphenol classified as a flavonoid, found, mainly in glycoside form, in
a variety of foods including berries, onions and shallots, apples, tea and chocolate [1]. Some of its
metabolites, such as Isorhamnetin (ISO) and quercetin-3-O-glucuronide (3G), are also present in several
food sources [2]. It is estimated that the dietary intake of Q is 5–40 mg/day [3]. However, consumption
can reach 200–500 mg/day when fruits and vegetables are abundant in the diet, especially if they are
eaten with their skin [4].
     Obesity, defined as excess fat accumulation in white adipose tissue, plays a key role as a regulator
of lipid storage and release. It can be developed by increasing adipocyte number (hyperplasia)
and/or size (hypertrophy) [5]. When hyperplasia takes place, there is a stimulation of pre-adipocyte
proliferation and further differentiation. This process, which promotes pre-adipocyte differentiation
into mature adipocytes is known as adipogenesis [6]. Nevertheless, this increase in adipocyte number

Int. J. Mol. Sci. 2019, 20, 264; doi:10.3390/ijms20020264                           www.mdpi.com/journal/ijms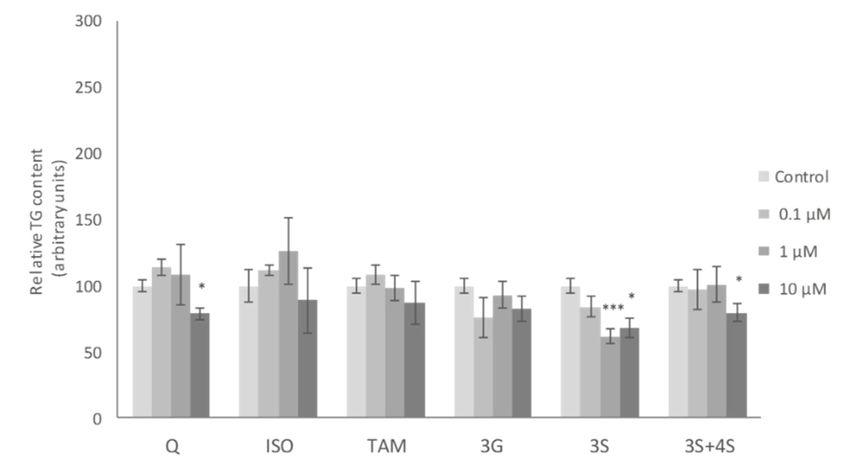
Int. J. Mol. Sci. 2018, 19, x FOR PEER REVIEW 2 of 13
Int. J. Mol. Sci. 2019, 20, 264 2 of 13
differentiation into mature adipocytes is known as adipogenesis [6]. Nevertheless, this increase in
adipocyte number does not necessarily promote obesity directly. Instead, during childhood growth,
does
it not necessarily
determines promote obesity
the lipid-storing capacitydirectly.
of adipose Instead,
tissueduring
and fatchildhood growth, it[7].
mass in adulthood determines the
lipid-storing capacity of adipose tissue and fat mass in adulthood [7].
For triglyceride synthesis and further storage, mature adipocytes need a source of fatty acids
and ofFor triglycerideFatty
glycerol-3-P. synthesis
acids and
can be further
obtained storage,
frommature adipocytes
triglycerides need as
circulating a source of fattydue
lipoproteins, acidsto
and of glycerol-3-P. Fatty acids can be obtained from triglycerides circulating
the action of lipoprotein lipase (LPL), which can be synthesized de novo from Acetyl-CoA or can be as lipoproteins, due to
the action of lipoprotein lipase (LPL), which can be synthesized de
taken-up directly from circulation through specific transporters. Glycerol-3-P comes from glucose novo from Acetyl-CoA or can be
taken-up directly
metabolism, after from
glucose circulation
uptake from throughblood specific
through transporters.
the glucoseGlycerol-3-P
transporter comes
GLUT-4. from glucose
These two
metabolism, after glucose uptake from blood through the glucose
molecules are assembled into triglycerides in a process catalyzed by several enzymes. TG stored transporter GLUT-4. These twoin
molecules are assembled into triglycerides in a process catalyzed by
adipose tissue can be mobilized in the process known as lipolysis, mediated by three lipases, which several enzymes. TG stored in
adipose tissue can be mobilized in the process known as lipolysis,
implies a breakdown of stored triglycerides and subsequent release of fatty acids and glycerol. mediated by three lipases, which
implies
Q hasa breakdown
recently been of stored
showntriglycerides
to be a potentialand subsequent release of
body fat-lowering fatty acids
molecule. Its and glycerol.
positive impact on
Q has recently been shown to be a potential body fat-lowering
lipolysis, apoptosis, fatty acid uptake, inhibition of adipogenesis and reduction of lipogenesis molecule. Its positive impacthas on
lipolysis, apoptosis, fatty acid uptake, inhibition of adipogenesis and
been proposed as its mechanism of action [8–12]. In addition, it seems that its effect on white adiposereduction of lipogenesis has
been proposed
tissue as its mechanism
is accompanied by muscleofand action
liver[8–12]. In addition,biogenesis
mitochondrial it seems thatanditsbyeffect on white
improved adipose
glycaemic
tissue isamong
control accompanied by muscle
other effects, and liver
resulting in it mitochondrial
being a multi-target biogenesis and by
flavonoid forimproved
body fat glycaemic
reduction
control among other effects, resulting in it being a multi-target
[13,14]. Not only abundant cell culture experiments [8,10,15,16], but also animal flavonoid for body fat reduction
studies[13,14].
have
confirmed its usefulness in body fat reduction, mostly in obese animals [17–22]. However, studies its
Not only abundant cell culture experiments [8,10,15,16], but also animal studies have confirmed in
usefulness
humans in body
remain fat reduction,
scarce [19,23–25]. mostly in obese
A matter animalsin[17–22].
of concern the useHowever,
of Q as astudies
bioactive in humans
molecule remain
is its
scarce metabolism,
rapid [19,23–25]. Aand matterthus of its
concern in the use of Q Chen
low bioavailability. as a bioactive
et al. [26]molecule is its rapid
determined that 60%metabolism,
of total
and thus its low bioavailability. Chen et al. [26] determined that 60%
quercetin ingested by rats was absorbed, and 55.8% of this absorbed amount was metabolized by the of total quercetin ingested by
rats was absorbed, and 55.8% of this absorbed amount was metabolized
gut and 1.8% by the liver. After ingestion, Q is transformed into an aglycone form in the small by the gut and 1.8% by the
liver. Afterthat
intestine, ingestion,
in turnQisis further
transformed into an aglycone
metabolized form in the small
by glucuronidation, intestine,
sulfatation andthat in turn is
methylation
further metabolized by glucuronidation, sulfatation and methylation
reactions [27]. As a result, only a reduced amount of Q and considerable amounts of metabolites reachreactions [27]. As a result, only
a reduced amount of Q and considerable amounts of metabolites reach
the bloodstream. According to the literature, the most predominant metabolites in plasma are ISO, the bloodstream. According
to the literature, the 3G
tamarixetin(TAM), mostand predominant metabolites in
quercetin-3-O-sulfate plasma
(3S) are ISO,
[28–31] tamarixetin
(Figure 1), with (TAM), 3G and
glucuronide
quercetin-3-O-sulfate (3S) [28–31] (Figure 1), with glucuronide metabolites
metabolites being those that appear in higher concentrations and sulfate and methylated those that being those that appear in
higher concentrations and
appear in lower concentrations [32–34].sulfate and methylated those that appear in lower concentrations [32–34].
Figure 1.
Figure Chemical structures
1. Chemical structures of
of Q
Q and
and its
its metabolites.
metabolites.
Bearing this
Bearing this in
in mind,
mind, ititisisnot
notpossible
possibletotobe
besure
surethat
thatthe
thefat-lowering
fat-loweringproperties of of
properties QQ observed in
observed
in vivo experiments are exclusively attributable to Q. The potential activity of its metabolites
in in vivo experiments are exclusively attributable to Q. The potential activity of its metabolites shouldInt. J. Mol. Sci. 2019, 20, 264 3 of 13
Int. J. Mol. Sci. 2018, 19, x FOR PEER REVIEW 3 of 13
not be discarded. Data concerning this issue in adipocytes are scarce so far [35–37]. Studies carried out
should not be discarded. Data concerning this issue in adipocytes are scarce so far [35–37]. Studies
with these molecules in A549 lung cancer cells revealed that Q metabolites could have similar positive
carried out with these molecules in A549 lung cancer cells revealed that Q metabolites could have
effects to those of Q on cell invasion and migration [38].
similar positive effects to those of Q on cell invasion and migration [38].
Considering all these issues, in the present study we wanted to assess whether Q and/or its
Considering all these issues, in the present study we wanted to assess whether Q and/or its
metabolites are responsible for its beneficial effects in terms of delipidating molecule. For this purpose,
metabolites are responsible for its beneficial effects in terms of delipidating molecule. For this
the triglyceride-lowering effect of methylated metabolites TAM and ISO, 3G, 3S and a mixture (3S+4S)
purpose, the triglyceride-lowering effect of methylated metabolites TAM and ISO, 3G, 3S and a
of 3S and quercetin-4-O-sulfate (4S) in pre-adipocytes and mature adipocytes was evaluated and
mixture (3S+4S) of 3S and quercetin-4-O-sulfate (4S) in pre-adipocytes and mature adipocytes was
compared to that induced by Q.
evaluated and compared to that induced by Q.
2. Results and Discussion
2. Results and Discussion
In order to address the challenge of determining delipidating capacity of each Q metabolite,
severalorder
In to address
approaches withthe challenge
isolated TAM,ofISO,determining
3G, 3S, and delipidating
3S+4S mixture capacity of eachinQethanol
dissolved metabolite,
were
several approaches with isolated TAM, ISO, 3G, 3S, and 3S+4S mixture
performed in mature and maturing murine adipocytes. With regard to cell treatment, two aspects dissolved in ethanol were
performed in mature
must be pointed out. and
First,maturing
the final murine adipocytes.
concentration With per
of ethanol regard to cell was
adipocyte treatment, two aspects
well below 0.1%, a
must be pointed out. First, the final concentration of ethanol per adipocyte
previously reported non-toxic concentration [39–42]. Secondly, the assays were conducted with doses was well below 0.1%, a
previously reported non-toxic concentration [39–42]. Secondly, the assays
lower than those commonly used in cell culture experiments (0.1, 1 and 10 µM). One of the reasons were conducted with doses
lower than those
for choosing thesecommonly used intocell
doses is related theculture experiments
prevention (0.1, 1 and
of cell integrity, 10 µM).
because 10One
µM of of the
ISOreasons
and 3G
for
was declared as safe in Raw 2647 cells, but toxic effects were observed for both molecules atand
choosing these doses is related to the prevention of cell integrity, because 10 µM of ISO 3G
25 and
was declared as safe in Raw 2647 cells, but toxic effects were observed
100 µM, respectively [43]. Moreover, in vivo supplementation studies are commonly carried out by for both molecules at 25 and
100 µM,
using respectively
doses of Q that[43]. leadMoreover,
to plasmain Q vivo
and Q supplementation studies are in
metabolite concentrations commonly
the rangecarried out by
of nanomolar
using doses of Q that lead to plasma Q and Q metabolite concentrations
and micromolar [44,45]. In addition, in previous studies from our laboratory, doses of Q in the range in the range of nanomolar
and micromolar
of serum [44,45]. In(≤
concentrations addition,
10 µM) werein previous
tested in studies from our
adipocytes, laboratory,
revealing doses of Q in the
a dose-dependent range
effect on
of serum concentrations (≤10 µM) were
triglyceride (TG) reduction in pre-adipocytes [12]. tested in adipocytes, revealing a dose-dependent effect on
triglyceride (TG) reduction
Apart from commercially in pre-adipocytes [12].
available metabolites TAM, ISO and 3G, hemisynthetized quercetin
Apart from commercially available metabolites
sulfate mixture (3S+4S) and 3S were also used for the present TAM, ISO and Supplementary
study. 3G, hemisynthetized Figurequercetin
S1 shows
sulfate mixture (3S+4S) and 3S were also used for the present study.
the HPLC chromatograms recorded at 370 nm with the two obtained fractions. In the case Supplementary Figure S1 shows
of the
the HPLC4Schromatograms
mixture, and 3S represented recorded
33.4%atand 37062.5%
nm withof thethe two obtained
recorded fractions.
peak areas, In the case of the
respectively.
mixture,
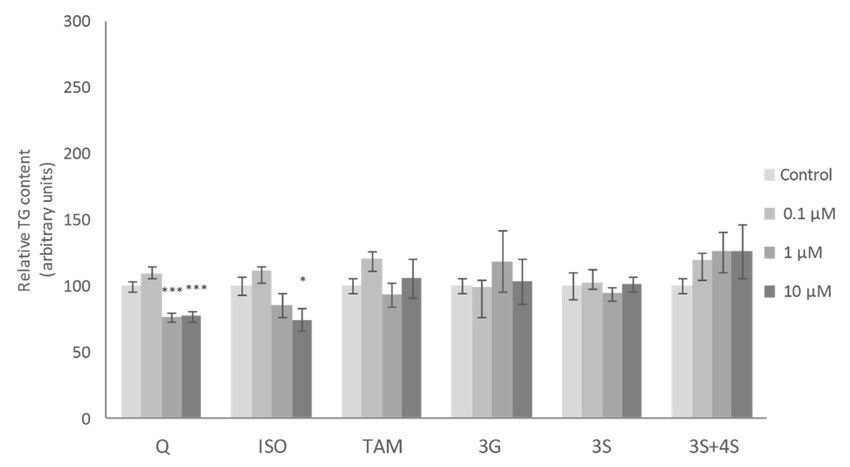
No 4S and 3S represented
significant changes in 33.4% mature and 62.5% ofTG
adipocyte thecontent
recorded peak
were areas, respectively.
observed when these cells were
No significant changes in mature adipocyte TG
incubated with the lowest dose (0.1 µM) of the molecules studied. At a dosecontent were observed when
of 1 these cellsthe
µM, only were
3S
incubated
metabolite, among all the molecules tested, reduced TG content. Finally, at 10 µM, Q, 3S+4S and3S
with the lowest dose (0.1 µM) of the molecules studied. At a dose of 1 µM, only the 3S
metabolite,
significantlyamong
reduced allTGthecontent
molecules tested, reduced
in adipocytes TG content.
(21%, 20% and 32%,Finally, at 10 µM,
respectively). By Q, 3S+4S 3G,
contrast, andISO
3S
significantly reduced TG content in adipocytes (21%, 20% and 32%, respectively).
and TAM were ineffective (Figure 2). Similar results were reported by Lee et al. with ISO treatment in By contrast, 3G,
ISO andadipocytes
mature TAM were ineffective (Figure 2). Similar results were reported by Lee et al. with ISO
[35].
treatment in mature adipocytes [35].
Figure 2.
Figure Effectsofof0.1,
2. Effects 0.1,1 1and
and1010µM
µMofof quercetin
quercetin (Q),
(Q), isorhamnetin
isorhamnetin (ISO),(ISO), tamarixetin
tamarixetin(TAM),
(TAM),
quercetin-3-O-glucuronide (3G), quercetin-3-O-sulfate (3S), as well as 3S and quercetin-4-O-sulfate
quercetin-3-O-glucuronide (3G), quercetin-3-O-sulfate (3S), as well as 3S and quercetin-4-O-sulfate (4S)
mixture (3S+4S) on triacylglycerol content of 3T3-L1 mature adipocytes treated for
(4S) mixture (3S+4S) on triacylglycerol content of 3T3-L1 mature adipocytes treated for 24 h. Values24 h. Values are
means ± SEM. Comparison between each flavonoid dose and the control
are means ± SEM. Comparison between each flavonoid dose and the control was analyzed bywas analyzed by Student’s
t-test. Thet-test.
Student’s asterisks
The represent differences
asterisks represent versus theversus
differences controls p < 0.05;(****
the(*controls pInt. J. Mol. Sci. 2018, 19, x FOR PEER REVIEW 4 of 13
In order to explain the TG reduction observed, gene expression of mature adipocyte-specific
genes was analyzed at the dose of 10 µM. We chose the highest dose to carry out this analysis because
this wasInt.the active
J. Mol. one
Sci. 2019, 20, for
264 a great number of the molecules analyzed. Treatment with 410 µM of 3S
of 13
significantly decreased and 3S+4S tended to reduce lipoprotein lipase (lpl) expression (Figure 3A,B).
Evidence confirmedIn order tothat adipocyte-derived
explain the TG reduction LPL is required
observed, for efficient
gene expression fatty adipocyte-specific
of mature acid uptake and further
TG storage in 3T3-L1 adipocytes [46]. It is true that LPL is not determining
genes was analyzed at the dose of 10 µM. We chose the highest dose to carry out this analysisin in vitro TG
because
this was the active one for a great number of the molecules
accumulation. However, the reduction observed could suggest a positive mechanism of action analyzed. Treatment with 10 µM of 3S in in
significantly decreased and 3S+4S tended to reduce lipoprotein lipase (lpl) expression (Figure 3A,B).
vivo situation. With regard to lipolysis, treatment with 3S+4S tended to reduce adipose triglyceride
Evidence confirmed that adipocyte-derived LPL is required for efficient fatty acid uptake and further
lipase (atgl) expression
TG storage in 3T3-L1 (p =adipocytes
0.09) in mature[46]. It isadipocytes
true that LPLand is notthus, in order
determining in to clarify
in vitro TG whether
accumulation.this change
could result
However, in thechanges
reduction in observed
this metabolic
could suggest pathway,
a positiveglycerol
mechanism and FFA in
of action release were measured
in vivo situation.
(Supplementary
With regard Figure S2). Given
to lipolysis, treatment that,
withas previously
3S+4S tended toreported
reduce adiposewith Q [12], lipase
triglyceride no changes were observed
(atgl) expression
(p = 0.09) in mature adipocytes and thus, in order to clarify whether
and consequently, it seems that lipolysis is not involved in TG reduction. On the other hand, even this change could result in changes
in this metabolic pathway, glycerol and FFA release were measured (Supplementary Figure S2). Given
though further analysis is needed in order to confirm this fact, it can be proposed that 3S metabolite,
that, as previously reported with Q [12], no changes were observed and consequently, it seems that
alone orlipolysis
in combination
is not involved within4S, TG could actOn
reduction. reducing
the otherfatty
hand,acid
even uptake.
though further analysis is needed in
According to research
order to confirm this fact,conducted with adipose
it can be proposed tissue explants
that 3S metabolite, alone or from lean, overweight,
in combination with 4S, could obese and
morbidly actobese
reducing subjects,
fatty acidbody uptake.fat mass increase is associated with CASP3 and P53 expression
elevation and BCL2 expression conducted
According to research reductionwith [47].adipose
Thus, tissue
as theexplants
apoptotic frompathway
lean, overweight,
is related obese
to adipose
and morbidly obese subjects, body fat mass increase is associated with CASP3 and P53 expression
tissue homeostasis, the potential involvement of 3S metabolite in apoptosis was studied. It promoted
elevation and BCL2 expression reduction [47]. Thus, as the apoptotic pathway is related to adipose
remarkablytissueelevated
homeostasis, levels of trp53,involvement
the potential a gene thatof codifies tumor
3S metabolite suppressor
in apoptosis p53 protein.
was studied. While p53 is
It promoted
linked with apoptosis,
remarkably elevated it has
levels many other
of trp53, a generoles
thatincluding cell-cycle
codifies tumor suppressorarrest,
p53 DNA
protein.repair
While orp53senescence
is
[48]. Duelinked
to thiswithfact, other apoptosis-related
apoptosis, it has many other rolesgenes such
including as caspase
cell-cycle arrest,3 DNA
(cas3)repair
and orthe anti-apoptotic
senescence [48]. gene
bcl2 were Due to this fact,
assessed other 3A).
(Figure apoptosis-related
The expression genes of such as caspase
both genes3revealed
(cas3) and apoptosis
the anti-apoptotic gene instead
reduction,
bcl2 were assessed (Figure 3A). The expression of both genes revealed apoptosis reduction, instead of
of promotion with 3S treatment (bcl2 elevation and cas3 decrease). Thus, apoptosis does not represent
promotion with 3S treatment (bcl2 elevation and cas3 decrease). Thus, apoptosis does not represent a
a mechanism
mechanism of action
of action forfor3S3Smetabolite
metabolite inin mature
mature adipocytes.
adipocytes. In fact,Inwhenfact,4Swhen 4S was
was included included
there was there
was no no effect
effecton on apoptotic
apoptotic genes. genes. Although
Although the mixture
the mixture 3S+4S raised3S+4S raised theofexpression
the expression trp53, no changes of trp53, no
changeswerewereobserved
observed in cas3
in cas3 or bcl2orgenes
bcl2 (Figure
genes 3B).(Figure 3B).
(A)
Figure 3. Cont.Int. J. Mol. Sci. 2019, 20, 264 5 of 13
Int. J. Mol. Sci. 2018, 19, x FOR PEER REVIEW 5 of 13
(B)
Figure 3.Figure Effects
3. of
Effects of quercetin-3-O-sulfate
quercetin-3-O-sulfate (3S)(A)
(3S) (A)and
and quercetin-3-O-sulfate
quercetin-3-O-sulfate and quercetin-4-O-sulfate
and quercetin-4-O-sulfate
mixture (3S+4S) (B) at a dose of 10 µM on the expression of atgl, hsl, lpl, fasn, dgat1, dgat2, glut4, trp53,
mixture (3S+4S) (B) at a dose of 10 µM on the expression of atgl, hsl, lpl, fasn, dgat1, dgat2, glut4, trp53,
cas3 and bcl2 in 3T3-L1 mature adipocytes treated for 24 h. Values are means ± SEM. Comparison of
cas3 and bcl2 in 3T3-L1 mature adipocytes treated for 24 h. Values are means ± SEM. Comparison of
3S or3S+4S and the control for each gene expression was analyzed by Student’s t-test. The asterisks
3S or3S+4S and the
represent controlversus
differences for each gene expression
the controls (* p < 0.05; ** was analyzed
p < 0.01; by Student’s t-test. The asterisks
*** p < 0.001).
represent differences versus the controls (* p < 0.05; ** p < 0.01; *** p < 0.001).
Apart from fatty acid uptake, lipolysis and apoptosis, lipogenesis is another crucial metabolic
process involved in fat storage. Uptaken fatty acids or new synthesized ones must be assembled
Apart from fatty acid uptake, lipolysis and apoptosis, lipogenesis is another crucial metabolic
with glycerol in order to accumulate triglyceride inside the adipocyte. As a result, facilitated glucose
process involved
transporter in fat storage.
member 4 (glut4),Uptaken fatty acids or
as well as diacylglycerol new synthesized
o-acyltransferase onesinvolved
(dgat), genes must beinassembled
glucose with
glycerol uptake
in orderand TG to assembly,
accumulate can betriglyceride inside
considered limiting theforadipocyte.
genes TG synthesis.As 3S, abutresult,
not 3S+4S,facilitated
reduced glucose
transporter member
glut4, 4 (glut4),
dgat1 and as well
dgat2 gene as diacylglycerol
expression (Figure 3A,B).o-acyltransferase
By contrast, fatty acid(dgat), genes
synthase (fasn)involved in glucose
related to de
uptake andnovoTG lipogenesis
assembly,was notcanmodified by the analyzed
be considered molecules.
limiting genes These
forresults suggest that 3S,
TG synthesis. the synthesis
but not 3S+4S,
of fatty acids is not affected by Q metabolite treatment and TG assembly is reduced.
reduced glut4, dgat1 and dgat2 gene expression (Figure 3A,B). By contrast, fatty acid synthase (fasn)
As far as we know this is the first study to reveal the potential effectiveness of Q metabolites in
related tomature
de novo lipogenesis
adipocytes, postulatingwasthat notglucose
modified uptakebyand theTG analyzed
assembling molecules.
are mechanisms Thesethat results
could suggest
that the synthesis
justify the TGof fatty acids
reduction is not in
observed affected by Q metabolite
mature adipocyte treatment
after 3S treatment. and TG assembly
Consequently, the effectsisonreduced.
As far
bodyasfatwe know this
observed is theafter
in animals firstQstudy to reveal
administration the potential
would effectiveness
be due not only to the parent ofcompound
Q metabolites in
but also to this metabolite. It is important to highlight that
mature adipocytes, postulating that glucose uptake and TG assembling are mechanisms the addition of 4S metabolite to 3S did not
that could
confer any additional effect. In fact, the expression of evaluated genes revealed a decrease in their
justify the TG reduction observed in mature adipocyte after 3S treatment. Consequently, the effects
impact (Figure 3B). These results suggest that the TG-lowering effect can be attributed exclusively to
on body3Sfat observed
metabolite, andinthatanimals
the addition after Qresults
of 4S administration
in a dilution of would be due
the effective not only to the parent
molecule.
compound but also
It has beentodescribed
this metabolite.
that adipocyteIt is turnover
important rateto forhighlight thathumans
lean and obese the addition
is around of10%
4S metabolite
[7].
to 3S did Asnot
matureconfer any additional
adipocytes do not have the effect.
abilityInto fact,
divide,the expression
adipocyte of evaluated
precursors genesmust
with this capacity revealed a
exist in adipose tissue. For this reason, in addition to mature
decrease in their impact (Figure 3B). These results suggest that the TG-lowering effect adipocyte analysis, the effects of Q can be
metabolites on pre-adipocytes were also assessed in the present study. ISO has been the most studied
attributed exclusively to 3S metabolite, and that the addition of 4S results in a dilution of the effective
of all the Q metabolites in maturing adipocytes. It has been demonstrated that this metabolite reduces
molecule. TG accumulation, with 10 µM the most effective dose in 3T3-L1 and human adipose tissue-derived
It has been
stems described
cells that etadipocyte
[35,49]. Zhang turnover
al. also reported similarrate for lean
results andpre-adipocytes,
in 3T3-L1 obese humans 12.5is µM
around
being 10% [7].
As mature theadipocytes
lowest effectivedo not
dosehave
[37]. In thegood
ability to divide,
accordance withadipocyte precursors
these studies, a significantwith this capacity
reduction after must
10 µM ISO treatment was observed in maturing pre-adipocytes in the
exist in adipose tissue. For this reason, in addition to mature adipocyte analysis, the effects of Q present work. Nevertheless,
none of the remaining Q metabolites was able to reduce TG at the doses of 1 or 10 µM, as Q did
metabolites on pre-adipocytes were also assessed in the present study. ISO has been the most studied
(Figure 4).
of all the Q metabolites in maturing adipocytes. It has been demonstrated that this metabolite reduces
TG accumulation, with 10 µM the most effective dose in 3T3-L1 and human adipose tissue-derived
stems cells [35,49]. Zhang et al. also reported similar results in 3T3-L1 pre-adipocytes, 12.5 µM being
the lowest effective dose [37]. In good accordance with these studies, a significant reduction after 10
µM ISO treatment was observed in maturing pre-adipocytes in the present work. Nevertheless, noneInt. J. Mol. Sci. 2019, 20, 264 6 of 13
Int. J. Mol. Sci. 2018, 19, x FOR PEER REVIEW 6 of 13
Figure 4.Figure 4. Effects
Effects of 0.1,of10.1,
and 1 and 10 µM
10 µM of ofquercetin
quercetin (Q),
(Q),isorhamnetin
isorhamnetin (ISO), tamarixetin
(ISO), (TAM), (TAM),
tamarixetin
quercetin-3-O-glucuronide (3G), quercetin-3-O-sulfate (3S), as well as 3S and quercetin-4-O-sulfate (4S)
quercetin-3-O-glucuronide (3G), quercetin-3-O-sulfate (3S), as well as 3S and quercetin-4-O-sulfate
mixture (3S+4S) on triacylglycerol content of 3T3-L1 maturing pre-adipocytes treated from day 0 to day
(4S) mixture (3S+4S)
8. Values on triacylglycerol
are means content
± SEM. Comparison of 3T3-L1
between maturing
each flavonoid dosepre-adipocytes
and the control wastreated from day 0
analyzed
to day 8.byValues aret-test.
Student’s means ± SEM. represent
The asterisks Comparison between
differences versuseach flavonoid
the controls dose***and
(* p < 0.05; the control was
p < 0.001).
analyzed by Student’s t-test. The asterisks represent differences versus the controls (* p < 0.05; *** p <
With regard to the mechanisms of action for ISO, Lee et al. [35] demonstrated that nine days of
0.001).
treatment in maturing 3T3-L1 pre-adipocytes with 50 µM reduced adipogenesis through the inhibition
of peroxisome proliferator-activated receptor γ (pparγ) and CCAAT/enhancer-binding protein α (cebpα). In our
With regard
cell cultures,to the
thedose
mechanisms of action
of 10 µM tended for ISO,
to decrease pparγLee et al.
gene [35] demonstrated
expression thatthat
(p = 0.06), but not nine
of days of
treatment in cebpβ
cebpα, maturing
or sterol3T3-L1
regulatorypre-adipocytes
element-binding factor with 50(Figure
(srebf1) µM 5). reduced adipogenesis
By comparing through
both studies, it is the
clear that higher doses promote greater impact on adipogenesis inhibition.
inhibition of peroxisome proliferator-activated receptor γ (pparγ) and CCAAT/enhancer-binding protein αThis conclusion was also
reached
(cebpα). In by Zhang
our cell et al. the
cultures, [37], dose
who revealed
of 10 µM thattended
ISO treatment decreased
to decrease adipocyte
pparγ genedifferentiation
expression (p at = 0.06),
a concentration of 12.5 µM and totally blocked this process at 50 µM. Likewise, they proposed the
but not that of cebpα, cebpβ or sterol regulatory element-binding factor (srebf1) (Figure 5). By comparing
differentiation stage as a limiting step for ISO effect. According to their data, the inhibitory effect on
both studies, it is clear
adipogenesis thatprominent
was less higher whendosesISO promote
was added greater impact
at the latter onofadipogenesis
stages inhibition. This
differentiation. Moreover,
conclusiontheywas alsothat
indicated reached
ISO mayby Zhang
control et al.
the early [37], whostage
differentiation revealed that ISO
by inhibiting treatment decreased
the transactivation of
pparγ. In the present research, we treated 3T3-L1 pre-adipocytes with ISO
adipocyte differentiation at a concentration of 12.5 µM and totally blocked this process at 50 µM. throughout the adipogenic
Likewise,process
they (eight
proposeddays).the
Therefore, the weak effect
differentiation stage pparγ
on as expression
a limiting observed
step for ISOcould be dueAccording
effect. not only to to their
the low dose but also to the influence of the differentiating stage.
data, the inhibitory effect on adipogenesis was less prominent when ISO was added at the latter
Much as took place with 3S metabolite treatment of mature adipocytes, the expression of trp53
stages ofwas
differentiation.
increased after Moreover,
ISO treatment they indicated that
of differentiating ISO may control
pre-adipocytes, the earlyofdifferentiation
but a diminution mRNA levels stage
by inhibiting
of thethe
deathtransactivation
repressor bcl2 was of pparγ.
observedIn(Figure
the present research,ISO
5). Furthermore, wetreatment
treated 3T3-L1 pre-adipocytes
did not promote
with ISOany change in cas3
throughout expression.
the adipogenic Theseprocess
results reveal
(eightthatdays).
the apoptosis pathway
Therefore, was
the not completely
weak effect on pparγ
activated by ISO treatment, probably due to the low dose
expression observed could be due not only to the low dose but also to the influence used. Mirroring mature adipocyte gene of the
analysis, the expression of dagt1, dgat2, and glut4 was also evaluated. With the exception of glut4, no
differentiating stage.
changes in the genes mentioned were detected (Figure 5). Therefore, glucose uptake and TG assembly
did not justify the observed delipidating effect of ISO.
In spite of the significant effects observed in the expression of several genes the only Q metabolite
to induce a significant reduction in pre-adipocyte TG content was ISO, but at 10 µM, a dose higher
than that found in serum when animals are treated with Q. Bearing this fact in mind, the involvement
of Q metabolites in the anti-obesity effect of this phenolic compound cannot be proposed.stages of differentiation. Moreover, they indicated that ISO may control the early differentiation stage
by inhibiting the transactivation of pparγ. In the present research, we treated 3T3-L1 pre-adipocytes
with ISO throughout the adipogenic process (eight days). Therefore, the weak effect on pparγ
expression observed
Int. J. Mol. Sci. 2019, 20, 264could be due not only to the low dose but also to the influence
7 of 13 of the
differentiating stage.
Figure 5. Effects of 10 µM of isorhamnetin (ISO) on the expression of cebpβ, srebf1, pparγ, cebpα, dgat1,
Figure 5. Effects of 10 µM of isorhamnetin (ISO) on the expression of cebpβ, srebf1, pparγ, cebpα, dgat1,
dgat2, glut4, trp53, cas3 and bcl2 in 3T3-L1 adipocytes treated for from day 0 to day 8. Values are
dgat2,
means ± trp53,
glut4, cas3 and bcl2
SEM. Comparison in 3T3-L1
between adipocytes
ISO and the controltreated
for each for
genefrom day 0 was
expression to day 8. Values
analyzed by are means
Student’s t-test. The asterisks represent differences versus the control (* p < 0.05).
3. Materials and Methods
3.1. Reagents
Dulbecco’s modified Eagle’s medium (DMEM) was purchased from GIBCO (BRL Life Technologies,
Grand Island, NY, USA). Q was purchased from Sigma (St. Louis, MO, USA) and ISO, TAM, and 3G
from Extrasynthese (Genay, France). TG were quantified by Infinity Triglycerides reagent (Thermo
Electron Corporation, Rockford, IL, USA) and protein concentrations of cell extracts were measured with
bicinchoninic acid (BCA) reagent (Thermo Scientific, Rockford, IL, USA). Commercial kits for analyzing
FFA and free glycerol were supplied by Roche and Sigma respectively (Free Fatty Acids, Half Micro Test,
Roche, Basilea, Sweden and F6428, Sigma, St. Louis, MO, USA).
3.2. Synthesis of Quercetin-3-O-Sulfate and Quercetin-4-O-Sulfate Metabolites
3.2.1. Synthesis of Quercetin Sulfates
Quercetin sulfates were synthesized as described by Dueñas et al. [50]. Dry pyridine was added to
quercetin (500 mg) to remove possible water associated with quercetin. Pyridine was rotary evaporated,
and the dry compound was dissolved in dioxane (50 mL) and allowed to react in a water bath (40 ◦ C)
for 90 min with a 10-fold molar excess of sulfur trioxide-N-triethylamine complex under nitrogen to
avoid contact with air. Products of sulfation precipitated out and stuck to the glass. Dioxane was
decanted, and the precipitate was redissolved in 10% methanol in water. The mixtures of quercetin
sulfates were fractioned on a Sephadex LH-20 column (350 mm × 30 mm), successively eluted with 10%
aqueous ethanol (500 mL) and 20% aqueous ethanol (500 mL). The fractions containing monosulfates
were collected, concentrated to dryness under vacuum, redissolved in ultrapure water, and analyzed
by high-performance liquid chromatography with diode array and mass spectrometry detection
(HPLC-DAD-MS).
3.2.2. HPLC-DAD-MS Analyses
Analyses were carried out with a Hewlett-Packard 1100 chromatograph (Agilent Technologies,
Waldbronn, Germany) with a quaternary pump and a DAD coupled to a HP Chem Station (revisionInt. J. Mol. Sci. 2019, 20, 264 8 of 13
A.05.04) data-processing station. Separation was achieved on an Agilent Poroshell 120 EC-C18 column
(2.7 µm, 150 mm × 4.6 mm) thermostatted at 35 ◦ C. Solvents used were (A) 0.1% TFA in water
and (B) acetonitrile and the elution gradient was from 10 to 15% B for 5 min, from 15 to 25% B for
5 min, from 25 to 35% B over 10 min, from 35 to 50% B over 10 min, isocratic 50% B for 10 min, and
re-equilibration of the column, at a flow rate of 0.5 mL/min. Double online detection was carried out
in the DAD using 250 and 370 nm as preferred wavelengths and in a mass spectrometer connected to
the HPLC system via the DAD cell outlet. MS detection was performed in a Finnigan LCQ detector
(Thermoquest, San Jose, CA, USA) equipped with an ESI source and an ion-trap mass analyzer, which
were controlled by the LCQ Xcalibur software. Both the auxiliary and sheath gases were nitrogen at
flow rates of 20 and 80 L/min, respectively. The source voltage was 4.5 kV; the capillary voltage was
11 V; and the capillary temperature was 220 ◦ C. Spectra were recorded in negative-ion mode between
m/z 150 and 2000. The MS detector was programmed to perform a series of two consecutive scans: a
full scan and a MS-MS scan of the most abundant ion in the first scan, using a normalized collision
energy of 45%.
3.2.3. Identification and Quantification of Quercetin Sulfates
Chemical hemisynthesis of the quercetin sulfates was performed as described by Dueñas et al. [50].
The complex mixture of products obtained was fractionated on a Sephadex LH-20 column to separate
monosulfates from other products (quercetin and quercetin disulfates). Further fractionation by
semipreparative HPLC obtained pure quercetin sulfate and a mixture with two quercetin sulfates that
were freeze dried for further use.
Chromatograms peaks showed a pseudomolecular ion [M-H]- at m/z 381 that released a unique
fragment at m/z 301 (−80 amu, loss of a sulfate moiety), corresponding to quercetin. The peaks were
identified as quercetin 4’-O-sulfate (peak 1) and quercetin 3’-O-sulfate (peak 2) based on their comparison
with compounds previously synthesized and fully identified by NMR [50]. The chromatographic purity
of the compounds was calculated to be higher than 96% from the area of the peaks obtained in HPLC
chromatograms recorded at 370 and 250 nm.
3.3. Experimental Design
3T3-L1 pre-adipocytes, supplied by American Type Culture Collection (Manassas, VA, USA),
were cultured in DMEM containing 10% fetal calf serum (FCS). Two days after confluence (day
0), cells were stimulated to differentiate with DMEM containing 10% FCS, 10 µg/mL insulin,
0.5 mM isobutylmethylxanthine, and 1 µM of dexamethasone for two days. From day four onward,
the differentiation medium was replaced by FBS/DMEM medium (10%) containing 0.2 µg/mL insulin.
This medium was changed every two days until cells were harvested. All media contained 1%
Penicillin/Streptomycin (10,000 U/mL), and the media for differentiation and maturation contained
1% (v/v) of Biotin and Pantothenic Acid. Cells were maintained at 37 ◦ C in a humidified 5%
CO2 atmosphere.
3.4. Cell Treatment
For the treatment of mature adipocytes, cells grown in 6-well plates were incubated with Q, ISO,
TAM, 3G, 3S and 3S+4S at 0.1, 1 and 10 µM (diluted in 95% ethanol) on day 12 after differentiation,
because at that day >90% of cells developed mature with visible lipid droplets. In the case of the
control group, the same volume of the vehicle (ethanol 95%) was used. Vehicle was diluted 1000-fold in
each well, reaching a final concentration of 0.095%. After 24 h, the supernatant was collected and cells
were used for TG determination, quantification of glycerol and FFA in the media and RNA extraction.
Each experiment was performed three times.
For the treatment of maturing pre-adipocytes, cells grown in 6-well plates were incubated with
Q, ISO, TAM, 3G, 3S and 3S+4S at 0.1, 1 and 10 µM (diluted in 95% ethanol) during differentiation.
In the case of the control group, the same volume of the vehicle (ethanol 95%) was used. MediaInt. J. Mol. Sci. 2019, 20, 264 9 of 13
containing, or not, molecules were changed every two days: on day 0, day 2, day 4, and day 6. On day
8, the supernatant was collected and cells were used for TG determination, RNA extraction and protein
extraction. Each experiment was performed three times.
3.5. Measurement of Triacylglycerol Content
After treatment, the medium was removed and cell extracts were used for TG determination.
Maturing pre-adipocytes and mature adipocytes were washed extensively with phosphate-buffered
saline and incubated three times with 800 µL of hexane/isopropanol (2:1). The total volume was then
evaporated by vacuumed centrifugation and the pellet was resuspended in 200 µL Triton X-100 in
1% distilled water. Afterwards, TGs were disrupted by sonication and the content was measured by
means of a commercial kit. For protein determinations, cells were lysed in 0.3N NaOH, 0.1% SDS.
Protein measurements were performed using the BCA reagent. TG content values were obtained as
mg triacylglycerols/mg protein and converted into arbitrary units.
3.6. RNA Extraction and RT-PCR
RNA samples from cells treated were extracted using Trizol (Invitrogen, Carlsbad, CA, USA),
according to the manufacturer’s instructions. After RNA purity verification, samples were then treated
with DNase I kit (Applied Biosystems, Foster city, CA, USA) to remove any contamination with genomic
DNA. 1.5 µg of total RNA of each sample was reverse-transcribed to first-strand complementary DNA
(cDNA) using iScriptTM cDNA Synthesis Kit (Bio-Rad, Hercules, CA, USA).
Relative atgl, hsl, lpl, fasn, glut4, dgat1, dgat2, bcl2, trp53 and cas3 mRNA levels in mature adipocytes
and relative cebpα and cebpβ, srebf1, pparγ, glut4, dgat1, dgat2, bcl2, trp53 and cas3 mRNA levels in
maturing pre-adipocytes were quantified using Real-Time PCR with an iCyclerTM - MyiQTM Real
Time PCR Detection System (BioRad, Hercules, CA, USA). For atgl, hsl, lpl, fasn, cebpβ, srebf1 and
bcl2 SYBR Green Master Mix (Applied Biosystems, Foster City, CA, USA) was used. The upstream
and downstream primers and probe (TibMolbiol, Berlin, Germany, Eurogentec, Liège, Belgium and
Metabion, Munich, Germany) are listed in Table 1. Cebpα, pparγ, glut4, dgat1, dgat2, trp53, and cas3 were
measured by TaqMan® Gene Expression Assays (Mm00514283_s1, Mm00440940_m1, Mm01731290_g1,
Mm00436615_m1, Mm00515643_m1, Mm499536_m1, Mm01195085_m1 and Mm02619580_g1) and
TaqMan® Fast Advanced Master Mix (Applied Biosystems, Foster City, CA, USA). RT-PCR parameters
used were those defined by manufacturer’s. β-actin mRNA levels were similarly measured and served
as the reference gene.
Table 1. Primers for PCR amplification of each studied gene.
Gene Sense Primer Anti-Sense Primer Annealing ta (◦ C)
atgl 50 -GAGCTTCGCGTCACCAAC-30 50 -CACATCTCTCGGAGGACCA-30 60.0
hsl 50 -GGTGACACTCGCAGAAGACAATA-30 50 -GCCGCCGTGCTGTCTCT-30 60.0
lpl 50 -CAGCTGGGCCTAACTTTGAG-30 50 -CCTCTCTGCAATCACACGAA-30 61.5
fasn 50 -AGCCCCTCAAGTGCACAGTG-30 50 -TGCCAATGTGTTTTCCCTGA-30 60.0
β-actin 50 -ACGAGGCCCAGAGCAAGAG-30 50 -GGTGTGGTGCCAGATCTTCTC-30 60.0
srebf1 5´- GCTGTTGGCATCCTGCTATC-30 50 -TAGCTGGAAGTGACGGTGGT-30 60.0
cebpβ 50 -CAAGCTGAGCGACGAGTACA-30 50 -CAGCTGCTCCACCTTCTTCT-30 67.5
bcl2 50 -AGTACCTGAACCGGCATCTG-30 50 -GGGGCCATATAGTTCCACAAA-30 60.0
atgl = adipose triglyceride lipase; hsl = hormone sensitive lipase; lpl = lipoprotein lipase; fasn= fatty acid synthase;
srebf1 = sterol regulatory element-binding factor 1; cebpβ = CCAAT-enhancer- binding protein β; bcl2 = B cell
leukemia/lymphoma 2.
All gene expression results were expressed as fold changes of threshold cycle (Ct) value relative
to controls using the 2−∆∆Ct method [51].Int. J. Mol. Sci. 2019, 20, 264 10 of 13
3.7. Measurements of Glycerol and Free Fatty Acids in the Media
After treatment in mature adipocytes, aliquots of the medium treated with 10 µM of 3S+4S
were removed and analyzed for glycerol and FFA quantification by means of commercial kits
(see Reagents paragraph).
3.8. Statistical Analysis
Results are presented as mean ± standard error of the mean (SEM). Statistical analysis was
performed using SPSS 24.0 (SPSS Inc., Chicago, IL, USA). After confirming the normal distribution
of variables using Shapiro-Wilks normality test, each flavonoid dose effect against the control was
checked by Student’s t test. Statistical significance was set-up at the p < 0.05 level.
4. Conclusions
The results obtained in the present study demonstrate that 3S metabolite may contribute to the
delipidating effect of Q by reducing glucose uptake and TG assembling in mature adipocytes. ISO
metabolite diminished TG accumulation in pre-adipocytes, but at a concentration of 10 µM, which is
higher than that found in plasma from animals treated with Q. Consequently, its contribution to the
effect of Q should be discarded, as well as that of 3G, 4S and TAM.
Supplementary Materials: Supplementary materials can be found at http://www.mdpi.com/1422-0067/20/2/
264/s1.
Author Contributions: M.P.P., J.M. and A.L. were responsible for the study concept and design. S.G.-M. and
C.S.-B. synthetized and analyzed quercetin sulfates. I.E. and A.M.-S. performed the cell experiments and acquired
the data. I.E. performed the gene expression and bioanalytical analysis. M.P.P., A.L. and J.M. interpreted data and
drafted the manuscript. All authors read and approved the final manuscript.
Funding: This research has been supported by Instituto de Salud Carlos III (CIBERobn), Basque Government
(IT-572-13) and MINECO (AGL2015-64522-C2-2-R). Itziar Eseberri is a recipient of a doctoral fellowship from
the University of the Basque Country. Andrea Mosqueda-Solís is a recipient of a doctoral fellowship from the
CONACYT (Mexico).
Conflicts of Interest: The authors declare no conflict of interest.
Abbreviations
3G quercetin-3-O-glucuronide
3S quercetin-3-O-sulfate
4S quercetin-4-O-sulfate
atgl adipose triglyceride lipase
bcl2 B cell leukemia/lymphoma 2
cas3 caspase 3
cebpα CCAAT-enhancer-binding protein α
cebpβ CCAAT-enhancer-binding protein β
dgat1 diacylglycerol O-acyltransferase 1
dgat2 diacylglycerol O-acyltransferase 2
DMEM Dulbecco’s modified Eagle’s medium
fasn fatty acid synthase
glut4 facilitated glucose transporter member 4
FCS fetal calf serum
FFA free fatty acid
hsl hormone sensitive lipase
ISO isorhamnetin
lpl lipoprotein lipase
pparγ peroxisome proliferator-activated receptor γInt. J. Mol. Sci. 2019, 20, 264 11 of 13
Q quercetin
srebf1 sterol regulatory element-binding factor 1
TAM tamarixetin
TG triacylglycerol
trp53 transformation related protein 53
References
1. Hollman, P.C.; Katan, M.B. Dietary flavonoids: Intake, health effects and bioavailability. Food Chem. Toxicol.
1999, 37, 937–942. [CrossRef]
2. Neveu, V.; Perez-Jiménez, J.; Vos, F.; Crespy, V.; du Chaffaut, L.; Mennen, L.; Knox, C.; Eisner, R.; Cruz, J.;
Wishart, D.; et al. Phenol-Explorer: An online comprehensive database on polyphenol contents in foods.
Database (Oxford) 2010. [CrossRef] [PubMed]
3. Hertog, M.G.; Kromhout, D.; Aravanis, C.; Blackburn, H.; Buzina, R.; Fidanza, F.; Giampaoli, S.; Jansen, A.;
Menotti, A.; Nedeljkovic, S. Flavonoid intake and long-term risk of coronary heart disease and cancer in the
seven countries study. Arch. Intern. Med. 1995, 155, 381–386. [CrossRef] [PubMed]
4. Harwood, M.; Danielewska-Nikiel, B.; Borzelleca, J.F.; Flamm, G.W.; Williams, G.M.; Lines, T.C. A critical
review of the data related to the safety of quercetin and lack of evidence of in vivo toxicity, including lack of
genotoxic/carcinogenic properties. Food Chem. Toxicol. 2007, 45, 2179–2205. [CrossRef]
5. Zhu, J.G.; Xia, L.; Ji, C.B.; Zhang, C.M.; Zhu, G.Z.; Shi, C.M.; Chen, L.; Qin, D.N.; Guo, X.R. Differential DNA
methylation status between human preadipocytes and mature adipocytes. Cell Biochem. Biophys. 2012, 63,
1–15. [CrossRef] [PubMed]
6. Siersbæk, R.; Nielsen, R.; Mandrup, S. Transcriptional networks and chromatin remodeling controlling
adipogenesis. Trends Endocrinol. Metab. 2012, 23, 56–64. [CrossRef]
7. Spalding, K.L.; Arner, E.; Westermark, P.O.; Bernard, S.; Buchholz, B.A.; Bergmann, O.; Blomqvist, L.;
Hoffstedt, J.; Näslund, E.; Britton, T.; et al. Dynamics of fat cell turnover in humans. Nature 2008, 453,
783–787. [CrossRef]
8. Kuppusamy, U.R.; Das, N.P. Effects of flavonoids on cyclic AMP phosphodiesterase and lipid mobilization
in rat adipocytes. Biochem. Pharmacol. 1992, 44, 1307–1315. [CrossRef]
9. Hsu, C.L.; Yen, G.C. Induction of cell apoptosis in 3T3-L1 pre-adipocytes by flavonoids is associated with
their antioxidant activity. Mol. Nutr. Food Res. 2006, 50, 1072–1079. [CrossRef] [PubMed]
10. Ahn, J.; Lee, H.; Kim, S.; Park, J.; Ha, T. The anti-obesity effect of quercetin is mediated by the AMPK and
MAPK signaling pathways. Biochem. Biophys. Res. Commun. 2008, 373, 545–549. [CrossRef]
11. Yang, J.Y.; Della-Fera, M.A.; Rayalam, S.; Ambati, S.; Hartzell, D.L.; Park, H.J.; Baile, C.A. Enhanced
inhibition of adipogenesis and induction of apoptosis in 3T3-L1 adipocytes with combinations of resveratrol
and quercetin. Life Sci. 2008, 82, 1032–1039. [CrossRef] [PubMed]
12. Eseberri, I.; Miranda, J.; Lasa, A.; Churruca, I.; Portillo, M.P. Doses of Quercetin in the Range of Serum
Concentrations Exert Delipidating Effects in 3T3-L1 Preadipocytes by Acting on Different Stages of Adipogenesis,
but Not in Mature Adipocytes. Oxid. Med. Cell. Longev. 2015, 2015, 480943. [CrossRef] [PubMed]
13. Wood Dos Santos, T.; Cristina Pereira, Q.; Teixeira, L.; Gambero, A.; A Villena, J.; Lima Ribeiro, M. Effects of
Polyphenols on Thermogenesis and Mitochondrial Biogenesis. Int. J. Mol. Sci. 2018, 19, 2757. [CrossRef]
[PubMed]
14. Snyder, S.M.; Zhao, B.; Luo, T.; Kaiser, C.; Cavender, G.; Hamilton-Reeves, J.; Sullivan, D.K.; Shay, N.F.
Consumption of Quercetin and Quercetin-Containing Apple and Cherry Extracts Affects Blood Glucose
Concentration, Hepatic Metabolism, and Gene Expression Patterns in Obese C57BL/6J High Fat-Fed Mice.
J. Nutr. 2016, 146, 1001–1007. [CrossRef] [PubMed]
15. Leiherer, A.; Stoemmer, K.; Muendlein, A.; Saely, C.H.; Kinz, E.; Brandtner, E.M.; Fraunberger, P.; Drexel, H.
Quercetin Impacts Expression of Metabolism- and Obesity-Associated Genes in SGBS Adipocytes. Nutrients
2016, 8, 282. [CrossRef] [PubMed]
16. Lee, S.G.; Parks, J.S.; Kang, H.W. Quercetin, a functional compound of onion peel, remodels white adipocytes
to brown-like adipocytes. J. Nutr. Biochem. 2017, 42, 62–71. [CrossRef] [PubMed]Int. J. Mol. Sci. 2019, 20, 264 12 of 13
17. Moon, J.; Do, H.J.; Kim, O.Y.; Shin, M.J. Antiobesity effects of quercetin-rich onion peel extract on the
differentiation of 3T3-L1 preadipocytes and the adipogenesis in high fat-fed rats. Food Chem. Toxicol. 2013,
58, 347–354. [CrossRef]
18. Rivera, L.; Morón, R.; Sánchez, M.; Zarzuelo, A.; Galisteo, M. Quercetin ameliorates metabolic syndrome and
improves the inflammatory status in obese Zucker rats. Obesity (Silver Spring) 2008, 16, 2081–2087. [CrossRef]
19. Lee, J.S.; Cha, Y.J.; Lee, K.H.; Yim, J.E. Onion peel extract reduces the percentage of body fat in overweight
and obese subjects: A 12-week, randomized, double-blind, placebo-controlled study. Nutr. Res. Pract. 2016,
10, 175–181. [CrossRef]
20. Kobori, M.; Masumoto, S.; Akimoto, Y.; Oike, H. Chronic dietary intake of quercetin alleviates hepatic fat
accumulation associated with consumption of a Western-style diet in C57/BL6J mice. Mol. Nutr. Food Res.
2011, 55, 530–540. [CrossRef]
21. Panchal, S.K.; Poudyal, H.; Brown, L. Quercetin ameliorates cardiovascular, hepatic, and metabolic changes
in diet-induced metabolic syndrome in rats. J. Nutr. 2012, 142, 1026–1032. [CrossRef] [PubMed]
22. Jung, C.H.; Cho, I.; Ahn, J.; Jeon, T.I.; Ha, T.Y. Quercetin reduces high-fat diet-induced fat accumulation in
the liver by regulating lipid metabolism genes. Phytother. Res. 2013, 27, 139–143. [CrossRef]
23. Pfeuffer, M.; Auinger, A.; Bley, U.; Kraus-Stojanowic, I.; Laue, C.; Winkler, P.; Rüfer, C.E.; Frank, J.;
Bösch-Saadatmandi, C.; Rimbach, G.; et al. Effect of quercetin on traits of the metabolic syndrome, endothelial
function and inflammation in men with different APOE isoforms. Nutr. Metab. Cardiovasc. Dis. 2013, 23,
403–409. [CrossRef]
24. Yang, Y.K.; Kim, S.P. The effect of onion extract intake for 12 weeks on blood lipid and obesity index in obese
university women. Korean J. Sports Sci. 2013, 22, 955–962.
25. Lee, K.H.; Lee, H.J.; Park, E.J.; Jeon, K.I. Effect of onion extracts on serum lipid and antioxidant status in
healthy university female. Korean J. Community Nutr. 2008, 2, 373–379.
26. Chen, S.; Jiang, H.; Wu, X.; Fang, J. Therapeutic Effects of Quercetin on Inflammation, Obesity, and Type 2
Diabetes. Mediat. Inflamm. 2016, 2016, 9340637. [CrossRef] [PubMed]
27. Van der Woude, H.; Boersma, M.G.; Vervoort, J.; Rietjens, I.M. Identification of 14 quercetin phase II mono- and
mixed conjugates and their formation by rat and human phase II in vitro model systems. Chem. Res. Toxicol.
2004, 17, 1520–1530. [CrossRef]
28. D’Andrea, G. Quercetin: A flavonol with multifaceted therapeutic applications? Fitoterapia 2015, 106, 256–271.
[CrossRef]
29. Cao, J.; Zhang, Y.; Chen, W.; Zhao, X. The relationship between fasting plasma concentrations of selected
flavonoids and their ordinary dietary intake. Br. J. Nutr. 2010, 103, 249–255. [CrossRef]
30. Murota, K.; Terao, J. Antioxidative flavonoid quercetin: Implication of its intestinal absorption and metabolism.
Arch. Biochem. Biophys. 2003, 417, 12–17. [CrossRef]
31. Guo, Y.; Mah, E.; Bruno, R.S. Quercetin bioavailability is associated with inadequate plasma vitamin C status
and greater plasma endotoxin in adults. Nutrition 2014, 30, 1279–1286. [CrossRef] [PubMed]
32. Manach, C.; Morand, C.; Crespy, V.; Demigné, C.; Texier, O.; Régérat, F.; Rémésy, C. Quercetin is recovered in
human plasma as conjugated derivatives which retain antioxidant properties. FEBS Lett. 1998, 426, 331–336.
[CrossRef]
33. Day, A.J.; Mellon, F.; Barron, D.; Sarrazin, G.; Morgan, M.R.; Williamson, G. Human metabolism of dietary
flavonoids: Identification of plasma metabolites of quercetin. Free Radic. Res. 2001, 35, 941–952. [CrossRef]
[PubMed]
34. Justino, G.C.; Santos, M.R.; Canário, S.; Borges, C.; Florêncio, M.H.; Mira, L. Plasma quercetin metabolites:
Structure-antioxidant activity relationships. Arch. Biochem. Biophys. 2004, 432, 109–121. [CrossRef] [PubMed]
35. Lee, J.; Jung, E.; Kim, S.; Huh, S.; Kim, Y.; Byun, S.Y.; Kim, Y.S.; Park, D. Isorhamnetin represses adipogenesis
in 3T3-L1 cells. Obesity (Silver Spring) 2009, 17, 226–232. [CrossRef] [PubMed]
36. Herranz-López, M.; Borrás-Linares, I.; Olivares-Vicente, M.; Gálvez, J.; Segura-Carretero, A.; Micol, V.
Correlation between the cellular metabolism of quercetin and its glucuronide metabolite and oxidative stress
in hypertrophied 3T3-L1 adipocytes. Phytomedicine 2017, 25, 25–28. [CrossRef]
37. Zhang, Y.; Gu, M.; Cai, W.; Yu, L.; Feng, L.; Zhang, L.; Zang, Q.; Wang, Y.; Wang, D.; Chen, H.; et al. Dietary
component isorhamnetin is a PPARγ antagonist and ameliorates metabolic disorders induced by diet or
leptin deficiency. Sci. Rep. 2016, 6, 19288. [CrossRef]Int. J. Mol. Sci. 2019, 20, 264 13 of 13
38. Chuang, C.H.; Yeh, C.L.; Yeh, S.L.; Lin, E.S.; Wang, L.Y.; Wang, Y.H. Quercetin metabolites inhibit MMP-2
expression in A549 lung cancer cells by PPAR-γ associated mechanisms. J. Nutr. Biochem. 2016, 33, 45–53.
[CrossRef]
39. Maeda, H.; Hosokawa, M.; Sashima, T.; Takahashi, N.; Kawada, T.; Miyashita, K. Fucoxanthin and its
metabolite, fucoxanthinol, suppress adipocyte differentiation in 3T3-L1 cells. Int. J. Mol. Med. 2006, 18,
147–152. [CrossRef]
40. Maeda, H.; Saito, S.; Nakamura, N.; Maoka, T. Paprika Pigments Attenuate Obesity-Induced Inflammation
in 3T3-L1 Adipocytes. ISRN Inflamm. 2013, 2013, 763758. [CrossRef]
41. Eseberri, I.; Lasa, A.; Churruca, I.; Portillo, M.P. Resveratrol metabolites modify adipokine expression and
secretion in 3T3-L1 pre-adipocytes and mature adipocytes. PLoS ONE 2013, 8, e63918. [CrossRef] [PubMed]
42. Takahashi, K.; Uchida, N.; Kitanaka, C.; Sagara, C.; Imai, M.; Takahashi, N. Inhibition of ASCT2 is essential
in all-trans retinoic acid-induced reduction of adipogenesis in 3T3-L1 cells. FEBS Open Bio 2015, 5, 571–578.
[CrossRef]
43. Boesch-Saadatmandi, C.; Loboda, A.; Wagner, A.E.; Stachurska, A.; Jozkowicz, A.; Dulak, J.; Döring, F.;
Wolffram, S.; Rimbach, G. Effect of quercetin and its metabolites isorhamnetin and quercetin-3-glucuronide
on inflammatory gene expression: Role of miR-155. J. Nutr. Biochem. 2011, 22, 293–299. [CrossRef] [PubMed]
44. Russo, M.; Spagnuolo, C.; Tedesco, I.; Bilotto, S.; Russo, G.L. The flavonoid quercetin in disease prevention
and therapy: Facts and fancies. Biochem. Pharmacol. 2012, 83, 6–15. [CrossRef]
45. Aguirre, L.; Arias, N.; Macarulla, M.T.; Gracia, A.; Portillo, M.P. Beneficial Effects of Quercetin on Obesity
and Diabetes. Open Nutraceuticals J. 2011, 4, 189–198.
46. Gonzales, A.M.; Orlando, R.A. Role of adipocyte-derived lipoprotein lipase in adipocyte hypertrophy.
Nutr. Metab. (Lond.) 2007, 4, 22. [CrossRef]
47. Tinahones, F.J.; Coín Aragüez, L.; Murri, M.; Oliva Olivera, W.; Mayas Torres, M.D.; Barbarroja, N.; Gomez
Huelgas, R.; Malagón, M.M.; El Bekay, R. Caspase induction and BCL2 inhibition in human adipose tissue:
A potential relationship with insulin signaling alteration. Diabetes Care 2013, 36, 513–521. [CrossRef]
48. Molchadsky, A.; Rivlin, N.; Brosh, R.; Rotter, V.; Sarig, R. p53 is balancing development, differentiation and
de-differentiation to assure cancer prevention. Carcinogenesis 2010, 31, 1501–1508. [CrossRef]
49. Lee, J.; Jung, E.; Hwang, W.; Kim, Y.S.; Park, D. Isorhamnetin-induced anti-adipogenesis is mediated by
stabilization of beta-catenin protein. Life Sci. 2010, 86, 416–423. [CrossRef]
50. Dueñas, M.; González-Manzano, S.; Surco-Laos, F.; González-Paramas, A.; Santos-Buelga, C. Characterization
of sulfated quercetin and epicatechin metabolites. J. Agric. Food Chem. 2012, 60, 3592–3598. [CrossRef]
51. Livak, K.J.; Schmittgen, T.D. Analysis of relative gene expression data using real-time quantitative PCR and
the 2(-Delta Delta C(T)) Method. Methods 2001, 25, 402–408. [CrossRef] [PubMed]
© 2019 by the authors. Licensee MDPI, Basel, Switzerland. This article is an open access
article distributed under the terms and conditions of the Creative Commons Attribution
(CC BY) license (http://creativecommons.org/licenses/by/4.0/).You can also read