Optimal Recovery of Valuable Biomaterials, Chondroitin Sulfate and Bioapatites, from Central Skeleton Wastes of Blue Shark - CVMar+i
←
→
Page content transcription
If your browser does not render page correctly, please read the page content below

polymers
Article
Optimal Recovery of Valuable Biomaterials,
Chondroitin Sulfate and Bioapatites, from Central
Skeleton Wastes of Blue Shark
José Antonio Vázquez 1, * , Javier Fraguas 1 , Pío González 2 , Julia Serra 2
and Jesus Valcarcel 1, *
 1   Group of Recycling and Valorisation of Waste Materials (REVAL), Marine Research Institute (IIM-CSIC),
     Eduardo Cabello, 6. Vigo, 36208 Galicia, Spain; xavi@iim.csic.es
 2   New Materials Group, Department of Applied Physics, Campus Lagoas-Marcosende, University of Vigo,
     IISGS, MTI, 36310 Vigo, Spain; pglez@uvigo.es (P.G.); jserra@uvigo.es (J.S.)
 *   Correspondence: jvazquez@iim.csic.es (J.A.V.); jvalcarcel@iim.csic.es (J.V.); Tel.: +34-986-231-930 (J.A.V.);
     Fax: +34-986-292-762 (J.V.)

 Received: 6 October 2020; Accepted: 3 November 2020; Published: 6 November 2020

 Abstract: The industrial filleting of blue shark (Prionace glauca) led to the generation of a large
 number of central skeletons of low interest to fishmeal plants handling such wastes. In this context,
 the present study describes the optimization of the hydrolysis process (pH 8.35, T 58 ◦ C, 1% (v/w)
 of alcalase and t = 4 h) to produce chondroitin sulfate (CS) together with the recovery of bioapatites.
 Then, that hydrolysate was chemically treated with an optimal alkaline-hydroalcoholic-saline
 solution (0.48 M of NaOH, 1.07 volumes of EtOH and 2.5 g/L of NaCl) and finally purified
 by ultrafiltration-diafiltration (30 kDa) to obtain glycosaminoglycan with a purity of 97% and
 a productive yield of 2.8% (w/w of skeleton). The size of the biopolymer (CS) was of 58 kDa with
 prevalence of 6S-GalNAc sulfation (4S/6S ratio of 0.25), 12% of GlcA 2S-GalNAc 6S and 6% of
 non-sulfated disaccharides. Crude bioapatites were purified by pyrolysis and FT-Raman and XRD
 techniques confirm the presence of hydroxyapatite [Ca5 (PO4 )3 (OH)], with a molar mass of 502.3 g/mol,
 embedded in the organic matrix of the skeleton. The mineralized tissues of blue shark are promising
 marine sources for the extraction of high value biomaterials with clinical application in bone and
 tissue regeneration and are still completely unexplored.

 Keywords: chondroitin sulfate isolation; Prionace glauca skeletons; bioapatite recovery;
 physicochemical characterization of biomaterials; process optimisation

1. Introduction
      Thousands of tons of fish by-products are generated around the world in the filleting of commercial
fish species for the production of marine foods. In many cases those wastes are managed as solid urban
fraction and in other occasions they are substrates for the production of fish meal [1,2], although many
of them are valuable sources of biomaterials that can be used in the formulation of pharmacological,
nutraceutical and biomedical devices [3–5]. The production of fish meal has been a well-established
and very profitable business for several decades, in which the final benefits are directly proportional
to the content of protein. This is the main reason for which substrates derived from the central
skeletons, bones and heads of fish are not welcome in meal plants, since the fish meal obtained has
a low concentration of protein (25%).
      In the industrial processing of blue shark (Prionace glauca), after muscle separation, central skeletons
are disposed in the plants as residues. This by-product supposes around 10–20% of the total weight
of the shark and they are formed of vertebral discs and intervertebral fibrocartilage [6] rich in

Polymers 2020, 12, 2613; doi:10.3390/polym12112613                                  www.mdpi.com/journal/polymers
Polymers 2020, 12, 2613                                                                              2 of 15

minerals type-apatite, proteins and glycosaminoglycans (GAGs). The valorization of shark skeleton,
still unexplored, is an important step for the sustainability of shark fisheries and may lead to the joint
recovery of the apatites and GAGs fraction of great relevance in different pharma applications [7–9].
      GAGs are a family of linear polymers composed of repeating O-linked disaccharide units that
are included in the cell surface and in the extracellular matrix of most animal tissues. Because of its
habitual association with proteins, they maintain the structure of certain tissues (such as, for example,
the cartilage) and are also involved in the proliferation, differentiation, migration and communication
of cells [10]. As a consequence of these biological activities, the number of applications of GAGs in
the field of tissue regeneration is increasing and, concomitantly, new sources of these biopolymers
with varied chemical properties have been recently studied [11–13]. Among GAGs, chondroitin sulfate
(CS) is one of the most abundant and consists of the repetition of glucuronic acid (GlcA) and N-acetyl
galactosamine (GalNAc) linked by alternating β-(1→ 4) and β-(1→3) glycosidic bonds, which can be
sulfated at different positions of both monosaccharides. Marine substrates are valuable sources of CS
that have reported multiple biological and structural properties [14–16], which are dependent on the
sulfation pattern and molecular weight of the biopolymer [17–19]. Both issues are also influenced
by the origin of the substrate (marine species and kind of tissue) and the processes applied for its
purification. In this context, the use of sustainable steps for its isolation is fundamental to follow the
principles of the circular economy [20–22]. Mathematical tools, such as response surface methodology,
are integral to optimize the different processes needed to maximize the recovery of CS minimizing the
time, reagent and energy demand [23–25].
      Apatites are bioactive bioceramics which belong to the family of calcium phosphates and,
in particular, hydroxyapatite (HA), Ca10 (PO4 )6 (OH)2 . This basic composition enriched by groups and
elements in trace concentrations, as CO3 2− , HPO4 2− , Na+ , Mg2+ , Sr2+ , K+ , Cl− and F− , constitute the
mineral fraction of mineralized tissues, as teeth, skeleton and bones. As a bioactive material, HA has
the ability to induce its biological integration in living tissues, and, therefore, to promote the activity
of bone tissue forming cells, and activate the adhesion and proliferation of osteoblasts. HA-based
materials have attracted great interest in clinical applications as bone grafts, being those of biological
origin (mainly bovine, porcine and marine) which is preferred to synthetic biomaterials, given that
their behaviour is biologically more active due to the role of the essential elements in the bone defect
healing. In previous works, new marine biological sources of apatites are being investigated [7,8].
The potential of the discards from the fishing industry is being explored and, in particular, the extraction
of bioapatites from distinct mineralized tissues, shark jaws and teeth, as promising biomaterials for
bone regeneration [7,8]. With this goal, the characterization of blue shark vertebrae to identify potential
HA as valorization products is of great interest.
      The aim of this study was to maximize the processes for the joint recovery of CS and bioapatites
from the central skeleton of the blue shark, a substrate completely unexplored. The main variables that
affect the enzyme hydrolysis of the skeleton, the selective precipitation and membrane purification
of CS, were mathematically modelled and optimized. Finally, chemical features and composition of
CS and bioapatite were extensively determined by gel permeation chromatography (GPC), NMR,
SAX-HPLC, Raman spectroscopy and X-ray diffraction.

2. Materials and Methods

2.1. Wastes from Blue Shark Processing
     Central skeletons of the blue shark (Prionace glauca) were kindly supplied by Protea Productos del
Mar S.A. (Marín, Spain). They were generated as wastes after fillet preparation and directly stored at
−20 ◦ C. These materials were firstly boiled in water at 90 ◦ C for 20 min and then manually cleaned for
the separation of muscle remains (Figure 1). The clean skeletons were cut in a bandsaw for meat and
bones, then crushed in a meat grinder (obtained pieces around 0.25–1.0 cm), and stored at −20 ◦ C until
use. Although the rest of muscle separated was not a motive of study in this manuscript, it could be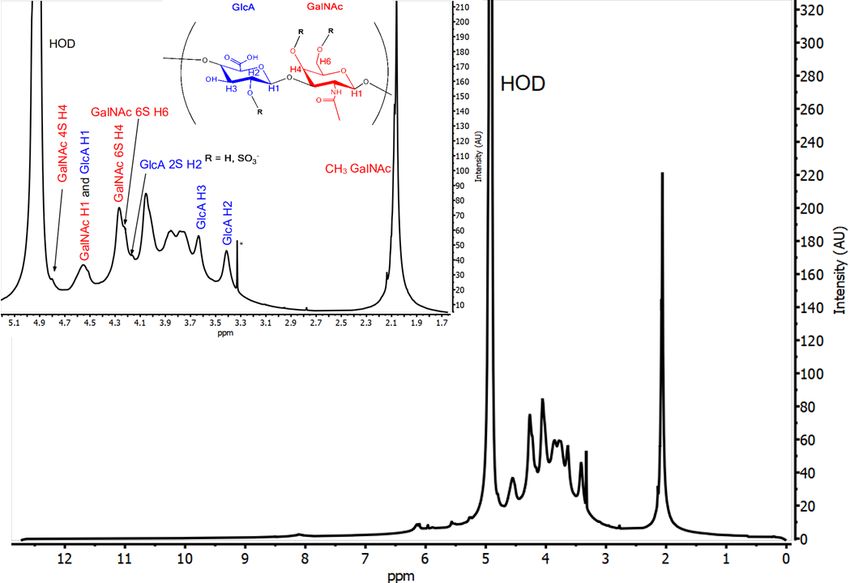
Polymers 2020, 12, 2613 3 of 15
used as substrate for the production of fish protein hydrolysates (FPH) mediated by an endogenous
protease as, for example, alcalase or papain under controlled conditions.
Polymers 2020, 12, x FOR PEER REVIEW 3 of 15
Figure 1. Flowchart
Flowchart of steps studied for the isolation of chondroitin sulfate (CS) and bioapatite from
skeleton wastes of blue shark. Percentages
Percentages of
of products
products recovery (w/w of initial skeleton) are shown in
brackets. FPH: fish
FPH: fish protein hydrolysates, SED: sediment and SUP: supernatant.
2.2. Optimization
2.2. Optimization Experiments
Experiments
Two experimental
Two experimental designs
designs were
were sequentially
sequentially executed
executed toto optimize: (a) the
optimize: (a) the joint
joint influence
influence ofof
temperature (T) and pH on the skeleton hydrolysis by alcalase; (b) the combined
temperature (T) and pH on the skeleton hydrolysis by alcalase; (b) the combined effect of ethanol effect of ethanol
volume (E)
volume (E)and NaOH
and NaOH concentration
concentration(N) on(N)
the recovery of chondroitin
on the recovery sulfate (CS), and
of chondroitin corresponding
sulfate (CS), and
corresponding purity, from skeleton hydrolysates after chemical selective precipitation. In bothsecond
purity, from skeleton hydrolysates after chemical selective precipitation. In both cases, rotatable cases,
order designs
rotatable secondwere performed
order designs[26] according
were to the[26]
performed conditions
accordingdefined in conditions
to the Table 1 (thatdefined
is, 13 experiments
in Table 1
combining
(that is, 13 the different levels
experiments of the independent
combining the differentvariables,
levels of including 5 replicates
the independent in the center
variables, of the
including 5
experimental domain). The estimation of the empirical Equation defining the
replicates in the center of the experimental domain). The estimation of the empirical Equation relationship between
the independent
defining variables
the relationship between pH independent
(T and the or N and E) and the responses
variables (T and pH analyzed
or N and(Y)E) was calculated
and the responsesby
orthogonal(Y)
analyzed least-squares method,
was calculated bysimultaneously with the multivariable
orthogonal least-squares statistical analysis
method, simultaneously withof the
the
results [27]. The theoretical form of the polynomial Equations generated are:
multivariable statistical analysis of the results [27]. The theoretical form of the polynomial Equations
generated are:
Y = b0 + b1 T + b2 pH + b12 TpH + b11 T2 + b22 pH2 (1)
2 2
Y = b0 + b1T + b2 pH + b12TpH + b11T + b22 pH (1)
Y = b0 + b1 N + b2 E + b12 NE + b11 N2 + b22 E2 (2)
Y = b0 + b1 N + b2 E + b12 NE + b11N 2 + b22 E2 (2)
where Y is the dependent variable evaluated, b0 is the intercept, b1 and b2 are the parameters for
where Y is effects,
the linear the dependent
b12 is the variable
term ofevaluated,
the jointbeffect
0 is theofintercept, b1 and b2 variables,
the independent are the parameters
b11 and bfor
22 the
are
linear effects, b12ofisthe
the parameters thequadratic
term of the jointFor
effects. effect
the of the independent
statistical analysis ofvariables, b11 the
the results, andsignificance
b22 are the
parameters of the quadratic
of the coefficients was evaluatedeffects.
byFor the statistical
Student’s t-test (α = 0.05).
analysis of the
Theresults, the significance
coefficients of the
of determination
coefficients
and adjustedwas evaluated
coefficients of determination (R2 and
by Student’s t-test (α R=2adj0.05).
) wereThe coefficients
calculated of determination
to establish and
goodness-of-fit,
(α = 0.05) were
2
adjusted
and the twocoefficients of determination
mean squares ratios from(R 2 and
the Radj)F-test
Fisher were calculated to establish goodness-of-fit,
determined to confirmand
the
the two mean squares ratios from the Fisher F-test (α = 0.05) were determined to confirm the
consistency of the polynomial models: F1 = model/total error, the equation is acceptable when F1 ≥ F
num num num
den ; and F2 = (Model + lack of fitting)/model, the equation is acceptable when F2 ≤ Fden . Fden are the
theoretical values for α = 0.05 with corresponding degrees of freedom for the numerator (num) and
denominator (den).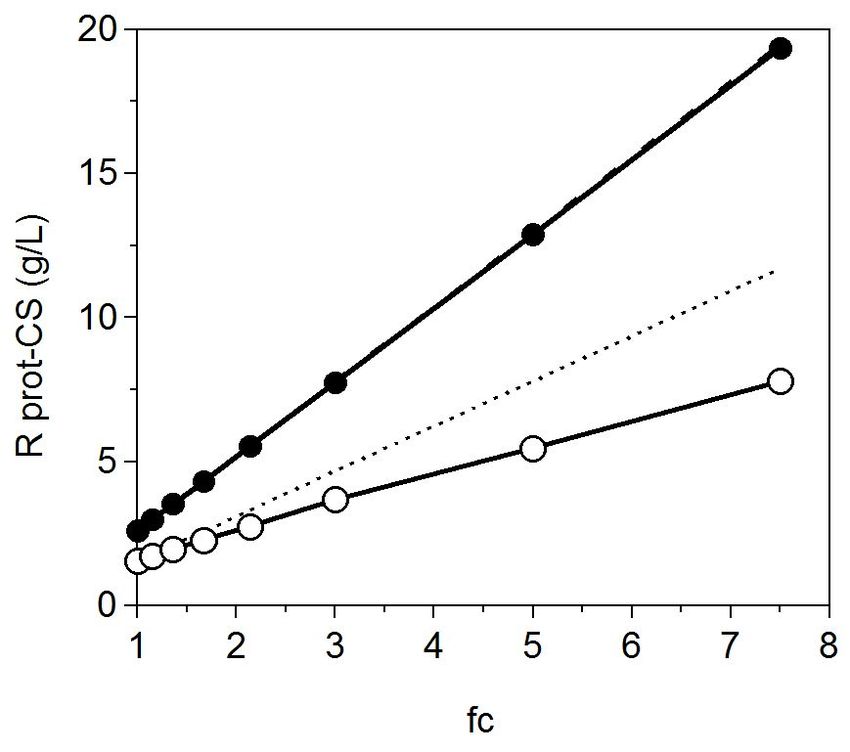
Polymers 2020, 12, 2613                                                                                                        4 of 15

consistency of the polynomial models: F1 = model/total error, the equation is acceptable when F1 ≥ Fnum
                                                                                                    den
                                                                                                        ;
and F2 = (Model + lack of fitting)/model, the equation is acceptable when F2 ≤ Fnum   den
                                                                                          . Fnum are the
                                                                                             den
theoretical values for α = 0.05 with corresponding degrees of freedom for the numerator (num) and
denominator (den).

      Table 1. Experimental domains and codification of the independent variables in the factorial rotatable
      designs performed to optimize the enzyme hydrolysis of blue shark skeletons and the chemical
      treatments of the hydrolysates using alkaline-hydroalcoholic solutions.

                                                                       Real Values
                                               Enzyme Hydrolysis                 NaOH-EtOH Treatment
                     Coded Values
                                                pH               T   (◦ C)      NaOH (M)          Ethanol (v)
                           −1.41                 6.0              30.0              0.10              0.30
                            −1                  6.6               37.3              0.20              0.46
                             0                   8.0              55.0              0.45              0.85
                            +1                  9.4               72.7              0.70              1.24
                           +1.41                10.0              80.0              0.80              1.40
      Codification: V c = (V n − V 0 )/∆V n ; decodification: V n = V 0 + (∆V n × V c ); V c = codified value of the variable;
      ∆V n = increment of V n per unit of V c ; V n = natural value of the variable to codify; V 0 = natural value in the center
      of the domain.

     In the experiments of hydrolysis, shark skeletons were treated with a serine-type endoprotease
alcalase 2.4 L (Novozyme Nordisk, Bagsvaerd, Denmark) at enzyme/substrate ratio of 24 U/kg
(1% v/w of fresh skeleton) for 4 h, employing a mixture (solid:water) of 1:1, in each of T/pH conditions
summarized in Table 1, and maintaining continuous agitation of 200 rpm. These runs were carried out
in a 100 mL-pH-stat-reactor (Metrohm 902 Titrando, Metrohm Hispania, Madrid, Spain) equipped
with temperature and agitation control. At the end of hydrolysis, samples were centrifuged at 8000× g
for 20 min and the supernatants analyzed as described in Section 2.4.
     In the studies of the selective precipitation of CS, NaOH and EtOH were added to the enzyme
hydrolysates at the levels showed in Table 1, plus 2.5 g/L of NaCl in all cases. These mixtures were
continuously agitated at 100 rpm, under room temperature, for 2 h; subsequently sediments generated
after centrifugation (8000× g for 20 min) were re-suspended in water, neutralized using 6 M HCl
and analyzed by protocols defined in Section 2.4. Based on the optimal conditions defined by both
factorial designs (see results and discussion section), a larger amount of skeletons was processed
in order to: (1) confirm the validity of these experimental conditions and (2) to produce an enough
volume of impure CS solution for its final purification by membrane technology. For this scale-up of
the hydrolysis process, a 5 L pH-stat was utilized similar to those defined in a previous report [23].

2.3. Membrane Purification of CS
      For increasing the purity of the CS solutions obtained after chemical treatment, an ultrafiltration
membrane (UF) with a 30 kDa cut-off weight (spiral polyethersulfone, 0.56 m2 , Prep/Scale-TFF,
Millipore Corporation, Burlington, MA, USA) was used. The process was performed in a regimen of
full recirculation of retentate in two stages: (1) initially UF mode was applied for the concentration
of CS solution until a volumetric factor of concentration of 4 and maintaining a constant pressure
of 1 bar at a flow of 250–300 mL/min, and then (2) dialfiltration mode (DF) at a constant volume
(filtration flow = water intake flow) was chosen for the elimination of protein and salts [28] performing
at least 7–8 diavolumes. Samples from UF and DF steps were collected at different concentration
factors and diavolumes for protein and CS analysis. DF experimental trends were mathematically
modeled using an integrated first-order function, exponential Equation (3), [29]:

                                                       R = R f + R0 e−(1−s)D                                                       (3)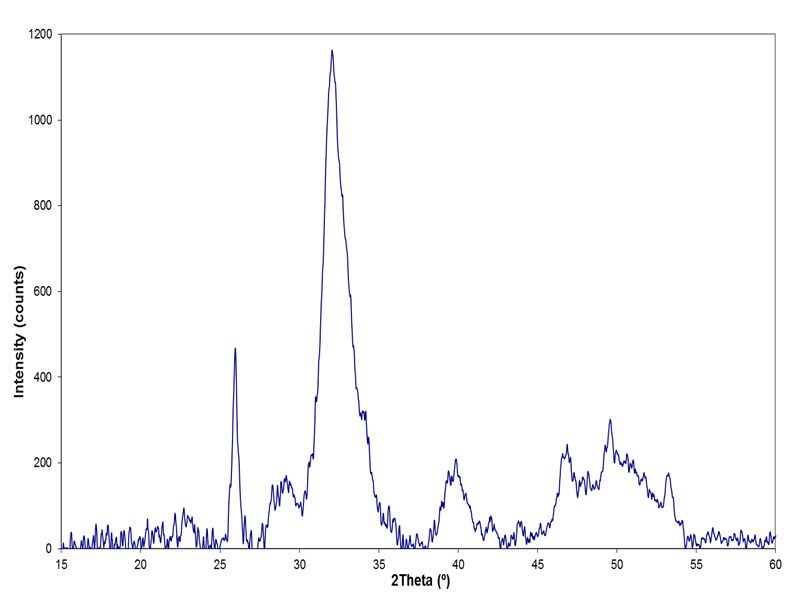
Polymers 2020, 12, 2613                                                                                 5 of 15

where R is the concentration of permeable CS or soluble protein in the retentate (% from the level at
initial DF), Rf the retentate concentration of CS or protein in the asymptotic phase (%), R0 the permeate
concentration (%), D the relative diavolume (volume of added water/constant retentate volume), and s
is the specific retention of CS or protein ranging from 0 (the solute is totally filtered) to 1 (the solute is
completely retained). At the end of diafiltration, pure CS solutions were dried in an oven at 60 ◦ C for
2 days.

2.4. Chemical Determinations and Biopolymer Characterization
      The content of total soluble proteins (Pr) was measured in all samples by the Lowry method [30]
and the presence of CS by hydroxydiphenyl protocol [31,32]. In addition, the purity in CS (Ip ) regarding
the protein content, calculated as Ip (%) = CS × 100/(CS + Pr), was also determined in all experiments.
      Absolute molecular weight of CS was determined by GPC (gel permeation chromatography)
with light scattering detection as previously described [33]. Briefly, an Agilent 1260 HPLC equipped
with a pump (G1311B), automatic injector (G1329B), column oven (G1316A), refractive index detector
(G1362A) and dual-angle static light scattering detector (G7800A) was used for chromatographic
separation of CS on a set of Suprema columns (PSS, Germany): precolumn (5 µm, 8 × 50 mm),
30Å (5 µm, 8 × 300 mm), 100Å (5 µm, 8 × 300 mm) and ultrahigh (10 µm, 8 × 300 mm). Temperature was
set to 30 ◦ C in the column oven and light scattering detector and to 40 ◦ C in the refractive index detector.
The mobile phase consisted of 0.1 M NaN3 and 0.01 M NaH2 PO4 at pH 6.6. PEO (polyethylene oxide)
standard and CS samples were dissolved in the mobile phase at 1 g/L and stirred overnight in an orbital
shaker at 200 rpm. A volume of 100 µL of standard and sample was injected onto the system and eluted
at 1 mL/min. A PEO standard of Mw 106 kDa and PDI (polydispersity index) 1.05 from PSS (Mainz,
Germany) was used to determine the instrumental constants of both detectors. Absolute molecular
weight estimations were made based on refractive index increments (dn/dc) calculated from the signal
of the refractive index detector.
      Disaccharide composition and purity of samples were studied by NMR and SAX-HPLC
(strong anion exchange chromatography) as previously described [33]. NMR spectra were recorded
at 600 MHz on a Bruker DPX 600 cooled down to 10 ◦ C, and analyzed with MestReNova 10.0.2
(Mestrelab Research, Santiago de Compostela, Spain). CS samples were dissolved in D2 O at 40 g/L.
For SAX-HPLC analysis CS samples were depolymerized with chondroitinase ABC (Proteus vulgaris,
EC 4.2.2.4., Sigma-Aldrich, Prod. No. C2905, St. Louis, MO, USA.) at 0.2 U enzyme mg−1 of
CS, pH 8 (0.05 M Tris-HCl:0.15 M NaAc), 37 ◦ C, for 24 h. At the end of the reaction the enzyme
was inactivated (70 ◦ C, 25 min), the samples were then centrifuged (12,857 g, 30 min) and filtered
through 0.2 µm polyethersulfone (PES) syringe filters. Quantification was made by external calibration
with unsaturated disaccharide standards (Grampenz, UK): GlcA-GalNAc 0S; GlcA-GalNAc 4S;
GlcA-GalNAc 6S; GlcA 2S-GalNAc 6S; GlcA-GalNAc 4,6S; and GlcA 2S-GalNAc 4S. The percentage
of each disaccharide unit was calculated as the mass proportion relative to the sum of all CS units
quantified. Chromatographic analysis was carried out in an Agilent 1200 HPLC system (Agilent,
Santa Clara, CA, USA) equipped with binary pump (G1312A), column oven (G1316A) and UV-vis
detector set to 232 nm (G1314B). A volume of 20 µl of standards and samples was injected into the
system and separated in a Waters Spherisorb SAX column (5 µm, 4.6 × 250 mm) at 1.5 mL min−1 .
Gradient elution was performed with 50 mM NaCl pH 4 (A) and 1.2 M NaCl pH 4 (B) under the
following program: From 0 to 5 min 100% A; from 5 to 25 min a linear gradient starting with 100% A
and ending with 76% A.
      Bioapatite was obtained by pyrolysis of crude bioapatite at 950 ◦ C for 12 h with heating ramp of
2 ◦ C/min and cooling ramp of 20 ◦ C/min to remove the organic matter (Figure 1). Physicochemical
characterization of crude bioapatite was performed by FT-Raman spectroscopy for evaluation of the
functional groups and X-Ray Diffraction (XRD) for structural measurements. Raman spectra were
collected in the range of 250 to 4000 cm−1 at a resolution of 4 cm−1 and 64 scans, using a FT-Raman Bruker
RFS100 (Bruker, Billerica, MA, USA) equipped with a Nd: neodymium-doped yttrium aluminum
Polymers 2020, 12, 2613                                                                                      6 of 15

garnet (YAG) laser of 1 W emitting 1064 nm radiation. XRD analysis was performed using a Philips
diffractometer, fitted with a PW1710 control unit, a PW1820/00 goniometer and an Enraf Nonius FR590
generator operating at 40 kV and 30 mA. The diffraction patterns were obtained for 10◦ < 2θ < 60◦
with a step size of 0.02◦ .

2.5. Numerical and Statistical Evaluations
     Response surfaces from second-order factorial designs and statistical analysis were calculated
in an Excel-spreadsheet (Microsoft Corporation, Redmond, WA, USA) constructed for this type of
evaluation. Numerical and statistical results were moreover confirmed by Statistica v. 8.0 software
(StatSoft, Inc, Tulsa, OK, USA). Data fitting of diafiltration-ultrafiltration (UF-DF) data were performed
by minimisation of the sum of quadratic differences between observed and model-predicted values,
using the non-linear least-squares (quasi-Newton) method provided by the macro ‘Solver’ of
the Excel-spreadsheet.

3. Results and Discussion

3.1. Production of CS from Blue Shark Skeletons
     Following the conditions summarized in Table 1, we performed a set of experiments to optimize
the joint effect of pH and T on alcalase’s capacity to digest the skeleton of blue shark. The dependent
variables were the concentration of CS obtained at the end of the hydrolysis and the index of the
purity of the samples. In both responses, all the coefficients were statistically significant (t-Student test,
α = 0.05) and quadratic terms for T2 and pH2 were negative (Table 2) conducting to convex shapes
(Figure 2a,b). The theoretical surfaces predicted by the polynomial equations showed clear maximum
points derivate from those convex forms. Correlation between experimental and predicted data for CS
and Ip , as R2 and R2 adj , notably had values of 0.882–0.893 and 0.798–0.816, respectively. Ratios F1 and
F2 from F-Fisher test validated the robustness of the equations (Table 2).

      Table 2. Polynomial equations describing the effect of T and pH on alcalase skeleton hydrolysis
      (CS isolation and Ip -index) and characterising the effect of NaOH (N) and EtOH (E) on the precipitation
      of previous hydrolysates. The coefficient of determination and adjusted determination (R2 and R2 adj ),
      F-values and optimal conditions of the independent variables are also shown. S: significant.

                               Skeletons Hydrolysis                                  Chemical Treatment
    Parameters                  CS                 Ip           Parameters           CS                 Ip
        b0                  4.44 ± 0.25       79.77 ± 2.57           b0         4.51 ± 0.20        89.08 ± 2.46
      b1 (T)                0.34 ± 0.20       4.14 ± 2.03         b1 (N)        0.28 ± 0.22       −5.86 ± 1.95
     b2 (pH)                0.61 ± 0.20       6.35 ± 2.03          b2 (E)       1.16 ± 0.22        17.90 ± 1.95
   b12 (T × pH)            −0.55 ± 0.28      −6.35 ± 1.46       b12 (N × E)     0.64 ± 0.32         9.13 ± 2.75
     b11 (T 2 )            −1.44 ± 0.21      −5.57 ± 2.87        b11 (N 2 )     −1.13 ± 0.24      −16.31 ± 2.09
    b22 (pH 2 )            −0.98 ± 0.21      −12.19 ± 2.87       b22 (E2 )      −1.09 ± 0.24      −16.86 ± 2.09
       R2   adj                 0.798              0.816          R2   adj          0.809               0.808
                                10.49              11.67                            11.17               11.11
         F1                                                         F1
                          [F57 = 3.97] ⇒ S   [F57 = 3.97] ⇒ S                 [F57 = 3.97] ⇒ S    [F57 = 3.97] ⇒ S
                                0.704              0.694                            0.699               0.702
        F2                                                          F2
                          [F85 = 4.82] ⇒ S   [F85 = 4.82] ⇒ S                 [F85 = 4.82] ⇒ S    [F85 = 4.82] ⇒ S
                                  CS                 Ip                               CS                  Ip
     Topt (◦ C)                  56.1               59.6        NaOHopt (M)          0.52                0.44
      pHopt                      8.42               8.27        EtOHopt (v)          1.09                1.05
       Ymax                    4.54 g/L            80.9%           Ymax            4.91 g/L             93.9%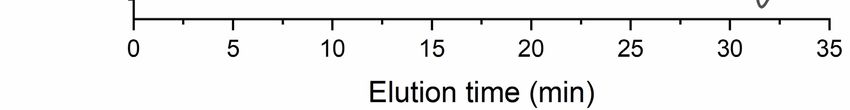
Polymers 2020, 12, 2613                                                                                                 7 of 15
      Polymers 2020, 12, x FOR PEER REVIEW                                                                       8 of 15

                                                    Skeletons Hydrolysis

                                      (a)                                             (b)
                                                    Chemical Treatment

                                      (c)                                             (d)
                                                     UF-DF Purification

                                      (e)                                              (f)

      FigureFigure  2. Top:
               2. Top:        Theoreticalsurfaces
                          Theoretical      surfacesobtained
                                                      obtained from
                                                               from the
                                                                     theequations
                                                                          equationsshown
                                                                                      shown in in
                                                                                               Table 1 defining
                                                                                                  Table           the the
                                                                                                         1 defining
            combined effect of pH and T on (a) chondroitin sulfate concentration (CS) and (b) CS purity (Ip).
      combined effect of pH and T on (a) chondroitin sulfate concentration (CS) and (b) CS purity (Ip ).
            Middle: theoretical surfaces also described by equations from Table 1 for the effect of NaOH and
      Middle: theoretical surfaces also described by equations from Table 1 for the effect of NaOH and
            ethanol concentration on CS (c) and Ip (d). Bottom: purification of CS samples by UF-DF at 30 kDa;
      ethanol concentration on CS (c) and Ip (d). Bottom: purification of CS samples by UF-DF at 30 kDa;
            (e), concentration of retained protein (○) and CS (●) in linear relation with the factor of volumetric
      (e), concentration    of retained protein (#) and CS (•) in linear relation with the factor of volumetric
            concentration (fc) and (f), progress of protein (○) and CS (●) retention with the increase in diavolume
      concentration   (fc) and
            from DF process (D).(f), Equation
                                     progress (3)of protein
                                                    was used(#)
                                                              to and CS (•)
                                                                 simulate theretention withdata.
                                                                               experimental  the increase  in are
                                                                                                  Error bars  diavolume
                                                                                                                  the
      from confidence
             DF process    (D). Equation
                        intervals (α = 0.05; (3)
                                              n = was
                                                  2). used to simulate the experimental data. Error bars are the
      confidence intervals (α = 0.05; n = 2).
Polymers 2020, 12, 2613                                                                              8 of 15

      The search of the T and pH values that maximize the purity and the amount of CS recovery was
made by numerical derivation: 56.1 ◦ C/pH 8.42 for CS and 59.6 ◦ C/pH 8.27 for Ip . The average value of
both conditions (57.9 ◦ C/pH 8.35) was selected for the next step of the selective precipitation of the
glycosaminoglycans. The purity of the sample reached in these levels was around 80% (presence of
GAGs in relation to proteins) and the concentration of CS of 4.6 g/L. These outcomes are in concordance
with the optimal values found for the hydrolysis of blue shark heads [28] and fins of small-spotted
catshark [27]. As expected, the concrete best conditions for alcalase were dependent on the type of fish
substrate employed [22,33,34].
      A larger hydrolysate of 4 L, produced in those optimal conditions (pH = 8.35, 57.9 ◦ C, t = 4 h,
agitation = 200 rpm, E/S ratio = 1%) and obtained after centrifuge separation of solid material
(all bioapatites was recovered in this stage), was used to study the process of selective precipitation
of CS by chemical reagents. The concentration ranges of alkaline-hydroalcoholic solutions applied
for this purpose followed the values reported in previous reports [28,33,34]: 0.1–0.8 M NaOH and
0.3–1.4 v of EtOH (Table 1).
      In Figure 2c,d, the predicted response surfaces for the alkaline-ethanolic treatment of the
hydrolysates are depicted. Once again, the surface trends and the second order equations were
similar: all coefficients were statistically significant, including linear, mixed (N × E) and quadratic
terms, and the latter are always negative (Table 3). The correlation among experimental and simulated
data was also remarkable R2 = 0.888–0.889 and R2 adj = 0.808–0.809, and the consistency of equations
was confirmed after overcoming both ratios from F-Fisher tests. Optimal conditions for Ip and CS
responses were quite closed: 0.44–0.52 M NaOH and 1.05–1.09 v of EtOH. From these data, and using
the same compromise option defined in the previous factorial experiments, the best global values
are 0.48 M/1.07 v. The concentration of CS isolated under those conditions was around 4.9 g/L with
a 93% purity. This chemical step improved the purity of CS by more than 10% in comparison with the
CS liberated from enzyme hydrolysis.

     Table 3. Molecular weight and disaccharide composition of CS from P. glauca. Mn : number average
     molecular weight, PDI: polydispersity index (Mw /Mn ); Disaccharide composition expressed as mean
     % ± standard deviation (n = 2).

                          Parameters and Dissacharides                  Values
                                      Mn                                 58 kDa
                                      PDI                                 1.16
                            CS-A (GlcA-GalNAc 4S)2                    15.97 ± 1.83
                            CS-C (GlcA-GalNAc 6S)2                    64.72 ± 1.22
                            CS-0 (GlcA-GalNAc 0S)2                     6.33 ± 1.86
                           CS-D (GlcA 2S-GalNAc 6S)2                  12.23 ± 0.90
                           CS-E (GlcA-GalNAc 4,6S)2                    0.38 ± 0.09
                           CS-B (GlcA 2S-GalNAc 4S)2                   0.36 ± 0.27

      In a similar way, CS from wastes of small-spotted catshark, chimera and blackmouth catshark
were adequately recovered in the range of 0.45–0.65 M of alkalis and 1.0–1.4 v of ethanol, increasing in
all cases the purity of the solutions generated in the previous hydrolysis [28,34].
      For the purification by membranes, a high solution of impure CS was produced on the conditions
of hydrolysis (pH = 8.35, 57.9 ◦ C, t = 4 h, agitation = 200 rpm, E/S ratio = 1%) and chemical treatment
(0.48 M of NaOH/1.07 v of EtOH) previously optimized. This solution of CS, with a 93–94% of
purity, was processed by ultrafiltration membrane (UF-30 kDa cut-off) with the aim to improve this
value, removing peptides and short proteins throughout the membrane pores. Experimental data
of concentration factors for protein retentates display null correlation with the simulated values,
revealing low protein retention (Figure 2e). Conversely, the agreement between experimental and
predicted data for CS was accurate, describing a complete retention of the biopolymer. Both tendencies
were confirmed in the next diafiltration (DF) experiments where CS was fully retained and protein
Polymers 2020, 12, 2613                                                                            9 of 15

almost completely filtrated after more than 6 diavolumes. The flow of permeates, under constant
transmembrane pressure of 1 bar, was 279 ± 23 mL/min. Experimental data of DF for CS and protein
were adequately modelled by exponential Equation (3) with R2 > 0.985 in both cases. The values of the
specific retention (s) from that mathematical model were of 0.974 ± 0.123 for CS and 0.571 ± 0.103 for
protein, indicating high and low retention of CS and protein, respectively.
      Retentates dried in the oven showed a purity in CS of 96.9 ± 0.5% and very low concentration of
salts (
Polymers 2020, 12,
Polymers 2020, 12, 2613
                   x FOR PEER REVIEW                                                                                   10 of
                                                                                                                      10  of 15
                                                                                                                             15

                            (a)                                                             (b)

                            (c)                                                             (d)
     Figure 3.
     Figure    3. (a)—Gel
                   (a)—GelPermeation
                              PermeationChromatography
                                            Chromatography     (GPC)
                                                                 (GPC)eluograms
                                                                         eluograms of CS  extracted
                                                                                       of CS         fromfrom
                                                                                              extracted    P. glauca.  Red
                                                                                                                P. glauca.
     line: line:
     Red   right right
                    angle angle
                           light scattering   signal signal
                                  light scattering   (RALS);    Blue line:
                                                             (RALS);   Bluelow  angle
                                                                             line:  lowlight  scattering
                                                                                          angle           signal (RALS);
                                                                                                 light scattering   signal
     Black   line:  refractive  index   (RID)  signal; AU:   arbitrary units.  (b)—SAX-HPLC        chromatogram
     (RALS); Black line: refractive index (RID) signal; AU: arbitrary units. (b)—SAX-HPLC chromatogram               of CS
     from   from    P. glauca   after enzymatic   digestion   with  chondroitinase    ABC.  0: ΔUA-GalNAc;
     of CS from from P. glauca after enzymatic digestion with chondroitinase ABC. 0: ∆UA-GalNAc;                 A:  ΔUA-
     GalNAc(4S);
     A: ∆UA-GalNAc(4S);C: ΔUA-GalNAc(6S);       D: ΔUA(2S)-GalNAc(6S).
                                 C: ∆UA-GalNAc(6S);                           Full 1H NMR
                                                           D: ∆UA(2S)-GalNAc(6S).       Full 1with
                                                                                               H NMRexpansion    of region
                                                                                                         with expansion
     with
     of     CS signals
        region    with CS (c)signals
                              and HSQC     (d) HSQC
                                      (c) and  spectra(d)
                                                        of spectra
                                                           CS extracted
                                                                   of CSfrom    P. glauca
                                                                           extracted            2O recorded
                                                                                      frominP.Dglauca         at recorded
                                                                                                        in D2 O   10 °C.
     at 10 ◦ C.
      Table 3. Molecular weight and disaccharide composition of CS from P. glauca. Mn: number average
     NMR     spectra
      molecular      allows
                weight, PDI: unequivocal
                             polydispersityidentification
                                            index (Mw/Mn);of CS (Figurecomposition
                                                           Disaccharide 3c,d), with expressed
                                                                                     characteristic signals
                                                                                              as mean
at 2.06 ppm corresponding to acetyl protons in GalNAc, and typical overlapping of ring protons
      % ± standard deviation (n = 2).
between 3–5 ppm. Assignment of some signals in this region is possible thanks to the HSQC spectrum
                               Parameters and Dissacharides         Values
(Figure 3d), such as those corresponding to the overlapping anomeric carbons of GalNAc and GlcA at
                                             Mn                     58 kDa
4.55 ppm and sulfation in carbon 6 of GalNAc, typical of shark CS [52,53]. Contamination with other
                                             PDI                      1.16
glycosaminoglycans common in CS samples seems unlikely         due to a lack of typical signals of keratan
                                  CS-A (GlcA-GalNAc 4S)  2       15.97 ± 1.83
sulfate (H1 of GlcNAc at 4.71 ppm) or dermatan sulfate       (H1 and H2 of IdoA at 4.87 and 3.52 ppm
                                  CS-C (GlcA-GalNAc 6S)2         64.72 ± 1.22
respectively) [54]. However, several unidentified signals    appear between 5 and 6.2 ppm, as well as
                                   CS-0 (GlcA-GalNAc 0S)2         6.33 ± 1.86
a signal at 8.1 ppm possibly corresponding to aromatic 2amino acids. In all cases, its low intensity
                                 CS-D (GlcA 2S-GalNAc 6S)        12.23 ± 0.90
suggests minute contamination.
                                 CS-E (GlcA-GalNAc 4,6S)2         0.38 ± 0.09
     Disaccharide analysis by SAX-HPLC (Figure 3b) reveals    that the majority of units are monosulfated
                                 CS-B (GlcA 2S-GalNAc 4S)  2      0.36 ± 0.27
in positions 6 and 4 of GalNAc (64.7% and 16% respectively), followed by disulfated D-units
(GlcA 2S-GalNAc 6S) at 12.2% and non-sulfated at 6.3%. Other disulfated units are present only
3.3. Bioapatite Characterization
in minute amounts (Table 3). These results are in agreement with the composition of other CS
      The from
samples    analysis of crude
                 P. glauca   bioapatitereported
                           previously   through FT-Raman   spectroscopy (Figure
                                                 (10–13% GlcA-GalNAc               4a) shows
                                                                           4S, 64–68%         the presence
                                                                                        GlcA-GalNAc     6S,
of peaks   associated  with mineral  phases of calcium
7%–16% GlcA-GalNAc 0S, 9–11% GlcA 2S-GalNAc 6S) [8,48].phosphate,   with an  intense and   narrow  band  at
960 cm corresponding to PO4 symmetric stretching bonds, as well as the peaks at 1079 and 1048
        −1                        3−
Polymers 2020, 12, 2613 11 of 15
3.3. Bioapatite Characterization
The analysis of crude bioapatite through FT-Raman spectroscopy (Figure 4a) shows the presence
of peaks associated with mineral phases of calcium phosphate, with an intense and narrow
Polymers 2020, 12, x FOR PEER REVIEW
band
11 of 15
−1 3−
at 960 cm corresponding to PO4 symmetric stretching bonds, as well as the peaks at 1079 and
1048 −1 for 3− asymmetric stretching, 428 and 445 −1 of symmetric bending modes, and 578,
cm−1 cmfor PO 43− PO
asymmetric
4 stretching, 428 and 445 cm−1 cm of symmetric bending modes, and 578, 582
582 and −1 3−
and 606 606
cm−1cm assigned
assigned to asymmetric
to asymmetric bending
bending of POof 4PO
3− bonds
4 bonds
[55].[55].
RamanRaman spectrum
spectrum alsoalso reveal
reveal the
the presence
presence of vibrational
of vibrational modesmodes associated
associated withwith organic
organic compounds
compounds in theinrange
the range 1200–3050
1200–3050 cm−1 ,
cm−1, being
being the peaks located at 1270, −1 attributed to amide III, CH groups and amide I,
the peaks located at 1270, 14491449
andand 1667
1667 cmcm
−1 attributed to amide III, CH2 groups
2 and amide I,
respectively [56]. The broad
broad band −1 is associated to C–H stretching modes of amide
respectively [56]. The band at
at 2850–3050
2850–3050 cm
cm−1 is associated to C–H stretching modes of amide
III in
III in proteins
proteins andand lipids
lipids [55].
[55].
0,6
0,5
PO43- strech
CH2 strech
0,4
Raman intensity (a.u.)
0,3
0,2
PO43- bend CH2
amide III amide I
0,1
0
200 700 1.200 1.700 2.200 2.700 3.200
Raman shift (cm-1)
(a) (b)
Figure 4. Raman
Figure spectrum
4. Raman (a) and(a)
spectrum XRD
andpattern (b) of crude
XRD pattern (b) ofbioapatites extractedextracted
crude bioapatites from thefrom
central
theskeleton
central
of blue shark (P. glauca).
skeleton of blue shark (P. glauca).
The presence of calcium phosphate compounds compounds was was confirmed
confirmed with with XRDXRD analysis
analysis (Figure
(Figure 4b).
4b).
The diffraction pattern corresponds to a mineralized tissue which has a percentage of inorganic
components consisting
consisting of salts embedded in an organic matrix. The pattern shows the main peaks
◦ , 29.24◦ , 32.06◦ , 34.18◦ , 39.92◦ , 49.59◦ , and 53.18◦ , which are
located at positions 25.94
25.94°, 29.24°, 32.06°, 34.18°, 39.92°, 49.59°, and 53.18°, which are characteristic of
hydroxyapatite [Ca55(PO(PO44))33(OH)],
(OH)],corresponding,
corresponding,respectively,
respectively, to to (0,0,2),
(0,0,2), (1,2,0),
(1,2,0), (2,1,1),
(2,1,1), (2,0,2),
(2,0,2), (3,1,0),
(3,1,0),
(2,1,3), and (0,0,4) diffraction planes [55]. Broad reflection bands characteristic of mineralized tissues
exhibit poor resolution which hinders the accurate identification and quantification of apatite and
non-apatite crystalline phases of the mineral compounds.
4. Conclusions
4. Conclusions
The optimal
The optimalrecovery
recoveryofofCS CSand
and bioapatites
bioapatites from
from skeleton
skeleton wastes
wastes of blue
of blue sharkshark was studied
was studied here.
The three main processes involved (enzyme hydrolysis, chemical treatment and membrane
here. The three main processes involved (enzyme hydrolysis, chemical treatment and membrane
purification)
purification) were
wereoptimized
optimized using response
using surfacesurface
response methodology and non-linear
methodology function modelling.
and non-linear function
Thus, the isolation of CS and bioapatite was maximized by alcalase hydrolysis of
modelling. Thus, the isolation of CS and bioapatite was maximized by alcalase hydrolysis of skeletonskeleton at 1% (v/w)
of enzyme, pH 8.35, 58 ◦ C for 4 h. Then, increasing of CS purity from hydrolysates were defined
at 1% (v/w) of enzyme, pH 8.35, 58 °C for 4 h. Then, increasing of CS purity from hydrolysates were
by alkaline-hydroalcoholic
defined saline treatment
by alkaline-hydroalcoholic with 0.48
saline treatment withM0.48 NaOH,
M NaOH, 1.07 v1.07
EtOH and and
v EtOH NaCl 2.5 g/L.
NaCl 2.5
Combining UF and DF operation modes, employing a membrane of 30 kDa
g/L. Combining UF and DF operation modes, employing a membrane of 30 kDa cut-off weight, CS cut-off weight, CS was
purified up to
was purified upIpto=I97% after
p = 97% adding
after adding6–7 diavolumes
6–7 diavolumes ofofdistilled
distilledwater.
water.The
Thesize
sizeof
of this
this biopolymer
biopolymer
was
was 58 kDa as the number average molecular weight (Mn) and the sulfation pattern indicated the
58 kDa as the number average molecular weight (M n ) and the sulfation pattern indicated the
predominance
predominance of of dissacharides
dissacharidessulphated
sulphatedininC6 C6(4S/6S
(4S/6Sratio
ratio of of 0.25)
0.25) with
with thethe presence
presence of GlcA
of GlcA 2S-
2S-GalNAc
GalNAc 6S 6S (12%)
(12%) andand6%6%of of unsulfated
unsulfated disaccharides.The
disaccharides. Theanalysis
analysisofofcrude
crudebioapatite
bioapatitebyby FT-Raman
FT-Raman
and XRD
and XRDtechniques
techniques confirms the presence
confirms of hydroxyapatite
the presence compounds
of hydroxyapatite [Ca5 (PO4 )3 (OH)]
compounds embedded
[Ca5(PO 4)3(OH)]
embedded in an organic matrix. The central skeleton of blue shark is a promising new marine for
in an organic matrix. The central skeleton of blue shark is a promising new marine source the
source
for the extraction of high value ceramic biomaterials. Further experiments must be performed to
validate the capacity of these CS and bioapatites to be included in scaffolds, composites or
nanodevices for the regeneration of cartilaginous and bone tissues.Polymers 2020, 12, 2613 12 of 15
extraction of high value ceramic biomaterials. Further experiments must be performed to validate the
capacity of these CS and bioapatites to be included in scaffolds, composites or nanodevices for the
regeneration of cartilaginous and bone tissues.
Author Contributions: Conceptualization J.A.V., J.F., P.G., J.S. and J.V.; formal analysis, J.A.V., P.G., J.S. and J.V.;
investigation, J.A.V., J.F., P.G., J.S. and J.V.; resources, J.A.V. and P.G.; data curation, J.A.V., J.F., P.G. and J.V.;
writing—original draft preparation, J.A.V. and J.V.; writing—review and editing, J.A.V., P.G. and J.S.; supervision,
J.A.V.; project administration, J.A.V., P.G. and J.S.; funding acquisition, J.A.V., P.G. and J.S. All authors have read
and agreed to the published version of the manuscript.
Funding: This research was funded by projects IBEROS (0245_IBEROS_1_E, POCTEP 2015), CVMar+i
(0302_CVMAR_I_1_P, POCTEP 2015), BLUEHUMAN (EAPA_151/2016, UE-INTERREG Atlantic Area Programme),
Xunta de Galicia (Grupos de Potencial Crecimiento, IN607B 2018/19), and support of the publication fee by the
CSIC Open Access Publication Support Initiative through its Unit of Information Resources for Research (URICI).
Conflicts of Interest: The authors declare no conflict of interest.
References
1. Blanco, M.; Sotelo, C.G.; Chapela, M.J.; Pérez-Martín, R.I. Towards sustainable and efficient use of fishery
resources: Present and future trends. Trends Food Sci. Technol. 2007, 18, 29–36. [CrossRef]
2. Vázquez, J.A.; Durán, A.I.; Menduíña, A.; Nogueira, M.; Fraguas, J.; Mirón, J.; Valcárcel, J. Tailor-made process
to recover high added value compounds from fishery by-products. In Green Extraction and Valorization of
By-Products from Food Processing; CRC Press: Boca Raton, FL, USA, 2019; pp. 91–140.
3. Grosso, C.; Valentão, P.; Ferreres, F.; Andrade, P.B. Bioactive marine drugs and marine biomaterials for brain
diseases. Mar. Drugs 2014, 12, 2539–2589. [CrossRef] [PubMed]
4. Venkatesan, J.; Kim, S.-K. Marine biomaterials. In Springer Handbook of Marine Biotechnology; Kim, S.-K., Ed.;
Springer: Berlin/Heidelberg, Germany, 2015; pp. 1195–1215.
5. Zhang, C.; Li, X.; Kim, S.-K. Application of marine biomaterials for nutraceuticals and functional foods.
Food Sci. Biotechol. 2012, 21, 625–631. [CrossRef]
6. De Iuliis, G.; Pulerà, D. The Shark. In Dissection of Vertebrates, 3rd ed.; Academic Press: Cambridge, MA,
USA, 2019; Chapter 3; Section 1; pp. 53–109. ISBN 9780124104600.
7. López-Álvarez, M.; Pérez-Davila, S.; Rodríguez-Valencia, C.; González, P.; Serra, J. The improved biological
response of shark tooth bioapatites in a comparative in vitro study with synthetic and bovine bone grafts.
Biomed. Mater. 2016, 11, 035011. [CrossRef] [PubMed]
8. López-Álvarez, M.; González, P.; Serra, J.; Fraguas, J.; Valcarcel, J.; Vázquez, J.A. Chondroitin sulfate and
hydroxyapatite from Prionace glauca shark jaw: Physicochemical and structural characterization. Int. J.
Biol. Macromol. 2020, 156, 329–339. [CrossRef] [PubMed]
9. Valcarcel, J.; Novoa-Carballal, R.; Pérez-Martín, R.I.; Reis, R.L.; Vázquez, J.A. Glycosaminoglycans from
marine sources as therapeutic agents. Biotechnol. Adv. 2017, 35, 711–725. [CrossRef]
10. Yamada, S.; Sugahara, K. Potential therapeutic application of chondroitin sulfate/dermatan sulfate. Curr. Drug
Discov. Technol. 2008, 5, 289–301. [CrossRef]
11. Celikkin, N.; Rinoldi, C.; Costantini, M.; Trombetta, M.; Rainer, A.; Świ˛eszkowski, W. Naturally derived
proteins and glycosaminoglycan scaffolds for tissue engineering applications. Mater. Sci. Eng. C 2017,
78, 1277–1299. [CrossRef]
12. Lima, M.; Rudd, T.; Yates, E. New applications of heparin and other glycosaminoglycans. Molecules 2017,
22, 749. [CrossRef]
13. Pomin, V.H. A dilemma in the glycosaminoglycan-based therapy: Synthetic or naturally unique molecules?
Med. Res. Rev. 2015, 35, 1195–1219. [CrossRef]
14. Murugan, S.; Sugahara, K.N.; Lee, C.M.; ten Dam, G.B.; van Kuppevelt, T.H.; Miyasaka, M.; Yamada, S.;
Sugahara, K. Involvement of chondroitin sulfate E in the liver tumor focal formation of murine osteosarcoma
cells. Glycobiology 2009, 19, 735–742. [CrossRef]
15. Pomin, V.H. Holothurian fucosylated chondroitin sulfate. Mar. Drugs 2014, 12, 232–254. [CrossRef]
16. Chen, W.-C.; Wei, Y.-H.; Chu, I.M.; Yao, C.-L. Effect of chondroitin sulphate C on the in vitro and in vivo
chondrogenesis of mesenchymal stem cells in crosslinked type II collagen scaffolds. J. Tissue Eng. Regen. Med.
2013, 7, 665–672. [CrossRef]Polymers 2020, 12, 2613 13 of 15
17. da Costa, D.S.; Reis, R.L.; Pashkuleva, I. Sulfation of glycosaminoglycans and its implications in human
health and disorders. Annu. Rev. Biomed. Eng. 2017, 19, 1–26. [CrossRef]
18. Nandini, C.D.; Mikami, T.; Ohta, M.; Itoh, N.; Akiyama-Nambu, F.; Sugahara, K. Structural and functional
characterization of oversulfated chondroitin sulfate/dermatan sulfate hybrid chains from the notochord of
hagfish: Neuritogenic and binding activities for growth factors and neurotrophic factors. J. Biol. Chem. 2004,
279, 50799–50809. [CrossRef] [PubMed]
19. López-Senra, E.; Casal-Beiroa, P.; López-Álvarez, M.; Serra, J.; González, P.; Valcarcel, J.; Vázquez, J.A.;
Burguera, E.F.; Blanco, F.J.; Magalhães, J. Impact of prevalence ratios of chondroitin sulfate (CS)- 4 and
-6 isomers derived from marine sources in cell proliferation and chondrogenic differentiation processes.
Mar. Drugs 2020, 18, 94. [CrossRef]
20. Antelo, L.T.; de Hijas-Liste, G.M.; Franco-Uría, A.; Alonso, A.A.; Pérez-Martín, R.I. Optimisation of processing
routes for a marine biorefinery. J. Clean. Prod. 2015, 104, 489–501. [CrossRef]
21. Seghetta, M.; Hou, X.; Bastianoni, S.; Bjerre, A.-B.; Thomsen, M. Life cycle assessment of macroalgal
biorefinery for the production of ethanol, proteins and fertilizers—A step towards a regenerative bioeconomy.
J. Clean. Prod. 2016, 137, 1158–1169. [CrossRef]
22. Vázquez, J.A.; Ramos, P.; Valcarcel, J.; Antelo, L.T.; Novoa-Carballal, R.; Reis, R.L.; Pérez-Martín, R.I. An integral
and sustainable valorisation strategy of squid pen by-products. J. Clean. Prod. 2018, 201, 207–218. [CrossRef]
23. Vázquez, J.A.; Fraguas, J.; Mirón, J.; Valcárcel, J.; Pérez-Martín, R.I.; Antelo, L.T. Valorisation of fish discards
assisted by enzymatic hydrolysis and microbial bioconversion: Lab and pilot plant studies and preliminary
sustainability evaluation. J. Clean. Prod. 2020, 246, 119027. [CrossRef]
24. Vázquez, J.A.; Noriega, D.; Ramos, P.; Valcarcel, J.; Novoa-Carballal, R.; Pastrana, L.; Reis, R.L.;
Pérez-Martín, R.I. Optimization of high purity chitin and chitosan production from Illex argentinus pens by
a combination of enzymatic and chemical processes. Carbohydr. Polym. 2017, 174, 262–272. [CrossRef]
25. Murado, M.A.; Montemayor, M.I.; Cabo, M.L.; Vázquez, J.A.; González, M.P. Optimization of extraction and
purification process of hyaluronic acid from fish eyeball. Food Bioprod. Process. 2012, 90, 491–498. [CrossRef]
26. Box, G.E.; Hunter, J.S.; Hunter, W.G. Statistics for Experimenters: Design, Innovation, and Discovery;
Wiley-Interscience: New York, NY, USA, 2005; Volume 2.
27. Blanco, M.; Fraguas, J.; Sotelo, C.G.; Pérez-Martín, R.I.; Vázquez, J.A. Production of Chondroitin Sulphate
from Head, Skeleton and Fins of Scyliorhinus canicula By-Products by Combination of Enzymatic,
Chemical Precipitation and Ultrafiltration Methodologies. Mar. Drugs 2015, 13, 3287–3308. [CrossRef]
28. Vázquez, J.A.; Blanco, M.; Fraguas, J.; Pastrana, L.; Pérez-Martín, R. Optimisation of the extraction and
purification of chondroitin sulphate from head by-products of Prionace glauca by environmental friendly
processes. Food Chem. 2016, 198, 28–35. [CrossRef]
29. Amado, I.R.; Vázquez, J.A.; González, M.P.; Murado, M.A. Production of antihypertensive and antioxidant
activities by enzymatic hydrolysis of protein concentrates recovered by ultrafiltration from cuttlefish
processing wastewaters. Biochem. Eng. J. 2013, 76, 43–54. [CrossRef]
30. Lowry, O.H.; Rosebrough, N.J.; Farr, A.L.; Randall, R.J. Protein measurement with the Folin phenol reagent.
J. Biol. Chem. 1951, 193, 265–275.
31. van den Hoogen, B.M.; van Weeren, P.R.; Lopes-Cardozo, M.; van Golde, L.M.G.; Barneveld, A.;
van de Lest, C.H. A microtiter plate assay for the determination of uronic acids. Anal. Biochem. 1998,
257, 107–111. [CrossRef] [PubMed]
32. Murado, M.A.; Vázquez, J.A.; Montemayor, M.I.; Cabo, M.L.; González, M.P. Two mathematical models
for the correction of carbohydrate and protein interference in the determination of uronic acids by the
m-hydroxydiphenyl method. Biotechnol. Appl. Biochem. 2005, 41, 209–216. [CrossRef]
33. Vázquez, J.A.; Fraguas, J.; Novoa-Carballal, R.; Reis, R.L.; Pérez-Martín, R.I.; Valcarcel, J. Optimal isolation
and characterisation of chondroitin sulfate from rabbit fish (Chimaera monstrosa). Carbohydr. Polym. 2019, 210,
302–313. [CrossRef] [PubMed]
34. Vázquez, J.A.; Fraguas, J.; Novoa-Carvallal, R.; Reis, R.; Antelo, L.T.; Pérez-Martín, R.I.; Valcarcel, J.
Isolation and chemical characterization of chondroitin sulfate from cartilage by-products of Blackmouth
Catshark (Galeus melastomus). Mar. Drugs 2018, 16, 344. [CrossRef]
35. Vázquez, J.A.; Rodríguez-Amado, I.; Montemayor, M.I.; Fraguas, J.; González, M.D.P.; Murado, M.A.
Chondroitin sulfate, hyaluronic acid and chitin/chitosan production using marine waste sources: Characteristics,
applications and eco-friendly processes: A review. Mar. Drugs 2013, 11, 747–774. [CrossRef] [PubMed]Polymers 2020, 12, 2613 14 of 15
36. Murado, M.A.; Fraguas, J.; Montemayor, M.I.; Vázquez, J.A.; González, P. Preparation of highly purified
chondroitin sulphate from skate (Raja clavata) cartilage by-products. Process optimization including a new
procedure of alkaline hydroalcoholic hydrolysis. Biochem. Eng. J. 2010, 49, 126–132. [CrossRef]
37. Higashi, K.; Takeuchi, Y.; Mukuno, A.; Tomitori, H.; Miya, M.; Linhardt, R.J.; Toida, T. Composition of
glycosaminoglycans in elasmobranchs including several deep-sea sharks: Identification of chondroitin/dermatan
sulfate from the dried fins of Isurus oxyrinchus and Prionace glauca. PLoS ONE 2015, 10, e0120860. [CrossRef]
38. Souza, A.R.C.; Kozlowski, E.O.; Cerqueira, V.R.; Castelo-Branco, M.T.L.; Costa, M.L.; Pavão, M.S.G.
Chondroitin sulfate and keratan sulfate are the major glycosaminoglycans present in the adult zebrafish
Danio rerio (Chordata-Cyprinidae). Glycoconj. J. 2007, 24, 521–530. [CrossRef]
39. Xie, J.; Ye, H.; Luo, X. An efficient preparation of chondroitin sulfate and collagen peptides from shark
cartilage. Int. Food Res. J. 2014, 21, 1171–1175.
40. Arima, K.; Fujita, H.; Toita, R.; Imazu-Okada, A.; Tsutsumishita-Nakai, N.; Takeda, N.; Nakao, Y.; Wang, H.;
Kawano, M.; Matsushita, K.; et al. Amounts and compositional analysis of glycosaminoglycans in the tissue
of fish. Carbohydr. Res. 2013, 366, 25–32. [CrossRef]
41. Maccari, F.; Galeotti, F.; Volpi, N. Isolation and structural characterization of chondroitin sulfate from bony
fishes. Carbohydr. Polym. 2015, 129, 143–147. [CrossRef]
42. Takeda, N.; Horai, S.; Tamura, J.-I. Facile analysis of contents and compositions of the chondroitin
sulfate/dermatan sulfate hybrid chain in shark and ray tissues. Carbohydr. Res. 2016, 424, 54–58. [CrossRef]
43. Reginster, J.-Y.; Cooper, C.; Hochberg, M.; Pelletier, J.-P.; Rizzoli, R.; Kanis, J.; Abadie, E.; Maheu, E.;
Brandi, M.L.; Devogelaer, J.P.; et al. Comments on the discordant recommendations for the use of symptomatic
slow-acting drugs in knee osteoarthritis. Curr. Med. Res. Opin. 2015, 31, 1041–1045. [CrossRef] [PubMed]
44. Volpi, N. Quality of different chondroitin sulfate preparations in relation to their therapeutic activity.
J. Pharm. Pharmacol. 2009, 61, 1271–1280. [CrossRef]
45. da Cunha, A.L.; de Oliveira, L.G.; Maia, L.F.; de Oliveira, L.F.C.; Michelacci, Y.M.; de Aguiar, J.A.K.
Pharmaceutical grade chondroitin sulfate: Structural analysis and identification of contaminants in different
commercial preparations. Carbohydr. Polym. 2015, 134, 300–308. [CrossRef]
46. Martel-Pelletier, J.; Farran, A.; Montell, E.; Vergés, J.; Pelletier, J.-P. Discrepancies in composition and biological
effects of different formulations of chondroitin sulfate. Molecules 2015, 20, 4277–4289. [CrossRef] [PubMed]
47. Nandini, C.D.; Itoh, N.; Sugahara, K. Novel 70-kDa Chondroitin Sulfate/Dermatan Sulfate Hybrid Chains
with a Unique Heterogenous Sulfation Pattern from Shark Skin, Which Exhibit Neuritogenic Activity and
Binding Activities for Growth Factors and Neurotrophic Factors. J. Biol. Chem. 2005, 280, 4058–4069.
[CrossRef] [PubMed]
48. Novoa-Carballal, R.; Pérez-Martín, R.I.; Blanco, M.; Sotelo, C.G.; Fassini, D.; Nunes, C.; Coimbra, M.A.; Silva, T.H.;
Reis, R.L.; Vázquez, J.A. By-products of Scyliorhinus canicula, Prionace glauca and Raja clavata: A valuable source
of predominantly 6S sulfated chondroitin sulfate. Carbohydr. Polym. 2017, 157, 31–37. [CrossRef]
49. Bertini, S.; Bisio, A.; Torri, G.; Bensi, D.; Terbojevich, M. Molecular weight determination of heparin and
dermatan sulfate by size exclusion chromatography with a triple detector array. Biomacromolecules 2005,
6, 168–173. [CrossRef]
50. Lamarque, G.; Lucas, J.-M.; Viton, C.; Domard, A. Physicochemical behavior of homogeneous series of
acetylated chitosans in aqueous solution: Role of various structural parameters. Biomacromolecules 2005,
6, 131–142. [CrossRef] [PubMed]
51. Ottøy, M.H.; Vårum, K.M.; Christensen, B.E.; Anthonsen, M.W.; Smidsrød, O. Preparative and analytical
size-exclusion chromatography of chitosans. Carbohydr. Polym. 1996, 31, 253–261. [CrossRef]
52. López-Álvarez, M.; López-Senra, E.; Valcárcel, J.; Vázquez, J.A.; Serra, J.; González, P. Quantitative evaluation
of sulfation position prevalence in chondroitin sulphate by Raman spectroscopy. J. Raman Spectrosc. 2019,
50, 656–664. [CrossRef]
53. Krylov, V.B.; Grachev, A.A.; Ustyuzhanina, N.E.; Ushakova, N.A.; Preobrazhenskaya, M.E.; Kozlova, N.I.;
Portsel, M.N.; Konovalova, I.N.; Novikov, V.Y.; Siebert, H.-C.; et al. Preliminary structural characterization,
anti-inflammatory and anticoagulant activities of chondroitin sulfates from marine fish cartilage.
Russ. Chem. Bull. 2011, 60, 746. [CrossRef]
54. Pomin, V.H. NMR chemical shifts in structural biology of glycosaminoglycans. Anal. Chem. 2013,
86, 65–94; [CrossRef]Polymers 2020, 12, 2613 15 of 15
55. Aguiar, H.; Chiussi, S.; López-Álvarez, M.; González, P.; Serra, J. Structural characterization of bioceramics
and mineralized tissues based on Raman and XRD techniques. Ceram. Int. 2018, 44, 495–504. [CrossRef]
56. Valdés, R.; Stefanov, S.; Chiussi, S.; López-Alvarez, M.; González, P. Pilot research on the evaluation and
detection of head and neck squamous cell carcinoma by Raman spectroscopy. J. Raman Spectrosc. 2014,
45, 550–557. [CrossRef]
Publisher’s Note: MDPI stays neutral with regard to jurisdictional claims in published maps and institutional
affiliations.
© 2020 by the authors. Licensee MDPI, Basel, Switzerland. This article is an open access
article distributed under the terms and conditions of the Creative Commons Attribution
(CC BY) license (http://creativecommons.org/licenses/by/4.0/).You can also read