Structural, Morphological and Thermal Properties of Cellulose Nanofibers from Napier fiber (Pennisetum purpureum) - MDPI
←
→
Page content transcription
If your browser does not render page correctly, please read the page content below
materials
Article
Structural, Morphological and Thermal Properties of
Cellulose Nanofibers from Napier fiber
(Pennisetum purpureum)
Revati Radakisnin 1,2 , Mohd Shukry Abdul Majid 1, * , Mohd Ridzuan Mohd Jamir 1 ,
Mohammad Jawaid 3 , Mohamed Thariq Hameed Sultan 3,4,5, * and Mohd Faizal Mat Tahir 6
 1   Faculty of Mechanical Engineering Technology, Universiti Malaysia Perlis (UniMAP), Pauh Putra Campus,
     Arau, Perlis 02600, Malaysia; revark_1990@yahoo.com (R.R.); ridzuanjamir@unimap.edu.my (M.R.M.J.)
 2   Faculty of Electronic Engineering Technology, Universiti Malaysia Perlis (UniMAP), Pauh Putra Campus,
     Arau, Perlis 02600, Malaysia
 3   Laboratory of Biocomposite Technology, Institute of Tropical Forestry and Forest Products (INTROP),
     Universiti Putra Malaysia, Serdang, Selangor 43400, Malaysia; jawaid@upm.edu.my
 4   Department of Aerospace Engineering, Faculty of Engineering, Universiti Putra Malaysia, Serdang,
     Selangor Darul Ehsan 43400, Malaysia
 5   Aerospace Malaysia Innovation Centre (944751-A), Prime Minister’s Department, MIGHT Partnership Hub,
     Jalan Impact, Cyberjaya, Selangor Darul Ehsan 63000, Malaysia
 6   Center for Integrated Design of Advanced Mechanical Systems (PRISMA), Faculty of Engineering and Built
     Environment, Universiti Kebangsaan Malaysia, Bandar Baru Bangi, Selangor 43600, Malaysia;
     mfaizalmt@ukm.edu.my
 *   Correspondence: shukry@unimap.edu.my (M.S.A.M.); thariq@upm.edu.my (M.T.H.S.)

 Received: 6 August 2020; Accepted: 10 September 2020; Published: 17 September 2020

 Abstract: The purpose of the study is to investigate the utilisation of Napier fiber
 (Pennisetum purpureum) as a source for the fabrication of cellulose nanofibers (CNF). In this
 study, cellulose nanofibers (CNF) from Napier fiber were isolated via ball-milling assisted by
 acid hydrolysis. Acid hydrolysis with different molarities (1.0, 3.8 and 5.6 M) was performed
 efficiently facilitate cellulose fiber size reduction. The resulting CNFs were characterised
 through Fourier-transform infrared spectroscopy (FTIR), X-ray diffraction (XRD), thermogravimetric
 analysis (TGA), particle size analyser (PSA), field-emission scanning electron microscopy (FESEM),
 atomic force microscopy (AFM), and transmission electron microscopy (TEM). The FTIR results
 demonstrated that there were no obvious changes observed between the spectra of the CNFs with
 different molarities of acid hydrolysis. With 5.6 M acid hydrolysis, the XRD analysis displayed
 the highest degree of CNF crystallinity at 70.67%. In a thermal analysis by TGA and DTG,
 cellulose nanofiber with 5.6 M acid hydrolysis tended to produce cellulose nanofibers with higher
 thermal stability. As evidenced by the structural morphologies, a fibrous network nanostructure
 was obtained under TEM and AFM analysis, while a compact structure was observed under FESEM
 analysis. In conclusion, the isolated CNFs from Napier-derived cellulose are expected to yield
 potential to be used as a suitable source for nanocomposite production in various applications,
 including pharmaceutical, food packaging and biomedical fields.

 Keywords: Napier fiber; cellulose nanofiber; crystallinity; morphology properties; thermal properties

1. Introduction
    The fibers of Napier grass, also commonly known as Pennisetum purpureum (PP), are made up of
46% cellulose, 34% hemicellulose, and 20% lignin [1]. In addition, it requires only a minimal supply

Materials 2020, 13, 4125; doi:10.3390/ma13184125                             www.mdpi.com/journal/materials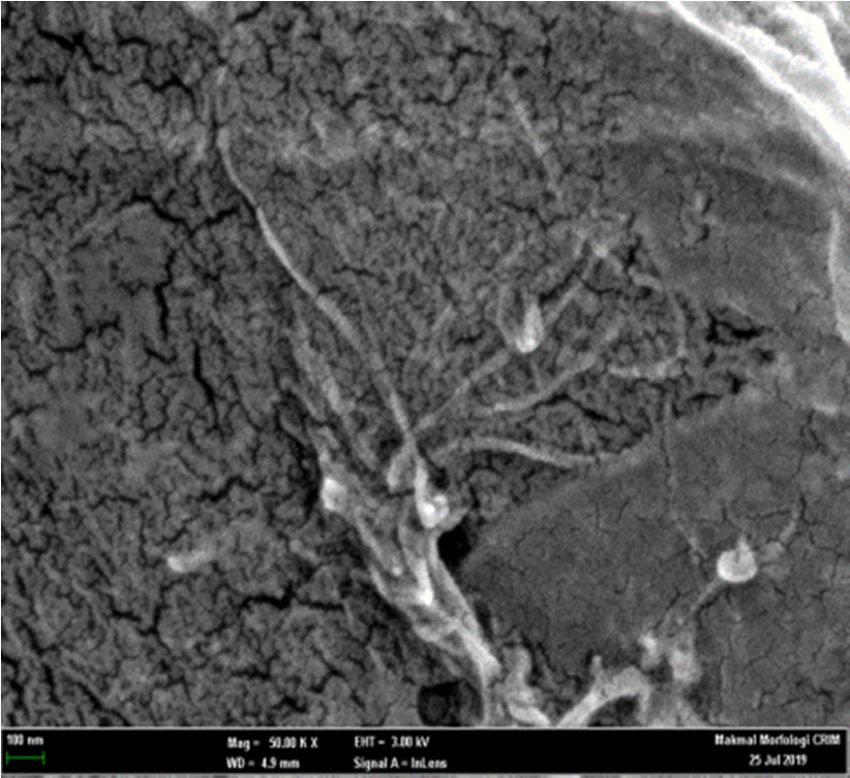
Materials 2020, 13, 4125                                                                             2 of 17

of nutrients for growth. In order to eliminate impurities and non-cellulosic material, an alkaline
treatment was implemented in most studies, using sodium hydroxide (NaOH) (4–20%) with 1–5 h
of continuous stirring. The treated fibers were then washed with distilled water until the pH was
neutralised and then dried in an oven overnight at 50 ◦ C [2]. Eliana et al. reported that Napier
fibers with alkaline pre-treatment yielded the highest percentages of lowering sugars and ethanol [3].
It was reported that the delignification of Napier grass was carried out by alkaline treatment with
different concentration from 0.5 to 10.5 wt.%, thus resulting in 80.59% cellulose and removal of 93.78%
lignin [4]. Ridzuan et al. recommended Napier fiber as a potential reinforcement material in polymer
composites [5]. Devin and Samir also recommended cellulosic fibers from Napier grass can be used as
supporting material for biofuel productions owing to the high moisture content of the cellulose [6].
According to the previous studies, alkaline pre-treatment is a preferred method for hemicellulose and
lignin removal; thus, cellulose retrieval from this method is promising. Alkaline post-treatment is also
proposed in this study to eliminate any remaining hemicellulose and lignin further.
      Recently, the development of nanocellulose from cellulose source as a preferred reinforcement
for nanocomposites has generated significant research interest on the utilisation of natural fibers
owing to their outstanding mechanical properties, sustainability, affordability, low environmental
impact, and relatively good specific features. There are several literature reviews on the expansion of
nanocellulose from cellulose source, via various methods. V. K. Baheti et al. had conducted dry and
wet ball milling of CNF from jute fiber wastes, which resulted in nanoparticles sized below 500 nm
with a small amount of contamination imported from milling media [7]. Morais et al. studied on
CNF from different types of cotton fibers using acid hydrolysis with 6.5M of sulphuric acid at 45 ◦ C.
They concluded that extraction yield, sulfonation efficiency, and thermal stability varies according
to the type of cotton fibers [8]. Zhijun et al. obtained CNF from bamboo fiber from a combination
of mechanical treatment, enzyme activation, carboxymethylation, and ultrasonic homogenisation [9].
They found that extraction yield, surface charge and carboxymethylation reaction was enhanced
through the existing preparation procedures. Based on these reviews and the related studies regarding
the nanofibers from cellulose, it can be concluded that preparation and isolation plays a crucial part in
producing a good cellulose nanofiber with enhanced structural and mechanical properties.
      Nanocellulose is described as a natural nanomaterial that is either a product of or is extracted from
native cellulose sources, such as plants [10]. The obtained cellulose from plants can be further reduced
into smaller cellulose fragments that are either micro-sized or nano-sized. Nanocellulose, with its
nano-sized diameter, has many advantages such as a high surface area, good strength and stiffness,
excellent chemical reactivity, and being low in density [11]. Recently, they have been widely used
as cellulose nanofibers (CNF), or cellulose nanocrystals (CNC), attracted positive attention in many
industries such as the automotive [12], biomedical [13–15], and pharmaceutical industries [10], and have
also found use as reinforcements in polymeric nanocomposites [16,17]. From previous studies,
nanocellulose fibers have been successfully extracted from cellulose sourced from softwood [18],
cotton [8,19,20], roselle [21], jute fiber [22], banana peel [23,24], and bamboo [25]. Nevertheless, it is
crucial to acknowledge that cellulose characteristics, such as the structural morphology, degree of
crystallinity, degree of polymerisation, and size, depend upon the source from which the cellulose was
extracted and not just on the extraction method employed [26,27].
      CNF, also recognised as cellulose nanofibril or nanofibrillated cellulose, is the entangled, long,
and flexible nanocellulose that can be produced from cellulose fibers that undergo mechanical processes
in which both shear and impact forces are used [28]. The key feature is the size of the cellulose
nanofiber, which is typically less than 100 nm in diameter and several micrometres in length [2].
The most commonly used mechanical techniques used to produce CNFs include microfluidisation,
ultrasonication, high-pressure homogenisation, ball milling, and micro-grinding [18,29–31]. However,
high-energy consumption is a major drawback of the mechanical processes used for the production of
CNFs, where the production of fine particles sizes down to the range of nanometers was transformed by
this high-energy ball milling by increasing rotational speed up to 1100 rpm for a couple of hours [32–34].
Materials 2020, 13, 4125                                                                             3 of 17

To overcome this shortcoming, the mechanical processes are combined with chemical pre-treatment to
reduce the energy consumption, since pre-treated cellulose fibers are easily fibrillated and also prevent
clogging [35,36].
      Recently, various researches have illustrated the synthesis and isolation process of cellulose
nanofibers by combining both chemical and mechanical treatments effectively. Leticia et al. had researched
isolation of CNFs from cassava root baggase and peelings using 30, 40, and 50% of sulfuric acid, and the
hydrolyzed suspensions were further homogenized to reduce the size and to disperse the CNFs
using ultrasound. They conclude that the isolation of CNFs is inexpensive and nanofibers with
excellent properties can be obtained [37]. The extraction of CNFs from pineapple leaf fibers (PALF)
had been studied by Lakshmipriya et al. where the fibers were subjected to acid hydrolysis with 50%
of sulfuric acid, and further ball-milled the suspension for 1.5 and 3 h. They found that the extraction
process is environmentally sustainable and economical for the fabrication of good-quality CNF [38].
Lastly, Kittiya et al. had investigated the effect of sulfuric acid concentration on sugarcane bagasse
fibers. The cellulose was ball-milled for 12 h with acid hydrolysis where the concentrations of sulfuric
acid are 0, 20, and 40%. The researcher illustrated that the extracted CNFs has greater absorption than
raw cellulose, whereas the crystallinity of the isolated CNFs was higher than untreated cellulose [39].
      From the literature review conducted, it is evident that there are fewer reported studies on the
optimisation of cellulose extraction from Napier fiber as a resource for developing CNFs. The objective
of this research is to isolate and prepare cellulose nanofibers from Napier fiber by combining mechanical
processing with acid hydrolysis and ultrasonication. The structural morphology, thermal stability
and crystallinity of the isolated CNFs were then characterised. Hence, this study is to provide crucial
information in preparing a future study on CNF from Napier fiber to look its appropriateness in
synthesising nanocomposites for application advancements.

2. Materials and Experimental Methods

2.1. Materials
     Raw Napier grass was obtained from a nearby plantation at Bukit Kayu Hitam, Kedah;
northern peninsular Malaysia. Sulfuric acid (H2 SO4 ) (purity ≥ 98 wt%, Mm = 98 g/mol), and sodium
hydroxide (NaOH) were obtained from Fisher Scientific. All other chemicals used in this work
were of reagent grade and purchased from local suppliers. De-ionised water was used throughout
the experiments.

2.2. Extraction and Preparation of Napier Fibers
     Water retting was employed in this study to remove the Napier fibers from the stem internodes [5].
The stems were at first cleaned and crushed into small pieces using a mallet before being soaked in a
tank filled with water for 4 to 6 weeks to ease the separation process. The Napier fibers were manually
extracted from the bast and cleaned with distilled water. The extracted fibers were sun-dried to remove
the excess moisture content, which may exist within the fibers. Subsequently, the dried fibers were
ground and sieved to convert the Napier fibers into fine particles (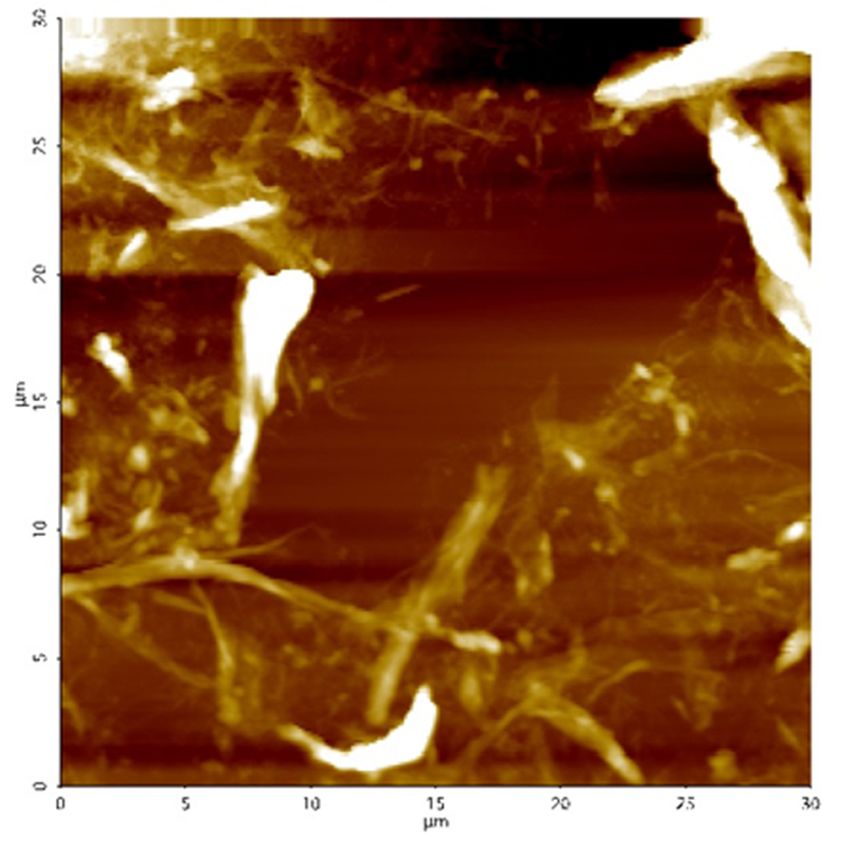
Materials 2020, 13, 4125                                                                                            4 of 17

GmbH, Heidelberg, Germany) with distilled water to reach a neutral pH. Post-treatment of Napier
fibers was then conducted to eliminate the remaining impurities from the fibers. The fibers were treated
with a 4% NaOH solution at 80 ◦ C for a further 60 min with continuous stirring. The suspension was
centrifuged and washed using distilled water until the pH of the suspension became neutral.
      After the chemical treatment, milling of the Napier fibers was carried out by a planetary ball
milling machine (Bench-Top Planetary Automatic Ball Mill, MSK-SFM-1, MTI, Richmond, VA, Canada)
in a zirconia bowl using zirconia balls with a diameter of 15 mm for 180 min of wet milling in de-ionised
water. The ball to material ratio (BMR) of the container loaded with fibers was 10:1, and the speed
of rotation of the container was set at 840 rpm. The resulting suspension was further sonicated for
15 min in an ultrasonicator (Branson Digital Signifier, Emerson, Danbury, CT, USA) at an amplitude
of 40% with 8 s of pulse on, and 4 s of pulse off. Ultrasonication was done in an ice-bath to prevent
heat-up where desulfation can occur due to the presence of sulfate groups on the fibers. Finally,
the suspension was freeze-dried and stored for further characterisation and use as reinforcement fillers
in biocomposites. A summary of the selected processing parameters for the synthesis of CNFs from
Napier fibers is given in Table 1.

      Table 1. Selected processing parameters for the synthesis of cellulose nanofibers (CNFs) from
      Napier fibers.

                       Alkaline      Acid Hydrolysis      Alkaline                       Ball Milling
       Sample                           Molarity
                     Pre-Treatment                     Post-Treatment   Time (Minutes)   Speed (rpm)    Ball Size (mm)
     CNF-PP1.0M            12%            1.0 M             4%               180             840             15
     CNF-PP3.8M            12%            3.8 M             4%               180             840             15
     CNF-PP5.6M            12%            5.6 M             4%               180             840             15

2.4. Characterisation

2.4.1. Fourier Transform Infrared Spectroscopy (FTIR)
     Infrared spectra were used to identify the chemical structure of the lignocellulosic elements
present in the samples. Fiber spectra were characterised using a Perkin Elmer Spectrum Version 10.5.2
spectrophotometer with a total of 42 scans in the range of 4000–600 cm−1 . A resolution of 4 cm−1 was
used in this work.

2.4.2. X-Ray Diffraction (XRD)
      XRD was used to analyse the phase composition of the samples using a D2 Phase Bruker
diffractometer with Cu-Kα radiation at 30 mA and 40 kV. Scattered radiation was recorded in the
interval 10◦ ≤ 2θ ≤ 80◦ at a scan speed of 4◦ /min with a step time of 0.24 s and a step size of 0.02◦
2θ. The crystallinity index (CrI) of the cellulose, CrI, was calculated using the empirical method [40],
as illustrated in Equation (1)
                                                   I200 − Iam
                                       CrI(%) =               × 100                                  (1)
                                                      I200
where I200 represents the crystalline peak corresponding to the intensity at approximately 22.4◦ , and Iam
is the amorphous peak corresponding to the intensity at approximately 18.32◦ .

2.4.3. Particle Size Measurements
     The average hydrodynamic particle size of the fabricated CNFs in aqueous suspension was
determined using a particle size analyser (PSA) (Malvern Instruments, Nano Z.S., Malvern Panalytical
Ltd., Malvern, UK). The CNF particles were analysed in the range from 0.6 to 6000 nm under the
following conditions: a temperature of 25 ◦ C, viscosity of 1,2000 mPas, and scattering angle fixed at 90◦ .
The sonicated CNF suspensions were all evaluated in triplicate.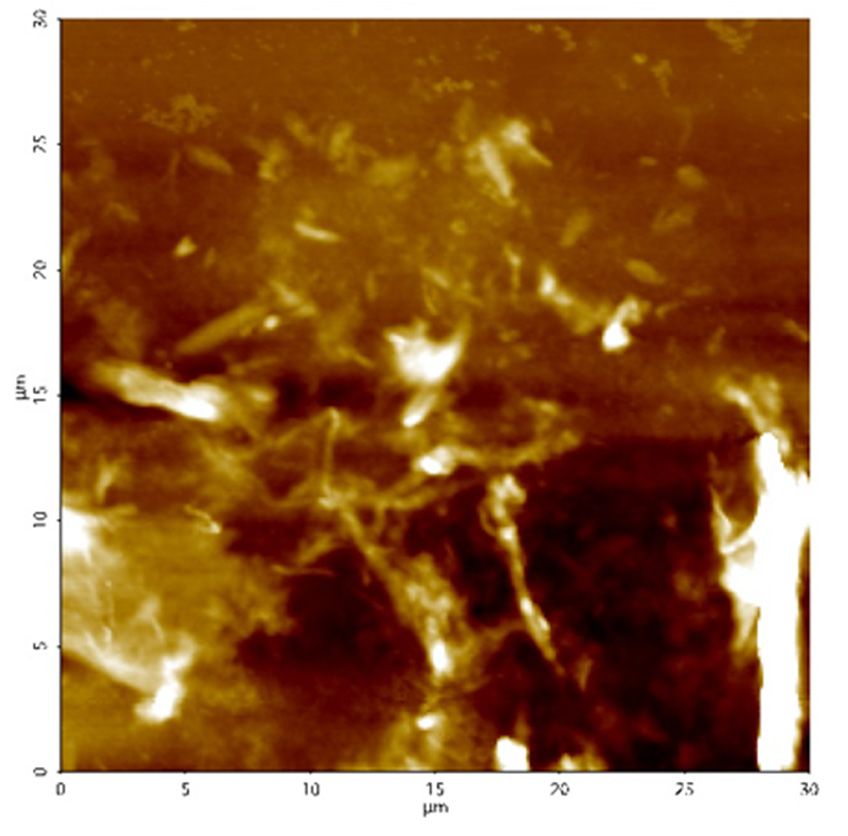
Materials 2020, 13, 4125 5 of 17
2.4.4. Thermogravimetric Analysis (TGA)
Thermal stability was measured using a thermogravimetric analyser (Shimadzu DTG 60H, Kyoto,
Japan). Samples weighing 10 mg were placed in an alumina crucible and evaluated by increasing the
temperature constantly from 30 to 950 ◦ C. All measurements were made under the flow of the dynamic
nitrogen gas carrier with a flow rate of 20 mL/min. The loss of weight was obtained from the TGA
curve of a plot of weight loss (%) versus temperature (◦ C).
2.4.5. Field Emission Scanning Electron Microscopy (FESEM)
The surface morphology of the CNFs was investigated using FESEM, performed on a ZEISS
MERLIN, Jena, Germany field emission scanning electron microscope at an acceleration voltage of
20 kV. The freeze-dried CNF samples were cut into a thin layer and mounted individually onto a
sample holder. In order to avoid unwanted charging, the surface of each of the prepared samples was
further sputtered with a thin layer of gold before FESEM was initiated. All measurements of the CNFs
from FESEM images were obtained using the Smart Tiff software.
2.4.6. Atomic Force Microscope (AFM)
The structural morphology and topography of the CNFs from Napier fibers were analysed by
AFM. The samples were examined in a Park Systems NX-10 microscope, Suwon, Korea. A droplet
of the CNF suspension was deposited on a glass slide, allowed to dry at 25 ◦ C overnight, and then
analysed by AFM. The AFM experiments were conducted in the tapping mode, at 25 ◦ C. The scan was
carried out at a rate of 1 Hz, with an image resolution of 0.015 nm, attached to a silicon cantilever spring
constant of between 25 and 50 N m−1 , followed by a resonance frequency up to 10.5 kHz. The width of
the CNFs was analysed from the AFM images using XEI software.
2.4.7. Transmission Electron Microscopy (TEM)
The TEM measurements were performed with an FEI Talos L120C microscope, Thermo Fisher
Scientific, Oregon, OR, USA. CNF from Napier fibers was further diluted using ethanol before a drop
of the diluted Napier nanofiber suspension was deposited onto a thin carbon-coated copper grid.
The prepared samples were allowed to dry at 25 ◦ C and observed and analysed through TEM at an
acceleration voltage of 80 kV. The average diameter of the CNFs was calculated from the obtained
TEM images using Image J software.
3. Results and Discussions
3.1. Morphology of CNFs from Napier
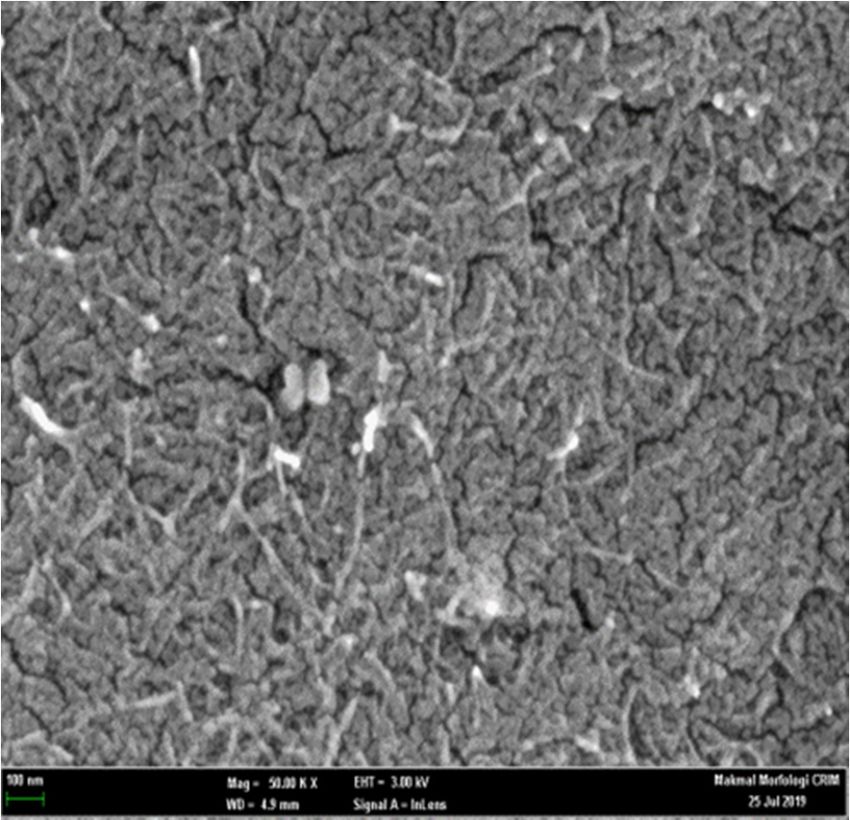
Morphological studies on CNF-PP1.0M , CNF-PP3.8M and CNF-PP5.6M were carried out using FESEM,
TEM, and AFM, and the obtained results are shown in Figure 1. Table 2 displays the morphological
characterisations, where the diameters of CNF-PP1.0M , CNF-PP3.8M and CNF-PP5.6M are recorded.
Figure 1a–c shows the FESEM micrographs of CNF-PP1.0M , CNF-PP3.8M and CNF-PP5.6M , respectively,
displaying their homogeneity and nanometric dimensions. The diameters of all three samples were
computed by analysing the image using the processing software, Image J. The smallest and biggest
diameters of CNF-PP1.0M , CNF-PP3.8M and CNF-PP5.6M were 49.93 and 167.6 nm, 25.46 and 34.67 nm,
then 16.10 and 34.95 nm, respectively. Figure 1a–c shows the structure of the nanofibers after the acid
hydrolysis and ball milling treatments. It can be seen that both treatments assist the separation of the
bundle of fibers into individual fibers and fibrous network, thus leading to a significant reduction in their
diameter size. The nanofibers of CNF-PP1.0M , CNF-PP3.8M and CNF-PP5.6M were visible in the freeze-dried
samples. Nano-fragments may tend to agglomerate with nanofibers by an interfacial hydrogen bonding.Materials 2020, 13, 4125 6 of 17
Materials 2020, 13, x FOR PEER REVIEW 7 of 18
(a) (b)
(c) (d)
(e) (f)
Figure 1. Cont.Materials 2020, 13, 4125 7 of 17
Materials 2020, 13, x FOR PEER REVIEW 8 of 18
(g) (h)
(i)
FigureFigure 1. Field-emission
1. Field-emission scanning
scanning electronelectron microscopy
microscopy (FESEM)
(FESEM) (a–c), transmission
(a–c), transmission electronelectron
microscopy
microscopy (TEM) (d–f), and atomic force microscopy (AFM) (g–i) results for CNF-PP1.0M (a,d,g),
(TEM) (d–f), and atomic force microscopy (AFM) (g–i) results for CNF-PP1.0M (a,d,g), CNF-PP3.8M
CNF-PP3.8M (b,e,h) and CNF-PP5.6M (c,f,i).
(b,e,h) and CNF-PP5.6M (c,f,i).
TableTable 2. Diameters of
2. Diameters of CNF-PP
CNF-PP 1.0M, CNF-PP3.8M, and CNF-PP5.6M analysed by FESEM, TEM, and AFM
1.0M , CNF-PP3.8M, and CNF-PP5.6M analysed by FESEM, TEM,
microscopy.
and AFM microscopy.
FESEM (Diameter Size TEM (Diameter Size AFM (Diameter Size
Samples
Samples
FESEM (Diameter Size Range) TEM (Diameter Size Range) AFM (Diameter Size Range)
Range)
(nm)(nm) Range) (nm)
(nm) Range) (nm)
(nm)
CNF-PP1.0M
CNF-PP 49.93–167.60
49.93–167.60 5.04–90.67
5.04–90.67 26.44–192.50
26.44–192.50
1.0M
CNF-PP
CNF-PP 3.8M
3.8M
25.46–34.67
25.46–34.67 4.40–22.62
4.40–22.62 19.64–53.28
19.64–53.28
CNF-PP
CNF-PP 5.6M
5.6M 16.10–34.95
16.10–34.95 5.67–13.70
5.67–13.70 10.50–38.74
10.50–38.74
3.2. Particle Size Measurement
Figure 1d–f shows TEM images of CNF-PP1.0M , CNF-PP3.8M and CNF-PP5.6M . Based on the
Particle
TEM analysis, size analysisdisplayed
CNF-PP (PSA) is aan
method used to obtain
individuated, long,the
andparticle size of CNFs
fine nanofiber in suspension
structure instead of a
1.0M
that undergoes Brownian motion generated by thermally induced collisions
fibrous network structure; whereas for CNF-PP3.8M and CNF-PP5.6M , a network-like fiber between the CNF
structure
particles and solvent particles. The measured particle size, often called a hydrodynamic diameter,
was observed. The ability to form a network of fibers is an essential criterion for nanofibers to develop
into an effective reinforcement material when applied to biocomposites. Moreover, the CNF-PP1.0M
contained diameter sizes ranging from 5.04 to 90.67 nm compared to those of CNF-PP3.8M and
CNF-PP5.6M , which had the range 4.40–22.62 and 5.67–13.70 nm, respectively (Table 2). It is also
important to note that the lengths of the obtained CNFs were estimated to be in the micrometric scale.Materials 2020, 13, 4125 8 of 17
The reduction in the diameter of CNF-PP1.0M , CNF-PP3.8M and CNF-PP5.6M were caused by the removal
of lignin, hemicellulose, and the non-cellulosic parts of Napier, through the alkaline treatments (pre-
and post-), acid hydrolysis and ball milling treatments. The morphology results of the CNF-PP1.0M ,
CNF-PP3.8M and CNF-PP5.6M samples in this study correlated well with the dimensions of the CNFs
from kenaf (1–40 nm) [41], banana peel (20–50 nm) [24], cotton (20–80 nm) [19], and pineapple leaf
fibers (20–50 nm) [38].
The CNFs obtained after acid hydrolysis and ball milling were analysed by AFM to determine their
structure and diameter. The AFM image in Figure 1g displays the structural morphology of CNF-PP1.0M .
It can be observed that the cellulose is nano-sized with a diameter ranging from 26.44 to 192.50 nm.
Figure 1h shows the structural morphology of CNF-PP3.8M , with a diameter ranging from 19.64 to
53.28 nm, whereas Figure 1i displayed a diameter ranging from 10.50 to 38.74 nm. CNF-PP3.8M and
CNF-PP5.6M presented more densely packed fibrous networks of cellulose nanofiber than CNF-PP1.0M
(Figure 1b,c), but both CNF-PP1.0M and CNF-PP3.8M displayed network-like structures of CNFs which
concur with the TEM results. The diameter for CNF-PP1.0M , CNF-PP3.8M and CNF-PP5.6M obtained
from AFM were larger than the diameter ranges from FESEM and TEM analysis. This is similar to the
AFM results obtained for the isolation of CNFs from softwood pulp using TEMPO techniques [18].
A similar outcome was observed by Niu et al., where the extraction of CNC from microcrystalline
cellulose using acid hydrolysis assisted by ultrasonication degraded the impurities and decreased the
diameter of the CNC, breaking them down into nano-sized particles [42].
By comparing the structural morphology results obtained from FESEM, TEM, and AFM, it can be
concluded that of all the microscopic analyses, TEM presented the clearest insight into CNF morphology,
with a diameter size between 5.04 and 90.67 nm for CNF-PP1.0M , 4.40 and 22.62 nm for CNF-PP3.8M,
and 5.67 and 13.70 nm for CNF-PP5.6M . Additionally, all three samples displayed a fibrous network
structure; hence, the structural morphology showed an increase in specific surface area compared to
extracted Napier fibers. On the other hand, it was noticeable that the diameter measured using AFM
was slightly larger than that from the FESEM and TEM analyses. This could be due to the broadening
effect in AFM, where the broadening of the sample width depends on its physical properties and
position concerning the tip radius. Another crucial aspect that might affect AFM is the placement of
the nanofibers on the holder that may lead to random measurements due to the irregular shape of
the nanofibers [43]. Thus, the combination of acid hydrolysis and ball milling further proved that
when the impurities covering the CNFs were effectively removed, a reduction from micro-sized raw
cellulose, composed of bundles of fibers, into nano-sized CNFs occurs.
3.2. Particle Size Measurement
Particle size analysis (PSA) is a method used to obtain the particle size of CNFs in suspension that
undergoes Brownian motion generated by thermally induced collisions between the CNF particles and
solvent particles. The measured particle size, often called a hydrodynamic diameter, which indicates
the way that the CNF particle diffuses within a fluid. It is essential to understand that PSA is
based on the Stokes–Einstein equation, where the measurements refer to spherical particles and the
orientation of the CNFs in suspension profoundly influences the particle size values obtained [44].
The size distribution of CNF-PP1.0M , CNF-PP3.8M and CNF-PP5.6M, as measured by particle size analysis,
is shown in Figure 2a,b.
Figure 2a shows the intensity weighted distribution of the CNF-PP1.0M , CNF-PP3.8M and
CNF-PP5.6M samples as detected by laser diffraction. CNF-PP1.0M showed a single peak with a
value of approximately 525 nm. CNF-PP3.8M displayed two peaks, minor peak with a mean value of
3 nm and maximum intensity of approximately 8% and a major peak with a mean value of 89 nm
and maximum intensity of approximately 92% whereas for CNF-PP5.6M , three different peaks were
observed. The first with an average size of 1 nm and an intensity of approximately 6%, the second with
a mean value of 344 nm and maximum intensity of approximately 81%, and the third with a mean value
of 3800 nm and maximum intensity of approximately 11%. Based on the results, CNF-PP5.6M possessesfrom 100 to 500 nm for CNF-PP1.0M. CNF-PP1.0M proved that low acid hydrolysis molarities were not
sufficient to obtain nano-sized cellulose particles, even though the variables for the mechanical
treatments were improved throughout the experiment and finally led to the breakdown of the
weaker interactions between the crystalline region and amorphous region of CNFs [46]. When
comparing
Materials 2020,particle
13, 4125 size distribution data, these results show that the intensity-weighted distribution
9 of 17
and volume-weighted distribution produce considerably different particle size measurements.
However, it is crucial to understand that the intensity-weighted distribution was obtained using the
larger particle
intensity of the sizes,
lightindicating
scatteredthat particles
by the aggregated
particle fractions,inwhereas
suspension
the more rapidly than CNF-PP
volume-weighted distribution
1.0M
and CNF-PP
was measured particles. This is the case for particles that possess high hydrophobic characteristics,
3.8Musing image analysis. Analysing the particle size distribution by laser diffraction
i.e.,
yieldssamples containing
the most accurateless hydroxyl
results [37]. groups tend to aggregate easily [45].
Size Distribution by Intensity
(a)
40
Intensity (Percent)
30
20
10
0
0.1 1 10 100 1000 10000
Size (d.nm)
Record 44: CNF-PP obtained from 1.0 M of acid hydrolysis
Record 45: CNF-PP obtained from 3.8 M of acid hydrolysis
Materials 2020, 13, x FOR PEER REVIEW Record 47: CNF-PP obtained from 5.6 M of acid hydrolysis 10 of 18
Size Distribution by Volume
(b)
40
Volume (Percent)
30
20
10
0
0.1 1 10 100 1000 10000
Size (d.nm)
Record 44: CNF-PP obtained from 1.0 M of acid hydrolysis
Record 45: CNF-PP obtained from 3.8 M of acid hydrolysis
Record 47: CNF-PP obtained from 5.6 M of acid hydrolysis
Figure 2. Particle
Figure 2. Particle size
size distribution
distribution by
by particle
particle size
size analysis
analysis (PSA)
(PSA) (a)
(a) intensity-weighted
intensity-weighted distribution
distribution
and (b) volume-weighted distribution of CNF-PP
and (b) volume-weighted distribution of CNF-PP1.0M , CNF-PP and CNF-PP
3.8Mand CNF-PP
1.0M, CNF-PP3.8M . .
5.6M
5.6M
Concerning the volume-weighted distribution (Figure 2b), the majority of the particles were in an
3.3. XRD Analysis
equivalent volume range from 0.5 to 5 nm for CNF-PP5.6M , from 1 to 10 nm for CNF-PP3.8M and from 100
to 500X-ray
nm for diffraction
CNF-PP1.0M patterns of the
. CNF-PP 1.0Mcellulose
proved nanofibers
that low acidwere analysed
hydrolysis to determine
molarities were thenot influence
sufficient
of obtain
to the molarity of acid
nano-sized hydrolysis
cellulose on the
particles, even crystallinity,
though thewhere Segal’s
variables method
for the was used
mechanical to calculate
treatments were
the crystallinity
improved index,the
throughout CrI.experiment
Figure 3 displays
and finallythe corresponding X-ray diffractograms
led to the breakdown of the weaker obtained
interactionsfor
CNF-PP , CNF-PP and CNF-PP . The diffractograms for the CNFs
between the crystalline region and amorphous region of CNFs [46]. When comparing particle size
1.0M 3.8M 5.6M present intense peaks at
around 16.2°,data,
distribution 22.6°, andresults
these 34.3°, which reflect
show that theon the crystallographic
intensity-weighted planes of and
distribution (110), (200), and (004),
volume-weighted
respectively. produce
distribution Based onconsiderably
the literature,different
these crystallographic planes confirm that
particle size measurements. the CNF
However, samples
it is crucialareto
in the crystal structure known as cellulose Iβ [25]. These results also confirm
understand that the intensity-weighted distribution was obtained using the intensity of the light that the crystal integrity
of the CNFs
scattered by has
the been maintained
particle fractions,through
whereasthe theball milling and chemical
volume-weighted treatment
distribution wasprocedures
measured [21]. using
image Asanalysis.
seen in Figure
Analysing 3, the
thecrystallinity
particle sizeofdistribution
CNFs from by Napier
laser fibers was determined
diffraction yields the most at the end of
accurate
the isolation
results [37]. process. After ball milling, significant differences on the diffraction peaks of the CNFs
were observed for CNF-PP1.0M, CNF-PP3.8M and CNF-PP5.6M. As illustrated in Table 3, the crystallinity
3.3. XRD
values of Analysis
CNF-PP1.0M, CNF-PP3.8M and CNF-PP5.6M were 58.90, 65.18, and 70.67%, respectively. These
results evidently
X-ray indicate
diffraction an increase
patterns in the crystallinity
of the cellulose nanofibersindex
were(CrI) owingtotodetermine
analysed the increase theininfluence
the acid
hydrolysis molarities, as stated by several authors [25,47]. CNF-PP 5.6M showed the highest degree of
of the molarity of acid hydrolysis on the crystallinity, where Segal’s method was used to calculate
crystallinity at 70.67%, which demonstrates sharper diffraction with an intense peak at 22.6°
compared to CNF-PP1.0M and CNF-PP3.8M. Increases in the crystallinity of nanofibers are caused by
hydronium ions’ (H3O+) charge on the reduction in the amorphous region during acid hydrolysis,
leading to hydrolytic separation of the glycosidic bond of CNFs [21]. Compared to CNF-PP1.0M,
CNF-PP3.8M showed a slightly sharper peak at 22.6°. This is attributed to the fact that the separationCNF-PP3.8M 65.18
CNF-PP5.6M 70.67
The crystallinity displayed in this study (CNF-PP5.6M = 70.67%) was higher than the CNFs
extracted by Mahardika et al. (69.4%) using high-shear homogenisation [46]. However, Syafri
Materials 2020, 13, 4125
et al.
10 of 17
showed a greater crystallinity than found in this study: 73.65% using chemical-ultrasonic treatment
[49]. Nonetheless, when comparing to other studies, the present study provides a greater degree of
the crystallinity
crystallinity than index,
thoseCrI. Figureby
obtained 3 displays
CNF from thebagasse
corresponding
(68%) byX-ray
Korddiffractograms obtained
Sofla et al. [50], for
CNF from
CNF-PP
empty fruit , CNF-PP
1.0M bunches 3.8M and CNF-PP
of oil palm (69%)5.6Mby Jonoobi et al. [51] and CNF from banana peel (64.9%) at
. The diffractograms for the CNFs present intense peaks by
around 16.2 ◦ ◦ ◦
Pellissari et ,al.
22.6
[23]., and 34.3
It can be, concluded
which reflect
thatona the crystallographic
higher planes of (110),
degree of crystallinity leads (200), andtensile
to higher (004),
respectively.
strength, thus Based on the literature,
enhancing these crystallographic
the mechanical properties [48] ofplanes confirm that
the nanofibers asthe CNF samples
durable are in
reinforcement
the crystal
fillers. structure known as cellulose Iβ [25]. These results also confirm that the crystal integrity of
the CNFs has been maintained through the ball milling and chemical treatment procedures [21].
CNF-PP1.0M
CNF-PP5.6M
CNF-PP3.8M
Intensity (Counts)
10 20 30 40 50 60
2 Theta (degree)
Figure 3. X-ray diffraction patterns of CNF-PP1.0M , CNF-PP3.8M and CNF-PP5.6M .
Figure 3. X-ray diffraction patterns of CNF-PP1.0M, CNF-PP3.8M and CNF-PP5.6M.
As seen in Figure 3, the crystallinity of CNFs from Napier fibers was determined at the end of the
3.4. FTIRprocess.
isolation AnalysisAfter ball milling, significant differences on the diffraction peaks of the CNFs were
observed for CNF-PP
The FTIR spectral
1.0M , CNF-PP
features 3.8M and1.0M
of CNF-PP CNF-PP
, CNF-PP 5.6M . As
3.8M andillustrated
CNF-PP5.6M in under
Table 3, the crystallinity
varying hydrolysis
values of CNF-PP , CNF-PP and CNF-PP were 58.90, 65.18, and 70.67%,
conditions are shown in Figure 4. Basically, the infrared spectral features revealed that there were no
1.0M 3.8M 5.6M respectively.
These results
distinct evidently
changes observed indicate
among anthe
increase in thegroups
functional crystallinity indexnanofibers
of cellulose (CrI) owing of to the increase
different in
molarity
the acid acid
during hydrolysis molarities,
hydrolysis. as stated
In addition, allby
theseveral
isolated authors [25,47].
nanofibers CNF-PP
showed 5.6M showed
insignificant the highest
results on the
degree of crystallinity at 70.67%, which demonstrates sharper diffraction with an intense peak at 22.6◦
I.R. spectra, which suggest that the isolation of CNFs at different molarities of acid hydrolysis did
compared to CNF-PP
not influence 1.0M andcomposition
the chemical CNF-PP3.8M .ofIncreases in theThe
the samples. crystallinity
finding of nanofibers
concurs with are
thecaused
resultsbyof
hydronium ions’ (Hon +
studies conducted 3 Ojute) charge on the satin
[7], Brazilian reduction in the
tail [52], andamorphous region during acid hydrolysis,
oil palm [53].
leading to hydrolytic separation of the glycosidic bond of CNFs [21]. Compared to CNF-PP1.0M ,
CNF-PP3.8M showed a slightly sharper peak at 22.6◦ . This is attributed to the fact that the separation
and elimination of non-cellulosic components consisting of lignin, hemicellulose, and amorphous
cellulose might occur in an amorphous region of the raw fibers, which leads to a rearrangement of
the crystalline order in the crystallographic plane (200) [48]. These indicate that the acid hydrolysis
pre-treatment had a significant impact on the crystalline regions of the cellulose nanofibers from
Napier fibers, which was supported by the FTIR results. These results illustrate that the crystallinity
of cellulose nanofibers can be altered accordingly, thus these cellulose nanofibers from Napier fibers
have the potential to produce nanocomposite materials with a good reinforcement capabilities for
various applications.Materials 2020, 13, 4125 11 of 17
Table 3. XRD analysis data of CNF-PP1.0M , CNF-PP3.8M and CNF-PP5.6M .
Samples Crystallinity Index, CrI (%)
CNF-PP1.0M 58.90
CNF-PP3.8M 65.18
CNF-PP5.6M 70.67
The crystallinity displayed in this study (CNF-PP5.6M = 70.67%) was higher than the CNFs extracted
by Mahardika et al. (69.4%) using high-shear homogenisation [46]. However, Syafri et al. showed a
greater crystallinity than found in this study: 73.65% using chemical-ultrasonic treatment [49].
Nonetheless, when comparing to other studies, the present study provides a greater degree of
crystallinity than those obtained by CNF from bagasse (68%) by Kord Sofla et al. [50], CNF from
empty fruit bunches of oil palm (69%) by Jonoobi et al. [51] and CNF from banana peel (64.9%) by
Pellissari et al. [23]. It can be concluded that a higher degree of crystallinity leads to higher tensile
strength, thus enhancing the mechanical properties [48] of the nanofibers as durable reinforcement fillers.
3.4. FTIR Analysis
The FTIR spectral features of CNF-PP1.0M , CNF-PP3.8M and CNF-PP5.6M under varying hydrolysis
conditions are shown in Figure 4. Basically, the infrared spectral features revealed that there were no
distinct changes observed among the functional groups of cellulose nanofibers of different molarity
during acid hydrolysis. In addition, all the isolated nanofibers showed insignificant results on the I.R.
spectra, which suggest that the isolation of CNFs at different molarities of acid hydrolysis did not
influence the chemical composition of the samples. The finding concurs with the results of studies
Materials 2020, 13, x FOR PEER REVIEW 12 of 18
conducted on jute [7], Brazilian satin tail [52], and oil palm [53].
3334 2890 1638 1154
1380 1315 1038 897
CNF-PP3.8M
Transmittance (a.u)
CNF-PP5.6M
CNF-PP1.0M
4000 3500 3000 2500 2000 1500 1000
Wavenumber (cm-1)
Figure 4. FTIR spectra of CNF-PP1.0M , CNF-PP3.8M and CNF-PP5.6M .
Figure 4. FTIR spectra of CNF-PP1.0M, CNF-PP3.8M and CNF-PP5.6M.
Figure 4 shows a broad band in the vicinity of 3334 cm−1 region for all samples, illustrates the
presence of hydroxyl
Figure 4 showsgroups
a broad(O–H
bandstretching vibration),
in the vicinity which
of 3334 cm−1demonstrates
region for allthesamples,
hydrophilic naturethe
illustrates of
the CNFs from
presence Napiergroups
of hydroxyl fibers. A more
(O–H noticeable
stretching absorption
vibration), peakdemonstrates
which in the spectrathe
of the nanofibers
hydrophilic was
nature
attained under CNF-PP
of the CNFs from Napier whereas CNF-PP
fibers. A more noticeable
3.8M, 5.6M is less intense owing to the exposure of cellulose
absorption peak in the spectra of the nanofibers in
the high molarity of acid hydrolysis [52]. This is in good agreement with the observed
was attained under CNF-PP3.8M, whereas CNF-PP5.6M is less intense owing to the exposure of agglomerations
of CNF-PPin
cellulose theparticles
5.6M due to the
high molarity presence
of acid of fewer
hydrolysis hydroxyl
[52]. This is groups,
in good as mentioned
agreement in PSA
with analysis.
the observed
agglomerations of CNF-PP5.6M particles due to the presence of fewer hydroxyl groups, as mentioned
in PSA analysis. Furthermore, the peak at 2890 cm−1 may be attributed to the C–H symmetrical
stretching of cellulose and hemicellulose, and the band observed at 1638 cm−1 is the related to the O–
H bending vibration of adsorbed water [54]. The absorbance band at 1380 cm−1 attributing to S = O
stretching, indicating that sulphate group were presence during the acid hydrolysis where sulfuricMaterials 2020, 13, 4125 12 of 17
Furthermore, the peak at 2890 cm−1 may be attributed to the C–H symmetrical stretching of cellulose
and hemicellulose, and the band observed at 1638 cm−1 is the related to the O–H bending vibration of
adsorbed water [54]. The absorbance band at 1380 cm−1 attributing to S = O stretching, indicating that
sulphate group were presence during the acid hydrolysis where sulfuric acid was utilized as the
catalyst. The peaks observed in the wavelength of 1315 cm−1 in all three samples could be associated
with the bending vibrations and angular deformation of the C–H and C–O groups, corresponding
to the polysaccharide aromatic ring [41]. The peak observed at 1154 cm−1 correspond to the C–O–C
stretching vibration of the glucosidic rings [42] and the peak occurring at 1038 cm−1 is related to
the C–O stretching of the pyranose ring vibration, referring to the structure of cellulose/lignin [52].
In addition, the increase in the crystallinity of the CNFs can be determined from the increase in intensity
of this group [55]. Finally, the peaks at wavenumber 897 cm−1 in CNFs from Napier fibers are assigned
to the β-glycosidic bonds that exist between the glucose units of cellulose/hemicellulose nanofibers.
This band plays an important role in the CNF spectra, as it is proof that the cellulosic properties may
not have been transformed during the acid hydrolysis process [56].
3.5. Thermogravimetric Analysis
Thermal decomposition and stability are essential factors to consider when proposing the use
of CNFs as robust and natural fillers in reinforced composites. Figures 5 and 6 represent the
thermogravimetric analysis (TGA) and derivative thermogravimetric (DTG) curves of CNF-PP1.0M ,
CNF-PP3.8M and CNF-PP5.6M , respectively. Two-step thermal decomposition behaviour was observed
in this analysis; this is also known as a cellulose pyrolysis curve. This mechanism is strongly influenced
by the chemical factors, presence of impurities, degree of crystallinity of cellulose, type of cellulose used,
physical factors, temperature, heating time, and atmospheric conditions during the measurements [48].
The obtained thermal parameters of CNF-PP1.0M , CNF-PP3.8M and CNF-PP5.6M from TGA and DTG
Materials 2020, 13, x FOR PEER REVIEW 14 of 18
analyses are summarised in Table 4.
110
CNF-PP1.0M
100
CNF-PP3.8M
90 CNF-PP5.6M
80
Weight loss (%)
70
60
50
40
30
20
10
0 100 200 300 400 500 600
Temperature (°C)
Figure 5. TGA
Figure curves
5. TGA of of
curves CNF-PP
CNF-PP
1.0M , CNF-PP
1.0M , CNF-PP 3.8Mand
3.8M and CNF-PP 5.6M..
CNF-PP5.6M
The TGA curves illustrate that the increased molarities of acid hydrolysis lead to a decrease in
the weight loss of the CNFs at temperatures above 300 °C, which is attributed to the improved
thermal stability of the CNFs. However, the formation of char and low molecular weight gases
occurred when active cellulose was dehydrated to produce anhydrocellulose, which consists of
partially cross-linked cellulose particles [23]. The values of the char residue for CNF-PP1.0M,
CNF-PP3.8M and CNF-PP5.6M at 600 °C were 18.91, 24.34 and 24.58%, respectively. CNF-PP5.6M
displayed similar residue content compared to CNF-PP3.8M and a higher amount of residue content
compared to CNF-PP1.0M, as shown in Table 4. This is likely due to the presence of sulphate groups inCNF-PP3.8M and CNF-PP5.6M at 600 °C were 18.91, 24.34 and 24.58%, respectively. CNF-PP5.6M
displayed similar residue content compared to CNF-PP3.8M and a higher amount of residue content
compared to CNF-PP1.0M, as shown in Table 4. This is likely due to the presence of sulphate groups in
the hydrolysed CNFs, where sulphate groups act as flame retardants, increasing the content of
charred residues
Materials 2020, at high temperatures [57].
13, 4125 13 of 17
2
0
-2
Derivative weight (%/min)
-4
-6
-8
-10
-12
-14
CNF-PP1.0M
-16 CNF-PP3.8M
-18 CNF-PP5.6M
0 100 200 300 400 500 600
Temperature (°C)
Figure 6. DTG curves of CNF-PP1.0M , CNF-PP3.8M and CNF-PP5.6M .
Figure 6. DTG curves of CNF-PP1.0M, CNF-PP3.8M and CNF-PP5.6M.
Table 4. Thermal parameters of CNF-PP1.0M , CNF-PP3.8M and CNF-PP5.6M obtained from thermogravimetric
analysis (TGA) and derivative thermogravimetric (DTG) analysis.
1st Thermal Degradation 2nd Thermal Degradation Residue at
Samples
Tonset (◦ C) a Tpeak (◦ C) b Wloss (%) c Tonset (◦ C) a Tpeak (◦ C) b Wloss (%) c 600 ◦ C (%)
CNF-PP1.0M 30.23 61.66 8.18 269.74 324.90 48.61 18.91
CNF-PP3.8M 30.40 58.07 6.24 241.86 326.15 50.46 24.34
CNF-PP5.6M 30.01 62.50 7.99 277.08 332.87 40.94 24.58
a TGA onset temperature. b DTG decomposition peak temperature. c TGA weight loss.
In the initial thermal degradation stage, the samples undergo weight loss due to dehydration [57].
These occurrences were observed between 30 and 100 ◦ C, as displayed in Figure 5. On the other hand,
samples with a lower molecular weight compound consisting of a hydroxyl group at the end of the chain
might get evaporated at this stage, leading to further weight loss. Subsequently, the decomposition
peak temperature presented in the DTG analysis illustrates a broad peak at 61.66, 58.07 and 62.50 ◦ C
for CNF-PP1.0M , CNF-PP3.8M and CNF-PP5.6M , respectively, demonstrating that the evaporation of
adsorbed water occurs in all CNF samples. The weight loss observed for this stage of degradation for
all three samples CNF-PP1.0M , CNF-PP3.8M and CNF-PP5.6M was 8.17, 6.24 and 7.99%, respectively.
Compared to CNF-PP3.8M and CNF-PP5.6M , CNF-PP1.0M displays a higher weight loss at temperatures
ranging from 30 to 100 ◦ C. Based on these results, it can be deduced that CNF-PP1.0M possesses a
higher moisture content than CNF-PP3.8M and CNF-PP5.6M .
The second thermal degradation stage took place below 300 ◦ C, between the approximate ranges
of 140–280 ◦ C, which acts as the most approachable region of the amorphous cellulose nanofibers,
where there is a high content of sulfate groups. As seen in Table 4, CNF-PP1.0M , CNF-PP3.8M and
CNF-PP5.6M started to decompose at temperatures of 269.74, 241.86 and 277.08 ◦ C, respectively.
According to Rahimi Kord Sofla et al., the thermal decomposition of cellulose begins in the amorphous
regions and progresses to more crystalline regions [50]. These findings agree with the observations of
Börjesson et al., [58] who observed that microcrystalline cellulose (MCC) with a prominent amorphous
region is less resistant to high temperatures than those with ordered and compact crystalline structures.
With regards to the decomposition temperature curve from the DTG analysis, as shown in Figure 6,
the Tpeak of CNF-PP1.0M , CNF-PP3.8M and CNF-PP5.6M were 324.90, 326.15 and 332.87 ◦ C, respectively.
This suggested that CNF-PP5.6M has a better thermal stability than CNF-PP1.0M and CNF-PP3.8M .
In addition, CNF-PP3.8M and CNF-PP5.6M shows another significant step of thermal degradation at
temperatures of approximately 250 ◦ C. This step of thermal degradation can be referred to the existenceMaterials 2020, 13, 4125 14 of 17
of chemical additives which were utilized during the chemical treatments. Enhancement in the thermal
stability of cellulose after undergoing chemical pre-treatment has been observed in past studies on
samples such as chemically pre-treated wood fiber [59] and ramie [49].
The TGA curves illustrate that the increased molarities of acid hydrolysis lead to a decrease in the
weight loss of the CNFs at temperatures above 300 ◦ C, which is attributed to the improved thermal
stability of the CNFs. However, the formation of char and low molecular weight gases occurred when
active cellulose was dehydrated to produce anhydrocellulose, which consists of partially cross-linked
cellulose particles [23]. The values of the char residue for CNF-PP1.0M , CNF-PP3.8M and CNF-PP5.6M
at 600 ◦ C were 18.91, 24.34 and 24.58%, respectively. CNF-PP5.6M displayed similar residue content
compared to CNF-PP3.8M and a higher amount of residue content compared to CNF-PP1.0M , as shown
in Table 4. This is likely due to the presence of sulphate groups in the hydrolysed CNFs, where sulphate
groups act as flame retardants, increasing the content of charred residues at high temperatures [57].
4. Conclusions
In this study, cellulose nanofibers were isolated from Napier fibers via ball milling and acid
hydrolysis at different molarities. The cellulosic properties of these CNFs may not have been
transformed during the chemical and mechanical treatments, which is evident from the FTIR results.
Furthermore, XRD analysis indicated that the CNFs isolated by acid hydrolysis with 5.6 M H2 SO4
displayed the highest crystallinity value of 70.67%, indicating that it had the ability to perform well
in the mechanical improvement of polymer nanocomposites. TGA revealed higher thermal stability
for CNF-PP5.6M than CNF-PP1.0M and CNF-PP3.8M , which was probably caused by the reduction in
residual cellulose in the amorphous region of the nanofiber, as well as an increase in crystallinity
during the isolation process. The microscopy studies by AFM and TEM revealed that the isolation
process leads to fibrillation and the breakage of fibers into nano-sized particles, which improves
the effective surface area accessible for contact. FESEM results displayed a compact structure of
the nanofiber network, due to the freeze-drying effect that resulted in the agglomeration of the
nanofibers. Given these findings, it can be suggested that Napier fibers can be used to produce CNFs;
to be employed as reinforcing materials for the development of nanocomposites in the biomedical,
automotive, and pharmaceutical industries.
Author Contributions: R.R.: Methodology, Investigation, Formal analysis, Writing—Original draft preparation,
M.S.A.M.: Supervision, Funding acquisition, Writing—Review & Editing, M.R.M.J.: Methodology, Investigation,
Resources, M.J.: Writing—Review & Editing, M.T.H.S.: Visualization, Writing—Review & Editing, M.F.M.T.:
Methodology, Investigation. All authors have read and agreed to the published version of the manuscript.
Funding: This research was funded by the Ministry of Higher Education Malaysia, through the Fundamental
Research Grant Scheme; (Ref: FRGS/1/2019/TK05/UNIMAP/02/11)
Acknowledgments: The authors are grateful to i-CRiM, Universiti Kebangsaan Malaysia for providing analytical
facilities. Finally, the authors would also like to acknowledge the School of Mechatronic Engineering,
Universiti Malaysia Perlis (UniMAP) for the equipment and technical assistance over the course of the project.
The authors would also like to thank Universiti Putra Malaysia for the financial support through the Geran
Putra Berimpak (GPB-9668200), Department of Aerospace Engineering, Faculty of Engineering, Universiti Putra
Malaysia and Laboratory of Biocomposite Technology, Institute of Tropical Forestry and Forest Product (INTROP),
Universiti Putra Malaysia (HICOE) for the close collaboration in this research.
Conflicts of Interest: The authors declare no conflict of interest.
References
1. Reddy, K.O.; Maheswari, C.U.; Shukla, M.; Rajulu, A.V. Chemical composition and structural characterization
of Napier grass fibers. Mater. Lett. 2012, 67, 35–38. [CrossRef]
2. Phanthong, P.; Reubroycharoen, P.; Hao, X.; Xu, G.; Abudula, A.; Guan, G. Nanocellulose: Extraction and
application. Carbon Resour. Convers. 2018, 1, 32–43. [CrossRef]
3. Eliana, C.; Jorge, R.; Juan, P.; Luis, R. Effects of the pretreatment method on enzymatic hydrolysis and ethanol
fermentability of the cellulosic fraction from elephant grass. Fuel 2014, 118, 41–47. [CrossRef]Materials 2020, 13, 4125 15 of 17
4. Minmunin, J.; Limpitipanich, P.; Promwungkwa, A. Delignification of Elephant Grass for Production of Cellulosic
Intermediate; Elsevier: Amsterdam, The Netherlands, 2015.
5. Ridzuan, M.J.M.; Majid, A.M.S.; Afendi, M.; Aqmariah, K.S.N.; Zahri, J.M.; Gibson, A.G. Characterisation of
natural cellulosic fibre from Pennisetum purpureum stem as potential reinforcement of polymer composites.
Mater. Des. 2016, 89, 839–847. [CrossRef]
6. Takara, D.; Khanal, S.K. Characterizing compositional changes of Napier grass at different stages of growth
for biofuel and biobased products potential. Bioresour. Technol. 2015, 188, 103–108. [CrossRef] [PubMed]
7. Baheti, V.; Abbasi, R.; Militky, J. Ball milling of jute fibre wastes to prepare nanocellulose. World J. Eng.
2012, 9, 45–50. [CrossRef]
8. De Morais Teixeira, E.; Correa, A.C.; Manzoli, A.; De Lima Leite, F.; De Ribeiro Oliveira, C.; Mattoso, L.H.C.
Cellulose nanofibers from white and naturally colored cotton fibers. Cellulose 2010, 17, 595–606. [CrossRef]
9. Hu, Z.; Zhai, R.; Li, J.; Zhang, Y.; Lin, J. Preparation and Characterization of Nanofibrillated Cellulose from
Bamboo Fiber via Ultrasonication Assisted by Repulsive Effect. Int. J. Polym. Sci. 2017, 2017, 1–9. [CrossRef]
10. Lin, N.; Dufresne, A. Nanocellulose in biomedicine: Current status and future prospect. Eur. Polym. J.
2014, 59, 302–325. [CrossRef]
11. Kargarzadeh, H.; Ioelovich, M.; Ahmad, I.; Thomas, S.; Dufresne, A. Methods for Extraction of Nanocellulose
from Various Sources. In Handbook of Nanocellulose and Cellulose Nanocomposites; Thomas, S., Dufresne, A.,
Ahmad, I., Kargarzadeh, H., Eds.; Wiley-VCH Verlag GmbH & Co. KGaA: Weinheim, Germania, 2017;
pp. 1–49. [CrossRef]
12. Namvar, F.; Jawaid, M.; Tahir, P.A.S. Potential use of plants fibres and their composites for biomedical
applications. Bioresources 2014, 9, 5688–5706. [CrossRef]
13. Yousefi, A.M.; Oudadesse, H.; Akbarzadeh, R.; Wers, E.; Lucas-Girot, A. Physical and biological characteristics
of nanohydroxyapatite and bioactive glasses used for bone tissue engineering. Nanotechnol. Rev.
2014, 3, 527–552. [CrossRef]
14. Bigdeli, A.K.; Lyer, S.; Detsch, R.; Boccaccini, A.R.; Beier, J.P.; Kneser, U.; Horch, R.E.; Arkudas, A.
Nanotechnologies in tissue engineering. Nanotechnol. Rev. 2013, 2, 411–425. [CrossRef]
15. Chirayil, C.J.; Mathew, L.; Thomas, S. Review of recent research in nano cellulose preparation from different
lignocellulosic fibers. Rev. Adv. Mater. Sci. 2014, 37, 20–28.
16. Kian, L.K.; Saba, N.; Jawaid, M.; Sultan, M.T.H. A review on processing techniques of bast fibers nanocellulose
and its polylactic acid (PLA) nanocomposites. Int. J. Biol. Macromol. 2019, 121, 1314–1328. [CrossRef]
17. Mishra, R.K.; Sabu, A.; Tiwari, S.K. Materials chemistry and the futurist eco-friendly applications of
nanocellulose: Status and prospect. J. Saudi Chem. Soc. 2018, 22, 949–978. [CrossRef]
18. Nechyporchuk, O.; Pignon, F.; Belgacem, M.N. Morphological properties of nanofibrillated cellulose produced
using wet grinding as an ultimate fibrillation process. J. Mater. Sci. 2014, 50, 531–541. [CrossRef]
19. Maciel, M.M.A.D.; Benini, K.C.C.D.C.; Voorwald, H.J.C.; Cioffi, M.O.H. Obtainment and characterization
of nanocellulose from an unwoven industrial textile cotton waste: Effect of acid hydrolysis conditions.
Int. J. Biol. Macromol. 2019, 126, 496–506. [CrossRef] [PubMed]
20. Chen, X.Q.; Pang, G.X.; Shen, W.H.; Tong, X.; Jia, M.Y. Preparation and characterization of the ribbon-like
cellulose nanocrystals by the cellulase enzymolysis of cotton pulp fibers. Carbohydr. Polym. 2019, 207, 713–719.
[CrossRef] [PubMed]
21. Kian, L.K.; Jawaid, M.; Ariffin, H.; Karim, Z. Isolation and characterization of nanocrystalline cellulose from
roselle-derived microcrystalline cellulose. Int. J. Biol. Macromol. 2018, 114, 54–63. [CrossRef] [PubMed]
22. Abbasi, R.; Baheti, V. Preparation of nanocellulose from jute fiber waste. J. Text. Eng. Fash. Technol. 2018, 4, 101–104.
[CrossRef]
23. Pelissari, F.M.; Menegalli, F.C. Isolation and characterization of cellulose nanofibers from banana peels.
Cellulose 2014, 21, 417–432. [CrossRef]
24. Krishnan, V.N.; Ramesh, A. Synthesis and Characterization of Surface Modified Cellulose Nanofibers from
Banana Peel. IOSR J. Appl. Chem. 2017, 10, 15–19. [CrossRef]
25. Xie, J.; Hse, C.Y.; De Hoop, C.F.; Hu, T.; Qi, J.; Shupe, T.F. Isolation and characterization of cellulose
nanofibers from bamboo using microwave liquefaction combined with chemical treatment and ultrasonication.
Carbohydr. Polym. 2016, 151, 725–734. [CrossRef] [PubMed]
26. Wu, Q.; Miao, W.; Zhang, Y.; Gao, H.; Hui, D. Mechanical properties of nanomaterials: A review.
Nanotechnol. Rev. 2020, 9, 259–273. [CrossRef]Materials 2020, 13, 4125 16 of 17
27. Lee, H.V.; Hamid, S.B.A.; Zain, S.K. Conversion of lignocellulosic biomass to nanocellulose: Structure and
chemical process. Sci. World J. 2014, 2014. [CrossRef] [PubMed]
28. Kafy, A.; Kim, H.C.; Zhai, L.; Kim, J.W.; Hai, L.V.; Kang, T.J.; Kim, J. Cellulose long fibers fabricated from
cellulose nanofibers and its strong and tough characteristics. Sci. Rep. 2017, 7, 1–8. [CrossRef]
29. Feng, Y.H.; Cheng, T.Y.; Yang, W.G.; Ma, P.T.; He, H.Z.; Yin, X.C.; Yu, X.X. Characteristics and environmentally
friendly extraction of cellulose nanofibrils from sugarcane bagasse. Ind. Crops Prod. 2018, 111, 285–291.
[CrossRef]
30. Zhang, Y.; Nypelo, T.; Salas, C.; Arboleda, J.; Hoeger, I.C.; Rojas, O.J. Cellulose Nanofibrils. J. Renew. Mater.
2013, 1, 195–211. [CrossRef]
31. Karim, Z.; Afrin, S. Bacterial cellulose: Preparation and Characterization. In Cellulose-Reinforced Nanofibre
Composites; Jawaid, M., Boufi, S., Khalil, A.H.P.S., Eds.; Woodhead Publishing: Cambridge, UK, 2017;
ISBN 9780081009659.
32. Huller, M.; Chernik, G.G.; Fokina, E.L.; Budim, N.I. Mechanical alloying in planetary mills of high accelerations.
Rev. Adv. Mater. Sci. 2008, 18, 366–374.
33. Suryanarayana, C. Mechanical alloying and milling. Prog. Mater. Sci. 2001, 46, 1–184. [CrossRef]
34. Lu, S.Y.; Mao, Q.J.; Peng, Z.; Li, X.D.; Yan, J.H. Simulation of ball motion and energy transfer in a planetary
ball mill. Chin. Phys. B 2012, 21, 1–9. [CrossRef]
35. Asim, M. Nanocellulose: Preparation Methods and Applications. In Cellulose-Reinforced Nanofibre Composites;
Jawaid, M., Boufi, S., Khalil, A.H.P.S., Eds.; Woodhead Publishing: Cambridge, UK, 2017; pp. 261–276.
ISBN 9780081009574.
36. Shak, K.P.Y.; Pang, Y.L.; Mah, S.K. Nanocellulose: Recent advances and its prospects in environmental
remediation. Beilstein J. Nanotechnol. 2018, 9, 2479–2498. [CrossRef] [PubMed]
37. Leite, A.L.M.P.; Zanon, C.D.; Menegalli, F.C. Isolation and characterization of cellulose nanofibers from
cassava root bagasse and peelings. Carbohydr. Polym. 2017, 157, 962–970. [CrossRef]
38. Ravindran, L.; Sreekala, M.S.; Thomas, S. Novel processing parameters for the extraction of cellulose
nanofibres (CNF) from environmentally benign pineapple leaf fibres (PALF): Structure-property relationships.
Int. J. Biol. Macromol. 2019, 131, 858–870. [CrossRef] [PubMed]
39. Plermjai, K.; Boonyarattanakalin, K.; Mekprasart, W.; Pavasupree, S.; Phoohinkong, W.; Pecharapa, W.
Extraction and characterization of nanocellulose from sugarcane bagasse by ball-milling-assisted acid
hydrolysis. AIP Conf. Proc. 2018, 2010. [CrossRef]
40. Segal, L.; Creely, J.J.; Martin, A.E.; Conrad, C.M. An Empirical Method for Estimating the Degree of
Crystallinity of Native Cellulose Using the X-Ray Diffractometer. Text. Res. J. 1959, 29, 786–794. [CrossRef]
41. Jonoobi, M.; Harun, J.; Shakeri, A.; Misra, M.; Oksmand, K. Chemical composition, crystallinity, and thermal
degradation of bleached and unbleached kenaf bast (Hibiscus cannabinus) pulp and nanofibers. BioResources
2009, 4, 626–639.
42. Niu, F.; Li, M.; Huang, Q.; Zhang, X.; Pan, W.; Yang, J.; Li, J. The characteristic and dispersion stability of
nanocellulose produced by mixed acid hydrolysis and ultrasonic assistance. Carbohydr. Polym. 2017, 165, 197–204.
[CrossRef] [PubMed]
43. Souza, A.G.D.; Kano, F.S.; Bonvent, J.J.; Rosa, D.D.S. Cellulose Nanostructures Obtained from Waste Paper
Industry: A Comparison of Acid and Mechanical Isolation Methods. Mater. Res. 2017, 20, 209–214. [CrossRef]
44. Beyene, D.; Chae, M.; Dai, J.; Danumah, C.; Tosto, F.; Demesa, A.G.; Bressler, D.C. Characterization of
cellulase-treated fibers and resulting cellulose nanocrystals generated through acid hydrolysis. Materials
2018, 11, 1272. [CrossRef]
45. Muhamad, M.; Hornsby, P.; Carmichael, E.; Zakaria, M.; Seok, Y.B.; Mohamed, S.; Sharma, S. Characterisation of
Cellulose Nanofibres Derived from Chemical and Mechanical Treatments. MATEC Web Conf. 2019, 253, 01002.
[CrossRef]
46. Mahardika, M.; Abral, H.; Kasim, A.; Arief, S.; Asrofi, M. Production of nanocellulose from pineapple leaf
fibers via high-shear homogenization and ultrasonication. Fibers 2018, 6, 28. [CrossRef]
47. Chen, W.; Yu, H.; Liu, Y.; Hai, Y.; Zhang, M.; Chen, P. Isolation and characterization of cellulose nanofibers
from four plant cellulose fibers using a chemical-ultrasonic process. Cellulose 2011, 18, 433–442. [CrossRef]
48. Santmartí, A.; Lee, K.Y. Crystallinity and Thermal Stability of Nanocellulose. In Production, Properties,
Applications, and Case Studies; Lee, K.Y., Ed.; CRC Press: Boca Raton, FL, USA, 2018.You can also read