A shape adjusted ellipse approach corrects for varied axonal dispersion angles and myelination in primate nerve roots
←
→
Page content transcription
If your browser does not render page correctly, please read the page content below
www.nature.com/scientificreports
OPEN A shape‑adjusted ellipse approach
corrects for varied axonal
dispersion angles and myelination
in primate nerve roots
Petra M. Bartmeyer1,2, Natalia P. Biscola1,3 & Leif A. Havton3,4,5,6*
Segmentation of axons in light and electron micrographs allows for quantitative high-resolution
analysis of nervous tissues, but varied axonal dispersion angles result in over-estimates of fiber
sizes. To overcome this technical challenge, we developed a novel shape-adjusted ellipse (SAE)
determination of axonal size and myelination as an all-inclusive and non-biased tool to correct for
oblique nerve fiber presentations. Our new resource was validated by light and electron microscopy
against traditional methods of determining nerve fiber size and myelination in rhesus macaques as
a model system. We performed detailed segmental mapping and characterized the morphological
signatures of autonomic and motor fibers in primate lumbosacral ventral roots (VRs). An en bloc inter-
subject variability for the preganglionic parasympathetic fibers within the L7-S2 VRs was determined.
The SAE approach allows for morphological ground truth data collection and assignment of individual
axons to functional phenotypes with direct implications for fiber mapping and neuromodulation
studies.
Significant advances in light and electron microscopy, using novel computer-assisted and automated image cap-
turing and tiling, digital segmentation, and quantitative studies of nerve fiber size and myelination, have markedly
increased the speed of data analysis and throughput, making possible new insights into the fine organization of
the nervous system at high resolution1–4. For instance, recent 3-dimensional ultrastructural studies and diffusion
magnetic resonance imaging (MRI), have suggested caliber fluctuations along myelinated axons and a non-linear
orientation for many myelinated fibers in nerve bundles3,5.
Theoretical and applied studies on the electrical, morphological, and conduction properties of myelinated
axons generally regard nerve fibers as cylindrical structures with a circular cross section6–15. However, these
well-established methods for determining nerve fiber size do not take into consideration atypical nerve fiber
shapes or the dispersion angle formed between each individual fiber segment’s direction and the mean direction
of the overall nerve bundle. Therefore, fibers sectioned at oblique planes present with an enlarged cross-sectional
area, and their size and degree of myelination are subsequently overestimated, when traditional morphometric
approaches are applied.
Accurate measurements of fiber size and myelination are critical for determining physiologic phenotypes
and developing improved theoretical neuromodulation models. Individual axons within a peripheral nerve
show a wide range of anatomical and physiological features, and each fiber may be classified into a distinct
physiologic type taking into consideration e.g. its axonal caliber, conduction velocity, and degree of myelination
or G-ratio16–20.
Here, we developed a novel approach for the correction of size and myelination of individual nerve fibers for
light and electron microscopy, taking into consideration the shape and dispersion angle for individual fibers, in a
rhesus macaque model system. The L6–S3 ventral roots (VRs) were selected as lumbosacral VRs carry large and
1
Department of Neurology, David Geffen School of Medicine at UCLA, Los Angeles, CA, USA. 2School of Electrical
and Computer Engineering at University of Campinas, Campinas, SP, Brazil. 3Department of Neurology, Icahn
School of Medicine at Mount Sinai, New York, NY 10029, USA. 4Departments of Neurology and Neurobiology,
David Geffen School of Medicine at UCLA, Los Angeles, CA, USA. 5Departments of Neurology and Neuroscience,
Icahn School of Medicine at Mount Sinai, New York, NY, USA. 6Neurology Service and RR&D National Center for
the Medical Consequences of Spinal Cord Injury, James J. Peters Veterans Administration Medical Center, Bronx,
NY, USA. *email: leif.havton@mssm.edu
Scientific Reports | (2021) 11:3150 | https://doi.org/10.1038/s41598-021-82575-9 1
Vol.:(0123456789)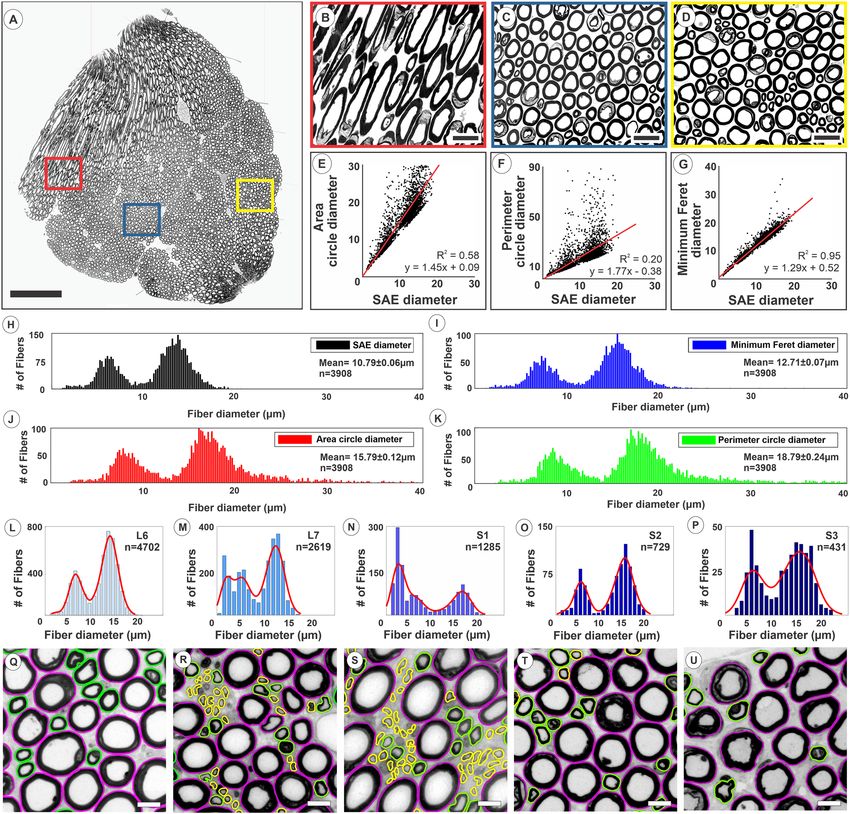
www.nature.com/scientificreports/
medium-sized α- and γ-motor fibers, respectively, and some VRs also carry small preganglionic parasympathetic
roperties21–24.
fibers, all readily identified based on size, myelination, and conduction p
Results
Left-sided L6-S3 VRs were removed intra-operatively and processed for light microscopy (LM) (Supplementary
Fig. S1). Initial LM studies indicated marked size and shape variations for myelinated axons of the L6–S3 VRs
(n = 6 subjects) (Fig. 1A–C). Quantitative assessments of myelinated fiber shape by multiple methods showed
similar deviations from a circular shape for all VRs (Fig. 1D, Supplementary Fig. S2). Pooled data across the
L6–S3 VRs computed the shape factor, form factor, aspect ratio, compactness, and roundness as 3.87 ± 0.02,
0.86 ± 0.01, 0.72 ± 0.01, 0.82 ± 0.01, and 0.69 ± 0.01 respectively. Corresponding values for a circle are 3.54 for
the shape factor and 1 for the other outcome measures. Collectively, extensive fiber shape heterogeneity and
inclusion of numerous non-circular fibers were demonstrated.
Our new tool to assess nerve fiber size is referred to as a shape-adjusted ellipse (SAE) approach to determine
fiber diameter and is based on five notions: (1) Natural nerve fiber shape is regarded as a cylinder, i.e. a geometric
figure with parallel sides and circular b ases12,13; (2) transverse sectioning of a cylinder at an acute angle results
in an ellipse-shaped cut surface (Fig. 1E); (3) sectioning of a cylinder at increasing tilt angles results in an ellipse
with progressively increasing cut surface area in a non-linear relationship (Fig. 1F–H); (4) the minor axis length
of an ellipse is identical to the diameter of the circular base, regardless of tilt angle or direction (Fig. 1F); (5)
an ellipse with a known perimeter and surface area represents a unique geometrical shape, and its minor axis
length can be calculated (Fig. 1I).
We next applied multiple methods to determine the diameter of myelinated fibers across L6–S3 VRs. Com-
pared to the SAE approach, the minimum Feret, area circle, and perimeter circle approaches significantly over-
estimated fiber diameters by 15.1%, 32.1%, and 42.9%, respectively (Fig. 1J, Supplementary Table S1).
Regression analysis showed the best fit between the SAE diameter and diameters determined by the mini-
mum Feret, area circle, and perimeter circle approaches, and numerous outliers were identified, especially for
the circle-based approaches (Fig. 2A–G). Graphical representations of VR fiber size showed, compared to the
SAE approach, a right-shift for the traditional methods, especially for circle-based methods. (Fig. 2H–K). The
SAE approach was subsequently applied to determine the size distribution of myelinated axons across the L6–S3
VRs in individual subjects (n = 6) (Figs. 2L–U, 3). Graphical representation of the fiber size distribution showed
a bimodal distribution of myelinated fibers in the α- and γ-motor fiber range in all L6 and S3 VRs. However, the
rostro-caudal size distribution of fibers in the small diameter range of pre-ganglionic autonomic fibers varied
extensively, as the additional fiber distribution peak was restricted to the L7 + S1 VRs (n = 4), S1 + S2 VRs (n = 1),
or across L7 + S1 + S2 VRs (n = 1) (Fig. 3).
Tissue blocks for the S2 VRs (n = 6) were processed for ultrastructural studies, and transmission electron
microscopy (TEM) determined the shape and size of unmyelinated axons (Supplementary Fig. S3). Electron
micrographs showed numerous unmyelinated axons of varied shape, interspersed between larger myelinated
axons and collagen fibers (Fig. 4A–F). The shape factor, form factor, aspect ratio, compactness, and roundness
were computed for the unmyelinated axons as 4.02 ± 0.06, 0.80 ± 0.02, 0.59 ± 0.02, 0.74 ± 0.02, and 0.56 ± 0.03
(n = 6), respectively, and they were markedly different from corresponding values for a circle (Supplementary
Fig. S4A–F). The findings show that unmyelinated fibers, similar to myelinated fibers, exhibit extensive shape
heterogeneity with the inclusion of many non-circular axons.
Next, we used the SAE approach to determine the diameter for S2 VR myelinated and unmyelinated axons
in a representative region of interest (n = 6). For determining the G-ratio, a code was developed to link the
centroid locations for the outer and inner myelin contours of individual segmented fibers. A broad distribution
range was suggested for the axon and fiber diameters and myelin thickness, whereas a single peak pattern was
showed for the G-ratio (Fig. 4G–J). The unmyelinated axons showed markedly smaller axon diameters than
those of the smallest myelinated fibers (Fig. 4K). For myelinated fibers, the G-ratio was positively correlated to
fiber diameter (Fig. 4L).
The SAE approach was also applied to show feasibility for determining nerve fiber size and myelination within
nervous tissue undergoing injury-induced degenerative changes. For this purpose, we examined the avulsed distal
segment of S2 VRs at 2, 12, and 18 months after an L6–S3 ventral root avulsion (VRA) injury (Supplementary
Fig. S5). Following a VRA-induced Wallerian degeneration of efferent motor and autonomic axons within the
avulsed S2 VR segment, quantitative studies showed a gradual post-operative re-population of the avulsed S2
VR by myelinated fibers. A parallel decrease over time in the number of myelinated fibers with degenerative
features was also noted in the avulsed S2 VR segments.
Discussion
The present study introduced the SAE approach as a new tool to determine nerve fiber diameter, regardless of
fiber dispersion angle, and has shown utility for the size analysis of both myelinated and unmyelinated fibers.
Traditional methods commonly apply the formula for a circle to calculate the diameter of a nerve fiber after
initial measurement of the fiber cross-sectional a rea8,10,11,14,15 or the fiber perimeter9,12. The convex shape of an
axon may also be taken into consideration when determining axonal size. For instance, the smallest distance
between a pair of antipodal points belonging to the convex hull of the axon has been used to estimate nerve
fiber diameters25, and the minimum Feret diameter has been used as a caliper measurement of nerve fiber size26.
However, these earlier methods do not consider the dispersion angle formed between each individual fiber seg-
ment’s direction and the mean direction of the overall nerve bundle. Instead, the present SAE approach, which
corrects for the fiber dispersion angle, markedly reduces the number of outliers and data scatter, especially when
Scientific Reports | (2021) 11:3150 | https://doi.org/10.1038/s41598-021-82575-9 2
Vol:.(1234567890)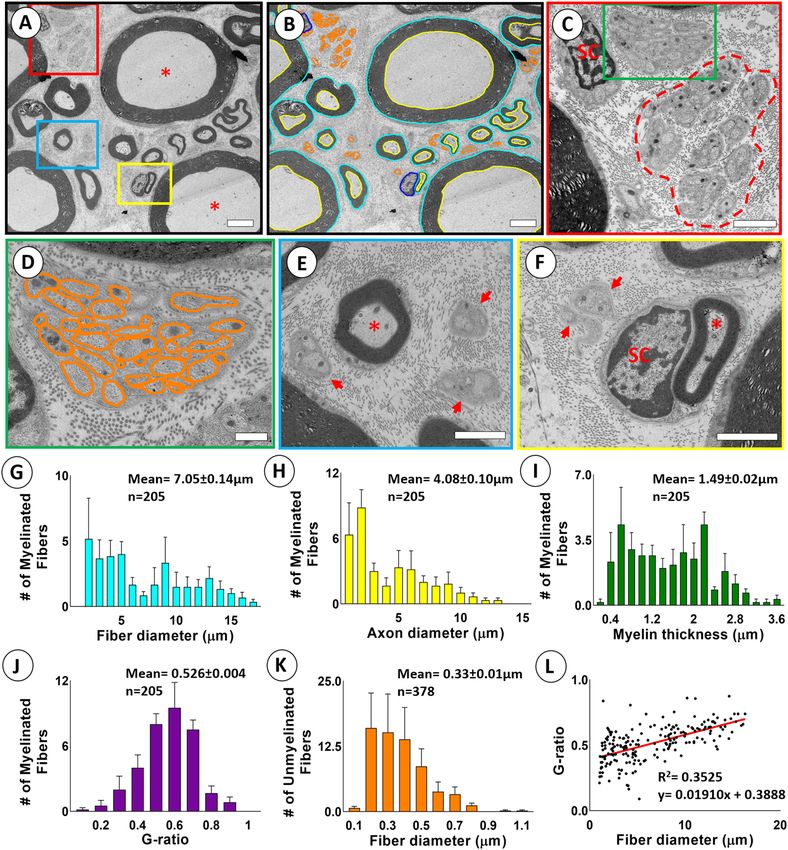
www.nature.com/scientificreports/
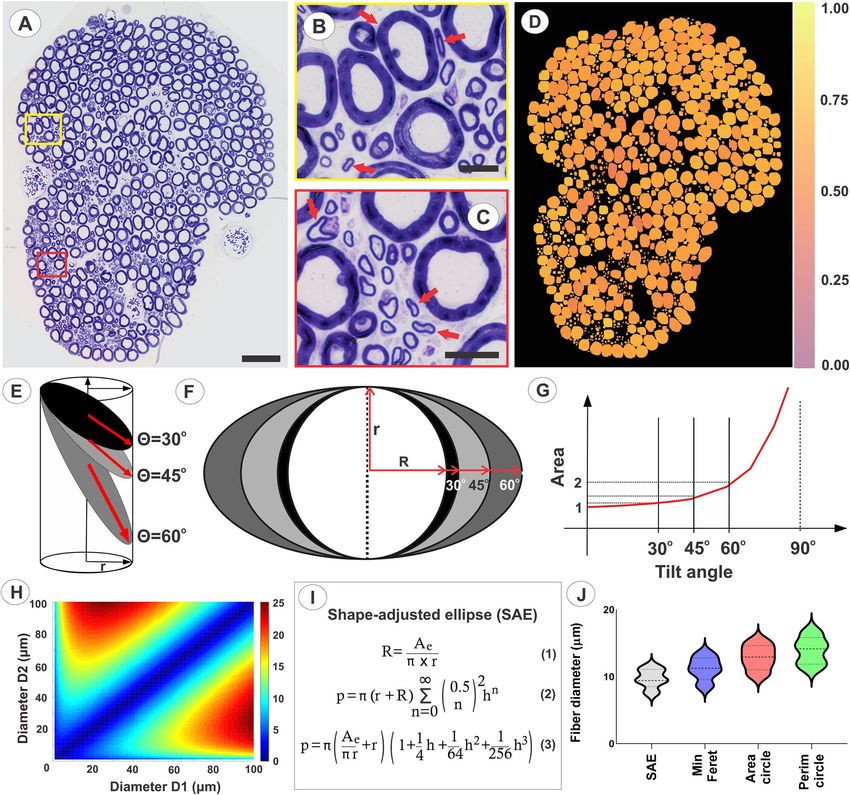
Figure 1. Shape adjusted ellipse (SAE) determination of nerve fiber size. (A) Transverse section of toluidine blue
stained S1 ventral root in a female rhesus macaque. Note cross-sections of myelinated fibers of varied sizes. (B,C)
Close-up view of boxed areas in (A), showing fiber shape heterogeneity, including presence of several elongated fiber
presentations. Arrows indicate examples of non-circular shapes. (D) Heat map for S1 ventral root in (A) showing
calculated roundness of myelinated fibers as a representative indicator for shape. Note marked heterogeneity of
roundness for fibers across all sizes. A calculated roundness of 1 indicates a circular shape. (E) Sectioning of a cylinder
with a circular base sectioned at different angles results in ellipse-shaped presentations of cut surfaces. (F) A cylinder in
(E) sectioned at increasing tilt angles shows increased elongation and length of the long diameter of the corresponding
ellipse-shaped cut surface. Note that the short diameter of the ellipse remains unchanged at all tilt angles. (G)
Graph depicting error with overestimation of cylinder diameter, when the formula for a circle is used to calculate
the diameter for the cross sectional surface of a cylinder cut at different tilt angles. Note the non-linear relationship
between ellipse tilt angle and progressive diameter overestimation, especially for tilt angles over 30 degrees. (H) Heat
map demonstration of the non-linear error introduced by an increasing difference between the two perpendicular
diameters of an ellipse, Diameters 1 and 2, when the formula for a circle is used to calculate the diameter. (I) Summary
of proposed SAE approach to calculate the minor diameter of an ellipse. The long-established formula for ellipse
area (Eq. (1)) is combined with a more recently developed infinite series formula for determine ellipse p erimeter56
(Eq. (2)). The SAE approach is based on the notion that an elongated 2-dimensional surface with a known area and
perimeter corresponds to a unique ellipse shape. The SAE equation is achieved by replacing R in Eq. (1) with Ae/πr
and expanding the first four terms of the infinite series (Eq. (3)). The equation is solved for r for a shape with known
area and perimeter, and the minor diameter for the ellipse is next calculated as 2r. A e = area of ellipse; R = long radius;
r = short radius; p = perimeter of ellipse; h = (R − r)2/(R + r)2. (J) Violin plots of fiber diameter distributions. The violin
plots show distributions myelinated fiber distributions with median and quartiles for diameters obtained by the SAE
approach as well as for minimum Feret diameters and circle-based diameters after determining fiber area or perimeter.
Note significant overestimations of fiber diameters when traditional methods were applied.
Scientific Reports | (2021) 11:3150 | https://doi.org/10.1038/s41598-021-82575-9 3
Vol.:(0123456789)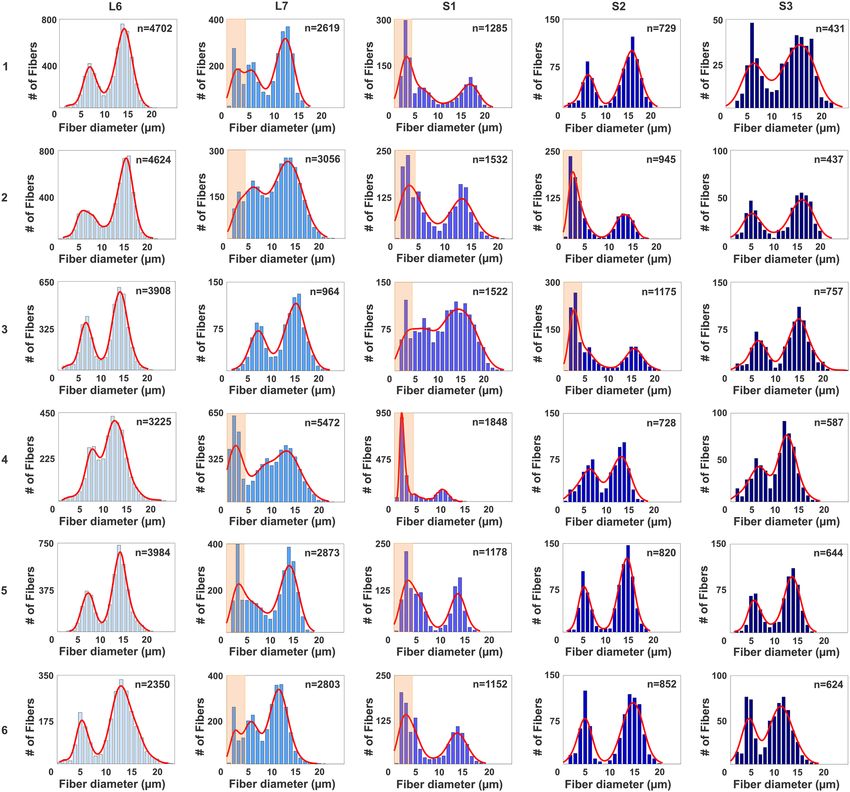
www.nature.com/scientificreports/

                                            Figure 2.  Validation of myelinated nerve fiber size determination using a SAE approach. (A) Light micrograph
                                            of a transverse section of an L6 VR in a rhesus macaque. Segmentation of all myelinated axons in the
                                            micrograph showed a total of 3,908 fibers. Red, blue, and yellow boxes show regions of interest depicted at
                                            higher magnification in (B–D) Note elongated fibers merging into main body of this proximal VR segment
                                            in (B). (E–G) Correlation graphs between calculated fiber diameter after SAE correction and corresponding
                                            diameters obtained by determining the Feret minimum diameter in or calculating the diameter based on the
                                            formula for the area or perimeter of a circle. Note dispersion of fiber diameters, especially for large diameter
                                            fibers based calculations using the circle formula approaches. (H–K) Frequency distribution graphs for
                                            myelinated fiber diameters determined using the SAE approach, Feret minimum diameter, and by calculating
                                            the diameter based on the formula for the area or perimeter of a circle. Note right-shift to larger diameters for
                                            both the γ- and α-motor fiber peaks and overestimation of diameters to non-physiologic range in estimates
                                            based on the formula for a circle. (L–P) Frequency distribution graphs for fiber diameters of myelinated axons
                                            in the L6–S3 VRs of one representative rhesus macaque. (Q–U) Representative areas of L6–S3 corresponding
                                            ROIs for segmented contours of myelinated fibers. Fibers with a diameter range of 0–4 µm are depicted in
                                            yellow, > 4–10 µm in green, and > 10 µm in magenta. Note presence of predominantly the smallest fibers of the
                                            0–4 µm diameter range, corresponding to myelinated autonomic fiber size, in the L7 and S1 VRs in this subject.
                                            Scales: 500 µm in (A); 50 µm in (B–D); 20 µm in (Q–U).

          Scientific Reports |   (2021) 11:3150 |                https://doi.org/10.1038/s41598-021-82575-9                                                 4

Vol:.(1234567890)
www.nature.com/scientificreports/
Figure 3. Myelinated fiber size and distribution across lumbosacral ventral roots (VRs) in rhesus macaques.
Display of myelinated fiber size distribution for L6–S3 VRs in six female rhesus macaques. Note bimodal
size distribution in all of the L6 and S3 VRs with size peaks corresponding to the large myelinated axons
represented by γ- and α-motor fibers21–23. Within the L7–S2 VR span, all subjects show an additional peak in 2
or 3 consecutive roots of small-sized myelinated axons, highlighted by salmon-colored boxes for fibers within
the 0–4 µm range. This population of fibers correspond to the small diameter of preganglionic parasympathetic
fibers24. Note extensive individual variation for the rostro-caudal distribution of the autonomic fiber population
with detection of this cohort of fibers predominantly in the L7 + S1 VRs (subjects 1, 4, 5, and 6), L7 + S1 + S2 VRs
(subject 2), or S1 + S2 VRs (subject 3).
compared to methods using the cross-sectional perimeter or area measurements and the formula for a circle to
determine fiber size.
The functional organization of the lumbosacral spinal cord in large mammals shows extensive variability
between subjects. Early mapping of lumbosacral VRs in rhesus macaques showed that specific motor fiber
innervation of lumbosacral roots varies en bloc along the rostro-caudal length of the spinal cord, resulting in a
pre- or post-fixed organizational p henotypes27. Similar shifts along the rostro-caudal distribution of the spinal
cord has been shown for the location of specific motor nuclei, which maintain the relative distances to adjacent
motor nuclei28,29. Our findings expand the notion of rostro-caudal variability of efferent projections from the
spinal cord between subjects, and that it also applies to preganglionic parasympathetic fibers of the autonomic
nervous system in primates.
Scientific Reports | (2021) 11:3150 | https://doi.org/10.1038/s41598-021-82575-9 5
Vol.:(0123456789)www.nature.com/scientificreports/
Figure 4. Determination of size and myelination of primate ventral roots using SAE correction in TEM.
(A) Representative electron micrograph from an S2 VR demonstrating myelinated fibers of varying sizes and
myelination and unmyelinated axons. *Indicates large myelinated axon. (B) Segmented electron micrograph
with outer and inner contours of myelinated fibers in blue and yellow, respectively. Contours of unmyelinated
fibers are in orange. (C) Detail of boxed are in (A) showing cluster of unmyelinated fibers. (D) Remak bundles
of unmyelinated fibers in green box in (C) with surrounding collagen fibers. (E) Detail of blue box in A. with
small myelinated fiber and adjacent unmyelinated fibers. (F) Detail of small myelinated fiber indicated by * and
Schwann cell nucleus (SC) in yellow box in (A). (G–K) Frequency distribution graphs of fiber diameter, axon
diameter, myelin thickness, and G-ratio for 205 myelinated fibers and fiber diameter for 378 unmyelinated
fibers from representative region of interests (ROIs) in S2 VRs of rhesus macaques (n = 6). (L) Graph depicting
correlation between fiber diameter and G-ratio of 205 myelinated fibers pooled from representative ROIs in S2
VRs of rhesus macaques (n = 6). Scales: 4 µm in (A,B); 2 µm in (C); 600 nm in (D); 2 µm in (E); 2 µm in (F).
Scientific Reports | (2021) 11:3150 | https://doi.org/10.1038/s41598-021-82575-9 6
Vol:.(1234567890)www.nature.com/scientificreports/
Neuromodulation strategies, including lumbosacral nerve root and spinal cord electrical stimulation, have
emerged and shown promise in attempts to map or augment lower urinary tract function in animal models
and humans. Such strategies include sacral nerve s timulation30,31, sacral anterior root stimulation (SARS)32,33,
epidural stimulation34,35, and transcutaneous spinal cord s timulation36,37. In clinical practice, neuromodulation
has demonstrated promise for the treatment of an overactive bladder syndrome but symptom relief and overall
treatment success vary between patients38. Improved anatomical mapping tools, including the SAE approach
for fiber size corrections, to determine normal variability of autonomic nerve fiber distributions in lumbosacral
roots may facilitate development of refined neuromodulation strategies for relieving neuro-urological conditions.
Studies of nerve regeneration to overcome paralysis in experimental models include morphological exami-
nation of myelinated and unmyelinated axons, which may extend across denervated tissues in the spinal cord
or peripheral nervous system. Signs of regeneration in the nervous system include injury-induced branching of
fibers and axonal extensions, which are under the influence of local guidance molecules and characteristically
show a multitude of growth patterns and d irections39–41. Regenerating axons may therefore show an especially
large variety of dispersion angles at cut surfaces of intramedullary fiber tracts and peripheral nerves sectioned
in the transverse plane. Here, we show examples of avulsed S2 VRs, which have undergone Wallerian degenera-
tion followed by re-population of the distal VR segment by myelinated axons. Although the proximal end of the
avulsed VR segment remained separated from the spinal cord, the VRs were gradually repopulated by myelinated
axons over time. These findings are consistent with prior reports suggesting innervation of denervated VRs by
sensory fibers, possibly including U-turning ventral root a fferents42,43. The SAE approach to determine fiber size
and myelination across injury and disease models will allow for improved predictions of functional properties
in translational studies of neural repair and nerve regeneration.
We conclude that our SAE approach for size correction of cylindrical structures in sectional planes pro-
vides a useful and novel tool determining size and myelination of segmented nerve fibers in light and electron
microscopy. The SAE approach allows for non-biased data inclusion and size correction of all myelinated and
unmyelinated nerve fibers, regardless of fiber dispersion angle. SAE corrections of fiber size and myelination
provides refined ground truth data on the morphological signatures of subsets of fibers in mixed nerves and
white matter tracts. SAE-corrected fiber size measurements may also contribute to refined nerve stimulation
models for emerging strategies to reverse conditions by neuromodulation in translational and clinical research
studies. In addition, the SAE approach may have expanded utility for size corrections of all tubular structures
imaged in oblique planes in biological tissues, including blood vessels, excretory ducts, and airways, not only by
microscopy, but also when using non-invasive imaging strategies.
Methods
The present study was performed using archived lumbosacral ventral root tissues from female rhesus macaques
(Macaca mulatta). The subjects were 9.0 ± 0.7 years old and weighed 8.09 ± 0.79 kg (n = 6). The nerve root samples
were originally harvested as control samples during a ventral root injury procedure in connection with separate
research studies on cauda equina and conus medullaris forms of spinal cord injury in rhesus macaques44,45. A
brief description of the original tissue harvesting is provided below.
Animal procedures. All animal procedures were performed at the California National Primate Research
Center (CNPRC), University of California at Davis. The institution is accredit by the Association for Assessment
and Accreditation of Laboratory Animal Care (AAALAC) and all procedures were approved by the UC Davis
Institutional Animal Care and Use Committee (IACUC). In addition to the certification already cited all animal
procedures and care were performed in compliance with the Guide for the Care and Use of Laboratory Animals
provided by the Institute for Laboratory Animal Research46. Guidelines for ARRIVE 2.0 for the care and use of
laboratory animals were also followed47–49.
Lumbosacral ventral roots (VRs) were harvested after a pre-operative lumbar magnetic resonance imaging
(MRI), spine radiographs, and intra-operative identification of individual segmental levels. Pre-operative imaging
was performed to determine the relationship between the vertebral column and spinal cord and to plan spine sur-
gery. A surgical plane of anesthesia was established by 1–2% isoflurane in O 2 via endotracheal tube and 7–10 µg/
kg/min fentanyl iv. Following a skin incision over the L1–L5 spinous processes, a left-sided laminectomy of the
caudal aspect of the L1 vertebra to the rostral part of the L3 vertebra, and opening of the dura, the L6-S3 VRs
were identified based on anatomical landmarks and size characteristics43–45,50. The left L6–S3 VRs were avulsed
from the surface of the spinal cord by gentle traction using a pair of fine forceps, and an approximately 5 mm
segment of each avulsed L6–S3 VR was removed and placed in a solution containing 2% paraformaldehyde (PF)
and 2.5% glutaraldehyde (Glut) in phosphate buffered saline (PBS, pH 7.4), for tissue fixation and subsequent
processing for light and electron microscopy. The distal portion of each L6–S3 VR was deflected from the spinal
cord, the dura closed using a continuous 6-0 ETHILON suture, the paraspinous muscles and fascia closed in
layers, and the skin closed using 4-0 VICRYL sutures. All animals recovered post-operativelyn.
In three subjects, the spinal cord and associated lumbosacral nerve roots were harvested post-operatively at
2 months (n = 1), 12 months (n = 1), and 18 months (n = 1) to provide VRs for the present studies. The post-op
tissues were collected after a necropsy procedure, which included intravascular perfusion using a 4% PF solu-
tion. The lumbosacral VRs were dissected out and post-fixed for 24 h in a 2% PF + 2.5% Glut solution in PBS.
Light microscopy and shape analysis. Following the intra- and post-operative harvesting of the L6-S3
VR segments, the tissues were prepared for light microscopic analysis according to our proposed pipeline for
tissue processing, imaging, and analysis (Supplementary Fig. S1). In short, after the immersion fixation in a 2%
PF + 2.5% Glut solution in PBS, the VR segments were rinsed in phosphate buffer, osmicated in 1% osmium
Scientific Reports | (2021) 11:3150 | https://doi.org/10.1038/s41598-021-82575-9 7
Vol.:(0123456789)www.nature.com/scientificreports/
tetroxide (OsO4), rinsed in aqueous solution, dehydrated in ascending concentrations of ethanol, infiltrated
in 50% propylene oxide (PO) + 50% Epon plastic resin, and embedded in 100% Epon (Supplementary Fig. S1,
steps 1–5). Next, semi-thin transverse sections were cut at 0.5 µm thickness and stained with a 1% toluidine blue
solution (Supplementary Fig. S1, step 6). All tissue sections were inspected by light microscopy before inclusion
into the analysis to ensure visualization of the full circumference of the epineurium and anatomical integrity of
all fascicles within each VR. Serial light microscopic images of the entire VR cross section were obtained at ×
100 magnification, and the images were tiled to generate a photo-montage using a Nikon E600 light microscope
equipped with a DS-Fi3 camera and Nikon NIS-Elements software (Supplementary Fig. S1, steps 7–8). The
contour of each myelinated fiber for the L6–S3 VRs in all subject was segmented with manual or supervised
approaches using Fiji ImageJ51, or Neurolucida 360 (MBF Bioscience) to determine the cross-sectional area,
perimeter as well as the maximum and minimum Feret diameters for subsequent shape analysis of all myelinated
fibers (Supplementary Fig. S1, step 9). Next, an array of five established metrics were used to perform mathemat-
ical descriptions of shape, previously developed and validated across multiple disciplines, including pathology,
paleontology, and social science to determine the shape of e.g. tumors, bones, calcifications, and geographical
objects52–59. We determined shape factor, form factor, aspect ratio, compactness, and roundness to assess how
closely each myelinated fiber may correspond to the shape of a circle according to the formulas and descriptions
below (Supplementary Fig. S1, step 10).
Shape features Formula Description
Ratio between the perimeter of the shape and the square root of the
Shape factor Perimeter
√
Area area. For a circle, the shape factor is equal to 3.54
Ratio between the area of the shape and the area of a circular convex
Form factor 4πArea hull calculate from the perimeter. For a circular shape, the form factor
Perimeter 2
is equal to 1
Ratio of the minimum Feret diameter to the maximum Feret diam-
Aspect ratio MinFeret
MaxFeret eter of the shape. For a circle, the aspect ratio is equal to 1
Ratio between the radius of a circle based on the shape Area divided
4
Compactness π Area
MaxFeret by the maximum Feret diameter. Compactness of a circle is equal to 1
Ratio between the area of the shape and the area of a convex hull
Roundness 4Area encompassing the shape. A perfect circle has roundness value equal
πMaxFeret 2
to 1
Morphometric analysis. Light microscopic analysis were performed to determine shape and size of myeli-
nated fibers. To accommodate for myelinated axonal profiles, which deviate from a circular shape in the sec-
tional plane, a new approach to determine fiber size and myelination was developed. Here, all myelinated fibers
are considered to have the shape of a cylinder with a circular base, and the cross-sectional profile of each fiber
was considered to present the area and perimeter of an ellipse with a dispersion angle between the direction of
the individual fiber and the overall orientation of the VR segment. The dispersion, or tilt, angle can be estimated.
For the ellipsoid shape, the semi-minor axis r is equal to the radius of the cylinder’s base, thus the semi-major
axis R can be defined using r by R = r/cos(θ). Consider the formula for ellipse area Ae = π × r × R , where r is
the length of the semi-minor axis and R is the length of the semi-major axis of the ellipse. Both R and r originate
at the center of the ellipse. Replacing R by r/ cos (θ), the ellipse area can be rewritten as Ae = π × r × r/cos(θ).
In this way, the ellipse area is related to the tilt angle (θ) and relation between the ellipse area ( Ae) and the area
of the original circle-shape Ac = πr2 can be expressed as Ae = ρ Ac , where ρ = 1/cos(θ). The parameter ρ
computes the error introduced when applying the circle approach to calculate the size of a nerve fiber. Note that,
for the cases where the nerve fiber is a perfect circle, ρ value is equal to one and there is no difference between
the approaches.
It is possible to calculate the smallest diameter of ellipse combining the formula for the area of an ellipse (1)
Ae
R= (1)
πxr
and an infinite series formula for the ellipse perimeter (2)60
∞
2
0.5
ρ = π(r + R) hn (2)
n
n=0
2
where h = (R−r)
(R+r)2
. The Eq. (3) is achieve by replacing R in (2) by (1) and expanding the first four terms of the
infinite series
Ae 1 1 1 3
ρ=π + r 1 + h + h2 + h (3)
πr 4 64 256
2
where h = πr −Ae
πr2 +Ae
.
When the values for the area and perimeter are known, the length of the semi-minor axis r is calculated by
solving Eq. (3) using the Newton method. The value of the minor axis, i.e. fiber diameter, is next calculated as
two times the value of r.
We have developed a code to calculate r and the smallest fiber diameter using our shape-adjusted ellipse (SAE)
approach in MATLAB. All MATLAB codes used in the calculations, the input and output data, information
Scientific Reports | (2021) 11:3150 | https://doi.org/10.1038/s41598-021-82575-9 8
Vol:.(1234567890)www.nature.com/scientificreports/
regarding their development, and directions for code use are available at www.github.com/petrabartmeyer/
ShapeAdjustedEllipse.
For SAE approach validation and comparisons across methods, the size of myelinated axons was also deter-
mined by implementing long-established approaches of calculating the fiber diameter using the formula for
a circle and measurements of the cross-sectional area8,10,11,14,15 or perimeter9,12. Additional comparisons were
made with fiber size estimates based on the previously established approach of determining the minimum Feret
diameter for each myelinated axon26. Linear regression analysis was performed to determine the coefficient of
determination, R2, with fiber size based on our SAE approach as the dependent variable and fiber size obtained
by a traditional method as the independent variable.
Electron microscopy. Ultrathin sections (70–90 nm), from the segments of the S2 ventral nerve root pre-
viously embedded in resin (n = 6) were obtained in an ultramicrotome (RMC PowerTome Ultramicrotome,
Boeckeler Instruments), collected on formvar-coated single slot grids, contrasted with uranyl acetate and lead
citrate (Supplementary Fig. S3, steps 1–8). The sections were analyzed under a transmission electron microscope
operating at 80 kV (Tecnai G2 Spirit Twin, FEI, ThermoFisher Scientific, or Hitachi H-7500). A region of inter-
est (ROI) composed by 52 electron micrographs at 1500X magnification (average area = 6135.67 ± 89.87 µm2)
from the S2 VRs of each animal (n = 6) was photographed using a Gatan Orius SC 1000B digital camera (Gatan,
Inc.) or AMT camera (Supplementary Fig. S3, step 9). The tiling of the ROI images were performed by Adobe
Photoshop (version: 21.1.3 20200508) or Image Composite Editor (ICE, Microsoft) (Supplementary Fig. S3, step
10). Data segmentation of each myelinated and unmyelinated axon was performed with manual or supervised
approaches using Fiji I mageJ51, or Neurolucida 360 (MBF Bioscience). Both programs generated raw data files
for the area, perimeter, centroid, as well as the maximum and minimum Feret diameters for each nerve fiber
(Supplementary Fig. S3, step 11). The shape factor, form factor, aspect ratio, compactness, and roundness of
all unmyelinated fibers were next determined within the ROI for each S2 VR (Supplementary Fig. S3, step 12).
The outer and inner contours of the myelin for each myelinated fiber were also segmented to allow for the
calculation of both the fiber and axon diameters. Calculations of myelin thickness and the G-ratio, as the ratio
between the diameter of the axon proper and diameter of the corresponding myelinated fiber, require linkage
between each axon and fiber pair. Although both Fiji ImageJ51 and Neurolucida 360 allow for the differentiation
between segmented fiber and axon structures, neither one of the software products can automatically link an
axon structure to its corresponding fiber structure. To overcome this limitation and to allow for the calculation
of myelination parameters, we developed an assignment routine based on the centroids of the structures. The
routine calculates the Euclidean distance between each axon structure and all the fiber structures. This procedure
creates the distance matrix used to guide the assignment problem. The solution of the assignment problem returns
the optimal match between axon and fiber structures. The assignment routine was implemented in MATLAB
using the Hungarian method to solve the assignment problem. The routine is available at Github repository at
www.github.com/petrabartmeyer/ShapeAdjustedEllipse.
The segmented data was used for light microscopic and ultrastructural analysis, including SAE morphometric
calculations of fiber diameter, axon diameter, myelin thickness (myelin thickness = (fiber diameter − axon diam-
eter)/2)), and G-ratio (G-ratio = axon diameter/fiber diameter) for myelinated axons (Supplementary Fig. S1,
steps 11, 12; Supplementary Fig. S3, steps 13, 14).
Statistics. All data are presented as mean ± standard error (SE). Methods to determine fiber diameter were
compared using repeated measures one-way ANOVA with the Geisser–Greenhouse correction. This was fol-
lowed by Tukey’s multiple comparisons test with individual variances computed for each comparison. Linear
regression analysis was performed to determine the coefficient of determination, R2, as a goodness-of-fit meas-
ure between dependent and independent variables. The non-parametric ANOVA One-way testing followed by
the Kruskal–Wallis test and Dunn’s multiple comparison test were performed for comparisons between groups
using GraphPad Prism 8, version 8.4.3 (GraphPad Software, Inc, La Jolla, CA) https://www.graphpad.com/. A
value of p < 0.05 was considered to reflect a statistically significant difference between groups. Frequency distri-
butions for all fiber shape and morphometric size analyses were calculated and plotted using GraphPad Prism
8, version 8.4.3, https://www.graphpad.com/. An interpolation curve frequency distribution analysis was also
included for the frequency distribution of fiber size in individual VRs, and the analysis was coded in MATLAB,
using the function “histfit”. The distribution function considered the option “kernel”, which uses a nonparamet-
ric kernel-smoothing distribution strategy.
Data availability
Any raw data supporting the current study is available from the corresponding author upon reasonable request.
Code availability
The code used in the calculations, the input and output data, information regarding their development, and
directions for code use are available at www.github.com/petrabartmeyer/ShapeAdjustedEllipse.
Received: 23 October 2020; Accepted: 21 January 2021
References
1. Zaimi, A. et al. AxonSeg: Open source software for axon and myelin segmentation and morphometric analysis. Front. Neuroinform.
10, 37. https://doi.org/10.3389/fninf.2016.00037 (2016).
Scientific Reports | (2021) 11:3150 | https://doi.org/10.1038/s41598-021-82575-9 9
Vol.:(0123456789)www.nature.com/scientificreports/
2. Zaimi, A. et al. AxonDeepSeg: Automatic axon and myelin segmentation from microscopy data using convolutional neural net-
works. Sci. Rep. 8, 3816. https://doi.org/10.1038/s41598-018-22181-4 (2018).
3. Giacci, M. K. et al. Three dimensional electron microscopy reveals changing axonal and myelin morphology along normal and
partially injured optic nerves. Sci. Rep. 8, 3979. https://doi.org/10.1038/s41598-018-22361-2 (2018).
4. Abdollahzadeh, A., Belevich, I., Jokitalo, E., Tohka, J. & Sierra, A. Automated 3D axonal morphometry of white matter. Sci. Rep.
9, 6084. https://doi.org/10.1038/s41598-019-42648-2 (2019).
5. Lee, H. H. et al. Along-axon diameter variation and axonal orientation dispersion revealed with 3D electron microscopy: Implica-
tions for quantifying brain white matter microstructure with histology and diffusion MRI. Brain Struct. Funct. 224, 1469–1488.
https://doi.org/10.1007/s00429-019-01844-6 (2019).
6. Donaldson, H. H. & Hoke, G. W. On the areas of the axis cylinder and medullary sheath as seen in cross sections of the spinal
nerves of vertebrates. J. Comp. Neurol. Psychol. 15, 1–16. https://doi.org/10.1002/cne.920150102 (1905).
7. Hodgkin, A. L. & Rushton, W. A. The electrical constants of a crustacean nerve fibre. Proc. R. Soc. Med. 134, 444–479. https://doi.
org/10.1098/rspb.1946.0024 (1946).
8. Dyck, P. J., Gutrecht, J. A., Bastron, J. A., Karnes, W. E. & Dale, A. J. Histologic and teased-fiber measurements of sural nerve in
disorders of lower motor and primary sensory neurons. Mayo Clin. Proc. 43, 81–123 (1968).
9. Arbuthnott, E. R., Ballard, K. J., Boyd, I. A. & Kalu, K. U. Quantitative study of the non-circularity of myelinated peripheral nerve
fibres in the cat. J. Physiol. 308, 99–123. https://doi.org/10.1113/jphysiol.1980.sp013464 (1980).
10. Gillespie, M. J. & Stein, R. B. The relationship between axon diameter, myelin thickness and conduction velocity during atrophy
of mammalian peripheral nerves. Brain Res. 259, 41–56. https://doi.org/10.1016/0006-8993(83)91065-X (1983).
11. Nukada, H., Dyck, P. J. & Karnes, J. L. Thin axons relative to myelin spiral length in hereditary motor and sensory neuropathy,
type I. Ann. Neurol. 14, 648–655. https://doi.org/10.1002/ana.410140608 (1983).
12. Hoffman, P. N., Griffin, J. W. & Price, D. L. Control of axonal caliber by neurofilament transport. J. Cell Biol. 99, 705–714. https://
doi.org/10.1083/jcb.99.2.705 (1984).
13. Koch, C. Cable theory in neurons with active, linearized membranes. Biol. Cybern. 50, 15–33. https: //doi.org/10.1007/BF0031 7936
(1984).
14. Lamantia, A. S. & Rakic, P. Cytological and quantitative characteristics of four cerebral commissures in the rhesus monkey. J.
Comp. Neurol. 291, 520–537. https://doi.org/10.1002/cne.902910404 (1990).
15. Perge, J. A., Niven, J. E., Mugnaini, E., Balasubramanian, V. & Sterling, P. Why do axons differ in caliber?. J. Neurosci. 32, 626–638.
https://doi.org/10.1523/JNEUROSCI.4254-11.2012 (2012).
16. Erlanger, J. & Gasser, H. S. The compound nature of the action current in nerve as disclosed by the cathode ray oscillograph. Am.
J. Physiol. 70, 624–666. https://doi.org/10.1152/ajplegacy.1924.70.3.624 (1924).
17. Smith, R. S. & Koles, Z. J. Myelinated nerve fibers: Computed effect of myelin thickness on conduction velocity. Am. J. Physiol.
219, 1256–1258. https://doi.org/10.1152/ajplegacy.1970.219.5.1256 (1970).
18. Waxman, S. G. Determinants of conduction velocity in myelinated nerve fibers. Muscle Nerve 3, 141–150. https://doi.org/10.1002/
mus.880030207 (1980).
19. Seidl, A. H., Rubel, E. W. & Barría, A. Differential conduction velocity regulation in ipsilateral and contralateral collaterals inner-
vating brainstem coincidence detector neurons. J. Neurosci. 34, 4914–4919. https://doi.org/10.1523/JNEUROSCI.5460-13.2014
(2014).
20. de Moraes, E. R., Kushmerick, C. & Naves, L. A. Morphological and functional diversity of first-order somatosensory neurons.
Biophys. Rev. 9, 847–856. https://doi.org/10.1007/s12551-017-0321-3 (2017).
21. Kawamura, Y., Okazaki, H., O’Brien, P. C. & Dyck, P. J. Lumbar motoneurons of man: I. Number and diameter histogram of alpha
and gamma axons of ventral root. J. Neuropathol. Exp. Neurol. 36, 853–860. https://doi.org/10.1097/00005072-197709000-00009
(1977).
22. Cullheim, S. & Ulfhake, B. Observations on the morphology of intracellularly stained gamma-motoneurons in relation to their
axon conduction velocity. Neurosci. Lett. 13, 47–50. https://doi.org/10.1016/0304-3940(79)90073-9 (1979).
23. Destombes, J., Horcholle-Bossavit, G., Thiesson, D. & Jami, L. Alpha and gamma motoneurons in the peroneal nuclei of the cat
spinal cord: an ultrastructural study. J. Comp. Neurol. 317, 79–90. https://doi.org/10.1002/cne.903170106 (1992).
24 Morgan, C. W. Axons of sacral preganglionic neurons in the cat: I. Origin, initial segment, and myelination. J. Neurocytol. 30,
523–544. https://doi.org/10.1023/A:1015649419346 (2001).
25. Novas, R. B., Fazan, V. P. & Felipe, J. C. A new method for automated identification and morphometry of myelinated fibers through
light microscopy image analysis. J. Digit. Imaging 29, 63–72. https://doi.org/10.1007/s10278-015-9804-6 (2016).
26. Xin, W. et al. Oligodendrocytes support neuronal glutamatergic transmission via expression of glutamine synthetase. Cell Rep. 27,
2262–2271. https://doi.org/10.1016/j.celrep.2019.04.094 (2019).
27. Sherrington, C. S. Notes on the arrangement of some motor fibres in the lumbo-sacral plexus. J. Physiol. 13, 621–772. https://doi.
org/10.1113/jphysiol.1892.sp000428 (1892).
28. Vanderhorst, V. G. & Holstege, G. Organization of lumbosacral motoneuronal cell groups innervating hindlimb, pelvic floor,
and axial muscles in the cat. J. Comp. Neurol. 382, 46–76. https://doi.org/10.1002/(SICI)1096-9861(19970526)382:1%3c46::AID-
CNE4%3e3.0.CO;2-K (1997).
29. Gross, C., Ellison, B., Buchman, A. S., Terasawa, E. & VanderHorst, V. G. A novel approach for assigning levels to monkey
and human lumbosacral spinal cord based on ventral horn morphology. PLoS ONE 12, e0177243. https://doi.org/10.1371/journ
al.pone.0177243 (2017).
30. Scheepens, W. A., de Bie, R. A., Weil, E. H. & van Kerrebroeck, P. E. Unilateral versus bilateral sacral neuromodulation in patients
with chronic voiding dysfunction. J. Urol. 168, 2046–2050. https://doi.org/10.1016/S0022-5347(05)64292-9 (2002).
31. van Kerrebroeck, P. E. et al. Results of sacral neuromodulation therapy for urinary voiding dysfunction: Outcomes of a prospective,
worldwide clinical study. J. Urol. 178, 2029–2034. https://doi.org/10.1016/j.juro.2007.07.032 (2007).
32. Brindley, G. S. Sacral root and hypogastric plexus stimulators and what these models tell us about autonomic actions on the bladder
and urethra. Clin. Sci. (Lond.) 70(Suppl 14), 41s–44s. https://doi.org/10.1042/cs070s041 (1986).
33. Brindley, G. S. & Rushton, D. N. Long-term follow-up of patients with sacral anterior root stimulator implants. Paraplegia 28,
469–475. https://doi.org/10.1038/sc.1990.63 (1990).
34. Chang, H. H., Yeh, J. C., Ichiyama, R. M., Rodriguez, L. V. & Havton, L. A. Mapping and neuromodulation of lower urinary tract
function using spinal cord stimulation in female rats. Exp. Neurol. 305, 26–32. https://doi.org/10.1016/j.expneurol.2018.03.007
(2018).
35. Herrity, A. N., Williams, C. S., Angeli, C. A., Harkema, S. J. & Hubscher, C. H. Lumbosacral spinal cord epidural stimulation
improves voiding function after human spinal cord injury. Sci. Rep. 8, 8688. https://doi.org/10.1038/s41598-018-26602-2 (2018).
36. Gad, P. N., Kokikian, N., Christe, K. L., Edgerton, V. R. & Havton, L. A. Noninvasive neurophysiological mapping of the lower
urinary tract in adult and aging rhesus macaques. J. Neurophysiol. 119, 1521–1527. https://doi.org/10.1152/jn.00840.2017 (2018).
37. Havton, L. A., Christe, K. L., Edgerton, V. R. & Gad, P. N. Noninvasive spinal neuromodulation to map and augment lower urinary
tract function in rhesus macaques. Exp. Neurol. 322, 113033. https://doi.org/10.1016/j.expneurol.2019.113033 (2019).
38. Janssen, D. A., Martens, F. M., de Wall, L. L., van Breda, H. M. & Heesakkers, J. P. Clinical utility of neurostimulation devices in the
treatment of overactive bladder: current perspectives. Med. Devices (Auckl.) 10, 109–122. https://doi.org/10.2147/MDER.S1156
78 (2017).
Scientific Reports | (2021) 11:3150 | https://doi.org/10.1038/s41598-021-82575-9 10
Vol:.(1234567890)www.nature.com/scientificreports/
39. Steward, O., Zheng, B. & Tessier-Lavigne, M. False resurrections: Distinguishing regenerated from spared axons in the injured
central nervous system. J. Comp. Neurol. 459, 1–8. https://doi.org/10.1002/cne.10593 (2003).
40. Sofroniew, M. V. Dissecting spinal cord regeneration. Nature 557, 343–350. https://doi.org/10.1038/s41586-018-0068-4 (2018).
41 Dun, X. P. & Parkinson, D. B. Classic axon guidance molecules control correct nerve bridge tissue formation and precise axon regen-
eration. Neural Regen. Res. 15, 6–9. https://doi.org/10.4103/1673-5374.264441 (2020).
42 Hildebrand, C., Karlsson, M. & Risling, M. Ganglionic axons in motor roots and pia mater. Prog. Neurobiol. 51, 89–128. https://
doi.org/10.1016/s0301-0082(96)00052-4 (1997).
43. Ohlsson, M., Nieto, J. H., Christe, K. L. & Havton, L. A. Long-term effects of a lumbosacral ventral root avulsion injury on axoto-
mized motor neurons and avulsed ventral roots in a non-human primate model of cauda equina injury. Neuroscience 250, 129–139.
https://doi.org/10.1016/j.neuroscience.2013.06.054 (2013).
44. Nieto, J. H. et al. Surgical replantation of avulsed lumbosacral ventral roots and urodynamic studies in a rhesus macaque (Macaca
mulatta) model of cauda equina/conus medullaris injury and repair. In Animal Models of Neurotrauma (eds Risling, M. & Davids-
son, J.) 207–222 (Humana Press, New York, 2019).
45. Chang, H. H. et al. EMG characteristics of the external anal sphincter guarding reflex and effects of a unilateral ventral root avul-
sion injury in rhesus macaques (Macaca mulatta). J. Neurophysiol. 120, 2710–2718. https://doi.org/10.1152/jn.00435.2017 (2018).
46 Institute for Laboratory Animal Research Guide for the Care and Use of Laboratory Animals. Guide for the Care and Use of Labora-
tory Animals 8th edn. (National Academies Press, Washington, DC, 2011).
47. Biscola, N. P., Christe, K. L., Rosenzweig, E. S., Tuszynsk, M. H. & Havton, L. A. Sexual dimorphism of detrusor function demon-
strated by urodynamic studies in rhesus macaques. Sci. Rep. 10, 16170. https://doi.org/10.1038/s41598-020-73016-0 (2020).
48. Havton, L. A., Biscola, N. P., Christe, K. L. & Colman, R. J. Ketamine-induced neuromuscular reactivity is associated with aging
in female rhesus macaques. PLoS ONE 15, e0236430. https://doi.org/10.1371/journal.pone.0236430 (2020).
49 Percie du Sert, N. et al. Reporting animal research: Explanation and elaboration for the ARRIVE guidelines 20. PLoS Biol. 18,
e3000411. https://doi.org/10.1371/journal.pbio.3000411 (2020).
50. Ohlsson, M., Nieto, J. H., Christe, K. L., Villablanca, J. P. & Havton, L. A. Radiographic and magnetic resonance imaging identi-
fication of thoracolumbar spine variants with implications for the positioning of the conus medullaris in rhesus macaques. Anat.
Rec. 300, 300–308. https://doi.org/10.1002/ar.23495 (2017).
51. Rasband, W. S. ImageJ, U. S. National Institutes of Health, Bethesda, Maryland, USA (1997–2018). https://imagej.nih.gov/ij/.
52. Cox, E. P. A method of assigning numerical and percentage values to the degree of roundness of sand grains. J. Paleontol. 1, 179–183
(1927).
53. Schwartzberg, J. E. Reapportionment, gerrymanders, and the notion of compactness. Minn. Law Rev. 50, 443–452 (1966).
54. Polsby, D. D. & Popper, R. D. The third criterion: Compactness as a procedural safeguard against partisan gerrymandering. Yale
L. & Pol’y. Rev. 9, 301–353. https://doi.org/10.2139/ssrn.2936284 (1991).
55. Shen, L., Rangayyan, R. M. & Desautels, J. L. Application of shape analysis to mammographic calcifications. IEEE Trans. Med.
Imaging. 13, 263–274. https://doi.org/10.1109/42.293919 (1994).
56. Spillman, W. B. Jr. et al. Shape factor analysis of progressive rat hepatoma images. J. Biomed. Opt. 13, 014030. https://doi.
org/10.1117/1.2841020 (2008).
57. Takashimizu, Y. & Iiyoshi, M. New parameter of roundness R: Circularity corrected by aspect ratio. Prog. Earth Planet. Sci. 3, 2.
https://doi.org/10.1186/s40645-015-0078-x (2016).
58. Alilou, M. et al. An integrated segmentation and shape-based classification scheme for distinguishing adenocarcinomas from
granulomas on lung CT. Med. Phys. 44, 3556–3569. https://doi.org/10.1002/mp.12208 (2017).
59. Limkin, E. J. et al. The complexity of tumor shape, spiculatedness, correlates with tumor radiomic shape features. Sci. Rep. 9, 4329.
https://doi.org/10.1038/s41598-019-40437-5 (2019).
60. Linderholm, C. E. & Segal, A. C. An overlooked series for the elliptic perimeter. Math. Mag. 68, 216–220. https://doi.
org/10.1080/0025570X.1995.11996318 (1995).
Acknowledgements
The studies were supported by the Dr. Miriam and Sheldon G. Adelson Medical Research Foundation, Califor-
nia Institute for Regenerative Medicine (CIRM) Tools and Technologies III Awards (RT3-07616) the National
Institutes of Health (NIH) Office of the Director (OT2OD026585 and P51 OD011107), and the NIH National
Center for Advancing Translational Science (NCATS) UCLA CTSI Grant (UL1TR001881).
Author contributions
P.M.B. contributed to the conception of the study, data collection and segmentation, development of code, analy-
sis of data, figure and manuscript preparations, and review of final version of manuscript; N.P.B. contributed to
the conception of the study, data collection and segmentation, analysis of data, figure and manuscript prepara-
tions, and review of final version of manuscript; L.A.H. contributed to the conception of the study, collection
of nervous tissues, data collection and segmentation, analysis of data, figure and manuscript preparations, and
review of final version of manuscript.
Competing interests
The authors declare no competing interests.
Additional information
Supplementary Information The online version contains supplementary material available at https://doi.
org/10.1038/s41598-021-82575-9.
Correspondence and requests for materials should be addressed to L.A.H.
Reprints and permissions information is available at www.nature.com/reprints.
Publisher’s note Springer Nature remains neutral with regard to jurisdictional claims in published maps and
institutional affiliations.
Scientific Reports | (2021) 11:3150 | https://doi.org/10.1038/s41598-021-82575-9 11
Vol.:(0123456789)www.nature.com/scientificreports/
Open Access This article is licensed under a Creative Commons Attribution 4.0 International
License, which permits use, sharing, adaptation, distribution and reproduction in any medium or
format, as long as you give appropriate credit to the original author(s) and the source, provide a link to the
Creative Commons licence, and indicate if changes were made. The images or other third party material in this
article are included in the article’s Creative Commons licence, unless indicated otherwise in a credit line to the
material. If material is not included in the article’s Creative Commons licence and your intended use is not
permitted by statutory regulation or exceeds the permitted use, you will need to obtain permission directly from
the copyright holder. To view a copy of this licence, visit http://creativecommons.org/licenses/by/4.0/.
© The Author(s) 2021
Scientific Reports | (2021) 11:3150 | https://doi.org/10.1038/s41598-021-82575-9 12
Vol:.(1234567890)You can also read