Assessing Chinese flood protection and its social divergence
←
→
Page content transcription
If your browser does not render page correctly, please read the page content below
Nat. Hazards Earth Syst. Sci., 21, 743–755, 2021
https://doi.org/10.5194/nhess-21-743-2021
© Author(s) 2021. This work is distributed under
the Creative Commons Attribution 4.0 License.

Assessing Chinese flood protection and its social divergence
Dan Wang1 , Paolo Scussolini2 , and Shiqiang Du1,2,3
1 School  of Environmental and Geographical Sciences, Shanghai Normal University, Shanghai, China
2 Institute for Environmental Studies, Vrije Universiteit Amsterdam, Amsterdam, the Netherlands
3 Institute of Urban Studies, Shanghai Normal University, Shanghai, China

Correspondence: Shiqiang Du (shiqiangdu@shnu.edu.cn)

Received: 7 August 2020 – Discussion started: 24 August 2020
Revised: 16 January 2021 – Accepted: 18 January 2021 – Published: 24 February 2021

Abstract. China is one of the most flood-prone countries,        ing its quantification a prerequisite to reliable risk assess-
and development within floodplains is intensive. However,        ment (Ward et al., 2013). With an increasing focus on large-
flood protection levels (FPLs) across the country are mostly     scale flood risk assessment, which also depends critically on
unknown, hampering the present assertive efforts on flood        flood protection information (Ward et al., 2017; Alfieri et al.,
risk management. Based on the flood-protection prescrip-         2017; Winsemius et al., 2018), the necessity of quantifying
tions contained in the national flood policies, this paper de-   FPLs has increased in recent years. For example, Jongman
velops a dataset of likely FPLs for China and investigates the   et al. (2014) estimated the FPLs in major European river
protection granted to different demographic groups. The new      basins by assuming that high-risk areas have high FPLs. Hal-
dataset corresponds to local flood protection designs in 91      legatte et al. (2013) created an FPL dataset for coastal cities
(53.2 %) of the 171 validation counties, and in 154 counties     by combining design information of flood defenses and ex-
(90.1 %) it is very close to the designed FPLs. This suggests    pert estimates to improve coastal flood risk assessment. Scus-
that the policy-based FPLs could be a valuable proxy for         solini et al. (2016) developed FLOPROS (FLOod PROtec-
designed FPLs in China. The FPLs are significantly higher        tion Standards), a global database of FPLs based on informa-
than previously estimated in the FLOPROS (FLOod PROtec-          tion included in protection design documents and in protec-
tion Standards) global dataset, suggesting that Chinese flood    tion policy documents, in addition to FPL estimates based on
risk was probably overestimated. Relatively high FPLs (re-       flood risk modeling.
turn period of ≥ 50 years) are seen in 282 or only 12.6 % of        High FPLs reduce the frequency of floods in flood-prone
the evaluated 2237 counties, which host a majority (55.1 %)      areas and decrease flood risk (Ward et al., 2013). From a
of the total exposed population. However, counties with low      cost–benefit view, high FPLs are more economically attrac-
FPLs (return period of < 50 years) host a disproportionate       tive in areas with a high density of population and economy
share (52.3 %) of the exposed vulnerable population (chil-       (Ward et al., 2017). However, high FPLs can have a “levee
dren and elders), higher than their share (44.9 %) of the ex-    effect”: creating a sense of security and lowering risk aware-
posed population. These results imply that to reduce social      ness, which boosts floodplain development and population
vulnerability and decrease potential casualties, investment in   growth and can, in turn, cause catastrophic consequences
flood risk management should also consider the demographic       once a low-probability flood happens (Di Baldassarre et al.,
characteristics of the exposed population.                       2015; Haer et al., 2020). On the other hand, low FPLs gener-
                                                                 ally mean limited human and financial resources and there-
                                                                 fore imply a lower capacity of flood risk reduction (Cheng
                                                                 et al., 2018; Cross, 2001; Han et al., 2020). Moreover, the
1   Introduction                                                 low FPLs may coincide with a concentration of vulnerable
                                                                 people, e.g., the elders and children, increasing the severity
Flood protection level (FPL) is the degree to which a            of the human consequences of floods (i.e., more likely fatal-
flood-prone location is protected against flooding (Scussolini   ities), and more in general exacerbating the local social vul-
et al., 2016). It is a key determinant of flood risk, mak-

Published by Copernicus Publications on behalf of the European Geosciences Union.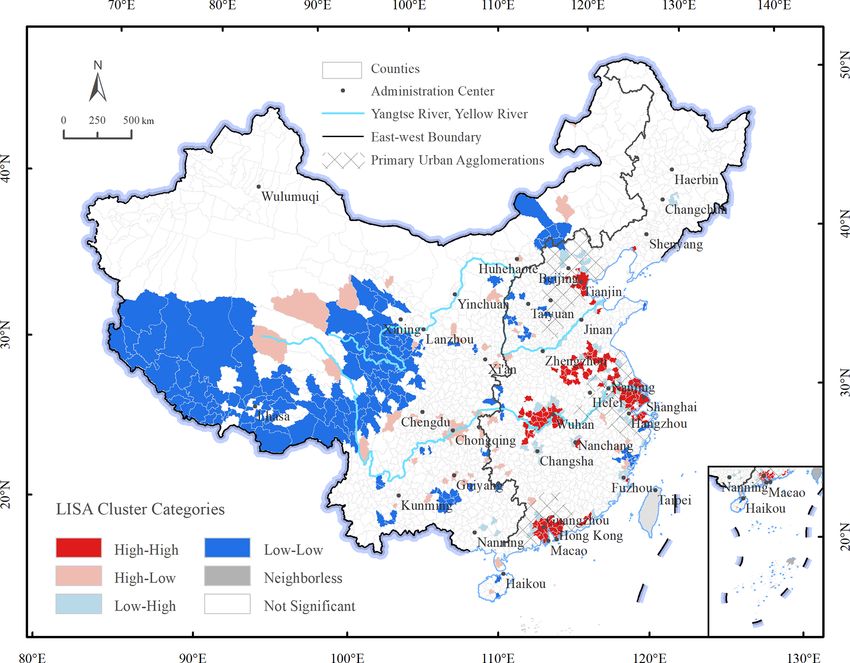
744                                              D. Wang et al.: Assessing Chinese flood protection and its social divergence

nerability (Birkmann et al., 2016; Gu et al., 2018). Therefore,    2     Materials and methods
FPL study is also a key to understand the integrated sociohy-
drological system.                                                 2.1    China’s flood protection policy and the study
   China is one of the countries that experience the most se-             framework
rious floods and the fastest urbanization. Between 1990 and
2017, floods in China on average affected 149 million peo-         FPL data are typically difficult to access at a large scale
ple, led to 2165 deaths, and caused economic damage of             (Jiang et al., 2020). Scussolini et al. (2016) proposed that
USD 34 billion per year (Du et al., 2019). Moreover, flood         FPL can be assessed based on protection design documents
risk changes rapidly due to socioeconomic dynamics (Du             and policies or assumed based on hydrodynamic and flood
et al., 2018) and, in the longer-term, due to climate change       risk simulations and on wealth distribution. Flood protection
(Alfieri et al., 2017; Winsemius et al., 2018). For instance,      policies provide an opportunity to establish a large-scale FPL
Du et al. (2018) found that urban lands in the floodplain          dataset (Mokrech et al., 2015), as they generally contain in-
increased by 26 430 km2 , i.e., 542 %, from 1992 to 2015, a        formation on how a region should be protected from floods,
process which is still in full swing and thus likely to exacer-    although some authors suggest that the actual protection lev-
bate flood risk in the future. Moreover, the urbanization pro-     els could differ from the policy-prescribed protection stan-
cess witnesses an enormous migration from the countryside          dard (Jonkman, 2013). Presently, the key policy document
to cities (Li et al., 2018; Liu and Li, 2017), which selectively   for China is the Standard for flood control (standard no. GB
leaves the vulnerable population behind and may increase so-       50201-2014), which was released in 2014 by the Ministry of
cial vulnerability in the countryside (Cheng et al., 2018).        Housing and Urban-Rural Development of the People’s Re-
   However, little information is available about China’s          public of China. It stipulates the FPLs for urban and rural
FPLs, which hampers reliable flood risk assessment and chal-       areas depending on three exposure indicators: the amount of
lenges risk management. The existing few studies of China’s        exposed population, the per capita gross domestic product
FPLs, to our best knowledge, are only about a specific             (GDP), and the arable lands. Here a framework is developed
flood control facility and at local scales. For example, Deng      using spatial information on these indicators of exposure to
et al. (2015) analyzed the FPL of Taihu Lake levees to inform      infer the policy-prescribed FPLs across China (Fig. 1).
flood risk management. Zhou (2018) studied the impact of              This is conceptually akin to the policy layer of the FLO-
land subsidence on the FPL in lower reaches of the Daqing          PROS dataset, but the framework yields information at the
River. Liu (2017) inferred the FPL in Quzhou through hy-           much finer spatial scale of the county. In the study frame-
drodynamic simulation. Although the aforementioned global          work, based on the relevant datasets, the FPL of an urban
FLOPROS database can show an overall FPL for China, it             county (in Chinese: shi or qu) is evaluated by population ex-
still misses details. For example, in the FLOPROS database         posure and GDP-weighted population exposure; the FPL of
the FPLs have a return period of only 20 years in 29 (or           a rural county (xian) is evaluated by the population exposure
85.3 %) of the 34 Chinese provinces including the capital,         and arable-land exposure (Table 1), as prescribed in the Stan-
Beijing, which is probably incompatible with the massive           dard for flood control (standard no. GB 50201-2014). Ad-
investment in improving Chinese FPLs in the past decades           ditionally, local flood protection design documents are col-
particularly for metropolises (Du et al., 2019). Therefore, it     lected to verify the policy-based FPL dataset. At the same
is reasonable to presume that the FPLs of China are signifi-       time, the spatial pattern of the FPLs is identified using spa-
cantly underestimated in the FLOPROS database, especially          tial statistics techniques, and the FPLs of the exposed pop-
for urban areas. With such sparse data, the picture of FPLs        ulation, including the elders, children, and rural and urban
at the national scale is still unclear, representing a critical    population are evaluated by combing the FPLs with demo-
knowledge gap in the context of rapid urbanization. This also      graphic information. Note that the vulnerable population is
limits the understanding of the relationship between popula-       mainly comprised of the elders and children.
tion exposure, vulnerability, and flood protection.
   Therefore, the paper here develops and validates the first      2.2    Data
FPL dataset for China based on the current Chinese policy
on FPLs, the Standard for flood control (standard no. GB           Six datasets are employed. First, an administrative bound-
50201-2014), which clearly stated how an area should be            ary is adopted from He et al. (2016), which considered
protected according to the exposed elements. On this basis,        administrative-boundary adjustments from 1990 to 2010.
the following questions are addressed. (1) What level of pro-      Second, an undefended fluvial flood depth map with a re-
tection against river floods does Chinese policy imply across      turn period of 100 years is provided by the CIMA (Centro
the country? (2) Since the FPL policy does not consider pop-       Internazionale in Monitoraggio Ambientale) Research Foun-
ulation demographics, what are the implications for the pro-       dation (Rudari et al., 2015), which is accessible from the
tection of vulnerable social groups?                               Global Risk Data Platform (http://preview.grid.unep.ch/, last
                                                                   access: 19 February 2021). It has a spatial resolution of 1 km
                                                                   and has been used for analyzing China’s urban land expan-

Nat. Hazards Earth Syst. Sci., 21, 743–755, 2021                                   https://doi.org/10.5194/nhess-21-743-2021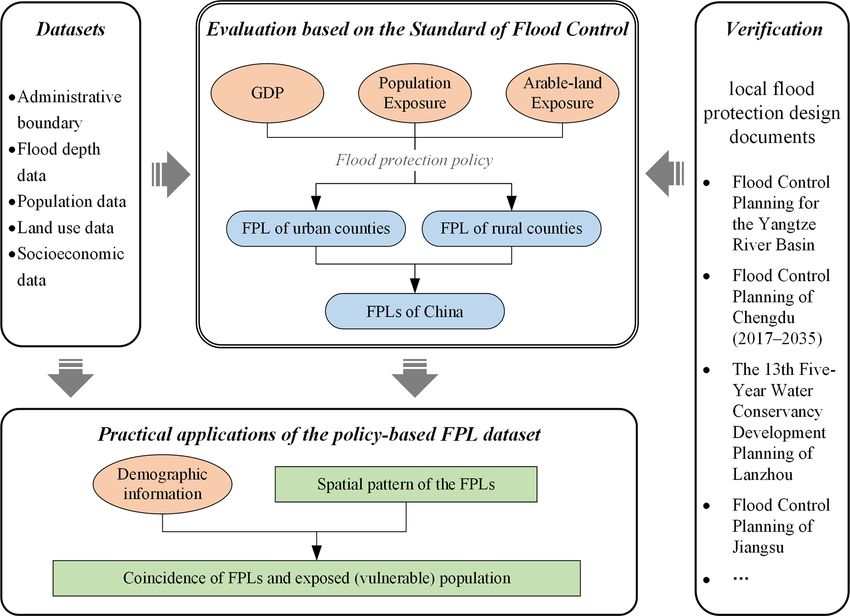
D. Wang et al.: Assessing Chinese flood protection and its social divergence                                                                         745

Figure 1. The study framework of flood protection level (FPL). Input datasets are indicated in orange circles; the new datasets produced in
this study are indicated in blue rounded rectangles; the implications of the new datasets are in green rectangles.

Table 1. Urban and rural standards for evaluating the flood protection level (FPL) (source: Standard for flood control, standard no. GB
50201-2014).

                          Urban FPL indicators                         Urban FPL              Rural FPL indicators                      Rural FPL
                 Population              GDP-weighted             (Return period,         Population          Arable-land         (Return period,
                 exposure          population exposure∗                    years)          exposure              exposure                  years)
                 (million)                     (million)                                   (million)        (thousand ha)
                 < 0.2                                 < 0.4                 30–50               < 0.2                < 20                   10–20
                 ≥ 0.2                                 ≥ 0.4                50–100               ≥ 0.2                ≥ 20                   20–30
                 ≥ 0.5                                  ≥1                 100–200               ≥ 0.5               ≥ 66.7                  30–50
                 ≥ 1.5                                  ≥3                   ≥ 200               ≥ 1.5               ≥ 200                  50–100
               Note: ∗ GDP-weighted population exposure is the population exposure multiplied by the ratio between the relative per capita gross
               domestic product (GDP) and the national average.

sion (Du et al., 2018) and population dynamics in floodplains                         rural and urban population to the county-level total popula-
(Fang et al., 2018). Third, population density maps for 1990                          tion, which are used to calculate the vulnerable-population
and 2015 are acquired from the China Temporal Datasets                                exposure. Fifth, the land use data of China for 2015 comes
of the Harvard Dataverse, published by the WorldPop pro-                              from the Data Center for Resources and Environmental Sci-
gram (http://www.worldpop.org.uk, last access: 19 February                            ences, Chinese Academy of Sciences, which is accessible
2021). It originally has a spatial resolution of 100 m and is                         from the Resource and Environment Data Cloud Platform
aggregated to a 1 km resolution to match the flood depth data.                        (http://www.resdc.cn/, last access: 19 February 2021). It has
Fourth, the demographic information of 1990 and 2015 is ob-                           a resolution of 1 km and is used to extract arable lands in
tained from China’s national census data (National Bureau of                          floodplains. Besides, the county-level GDP in 2015 (Division
Statistics of China, 2015). It includes the proportions of chil-                      of Urban Social and Economic Survey of National Bureau of
dren (aged ≤ 14 years) and elders (aged ≥ 65 years) and the

https://doi.org/10.5194/nhess-21-743-2021                                                          Nat. Hazards Earth Syst. Sci., 21, 743–755, 2021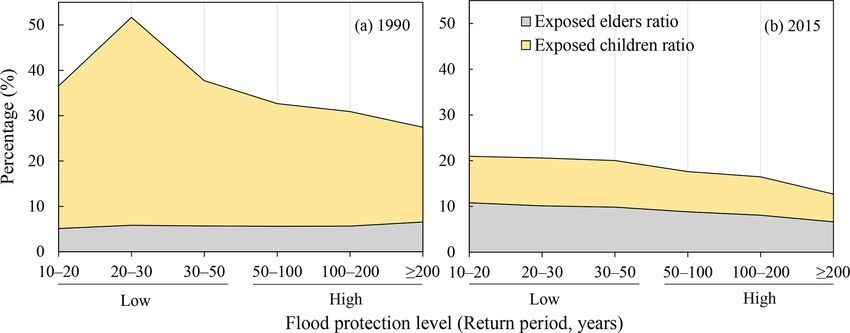
746 D. Wang et al.: Assessing Chinese flood protection and its social divergence
Statistics, 2016) is used to calculate the GDP-weighted pop- year 2015. A raw sample of 304 counties is found from
ulation exposure. accessible flood protection documents dating from 1998 to
2019. Two-round selection is further implemented. For the
2.3 Assessment of flood protection level first round, we only select the relatively new documents re-
leased from 2007 to 2012, which are neither so old that the
Three exposure indicators are employed to assess the FPL FPL information may be outdated nor so new that the FPL
of a certain flood-prone county: population exposure (PopE), may be uncompleted and unqualified. Those documents are
GDP-weighted PopE, and arable-land exposure (ArableE). kept in the validation data only if they state that the de-
For county i, the PopE is calculated as the population in sign would be completed between 2010 and 2015. A sample
the floodplain, which is defined as the maximum extent (i.e., of 110 counties is selected from this round. For the second
where flood depth is > 0 cm) of the undefended 100-year round, new flood protection design documents starting from
flood map, following previous flood exposure analyses (Du 2015 are researched, and these are kept only if they state the
et al., 2018; Fang et al., 2018; Jongman et al., 2012). The current (2015) flood protection standards. Another 61 coun-
calculation is conducted by overlaying the flood depth map ties are then selected. Therefore, the validation sample size
and the population density maps using a geographical infor- is 171 counties, representing 7.6 % of the surveyed Chinese
mation system (Fang et al., 2018). Then, for an urban county counties, 34.0 % of the exposed population, and 13.0 % of
i, the PopE is transformed into the GDP-weighted PopE us- Chinese exposed arable lands. Assuming that the designed
ing the relative factor of the county’s GDP per capita to the flood protection standards reflect the reality of flood pro-
national average GDP per capita, following Eq. (1), tection implemented in practice, the agreement between the
Gi policy-based FPLs and those derived from the local design
GDP-weighted PopE = PopE × (1) documents is checked for the 171 counties, and the overall
Ga ,
accuracy is further calculated.
where Gi refers to the GDP per capita in county i and Ga
refers to the national average of GDP per capita in China. 2.5 Pattern clustering of flood protection level
For a rural county i, the ArableE is calculated as the area
of arable lands in the 100-year floodplain by overlaying the The spatial pattern of FPLs, i.e., the clustering of counties
flood depth and land use maps. Based on the three calcu- with a homogenous FPL, is essential to understand regional
lated indicators, the FPL can be estimated by applying the flood risk distribution. It also informs on indirect dimensions
criteria specified in the Standard for flood control (standard of flood risk, as, e.g., high-FPL counties may suffer indirect
no. GB 50201-2014) (Table 1). The FPL of an urban county flood risk if their surrounding counties have low FPLs and
is the larger value between FPLs based on the PopE criteria thus suffer severe flooding (Cheng et al., 2018; Han et al.,
FPL(PopE,i) and based on the GDP-weighted PopE criteria 2020). The spatial pattern of the FPL data is then identified
FPL(GDP-weighted PopE,i) , while the FPL of a rural county is using the LISA (local indicator of spatial association) or local
the larger value between FPL(PopE,i) and the FPL based on Moran’s I (Anselin, 1995). The local Moran’s I statistic is
the ArableE criteria FPL(ArableE,i) , following Eq. (2), calculated as follows (Chakravorty et al., 2003):
FPL(i) (xi − x̄) X
Ii = 2
Wi,j xj − x̄ , (3)
s
max[FPL(PopE, i), FPL(GDP-weighted PopE, i)], j =1,j 6=i
i = an urban county
= where Ii is the local Moran’s I in county i; xi and xj refer
max[FPL(PopE, i), FPL(ArableE, i)], to the FPL of county i and its neighboring county j , respec-
i = a rural county.
tively; x̄ is the mean FPL across all counties; Wi,j is a n-by-n
(2) weight matrix defining the spatial contiguity between county
The FPLs are assessed for 2237 counties that fully or par- i and any county j , where Wi,j = 1 if county i and county j
tially fall within the 100-year floodplain. The result is pre- share a border and otherwise Wi,j = 0; and s 2 is the variance
sented by six FPLs: ≥ 200, 100–200, 50–100, 30–50, 20–30, of FPLs across all flood-prone counties.
and 10–20 years. Further, FPLs of ≥ 50 years are summa- A positive value for the local Moran’s I statistic indicates
rized as relatively high FPLs, while FPLs of < 50 years are that the FPL in a county is similar to those in its neighboring
summarized as low FPLs. counties, while a negative I value indicates dissimilar values
(Zhu et al., 2018; Frigerio et al., 2018; Shen et al., 2019).
2.4 Verification of the flood protection levels The local Moran’s I is calculated by applying the queen con-
tiguity matrix in the GeoDa software program (version 1.12),
Local documents of flood protection design are collected to which is available from http://geodacenter.github.io (last ac-
verify the policy-based FPL results. The validation counties cess: 19 February 2021). The significance is evaluated at an
are selected based on the date of the flood protection de- alpha level of 0.05. Four different LISA clustering patterns
sign: the data should represent the flood protection of the of FPLs are identified. (1) High–high: both the county and its
Nat. Hazards Earth Syst. Sci., 21, 743–755, 2021 https://doi.org/10.5194/nhess-21-743-2021D. Wang et al.: Assessing Chinese flood protection and its social divergence 747
neighbors have high FPLs. (2) High–low: the FPL is high in
a county, while it is low in its neighboring counties. (3) Low–
high: FPL is low in a county, while it is high in its neighbor-
ing counties. (4) Low–low: both a county and its neighbors
have low FPLs.
2.6 Dynamic analysis of population exposure and
vulnerable-population exposure
PopE refers to the population exposure in a certain county,
which is calculated as the population in the floodplain by
overlaying the flood depth and the population density maps
(Sect. 2.3). The exposed vulnerable population comprises the
exposed children and elders because children and elders are
generally considered more vulnerable to flooding, due to lim- Figure 2. The number of counties with different flood protection
ited mobility and physical resistance (Gu et al., 2018; Salvati levels. (The map of western and eastern China is shown in Fig. 3).
et al., 2018). Assuming that the proportion of exposed chil-
dren to the total population is spatially homogeneous within
a county, the exposed children are calculated in each county match the protection design documents in 50 (29.2 %) out of
using Eq. (4), the 171 counties and underestimate the FPLs in almost all
other counties, with 32.7 % of the underestimations being off
children by only one FPL. Therefore, the policy-based FPL dataset
Exposed children = × PopE, (4) constitutes a substantial improvement on previous knowl-
total population
edge of Chinese FPLs.
where PopE refers to the population exposure in the county
and children and total population are respectively the num- 3.2 Spatial pattern of flood protection level
bers of children and total population in a county. Similarly,
the exposed elders can be calculated. The exposed vulnera- According to the prescriptions of the Standard for flood con-
ble population is the sum of exposed children and exposed trol (standard no. GB 50201-2014) policy, a majority (87.4 %
elders. Additionally, the exposed rural and urban population or 1955) of Chinese counties have FPLs of < 50 years that
are estimated following the method. are defined hereafter as relatively low FPLs (Fig. 2), while
Equation (5) is used to calculate the growth rate of popu- only 282 counties (12.6 %) have high FPLs (≥ 50 years). A
lation exposure from 1990 to 2015, considerable proportion (33.1 % or 741) of the evaluated Chi-
nese counties are protected with an FPL of ≥ 30 years, which
PopE2015 − PopE1990 is much higher than that in the global FLOPROS database
Growth rate(%) = × 100 %, (5)
PopE1990 (Scussolini et al., 2016), in which only 5 (14.7 %) out of 34
provinces have FPLs of ≥ 30 years. Therefore, Chinese FPLs
where PopE2015 and PopE1990 refer to the population expo- are probably underestimated in the previous study by Scus-
sure in 2015 and 1990, respectively. Similarly, the growth solini et al. (2016).
rates of exposed children, elders, and the vulnerable popula- The FPLs show significant divergence between eastern
tion are calculated, as well as the growth rates of the exposed and western China (Figs. 2 and 3), reflecting general differ-
rural and urban population. ences in population exposure and in economic performance.
A dominant portion (85.5 % or 241) of high-FPL counties
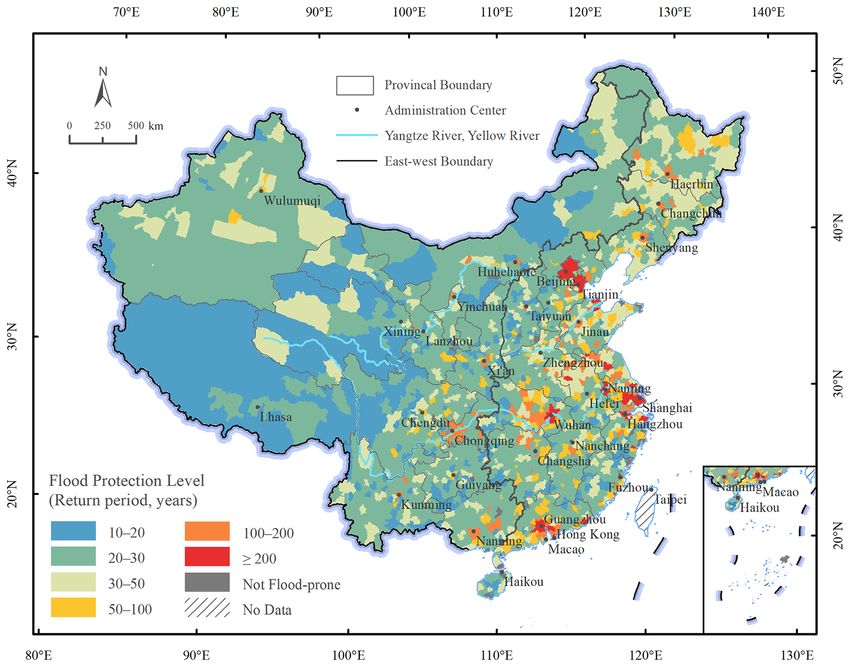
3 Results are located in eastern China. Particularly, all the 25 counties
with the highest FPL (≥ 200 years) are located in the east.
3.1 Validation of the new policy-based FPL dataset In contrast, only 4.3 % (or 41) of the western Chinese coun-
ties have high FPLs, which is much lower than the share in
The policy-based FPL dataset matches to a good degree eastern China (18.7 % or 241). The majority (68.4 % or 210)
the information from protection design documents. In 91 of the lowest-FPL counties (10–20 years) are located in the
(53.2 %) out of the 171 verification counties, the FPLs agree west. In sum, western China is disproportionally protected
with the local official protection design documents (Ta- with low FPLs.
bles S1 and S2 in the Supplement). The FPLs in the dataset High–high FPL clusters include 112 counties. They are
are overestimated in 20 counties (11.7 %) and underesti- mainly located in the three primary urban agglomerations
mated in 60 counties (35.1 %). Most (90.1 %) of the over- of Beijing–Tianjin–Hebei, the Yangtze River Delta, and the
estimations and underestimations are only off by one FPL. Pearl River Delta (Fig. 4). The three primary urban agglom-
In comparison, the FPLs of the global FLOPROS database erations are home to most of the counties with the highest
https://doi.org/10.5194/nhess-21-743-2021 Nat. Hazards Earth Syst. Sci., 21, 743–755, 2021748 D. Wang et al.: Assessing Chinese flood protection and its social divergence
Figure 3. Flood protection levels (FPLs) for the study area. The FPL is limited to the scope of floodplains but plotted to cover all counties.
The data should only be viewed as a proxy of the designed FPLs and do not equate to the actual FPLs. The Shapefile format data are available
in the Supplement.
FPLs of ≥ 200 years (Fig. 3). Besides, the high–high FPL 3.3 Protection levels of the exposed (vulnerable)
clusters are also located in the middle Yangtze River reaches. population in 2015
The low–high FPL clusters include a total of 66 counties, sur-
rounding the high–high FPL clusters. These counties within
the low–high FPL clusters can be vulnerable to floods when
they are needed to sacrifice to protect their surrounding large A majority (55.1 % or 231.1 million) of the total exposed
cities that are more expensive to be flooded (Wang et al., population is found in a minority of 282 counties with high
2016). For instance, in China, flood detention zones are FPLs (≥ 50 years) (Table 2). Particularly, 23.3 % (97.8 mil-
planned in rural areas to protect surrounding cities in the lion) of the total exposed population are protected by an FPL
Yangtze River and Huai River basins of China (Du et al., of ≥ 200 years. In contrast, 188.4 million (44.9 %) of the
2021). Low–low FPL clusters include 158 counties, which flood-exposed people are in low-FPL counties, lower than
are mainly located in southwestern China and scattered along that in the high-FPL counties.
a belt from Hohhot to Kunming. Surrounding the low–low A majority (52.3 % or 38.3 million) of the exposed vul-
FPL clusters, 48 counties have relatively high FPLs and form nerable population is concentrated in low-FPL (< 50 years)
high–low clusters. counties, higher than these counties’ share of the total ex-
posed population (44.9 %) (Table 2). These low-FPL coun-
ties host 52.9 % (19.4 million) of the exposed children and
51.6 % (18.8 million) of the exposed elders. Particularly,
counties with an FPL of 20–30 years host the largest ex-
posed vulnerable population (19.9 million or 27.1 %) across
Nat. Hazards Earth Syst. Sci., 21, 743–755, 2021 https://doi.org/10.5194/nhess-21-743-2021D. Wang et al.: Assessing Chinese flood protection and its social divergence 749
Figure 4. Spatial cluster of the flood protection levels in the study area.
all the six FPLs, including 10.1 million (27.5 %) children and 3.4 Changes in the exposed (vulnerable) population
9.8 million (26.8 %) elders. across protection levels
The ratio of the vulnerable population to the total exposed
population is as high as 20.3 % in low-FPL counties, while
it is 15.1 % in high-FPL counties (Table 2). Both exposed
children and elders are found disproportionally in the low- The total exposed population has grown by 60.3 %, rapidly
FPL counties. Specifically, the children’s share of the total from 1990 to 2015 in counties that are presently protected
exposed population is 10.3 % in the low-FPL counties, higher by high FPLs, while it has remained relatively stable in the
than in the high-FPL counties (7.5 %); similarly, the elders’ low-FPL counties (2.34 %) (Fig. 5a). In 1990, the exposed
share is 10.0 % in the low-FPL counties, higher than in the population was primarily located in counties with FPLs of
high-FPL counties (7.6 %). Therefore, the low-FPL counties 20–30 years (95.0 million or 28.9 %), while in 2015 it is pri-
have a disproportionally higher share of the vulnerable pop- marily in counties with ≥ 200 years FPLs (97.8 million or
ulation than the high-FPL counterparts, in terms of both ex- 23.3 %).
posed children and elders. The exposed vulnerable population has decreased by
The protection divergence also happens between the ex- 41.9 %, from 126.0 million in 1990 to 73.3 million in 2015,
posed rural and urban population. A majority (66.8 % or and decreased more sharply (by 53.7 %) in the low-FPL
107.3 million) of the exposed rural population are protected counties (Fig. 5b). The decrease of the exposed vulnerable
by low FPLs, while this proportion is only 31.3 % (81.1 mil- population is mainly caused by a sharply declining exposed
lion) for the exposed urban population (Table S3 in the Sup- population of children. The exposed children, in total, have
plement). This implies that the rural people are not equally decreased by 65.6 % from 106.8 million in 1990 to 36.8 mil-
protected against flooding compared with urban inhabitants. lion in 2015. The exposed children’s share to the total ex-
posed population has declined rapidly across all FPLs, which
https://doi.org/10.5194/nhess-21-743-2021 Nat. Hazards Earth Syst. Sci., 21, 743–755, 2021750 D. Wang et al.: Assessing Chinese flood protection and its social divergence
Table 2. Exposed population (total, vulnerable, children, and elders) for each flood protection level (FPL), in absolute amounts and as
percentage of the whole exposed population. The rightmost column reports the ratio of the vulnerable to the total exposed population.
FPL Total exposure Vulnerable exposure Exposed children Exposed elders Vulnerable-to-total
(years) in millions (%) in millions (%) in millions (%) in millions (%) exposed population ratio
Low 188.4 (44.9) 38.3 (52.3) 19.4 (52.9) 18.8 (51.6) 20.3 %
10–20 2.0 (0.5) 0.4 (0.6) 0.2 (0.6) 0.2 (0.6) 21.0 %
20–30 96.5 (23.0) 19.9 (27.1) 10.1 (27.5) 9.8 (26.8) 20.6 %
30–50 89.9 (21.4) 18.0 (24.6) 9.2 (24.9) 8.9 (24.3) 20.0 %
High 231.1 (55.1) 35.0 (47.7) 17.3 (47.1) 17.7 (48.4) 15.1 %
50–100 50.8 (12.1) 9.0 (12.2) 4.5 (12.1) 4.5 (12.3) 17.6 %
100–200 82.5 (19.7) 13.6 (18.6) 6.9 (18.8) 6.7 (18.3) 16.5 %
≥ 200 97.8 (23.3) 12.4 (17.0) 5.9 (16.2) 6.5 (17.8) 12.7 %
Sum 419.5 (100) 73.3 (100) 36.8 (100) 36.5 (100) 17.5 %
Figure 5. Changes in exposed total population (a) and vulnerable population (b) across different flood protection levels from 1990 to 2015.
decreases the ratio of the vulnerable population to the total 4 Discussion
exposed from 38.4 % in 1990 to 17.5 % in 2015 (Fig. 6).
In contrast, the exposed elders have increased across all 4.1 Residual flood risk is nonstationary and should be
six FPLs, with a total growth of 90.2 % from 19.2 million effectively managed
to 36.5 million (Fig. 5b). This trend reflects China’s aging
population. Moreover, the elders’ share of the total exposed
Chinese FPLs should be much higher than that in previ-
population has risen from 5.9 % in 1990 to 8.7 % in 2015
ous studies, according to the prescriptions of the Standard
(Fig. 6). Particularly in the low-FPL counties, it has increased
for flood control (standard no. GB 50201-2014) policy. The
from 5.7 % in 1990 to 10.0 % in 2015 with a growth of 4.3 %,
newly developed data show that almost one-third (33.1 %,
much higher than that in the high-FPL counties (1.7 %).
741) of the evaluated Chinese counties should be protected
The exposed rural population has decreased by 26.5 %
with an FPL of ≥ 30 years, while this FPL is only in 5
from 218.6 million in 1990 to 160.7 million in 2015 and
(14.7 %) out of 34 provinces in the FLOPROS database
has decreased more (30.1 %) in the low-FPL counties (Ta-
(Scussolini et al., 2016). Particularly, the newly developed
ble S3). However, there is a consistent disproportional dis-
data show that a considerable proportion (12.6 % or 282) of
tribution of the rural population in low-FPL counties. Mean-
Chinese counties have FPLs of ≥ 50 years that are defined
while, the exposed urban population (177.7 million) of the
as relatively high FPLs. Moreover, the high FPLs protect
high-FPL counties in 2015 is more than twice of that in 1990
the majority (55.1 % or 231.1 million) of the exposed Chi-
(79.2 million). However, the low-FPL areas also witness a
nese population. Those high-FPL counties are concentrated
rapid increase in exposed urban population by 68.5 %.
in eastern China, particularly in the urban agglomerations
(Bai et al., 2014). The underestimation of Chinese FPLs can
Nat. Hazards Earth Syst. Sci., 21, 743–755, 2021 https://doi.org/10.5194/nhess-21-743-2021D. Wang et al.: Assessing Chinese flood protection and its social divergence 751 Figure 6. The ratios of the exposed vulnerable population, exposed children, and exposed elders to the total exposed population across different flood protection levels in 1990 (a) and 2015 (b). Note that flood protection levels refer to the situation of 2015 and keep constant between 1990 and 2015. at least partially explain the high level of flood risk in pre- Alfieri et al. (2017) indicated that the future annual expected vious studies (Alfieri et al., 2017; Willner et al., 2018). For economic losses in China may be the highest of all countries, instance, global flood risk assessments show huge flood risk rising by 1.5-fold to 3.4-fold and reaching EUR 50 billion to across Chinese provinces both in current conditions and fu- 110 billion per year, based on global warming scenarios of ture scenarios (Willner et al., 2018), which are considered to 1.5 to 4◦ , respectively. further propagate a devastating indirect impact to other coun- The residual flood risk can be higher if the real-world flood tries through the global trade and supply network (Willner protection lags behind the policy requirement and design. In et al., 2018). However, those global assessments are based fact, the policy-based FPL dataset only reflects how a county on the FLOPROS database, which is significantly lower than should be protected according to the flood protection policy, the policy-required FPLs as indicated by the paired sample which also stipulates that the flood protection should be up- t test (p < 0.01, Table S4 in the Supplement). For instance, dated along with population growth and economic develop- FLOPROS presented Beijing with an FPL of 20 years, while ment. Unfortunately, a survey in 2013 found that 44 % (284) it should be 200 years according to the Chinese protection of the 642 Chinese cities did not update their flood protection policy (Table S1). The real flood risk should thus be much planning according to their socioeconomic growth (Cheng lower than the estimates in previous studies if the new FPL and Li, 2015). A neglect of the real-world flood protection is considered. lagging behind the policy-based flood protection can distort However, high-level flood protection does not represent the selection of adaptation measures. absolute safety. On the contrary, low-probability floods can Flood risk management will inevitably face an ongoing still occur, and flood protection structures may technically challenge from population growth when reducing the resid- fail, causing residual flood risk (Haer et al., 2020). Partic- ual risk. It is predicted that, in the next 10 years, the Chi- ularly, levee breaches can cause a catastrophe for the ar- nese urban population will increase by 17 % (United Nations, eas with a high density of population and assets (Jongman, 2018), which will increase residual flood risk in the high- 2018). In high-FPL counties, a sense of safety brought by the FPL counties because high-FPL counties are usually urban flood protection structures can reduce the perception of risk areas. The flood protection structures should be upgraded and cause the levee effect – boosting floodplain development along with socioeconomic development and climate change and increasing flood exposure (Cheng and Li, 2015; Kates to keep the residual flood risk to an acceptable level (Kwadijk et al., 2006). The possibility of a similar outcome should et al., 2010). Non-structural measures such as early warning be considered in China, as suggested by the faster increas- systems, land use planning, building codes, and insurance ing trend of the exposed population in the high-FPL counties and reinsurance can be a complement to the flood protection than in the low-FPL counties. The rapid increase in the ex- structures for effectively managing flood risk (Aerts et al., posed population can exacerbate residual flood risk, render- 2014; Jongman, 2018; Du et al., 2020). ing these high-FPL areas vulnerable to low-probability and high-impact floods (Koks et al., 2015; Di Baldassarre et al., 2013). The residual risk can be further aggravated by future climate change (Alfieri et al., 2017; Winsemius et al., 2018). https://doi.org/10.5194/nhess-21-743-2021 Nat. Hazards Earth Syst. Sci., 21, 743–755, 2021
752                                             D. Wang et al.: Assessing Chinese flood protection and its social divergence

4.2   Demographics should be included in the flood                4.3   Limitations and future perspectives
      protection policy
                                                                  The newly developed FPL dataset reflects how China should
Although the low-FPL counties see a lower exposed popu-           be protected against river floods according to the flood pro-
lation, the majority (52.3 % or 38 million) of exposed vul-       tection policy. It does not report actual FPLs, although it gen-
nerable population are concentrated there. Particularly, the      erally agrees with local flood protection design documents.
elders’ share of the total exposed population was increasing      Given the scarcity of the real-world flood protection data,
rapidly in these low-FPL counties. These findings are con-        the new dataset could be considered a valuable proxy of de-
sistent with other studies (Cheng et al., 2018). Meanwhile, a     signed FPLs and can assist efforts to understand, evaluate,
great number of exposed rural people are found to be con-         and manage flood risk in the following ways. (1) Authorities
centrated in these low-FPL counties. The low-FPL counties         can use this database to check if the relevant counties are pro-
located in rural areas have experienced an economic down-         tected properly. (2) Flood risk assessment could be further
turn and have insufficient job opportunities, which causes a      conducted considering the developed FPL dataset. (3) The
large number of young adults to temporarily migrate to cities     policy-based FPLs can be an important foundation for rele-
for work opportunities (He et al., 2016; Meng, 2014). There-      vant researchers to develop a more reliable FPL dataset of
fore, it may be difficult for these low-FPL counties to respond   China and the world. (4) It can also help to reveal poten-
to and recover from flooding due to economic backwardness         tial social divergence by combining the policy-based FPLs
and labor shortages.                                              with some social data, which can further improve the flood
   Hence with more vulnerable people, a higher potential ca-      protection policy, as indicated by the relevant analyses in this
sualty rate caused by floods is expected in these low-FPL         study. It is worth noting that the real-world FPLs are not fixed
counties. The elder Chinese population is predicted to more       but are plausibly updated along with socioeconomic develop-
than double from 128 million in 2015 to 348 million in            ment and climate change. Therefore, relevant departments,
2050 (The World Bank, 2019), implying an increase of ex-          communities, and users are invited to use, verify, and im-
posed elders. This will further increase social vulnerability     prove the newly developed FPL result (which is accessible in
and challenge flood risk management, particularly in the low-     the Supplement in Shapefile format). With the wide partic-
FPL counties. However, the Standard for flood control (stan-      ipation of public stakeholders, the flood protection data can
dard no. GB 50201-2014) policy neglects the demographic           be much improved in the future.
characteristics of the exposed population. It is economically        Limitations also come with our data and methods. The
reasonable to employ a relatively low FPL for areas that          exposed population is calculated based on a gridded popu-
have a low density of population and economy. Such a strat-       lation dataset from the WorldPop program, which is a dis-
egy, however, may aggravate flood risk because the less pro-      aggregation result of census population using auxiliary vari-
tected areas coincide with the high social vulnerability that     ables such as land use conditions and nightlight brightness.
is caused by a disproportional distribution of vulnerable peo-    However, neither the disaggregation methods nor the auxil-
ple, particularly elders.                                         iary data are free of uncertainty and error (Smith et al., 2019).
   Therefore, local demographic characteristics should be         Moreover, due to a lack of gridded demographic data, the ex-
considered for an economically and socially beneficial strat-     posed vulnerable population is calculated assuming that its
egy of flood adaptation (Koks et al., 2015). The low-FPL ar-      proportion to the total population is spatially homogeneous
eas can employ decentralized and soft adaptation measures,        within a county. In fact, the demographic characteristics can
such as elevation of buildings, wet flood proofing, and dry       be spatially heterogeneous (Han et al., 2007; Qiang, 2019).
flood proofing to reduce flood vulnerability (Aerts, 2018; Du     Nowadays, crowd-sourcing population data are emerging,
et al., 2020), since structural flood protections are generally   thanks to social media (Goodchild and Glennon, 2010; Smith
less cost-effective in areas with a lower exposed population      et al., 2019) and mobile phone records (Wu et al., 2012).
(Ward et al., 2017; Jongman, 2018). Considering the rela-         These new data can help to improve the exposed (vulner-
tive concentration of exposed vulnerable population in the        able) population accuracy and in turn, the FPL estimates.
low-FPL counties, flood risk information, adaptation mea-         Meanwhile, it should be noted that Sect. 3.4 only analyzed
sures, and emergency plans should be made accessible and          changes in the exposed (vulnerable) population across the
understandable to children and elders (De Boer et al., 2014).     current protection levels, which was not equal to the expo-
Communities should pay more attention to children and el-         sure and vulnerability changes along with different-period
ders during early warning, evacuation, and resettlement pe-       FPLs. Besides, only some aspects of social divergence have
riods, and a one-on-one assistance scheme can be developed        been analyzed, due to data limitation. Under the FPL policy,
at the community level to help the vulnerable people. Emer-       other factors of social divergence, such as sex, income, and
gency planning and flood adaptation design should consider        education level (Tian and Lemos, 2018; Huang et al., 2020),
the particular needs of children and elders, which can be pro-    need to be further studied. For example, the education lev-
moted by their participation in the planning and designing        els across different FPLs may help relevant authorities to de-
processes (Liang et al., 2017).                                   velop suitable flood adaptation strategies or help researchers

Nat. Hazards Earth Syst. Sci., 21, 743–755, 2021                                   https://doi.org/10.5194/nhess-21-743-2021
D. Wang et al.: Assessing Chinese flood protection and its social divergence 753
to further analyze the FPL policy’s influence on social diver- Supplement. The supplement related to this article is available on-
gence. line at: https://doi.org/10.5194/nhess-21-743-2021-supplement.
Author contributions. SD designed this study. DW implemented
5 Conclusions
data processing and analysis. DW, PS, and SD prepared the paper
with contributions from all co-authors.
A framework is developed to assess the county-level FPLs
in China based on the flood protection policy and relevant
socioeconomic variables of floodplains. The produced FPL Competing interests. The authors declare that they have no conflict
dataset shows a match ratio of 53.2 % with the designed of interest.
FPLs included in specific flood protection documents in a
sample of 171 counties. The policy-based FPL dataset con-
stitutes a substantial improvement on previous knowledge, Financial support. This research has been supported by the Na-
and the dataset is relatively accurate. This study thus agrees tional Natural Science Foundation of China (grant nos. 41871200,
with the argument of Scussolini et al. (2016) that flood pro- 41730642, and 51761135024), the National Key Research and De-
tection policy could be a valuable proxy for FPLs. However, velopment Program of China (grant no. 2017YFC1503001), and
there still may be significant differences between the policy- the Netherlands Organisation for Scientific Research (grant no. AL-
based FPLs and the actual flood protection because the latter WOP.164).
may be behind or ahead of the policy-required FPLs. The
FPL dataset was thus made open access to encourage rele-
vant users to check and improve it. Review statement. This paper was edited by Heidi Kreibich and re-
viewed by three anonymous referees.
The produced FPL dataset shows that western China is
dominated by low FPLs, while high-FPL counties are con-
centrated in the east. There are 282 counties with a high
FPL (≥ 50 years), which account for only 12.6 % of the to-
tal flood-prone counties but host 55.1 % (231.1 million) of References
the total exposed population. In contrast, more of the ex-
posed vulnerable population (52.3 % or 38 million) are con- Aerts, J.: A Review of Cost Estimates for Flood Adaptation, Water,
centrated in the low-FPL counties. Moreover, exposed pop- 10, 33, https://doi.org/10.3390/w10111646, 2018.
ulation grows rapidly (by 60.3 %) in the high-FPL counties, Aerts, J. C. J. H., Botzen, W. J. W., Emanuel, K., Lin, N., de
while the proportion of elders increases more rapidly in the Moel, H., and Michel-Kerjan, E. O.: Evaluating Flood Re-
low-FPL counties than in the high-FPL counties. These find- silience Strategies for Coastal Megacities, Science, 344, 472–
ings imply that the flood protection policy has a relatively 474, https://doi.org/10.1126/science.1248222, 2014.
efficient strategy to protect the majority of the exposed pop- Alfieri, L., Bisselink, B., Dottori, F., Naumann, G., de Roo, A.,
Salamon, P., Wyser, K., and Feyen, L.: Global projections of
ulation within a minority of well-protected counties. How-
river flood risk in a warmer world, Earths Future, 5, 171–182,
ever, the rapid growth of the exposed population can increase https://doi.org/10.1002/2016ef000485, 2017.
residual flood risk. Moreover, the disproportional concentra- Anselin, L.: Local Indicators of Spatial Association – LISA,
tion and rapid increase of the exposed vulnerable population, Geogr. Anal., 27, 93–115, https://doi.org/10.1111/j.1538-
particularly the elders, in the low-FPL counties can probably 4632.1995.tb00338.x, 1995.
increase the places’ vulnerability. Bai, X., Shi, P., and Liu, Y.: Realizing China’s urban dream, Nature,
Therefore, diversified adaptation measures including both 509, 158–160, https://doi.org/10.1038/509158a, 2014.
structural flood defenses and non-structural solutions should Birkmann, J., Welle, T., Solecki, W., Lwasa, S., and Garscha-
be employed to reduce flood risk in both the high- and low- gen, M.: Boost resilience of small and mid-sized cities, Nature,
FPL counties. Local demographic characteristics should be 537, 605–608, https://doi.org/10.1038/537605a, 2016.
considered for an economically and socially beneficial strat- Chakravorty, S., Koo, J., and Lall, S. V.: Metropolitan industrial
clusters; patterns and processes, the World Bank, the United
egy of flood adaptation. Particularly, the vulnerable popu-
States, 2003.
lation in the low-FPL counties should receive dedicated at- Cheng, X. and Li, C.: The Evolution Trend, Key Fea-
tention. This study shows that combining FPLs and demo- tures and Countermeasures of Urban Flood Risk,
graphic information is critical to understand and manage China Flood & Drought Management, 25, 6–9,
flood risk. https://doi.org/10.16867/j.cnki.cfdm.2015.03.002, 2015.
Cheng, X., Wan, H., Huang, S., Li, C., and Zhang, H.: Lessons
learned from the 2016 Yangtze River flood in Anhui province,
Data availability. The Chinese flood protection data are available China, International Journal of River Basin Management,
in the Supplement. Supporting data are accessible through the asso- 16, 307–314, https://doi.org/10.1080/15715124.2018.1437741,
ciated references. 2018.
https://doi.org/10.5194/nhess-21-743-2021 Nat. Hazards Earth Syst. Sci., 21, 743–755, 2021754 D. Wang et al.: Assessing Chinese flood protection and its social divergence Cross, J. A.: Megacities and small towns: different perspectives on Soc., 41, 170–179, https://doi.org/10.1016/j.scs.2018.05.047, hazard vulnerability, Global Environmental Change Part B: En- 2018. vironmental Hazards, 3, 63–80, https://doi.org/10.1016/S1464- Haer, T., Husby, T. G., Botzen, W. J. W., and Aerts, J. C. J. H.: 2867(01)00020-1, 2001. The safe development paradox: An agent-based model De Boer, J., Botzen, W. J. W., and Terpstra, T.: Im- for flood risk under climate change in the Euro- proving Flood Risk Communication by Focusing on pean Union, Global Environ. Chang., 60, 102009, Prevention-Focused Motivation, Risk Anal., 34, 309–322, https://doi.org/10.1016/j.gloenvcha.2019.102009, 2020. https://doi.org/10.1111/risa.12091, 2014. Hallegatte, S., Green, C., Nicholls, R. J., and Corfee-Morlot, J.: Fu- Deng, Y., Wu, H., Sun, D., and Zhao, Z.: Flood pro- ture flood losses in major coastal cities, Nat. Clim. Change, 3, tection capacity analysis on levee of Taihu Lake, 802–806, https://doi.org/10.1038/nclimate1979, 2013. China Flood Drought Management, 25, 72–75, Han, J., Zhang, Z., and Qi, Q.: Analysis and Visualization of the https://doi.org/10.16867/j.cnki.cfdm.2015.05.022, 2015. Uneven Distribution of Population in China, Geo-Information Di Baldassarre, G., Viglione, A., Carr, G., Kuil, L., Salinas, J. L., Science, 9, 14–19, https://doi.org/10.3969/j.issn.1560- and Blöschl, G.: Socio-hydrology: conceptualising human- 8999.2007.06.003, 2007. flood interactions, Hydrol. Earth Syst. Sci., 17, 3295–3303, Han, Y. P., Huang, Q. X., He, C. Y., Fang, Y. Q., Wen, J. H., Gao, J., https://doi.org/10.5194/hess-17-3295-2013, 2013. and Du, S. Q.: The growth mode of built-up land in floodplains Di Baldassarre, G., Viglione, A., Carr, G., Kuil, L., Yan, K., and its impacts on flood vulnerability, Sci. Total Environ., 700, Brandimarte, L., and Bloeschl, G.: DebatesPerspectives on 134462, https://doi.org/10.1016/j.scitotenv.2019.134462, 2020. socio-hydrology: Capturing feedbacks between physical He, C., Huang, Q., Dou, Y., Wei, T., and Liu, J.: The population in and social processes, Water Resour. Res., 51, 4770–4781, China’s earthquake-prone areas has increased by over 32 million https://doi.org/10.1002/2014wr016416, 2015. along with rapid urbanization, Environ. Res. Lett., 11, 074028, Division of Urban Social and Economic Survey of National Bureau https://doi.org/10.1088/1748-9326/aa5dec, 2016. of Statistics: Statistical Yearbook of Chinese Cities, China Sta- Huang, Q., Yin, D., He, C., Yan, J., Liu, Z., Meng, S., Ren, Q., tistical Press, Beijing, 2016. Zhao, R., and Inostroza, L.: Linking ecosystem services and Du, S., Cheng, X., Huang, Q., Chen, R., Ward, P. J., and subjective well-being in rapidly urbanizing watersheds: Insights Aerts, J. C. J. H.: Brief communication: Rethinking the 1998 from a multilevel linear model, Ecosyst. Serv., 43, 101106, China floods to prepare for a nonstationary future, Nat. Hazards https://doi.org/10.1016/j.ecoser.2020.101106, 2020. Earth Syst. Sci., 19, 715–719, https://doi.org/10.5194/nhess-19- Jiang, Y., Zhi, Y., Zhao, H., Liang, L., Cao, Y., and Gu, J.: 715-2019, 2019. Research status and prospects on water conservancy big Du, S., Scussolini, P., Ward, P. J., Zhang, M., Wen, J., Wang, L., data, Journal of Hydroelectric Engineering, 39, 1–32, Koks, E., Diaz-Loaiza, A., Gao, J., Ke, Q., and Aerts, J. C. J. H.: https://doi.org/10.11660/slfdxb.20201001, 2020. Hard or soft flood adaptation? Advantages of a hybrid Jongman, B.: Effective adaptation to rising flood risk COMMENT, strategy for Shanghai, Global Environ. Chang., 61, 102037, Nat. Commun., 9, 1986, https://doi.org/10.1038/s41467-018- https://doi.org/10.1016/j.gloenvcha.2020.102037, 2020. 04396-1, 2018. Du, S., Shen, J., Fang, J., Fang, J., Liu, W., Wen, J., Jongman, B., Ward, P. J., and Aerts, J. C. J. H.: Global ex- Huang, X., and Chen, S.: Policy delivery gaps in the posure to river and coastal flooding: Long term trends land-based flood risk management in China: A wider part- and changes, Global Environ. Chang., 22, 823–835, nership is needed, Environ. Sci. Policy, 116, 128–135, https://doi.org/10.1016/j.gloenvcha.2012.07.004, 2012. https://doi.org/10.1016/j.envsci.2020.11.005, 2021. Jongman, B., Hochrainer-Stigler, S., Feyen, L., Aerts, J., Mech- Du, S. Q., He, C. Y., Huang, Q. X., and Shi, P. J.: How ler, R., Botzen, W. J. W., Bouwer, L. M., Pflug, G., Ro- did the urban land in floodplains distribute and expand in jas, R., and Ward, P. J.: Increasing stress on disaster-risk fi- China from 1992–2015?, Environ. Res. Lett., 13, 034018, nance due to large floods, Nat. Clim. Change, 4, 264–268, https://doi.org/10.1088/1748-9326/aaac07, 2018. https://doi.org/10.1038/nclimate2124, 2014. Fang, Y. Q., Du, S. Q., Scussolini, P., Wen, J. H., He, C. Y., Jonkman, S. N.: Advanced flood risk analysis required, Nat. Clim. Huang, Q. X., and Gao, J.: Rapid Population Growth in Chinese Change, 3, 1004, https://doi.org/10.1038/nclimate2031, 2013. Floodplains from 1990 to 2015, Int. J. Env. Res. Pub. He., 15, Kates, R. W., Colten, C. E., Laska, S., and Leatherman, S. P.: 1602, https://doi.org/10.3390/ijerph15081602, 2018. Reconstruction of New Orleans after Hurricane Katrina: A re- Frigerio, I., Carnelli, F., Cabinio, M., and De Amicis, M.: Spa- search perspective, P. Natl. Acad. Sci. USA, 103, 14653–14660, tiotemporal Pattern of Social Vulnerability in Italy, Int. J. Disast. https://doi.org/10.1073/pnas.0605726103, 2006. Risk Sc., 9, 249–262, https://doi.org/10.1007/s13753-018-0168- Koks, E. E., Jongman, B., Husby, T. G., and Botzen, W. J. W.: 7, 2018. Combining hazard, exposure and social vulnerability to provide Goodchild, M. F. and Glennon, J. A.: Crowdsourcing geographic lessons for flood risk management, Environ. Sci. Policy, 47, 42– information for disaster response: a research frontier, Int. J. Digit. 52, https://doi.org/10.1016/j.envsci.2014.10.013, 2015. Earth, 3, 231–241, https://doi.org/10.1080/17538941003759255, Kwadijk, J. C. J., Haasnoot, M., Mulder, J. P. M., 2010. Hoogvliet, M. M. C., Jeuken, A. B. M., van der Krogt, R. A. A., Gu, H., Du, S., Liao, B., Wen, J., Wang, C., Chen, R., and Chen, B.: van Oostrom, N. G. C., Schelfhout, H. A., van Velzen, E. H., A hierarchical pattern of urban social vulnerability in Shanghai, van Waveren, H., and de Wit, M. J. M.: Using adaptation tipping China and its implications for risk management, Sustain. Cities points to prepare for climate change and sea level rise: a case Nat. Hazards Earth Syst. Sci., 21, 743–755, 2021 https://doi.org/10.5194/nhess-21-743-2021
D. Wang et al.: Assessing Chinese flood protection and its social divergence                                                               755

   study in the Netherlands, Wires Clim. Change, 1, 729–740,             The World Bank: Health Nutrition and Population Statistics: Pop-
   https://doi.org/10.1002/wcc.64, 2010.                                    ulation estimates and projections, the World Bank, the United
Li, Y. H., Jia, L. R., Wu, W. H., Yan, J. Y., and Liu, Y. S.:               States, 2019.
   Urbanization for rural sustainability – Rethinking China’s            Tian, Q. and Lemos, M. C.: Household Livelihood
   urbanization strategy, J. Clean Prod., 178, 580–586,                     Differentiation and Vulnerability to Climate Haz-
   https://doi.org/10.1016/j.jclepro.2017.12.273, 2018.                     ards in Rural China, World Dev., 108, 321–331,
Liang, P., Xu, W., Ma, Y., Zhao, X., and Qin, L.: Increase of Elderly       https://doi.org/10.1016/j.worlddev.2017.10.019, 2018.
   Population in the Rainstorm Hazard Areas of China, Int. J. Env.       United Nations: World Urbanization Prospects: The 2018 Revision,
   Res. Pub. He., 14, 963, https://doi.org/10.3390/ijerph14090963,          United Nations, the United States, 2018.
   2017.                                                                 Wang, Z., Yu, Y., Ji, Y., and He, X.: Discussion on the mechanism
Liu, S.: Calculation of Flood Control Capacity in Quzhou                    of temporary settlement and supply guarantee for residents in
   under Current Conditions, Journal of Zhejiang University                 the detention basin, Journal of Economics of Water Resources,
   of Water Resources and Electric Power, 29, 27–31, avail-                 34, 75–78 + 82, available at: https://kns.cnki.net/kcms/detail/
   able at: https://kns.cnki.net/kcms/detail/detail.aspx?FileName=          detail.aspx?FileName=SLJJ201605018&DbName=CJFQ2016
   ZJSL201705007&DbName=CJFQ2017 (last access: 22 Febru-                    (last access: 22 February 2021), 2016.
   ary 2021), 2017.                                                      Ward, P. J., Jongman, B., Weiland, F. S., Bouwman, A.,
Liu, Y. S. and Li, Y. H.: Revitalize the world’s countryside, Nature,       van Beek, R., Bierkens, M. F. P., Ligtvoet, W., and Win-
   548, 275–277, https://doi.org/10.1038/548275a, 2017.                     semius, H. C.: Assessing flood risk at the global scale: model
Meng, X.: People Flocking to China’s Cities, Science, 343, 138–             setup, results, and sensitivity, Environ. Res. Lett., 8, 044019,
   139, https://doi.org/10.1126/science.1244814, 2014.                      https://doi.org/10.1088/1748-9326/8/4/044019, 2013.
Mokrech, M., Kebede, A. S., Nicholls, R. J., Wimmer, F., and             Ward, P. J., Jongman, B., Aerts, J., Bates, P. D., Botzen, W. J. W.,
   Feyen, L.: An integrated approach for assessing flood impacts            Loaiza, A. D., Hallegatte, S., Kind, J. M., Kwadijk, J.,
   due to future climate and socio-economic conditions and the              Scussolini, P., and Winsemius, H. C.: A global frame-
   scope of adaptation in Europe, Climatic Change, 128, 245–260,            work for future costs and benefits of river-flood protec-
   https://doi.org/10.1007/s10584-014-1298-6, 2015.                         tion in urban areas, Nature Clim. Change, 7, 642–646,
National Bureau of Statistics of China: China Statistical Yearbook          https://doi.org/10.1038/nclimate3350, 2017.
   2014, Beiijing, China, 2015.                                          Willner, S. N., Levermann, A., Zhao, F., and Frieler, K.:
Qiang, Y.: Disparities of population exposed to flood hazards               Adaptation required to preserve future high-end river
   in the United States, J. Environ. Manage., 232, 295–304,                 flood risk at present levels, Sci. Adv., 4, 1914,
   https://doi.org/10.1016/j.jenvman.2018.11.039, 2019.                     https://doi.org/10.1126/sciadv.aao1914, 2018.
Rudari, R., Silvestro, F., Campo, L., Rebora, N., Boni, G., and          Winsemius, H. C., Jongman, B., Veldkamp, T. I. E., Hallegatte, S.,
   Herold, C.: Improvement of the global food model for the                 Bangalore, M., and Ward, P. J.: Disaster risk, climate change,
   GAR 2015, United Nations Office for Disaster Risk Reduction              and poverty: assessing the global exposure of poor people
   (UNISDR), Centro Internazionale in Monitoraggio Ambientale               to floods and droughts, Environ. Dev. Econ., 23, 328–348,
   (CIMA), UNEP GRID, Arendal, 69, 2015.                                    https://doi.org/10.1017/s1355770x17000444, 2018.
Salvati, P., Petrucci, O., Rossi, M., Bianchi, C., Pasqua, A. A., and    Wu, J., Huang, L., Liu, Y., Peng, J., Li, W., Gao, S.,
   Guzzetti, F.: Gender, age and circumstances analysis of flood and        and Kang, C.: Traffic Flow Simulation Based on Call
   landslide fatalities in Italy, Sci. Total Environ., 610, 867–879,        Detail Records, Acta Geogr. Sin., 67, 1657–1665,
   https://doi.org/10.1016/j.scitotenv.2017.08.064, 2018.                   https://doi.org/10.11821/xb201212007, 2012.
Scussolini, P., Aerts, J. C. J. H., Jongman, B., Bouwer, L. M., Win-     Zhou, Z.: Research on Influence of Land Subsidence on Flood
   semius, H. C., de Moel, H., and Ward, P. J.: FLOPROS: an evolv-          Control Capacity in the Downstream Area of Daqing River,
   ing global database of flood protection standards, Nat. Hazards          Yellow River 40, 43–48, https://doi.org/10.3969/j.issn.1000-
   Earth Syst. Sci., 16, 1049–1061, https://doi.org/10.5194/nhess-          1379.2018.06.010, 2018.
   16-1049-2016, 2016.                                                   Zhu, B., Fu, Y., Liu, J. L., He, R. X., Zhang, N., and Mao, Y.: Detect-
Shen, J., Du, S. Q., Huang, Q. X., Yin, J., Zhang, M., Wen, J. H., and      ing the priority areas for health workforce allocation with LISA
   Gao, J.: Mapping the city-scale supply and demand of ecosystem           functions: an empirical analysis for China, BMC Health Serv.
   flood regulation services-A case study in Shanghai, Ecol. Indic.,        Res., 18, 14, https://doi.org/10.1186/s12913-018-3737-y, 2018.
   106, 8, https://doi.org/10.1016/j.ecolind.2019.105544, 2019.
Smith, A., Bates, P. D., Wing, O., Sampson, C., Quinn, N., and
   Neal, J.: New estimates of flood exposure in developing coun-
   tries using high-resolution population data, Nat. Commun., 10,
   7, https://doi.org/10.1038/s41467-019-09282-y, 2019.

https://doi.org/10.5194/nhess-21-743-2021                                          Nat. Hazards Earth Syst. Sci., 21, 743–755, 2021
You can also read


