Detection of biosensors on a 1 T benchtop spectrometer
←
→
Page content transcription
If your browser does not render page correctly, please read the page content below
Magn. Reson., 2, 409–420, 2021                                                                           Open Access
https://doi.org/10.5194/mr-2-409-2021
© Author(s) 2021. This work is distributed under
the Creative Commons Attribution 4.0 License.

             129
             Xe ultra-fast Z spectroscopy enables micromolar
        detection of biosensors on a 1 T benchtop spectrometer
                 Kévin Chighine, Estelle Léonce, Céline Boutin, Hervé Desvaux, and Patrick Berthault
                   Nanosciences et Innovation pour les Matériaux, la Biomédecine et l’Energie, CEA, CNRS,
                                    Université Paris-Saclay, 91191, Gif-sur-Yvette, France
                               Correspondence: Patrick Berthault (patrick.berthault@cea.fr)

                                   Received: 18 March 2021 – Discussion started: 26 March 2021
                             Revised: 18 May 2021 – Accepted: 31 May 2021 – Published: 11 June 2021

       Abstract. The availability of a benchtop nuclear magnetic resonance (NMR) spectrometer, of low cost and
       easily transportable, can allow detection of low quantities of biosensors, provided that hyperpolarized species
       are used. Here we show that the micromolar threshold can easily be reached by employing laser-polarized xenon
       and cage molecules reversibly hosting it. Indirect detection of caged xenon is made via chemical exchange,
       using ultra-fast Z spectroscopy based on spatio-temporal encoding. On this non-dedicated low-field spectrometer,
       several ideas are proposed to improve the signal.

1   Introduction                                                  they are functionalizable by ligands (Brotin and Dutasta,
                                                                  2009). For instance, to our knowledge, only one example of
                                                                  chemical functionalization of a xenon host other than cryp-
In this sad period overshadowed by pandemic, among the an-        tophane – a cucurbituril – has been reported in the liter-
alytical methods aiming at imaging the lung–blood transfer,       ature (Truxal et al., 2019). The approach of 129 Xe NMR-
hyperpolarized xenon nuclear magnetic resonance/magnetic          based biosensing using functionalized cryptophanes has been
resonance imaging (NMR/MRI) increasingly interests the            successfully applied in vitro for detection of small analytes
“in vivo” scientific community. While xenon nuclear po-           (Tassali et al., 2014; Dubost et al., 2014; Jeong et al., 2015;
larization can easily be boosted via spin-exchange optical        Yang et al., 2016; Guo et al., 2016; Yang et al., 2017), of
pumping (Walker and Happer, 1997, SEOP), the other in-            large biosystems (Wei et al., 2006; Chambers et al., 2009;
terest of this noble gas for NMR is that it exhibits a wide       Boutin et al., 2011; Rose et al., 2014; Taratula et al., 2015;
chemical shift range (more than 320 ppm for the monoatomic        Khan et al., 2015; Riggle et al., 2017; Milanole et al., 2017;
species) and is soluble in most biological fluids. Therefore,     Schnurr et al., 2020), or of change in physiological condi-
xenon is a powerful exogenous probe of the functioning of         tions: temperature (Schröder et al., 2008; Schilling et al.,
the air–blood barrier (Driehuys et al., 2006). Moreover, it       2010) or pH (Léonce et al., 2018). To date, it has however
is prone to opening the way to molecular magnetic reso-           never been used in vivo; only a proof of concept has been per-
nance imaging. In an approach pioneered by A. Pines and           formed on rats using a non-functionalized cucurbituril (Hane
co-workers (Spence et al., 2001), xenon is reversibly encap-      et al., 2017). Several difficulties or obstacles have delayed
sulated in molecular systems that are functionalized with bio-    in vivo applications, among which is obviously the lack of
logical ligands. This two-step procedure, where the bioprobe      sensitivity.
is first introduced and hyperpolarized xenon then delivered,         We made the remark that in a pre-clinical environment,
benefits from the difference in resonance frequency between       it could be very useful to test the behavior of such bio-
bound xenon and free xenon (in the gas phase or in the dis-       probes in NMR, using a benchtop spectrometer, less cum-
solved phase; cf. Berthault et al., 2009).                        bersome and less expensive than a high-field spectrometer.
   In this method, most of the studies used cryptophane           It could be placed very close to the optical pumping setup,
derivatives as xenon hosts, as despite a complex synthesis

Published by Copernicus Publications on behalf of the Groupement AMPERE.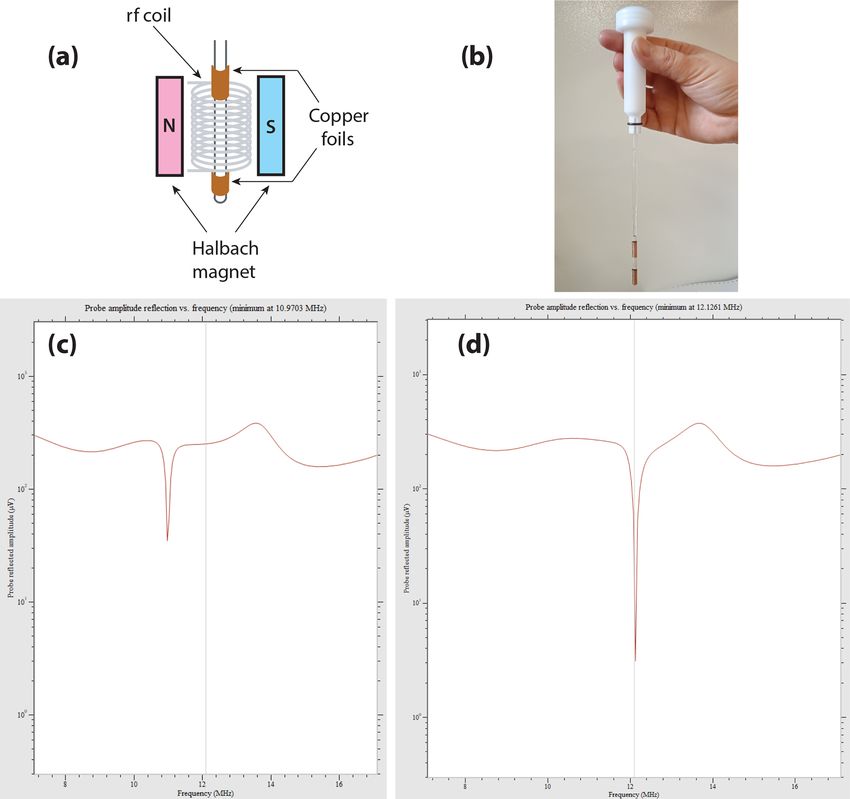
410                                                                   K. Chighine et al.: Micromolar detection on a 1 T spectrometer

Figure 1. Generic structure of the cryptophanes used in this study.
For compound 1: m = 2 and n = 3; for 2: m = 3 and n = 2.

working in flow or batch modes. The present work aims at
assessing the feasibility of the detection of low concentra-
tions of 129 Xe NMR-based biosensors using a non-dedicated
benchtop spectrometer. After a brief description of our spin-             Figure 2. Principle of the experiments. Laser-polarized xenon is
exchange optical pumping setup working in the batch mode,                 produced via spin-exchange optical pumping in batch mode with
                                                                          the setup described in Chauvin et al. (2016). BE: beam expander;
direct and indirect detection techniques are studied at both
                                                                          BS: polarization beam-splitter cube; MI: mirror; λ/4: quarter-wave
low and high magnetic fields. Theoretical considerations are              plates; PW: power meter. The black vertical rectangle represents
given, and practical ways of improvement are analyzed.                    the coils, which deliver a magnetic field B co-linearly to the photon
                                                                          beam. A picture of the optical pumping cell is given in the inset. Af-
2     Results                                                             ter some minutes of optical pumping, frozen hyperpolarized xenon
                                                                          is transported to the NMR spectrometers. The disposition of the
2.1    Molecular systems                                                  NMR tube inside the magnet, the static and radiofrequency fields
                                                                          as well as the axis of the gradient are indicated on the benchtop
For such a study, we decided to use two water-soluble cryp-               spectrometer.
tophanes, synthesized by the group of T. Brotin at ENS
Lyon and previously characterized (Huber et al., 2006). Their
generic structure is depicted in Fig. 1. In cryptophane 1                 gen. This procedure enabled us to transfer all xenon above
the two cyclotriveratrilene bowls are connected by two O-                 the solution without freezing it. Finally, fast heating and vig-
(CH2 )2 -O linkers and a O-(CH2 )3 -O linker; in cryptophane 2            orous shaking of the tube sped up the dissolution of the noble
they are connected by two O-(CH2 )3 -O linkers and a O-                   gas into the sample of interest. This method, proven efficient
(CH2 )2 -O linker. Xenon inside these cage molecules res-                 for high magnetic field experiments, is not directly translat-
onates at 52 ppm (for Xe@1) and 42 ppm (for Xe@2) if one                  able to the NMR experiments in the benchtop spectrometer.
calibrates the signal of free xenon in water at 196 ppm. These            All attempts to use the fringe field of the permanent mag-
two molecular systems could be used as probes for pH, as the              net during the xenon transfer and shaking step led to dis-
chemical shift of caged xenon varies as a function of the con-            appointing results in terms of remaining polarization. This
centration in H+ ions (Léonce et al., 2018).                              was expected as the magnet, of the Halbach type, delivers a
                                                                          horizontal static magnetic field with a steep slope in inten-
                                                                          sity and direction in the vertical dimension, and thus xenon
2.2    Addition of hyperpolarized xenon into the samples
                                                                          may cross areas of a null field during its introduction in the
The principle of the experiments is depicted in Fig. 2. Xenon             spectrometer. The least bad solution was thus to carry out
enriched at 83 % in isotope 129 was polarized via spin-                   the introduction of polarized xenon inside the NMR tube in
exchange optical pumping using a home-made setup already                  the fringe field of the superconducting magnet and then to
described in Chauvin et al. (2016). After about 10 min of                 quickly shake the tube in this magnetic environment before
optical pumping, hyperpolarized xenon was collected frozen                transporting it to the benchtop spectrometer. The following
and transported immersed in liquid nitrogen inside a 0.3 T                shaking, carried out as close as possible to the permanent
solenoid fed by a car battery. Then, in the fringe field of the           magnet, leads to a faster depolarization.
unshielded 11.7 T magnet, xenon was heated and transferred                   Without optimization other than the setting of the quarter-
to the capped NMR tube containing the sample, thanks to                   wave plates, this robust setup gave us a useable polarization
a vacuum line and a hollow spinner filled with liquid nitro-              of ca. 0.15, as measured in the gas phase on the 11.7 T spec-

Magn. Reson., 2, 409–420, 2021                                                                   https://doi.org/10.5194/mr-2-409-2021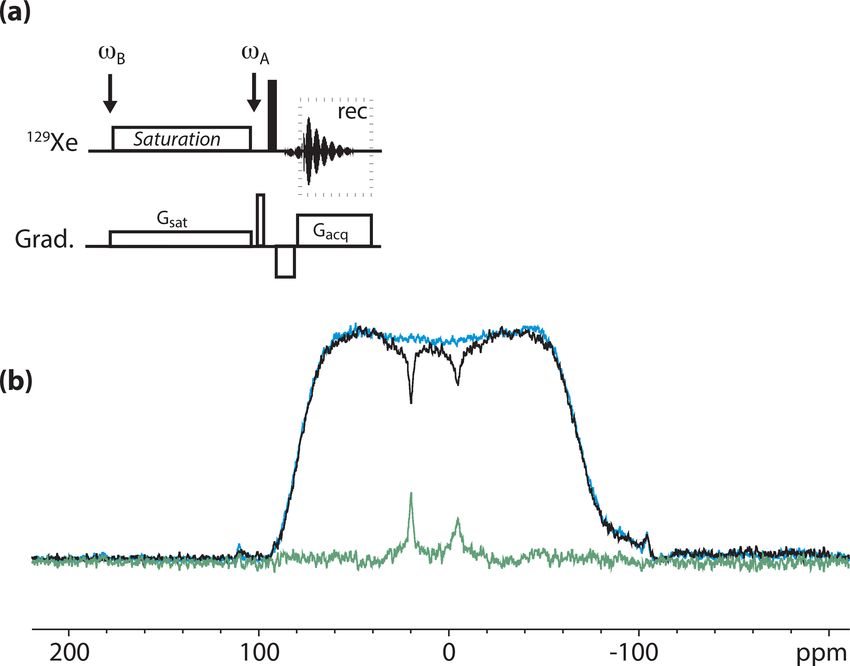
K. Chighine et al.: Micromolar detection on a 1 T spectrometer                                                                    411

                                                                     et al., 2006), at low static magnetic field one of the latter
                                                                     signals disappears or is hardly observable. The full-width at
                                                                     half-maximum of the Xe@1 signals was roughly measured
                                                                     to 44 and 20 Hz at 11.7 and 1 T, respectively. The presence
                                                                     of a narrow peak at 11.7 T and a very broad line at 1 T for
                                                                     Xe@2 reveals the weakness of the direct detection approach,
                                                                     even if one uses a fast repetition “frequency-selective pulse
                                                                     – detection” (Berthault et al., 2008). When the lines are so
                                                                     broad and the signal to noise so low, each of these acquisi-
                                                                     tions brings a lot of noise, and the resulting signal is difficult
                                                                     to distinguish from the baseline.

                                                                     2.4   Indirect detection
                                                                     It is well known that the detection of diluted species in
                                                                     exchange with a main spin reservoir can be facilitated by
Figure 3. One-scan 129 Xe NMR spectra of the noble gas into a        taking advantage of this exchange. This has given rise to
water solution of cryptophanes 1 and 2, both at 77 µM and 295 K,     the Chemical Exchange Saturation Transfer (CEST) exper-
with the same pulse flip angle. Top spectrum performed at 11.7 T;    iments, whose principle lies in the radio-frequency (rf) satu-
bottom spectrum performed at 1 T.
                                                                     ration at the frequency of these diluted species and the obser-
                                                                     vation of the subsequent loss of magnetization of the main
trometer by comparison with the thermal equilibrium NMR              reservoir due to the exchange (see for instance Vinogradov
signal.                                                              et al., 2013). Schröder and co-workers have extended this ap-
   The pressure in the NMR tube on top of the solution was           proach to hyperpolarized species, creating the Hyper-CEST
ca. 1 bar, as estimated post NMR experiment by weighing the          sequence (Schröder et al., 2006).
tube before and after degassing.                                        However, sequences of the CEST family are usually re-
                                                                     stricted to high magnetic fields. For instance, for detection of
                                                                     metabolites such as glutamate or carnosine, 1 H CEST is an
2.3   Direct detection of 129 Xe NMR-based biosensors                efficient method (Cai et al., 2012; Bodet et al., 2015). How-
Figure 3 displays a comparison of one-scan 129 Xe NMR                ever, it would not come to mind to use a CEST sequence with
spectra of the same sample of cryptophanes dissolved at a            a low magnetic field, as the frequency splitting between the
concentration of 77 µM in D2 O, at 11.7 and 1 T (same NMR            two environments in exchange is only ca. 3.3 ppm (140 Hz
tube). The two spectra were recorded with different xenon            at 1 T). However, due to the very wide chemical shift range
batches but acquired in the same experimental conditions.            of xenon, this can be envisioned in the case of 129 Xe NMR-
   Not surprisingly, the signal-to-noise ratio is better at 11.7 T   based biosensors.
than at 1 T. For information purposes only, they were mea-              Due to the huge advantage of a spectrum-per-spectrum av-
sured at 2492 and 1142, respectively, taking into account the        eraging instead of a point-per-point averaging for hyperpo-
signal of free xenon in water. Obviously, if the xenon nuclear       larized species, we decided to turn to the ultra-fast version
polarization should be similar for the two experiments as it         of the CEST experiment, initially proposed by Jerschow and
directly derives from the optical pumping step, the signal-          co-workers in 1 H (Xu et al., 2013). In this sequence, satura-
to-noise ratios are expected to be very different due to the         tion is applied in the presence of a gradient, which amounts
detection part. Indeed, in classical NMR, it is the magnetic         to saturating only a slice of the sample. After a read pulse, the
induction proportional to the temporal derivative of the com-        receiver is open in the presence of a second gradient which
ponent of the magnetization perpendicular to the static mag-         decodes the profile of the sample along it. By subtracting
netic field that is detected, and thus the Larmor frequency          two experiments recorded with and without saturation, one
on the one hand and all geometrical and electronic param-            obtains the Z spectrum. Note that this sequence can be com-
eters defining the sensitivity (coil geometry, useful volume,        bined with localized spectroscopy or imaging schemes; see,
quality factor, tuning frequency, filter and digitization) on the    for instance, Döpfert et al. (2014b), Xu et al. (2016), and Liu
other hand would have to be considered for comparing the             et al. (2016).
signal-to-noise ratio.                                                  In the past, the ultra-fast Z spectroscopy (UFZ) experiment
   From Fig. 3, several remarks can be made. While at                was successfully applied in hyperpolarized 129 Xe NMR for
high field the 129 Xe NMR spectrum displays one signal               the study of biosensors by us and others (Boutin et al., 2013;
at 196 ppm corresponding to free xenon in water and two              Döpfert et al., 2014a) and also for detection of low numbers
distinct signals at high field corresponding to caged xenon          of biological cells (Berthault and Boutin, 2015).
(Xe@1 at 52 ppm and Xe@2 at 42 ppm according to Huber

https://doi.org/10.5194/mr-2-409-2021                                                            Magn. Reson., 2, 409–420, 2021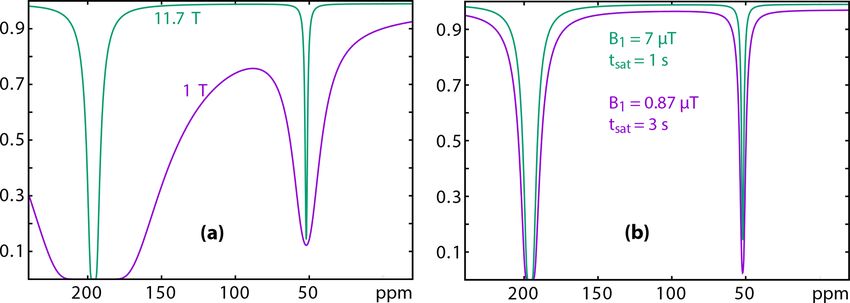
412                                                                     K. Chighine et al.: Micromolar detection on a 1 T spectrometer

                                                                            Figure 5. 129 Xe UFZ spectrum of the noble gas into the solu-
                                                                            tion containing the cryptophane mixture at 1 T and 295 K, using the
                                                                            same pulse sequence as for Fig. 4 (sum of two experiments with sat-
                                                                            urations of 2 and 4 s). The saturation offset was placed at the Xe@1
                                                                            frequency. In black: the profile obtained after saturation at a field
                                                                            strength B1 = ω1 /γ = 0.87 µT (on experiment); in blue: same pro-
Figure 4. (a) Pulse sequence used for the 129 Xe UFZ spectroscopy.
                                                                            file without saturation (off experiment); other important parameters:
ωB and ωA denote the rf offset placed in the region of caged xenon          Gsat = 21 mT m−1 ; Gacq = 84 mT m−1 .
and at the frequency of free xenon, respectively. (b) 129 Xe UFZ
spectrum of the noble gas into the solution containing the crypto-
phane mixture at 11.7 T and 295 K. In black: the profile obtained           is broader than that of Xe@1, which can be explained by a
after 2 s saturation at a field strength B1 = ω1 /γ = 7 µT (on exper-       faster xenon in–out exchange.
iment); in blue: same profile without saturation (off experiment);             Figure 5 displays an 129 Xe UFZ spectrum recorded on the
in green: off–on. Other important parameters: Gsat = 35 mT m−1 ;            cryptophane mixture at 1 T and 295 K. For the spatial en-
Gacq = 90 mT m−1 .                                                          coding of the 129 Xe UFZ-spectroscopy experiment, on the
                                                                            Magritek SpinSolve C spectrometer we had the choice of us-
                                                                            ing the shim system to create pulsed field gradients in the x,
                                                                            y or z directions or using the installed gradient system. The
   Note that Gouilleux and co-workers were the first to use                 latter gradient is oriented horizontally, while the main axis of
pulsed field gradients and to implement spatially encoded                   the NMR tube is vertical (see Fig. 2). It could have been inter-
pulse sequences on a low magnetic field spectrometer, which                 esting to use the shim along the NMR tube axis, as the mag-
allowed access to experiments such as DOSY and ultra-fast                   netization profile would have been along the largest dimen-
COSY; see a review in Gouilleux et al. (2020). On the other                 sion of the tube and would have given a flat profile. However,
hand, King et al. have demonstrated the performance of ultra-               for stability reasons we decided to use the nominal gradient
fast multidimensional Laplace NMR – based also on spatial                   system. This explains the rounded shape of the magnetization
encoding – on a low-field, single-sided magnet to derive T1 –               profile envelope, corresponding to an axial projection of the
T2 and D–T2 correlation maps (King et al., 2016, 2018). This                tube. Note that quantitative interpretation of the UFZ spec-
method reveals its full potential when used with DNP hyper-                 tra, e.g., to extract exchange rates from a set of UFZ spectra,
polarized species.                                                          would need consideration of the excitation–detection profile
   For this study, we used the pulse sequence depicted in                   of the rf coil (Ahola et al., 2015).
Fig. 4a. It contains an rf offset switch: the first value, ωB ,                The gradient strength was firstly calibrated by acquiring a
is centered on the Xe@cryptophanes region (i.e., around                     1D axial profile of the tube in 1 H. Then we chose the value of
45 ppm), while the second value, ωA , is applied on-resonance               the gradient simultaneous to 129 Xe saturation, Gsat , keeping
with the free xenon frequency. Such a sequence is not in-                   in mind that it had to induce a spectral expansion of the signal
tended to provide the full Z spectrum (saturation at the free               saturation smaller than the difference between the free xenon
xenon frequency would be disastrous for hyperpolarization)                  frequency ωA and the caged xenon frequency ωB , thus filling
but is prone to revealing the presence of caged xenon (cf.                  the condition
Boutin et al., 2013, for details).
   Figure 4b displays an 129 Xe UFZ spectrum recorded on                    γ · Gsat · d < |ωA − ωB |,
the cryptophane mixture at 11.7 T and 295 K.
   The apparent chemical shift splitting between the two dips               with d the inner diameter of the tube. In our case, d =
can be measured at 25.4 ppm, which corresponds well to the                  0.43 cm, γ = −11.79 MHz T−1 , and |ωA − ωB | ' 1800 Hz
real chemical shift splitting of 10 ppm when the ratio be-                  means that Gsat must be lower than 35.5 mT m−1 .
tween the saturation and acquisition gradients is considered                  The profile of the UFZ spectrum reveals two dips corre-
(see the theoretical part). The dip corresponding to Xe@2                   sponding to xenon in the two cryptophanes, with an apparent

Magn. Reson., 2, 409–420, 2021                                                                     https://doi.org/10.5194/mr-2-409-2021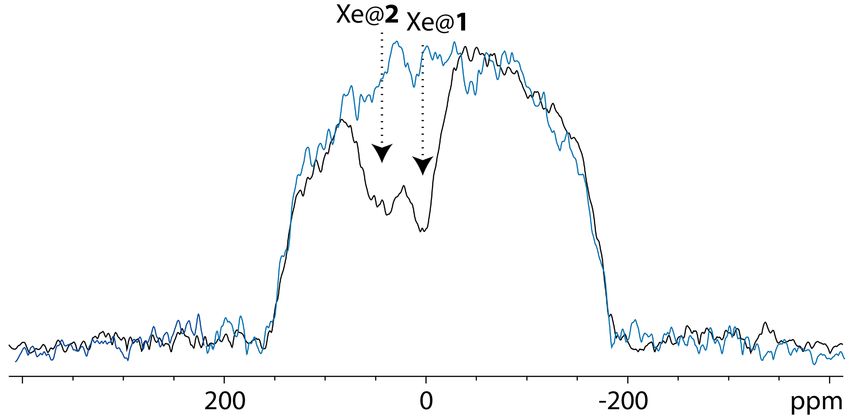
K. Chighine et al.: Micromolar detection on a 1 T spectrometer                                                                       413

                                                                       – Parameters common to both fields: f = 0.04; kout =
                                                                         50 s−1 ; δA = 196 ppm; δB = 52 ppm

                                                                       – Spinsolve (Larmor frequency = 12.09 MHz): R1A =
                                                                         0.01 s−1 ; R2A = 20 s−1 ; ω1 = 64.7 rad s−1 (0.87 µT);
                                                                         tsat = 3 s

                                                                       – Avance (Larmor frequency = 138.36 MHz): R1A =
                                                                         0.01 s−1 ; R2A = 50 s−1 ; ω1 = 521.4 rad s−1 (7 µT);
                                                                         tsat = 1 s

                                                                        Comparison between the two 129 Xe Z spectra simulated
                                                                     with realistic conditions evidences firstly the effect of the
                                                                     smaller frequency splitting on Magritek. Despite lower re-
                                                                     laxation rates and despite a weaker saturation strength at low
Figure 6. 129 Xe UFZ spectrum of the noble gas into the solution     field, the direct relaxation term λdirect (ωi , ω1 ) has a larger in-
containing the cryptophane mixture at 1 T and 295 K, using the
                                                                     fluence on the baseline in the Xe@cryptophane region (pur-
same pulse sequence as for Fig. 5, except that the saturation gra-
dient is opposite: Gsat = −21 mT m−1 ; Gacq = 84 mT m−1 . Satu-
                                                                     ple curve). This term decreases the signal by about 3 %. This
ration delay: 3 s.                                                   reveals that the saturation field strength must stay small to
                                                                     ensure the success of the experiment. Secondly, such a small
                                                                     ω1 requires a longer saturation time. With a saturation time
frequency splitting of about 40 ppm, which is the expected           tsat 3 times longer than the one used at high field, the dip in
value for Xe@1 and Xe@2 given the ratio Gsat /Gacq . The rf          the Xe@cryptophane region has almost the same depth.
carrier having been placed on resonance with the Xe@1 fre-              The second simulation considered two cryptophanes with
quency, we have assigned the dips as displayed in Fig. 5. The        characteristics close to the ones used in the present study.
apparent reverse frequency axis is due to the relative sign of       The parameters of the 129 Xe Z spectra were those of the real
the two gradients. Obviously the separation between the dips         experiment on the benchtop spectrometer:
is less net than at high field, and to confirm our assignment,
                                                                       – Parameters common to both cryptophanes: Larmor
we have performed the same experiment with another xenon
                                                                         frequency = 12.09 MHz; R1A = 0.1 s−1 ; R2A = 10 s−1 ;
batch, simply inverting the sign of Gsat . The corresponding
                                                                         tsat = 3 s
two-scan UFZ spectrum is displayed in Fig. 6.
   In order to model the behavior of the Z spectra as a func-          – Cryptophane 1: f = 0.037; kout = 50 s−1 ; δB = 52 ppm
tion of the experimental parameters, we have simulated the
Hyper-CEST experiment (see theoretical section). As input              – Cryptophane          2:      f = 0.025;        kout = 100 s−1 ;
of these simulations, R1A can be measured in a experiment                δB = 42 ppm
consisting of a series {small flip angle pulse – detection} by
taking into account the flip angle. R2A can be roughly esti-            Figure 8 displays the effect of the saturation strength ω1 on
mated from the line width of A but with a large uncertainty.         the aspect of the 129 Xe Z spectrum of the cryptophane mix-
f can be directly determined from a simple 129 Xe spectrum           ture (only the 0–100 ppm region is displayed). At low satu-
as it is the ratio of signal B to signal A. However, the param-      ration strength, the signal of the cryptophane with the high-
eter which remains difficult to predict or estimate is kout .        est f/kout is predominant, as expected (see theoretical part).
   In a first step, we used Eqs. (13) and (11) to simulate the       Then, when ω1 increases, the second dip becomes more pro-
trends on the 129 Xe UFZ spectra recorded at 11.7 and 1 T            nounced, larger than the first one due to the higher kout value
(Fig. 7). In Fig. 7a, in order to show the effect of the Lar-        (Eq. 9). However, increasing further ω1 leads to significant
mor frequency, all other parameters have been kept identi-           lowering of the baseline and thus of the contrast, and the sig-
cal (f is the fraction of caged xenon; kout is the xenon out         nals are less separated. Thus a compromise has to be found
rate): f = 0.04; kout = 50 s−1 ; δA = 196 ppm; δB = 52 ppm;          to favor detection of the dips and maximize their separation.
R1A = 0.01 s−1 ; R2A = 50 s−1 ; ω1 = 521.4 rad s−1 (7 µT);           With the current conditions of the simulation, a value of ω1
tsat = 1 s.                                                          between 50 and 150 rad s−1 seems best.
   This simulation shows that the rf saturation strength must           These simulations have helped us to find the best experi-
be reduced on the low-field spectrometer in order to keep a          mental conditions.
flat baseline, due to the low difference between the free and           In such an approach, the detection threshold can further be
bound xenon resonance frequencies.                                   lowered, maybe at the price of a lack of discrimination be-
   Figure 7b displays the simulation for more realistic exper-       tween two minor sites in exchange with the main signal. As
imental conditions. The parameters were the following.               an example that does not seek to be a record, this experiment
                                                                     has been repeated with a solution containing cryptophane 2

https://doi.org/10.5194/mr-2-409-2021                                                              Magn. Reson., 2, 409–420, 2021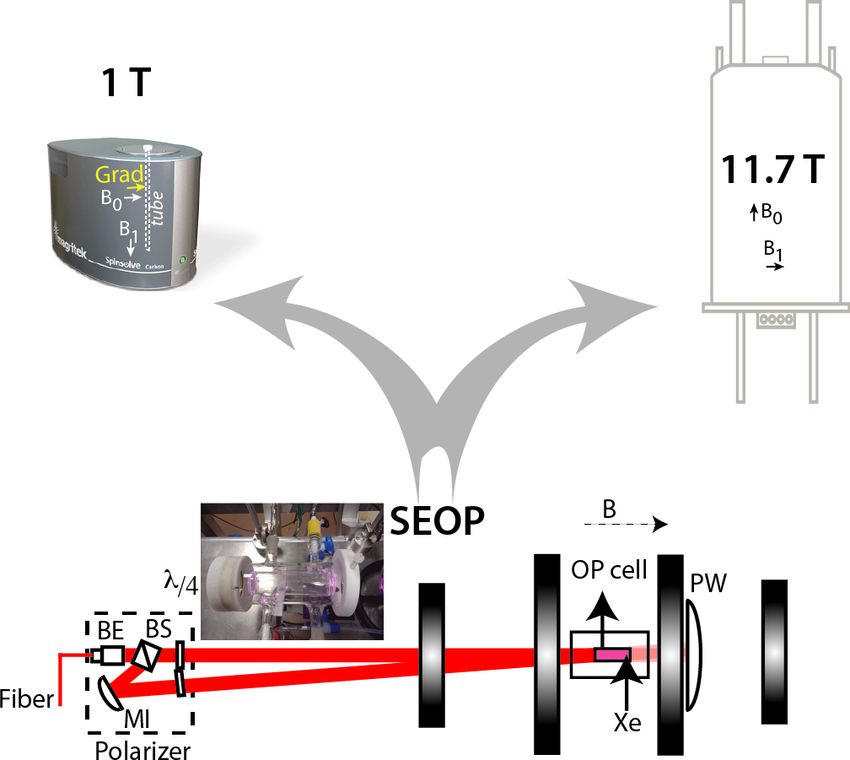
414                                                                    K. Chighine et al.: Micromolar detection on a 1 T spectrometer

Figure 7. Simulation of 129 Xe Z spectra at 11.7 (green) and 1 (purple) Tesla. (a) Considering the same relaxation times, same rf field strength
and duration of the saturation; (b) considering a saturation of lower amplitude but larger duration for the low-field experiment. Details of the
conditions for the simulation: see text.

                                                                           Figure 9. 129 Xe UFZ spectrum of the noble gas into the solution
                                                                           containing cryptophane 2 at 19.2 µM. Magnetic field: 1 T; temper-
Figure 8. Simulation of 129 Xe Z spectra at 1 T for a mixture of two
                                                                           ature 295 K, same pulse sequence as for Fig. 4 (one scan). ωB was
cryptophanes according to the saturation field strength. Conditions        placed at the Xe@2 frequency. Profile obtained after 3 s satura-
for the simulation: see text.                                              tion at a field strength B1 = ω1 /γ = 1.24 µT. Gsat = 21 mT m−1 ;
                                                                           Gacq = 84 mT m−1 .

at a concentration of 19.2 µM. Figure 9 displays the 129 Xe
UFZ profile. With respect to the previous experiments, only                each introduction of hyperpolarized xenon by three cycles of
the saturation field strength has been slightly increased from             helium bubbling and then evacuation.
0.87 to 1.24 µT (ω1 = 64.7 to 92.4 rad s−1 ). The dip corre-
sponding to caged xenon appears clearly.                                   3.2   Observation of 129 Xe on the 11.7 T spectrometer

                                                                           The experiments were performed at 295 K on a Bruker
3     Materials and methods                                                Avance II spectrometer equipped with a dual 129 Xe-1 H probe
                                                                           head and a GREAT3/10 three-axis gradient amplifier.
3.1    Preparation of the samples
                                                                           3.3   Observation of 129 Xe on the benchtop spectrometer
A mother solution of cryptophane 1 was prepared by disso-
lution of 0.64 mg of the powder in 500 µL D2 O and 20 µL                   The experiments were performed at 295 K on a Magritek
NaOD 0.1 M. The same preparation was done for crypto-                      SpinSolve Carbon spectrometer at a magnetic field of 1.02 T
phane 2; 50 µL of each of these solutions were mixed, and                  (1 H Larmor frequency 43.71 MHz), the temperature of the
then the solution was diluted by a factor 5 in D2 O, giving re-            permanent magnet being 301 K. The X channel of the low-
sulting concentrations of 77 µM for cryptophane 1 and 78 µM                field spectrometer being initially optimized for 13 C (i.e.,
for cryptophane 2. The solution was placed in a 5 mm NMR                   10.9 MHz), it was necessary to lower the temperature of the
tube equipped with a valve. The tube was degassed before                   permanent magnet in order to approach the 129 Xe Larmor

Magn. Reson., 2, 409–420, 2021                                                                    https://doi.org/10.5194/mr-2-409-2021
K. Chighine et al.: Micromolar detection on a 1 T spectrometer 415
frequency (12.1 MHz). Obviously, the situation is not opti- – A direct effect linked to the rf saturation at an off-
mal for 129 Xe, and the value of the 90◦ pulse was measured set 1i = ωi − ωA from the main resonance, which tilts
ω1
to 150 µs at full power. This was calibrated with a sample of the magnetization by an angle θi = tan−1 |1 i|
with θi in
thermal xenon inside dodecane doped with Gd3+ ions. Note [−π/2 : π/2] (Desvaux and Berthault, 1999). The mag-
that at such a low field, the paramagnetic doping was not netization transverse to this effective field is averaged
very efficient, and a T1 of ca. 10 s was found for 129 Xe in this out by rf field inhomogeneity and transverse relaxation.
solution. The same procedure was used to calibrate the B1 The magnetization aligned with the effective field is go-
strength value for saturation. ing to relax. This effect, present even in the absence of
The SpinSolve software in expert mode was used to create exchange, is characterized by the depolarization rate:
the pulse programs that were not in the Magritek library. In
particular, the ultra-fast Z spectroscopy sequence was written λdirect (ωi , ω1 ) = R1A cos2 θi + R2A sin2 θi , (4)
and tested, first in 1 H NMR and then in 23 Na NMR, before
where R1A and R2A are the longitudinal and trans-
the 129 Xe NMR experiments. The pulse program written for
verse relaxation rates of free xenon, respectively. In
the Magritek Spinsolve spectrometer is provided in the Sup-
the range of chemical exchange observed with crypto-
plement.
phanes k = kin +kout
R1A , R2A , given the low propor-
In order to apply exactly the same processing to the data
tion of xenon caged in the cryptophane, one has
acquired at 1 and 11.7 T and to compare them safely, a pro-
gram was written in Python to convert the FID recorded un- R1 = (1 − f )R1A + f R1B ' R1A , (5)
der Spinsolve into JCAMP-DX data readable by the Bruker
software, Topspin. R2 = (1 − f )R2A + f R2B ' R2A . (6)
– An indirect depolarization due to the saturation transfer
4 Theory of the Hyper-CEST experiment
from pool B to pool A (CEST effect). If the saturation is
applied exactly on-resonance with the caged xenon fre-
Let us consider a cryptophane solubilized in water at a sub-
quency (ωi = ωB ), with the assumption kout
R2B and
millimolar concentration. A small part of hyperpolarized
kout
kin , the depolarization rate linked to saturation at
xenon, when introduced in solution, will be reversibly caged
the frequency of pool B is given by (Zaiss et al., 2012;
in cryptophane. The 129 Xe spectrum will thus exhibit two
Kunth et al., 2014)
signals: free dissolved xenon (pool A of magnetization MA0 ,
giving rise to the main signal at ωA ) and xenon inside the ω12
cryptophane (pool B of magnetization MB0 , very minor signal λon (ω1 ) ' f kout . (7)
at ωB ). Two types of xenon in–out exchange coexist: simple ω12 + kout
2
dissociation,
This has enabled Kunth and co-workers to distinguish
k+ three cases (Kunth et al., 2015):
X+C CX, (1)
k−
– ω1
f kout : λon ' f kout . Maximum depolariza-
(X for xenon, C for cryptophane), and degenerate (or kick- tion rate.
out) exchange, dependent on the ratio xenon concentration to – ω1 = f kout : λon ' f kout /2. Fifty percent of the
cryptophane concentration (Korchak et al., 2016): maximum possible depolarization rate.
CX + X ∗ CX ∗ + X, (2) – ω1
f kout : λon ' (f/kout )ω12 . Parabolic behavior
k with the saturation strength.
where the asterisk denotes the hyperpolarized state. As the In order to understand the UFZ-spectroscopy experi-
two xenon pools have different resonance frequencies, these ment, one needs to consider the difference frequency
processes can be seen as a unique exchange between free and between the frequency of the rf irradiation, ωi , and the
encapsulated xenon, characterized by the rates kin and kout at frequency of pool B, ωB , which has a Lorentzian shape
steady state: as a function of ωi (Zaiss et al., 2012).
MB0 2
kin = kout = kout × f, (3) λon (ω1 ) 0(ω41 )
MA0 λCEST (ωi , ω1 ) =
0(ω1 )2
, (8)
4 + (ωi − ωB )2
recalling that f is the fraction of caged xenon.
The Hyper-CEST experiment consists in saturating with a with the full-width at half-maximum value of the depo-
(CW) rf irradiation of strength ω1 in the Xe@cryptophane larization rate given by
region (pool B) and detecting the influence on the main Xe q
signal (pool A). This has two consequences. 0(ω1 ) ' 2 ω12 + kout2 . (9)
https://doi.org/10.5194/mr-2-409-2021 Magn. Reson., 2, 409–420, 2021416 K. Chighine et al.: Micromolar detection on a 1 T spectrometer
Thus, the total depolarization rate is 5 Areas for improvement
λ(ωi , ω1 ) = λdirect (ωi , ω1 ) + λCEST (ωi , ω1 ) The use of Hyper-CEST experiments at a low magnetic field
2
= R1A cos θi + R2A sin θi 2 (1 T) for detection of low quantities of 129 Xe NMR-based
2
biosensors is possible, even with a spectrometer not dedi-
λon (ω1 ) 0(ω41 ) cated to 129 Xe observation. Such a benchtop spectrometer,
+ . (10)
0(ω1 )2
+ (ωi − ωB )2 placed close to the optical pumping setup and near the im-
4
ager, could represent a helpful tool to (i) know the xenon
which can be re-written as hyperpolarization level and (ii) know the thermodynamics
2 and kinetics of the complex between the noble gas and the
ω1 biosensor.
1 ωi −ωA
λ(ωi , ω1 ) = R1A 2 + R2A 2 However, some issues have been encountered with these
ω1 ω1 experiments. The most important is the difficulty in keep-
1+ ωi −ωA 1+ ωi −ωA
ing the hyperpolarization between two scans. Indeed, shak-
f kout · ω12 ing the NMR tube in the absence of a magnetic field high
+ . (11)
ω12 + kout
2 + (ω − ω )2
i B enough and sufficiently homogenous leads to fast depolariza-
tion. For each introduction of laser-polarized xenon into the
If one considers the experiment at 11.7 T with the usual NMR tube, we were limited to two to three experiments. This
modest saturation strength, |ωi − ωA |
ω1 , Eq. (11) can be fast relaxation being linked to the diffusion of the noble gas
simplified to into field gradients (in amplitude and in direction; see Cates
et al., 1988), a solution to counter this would be to increase
f kout · ω12 the pressure inside the NMR tube by increasing the amount
λ(ωi , ω1 ) = R1A + . (12)
ω12 + kout
2 + (ω − ω )2
i B of hyperpolarized xenon or by adding another gas such as
nitrogen. Another solution under study would be to build a
The z magnetization after a saturation of duration tsat is homogenous field tunnel between the production site of the
hyperpolarized species and the spectrometer, such as in dis-
Z(ωi , ω1 ) = MA0 · e−λ(ωi ,ω1 )tsat . (13) solution dynamic nuclear polarization (Milani et al., 2015).
In any case, the ultra-fast version of this experiment, the UFZ
Specificity of the ultra-fast Z spectroscopy spectroscopy, exhibits several advantages with respect to the
classical version of the Hyper-CEST.
The ultra-fast Z spectroscopy consists in applying the rf satu-
Working with a spectrometer not tuned to the frequency of
ration in the presence of a magnetic field gradient Gsat and af-
interest was only possible as (i) it is a low field and (ii) the
ter a read pulse detecting the signal in the presence of another
lowering of the magnet temperature could improve the situa-
gradient Gacq . The obtained profile reflects the magnetization
tion. However, some concern may still appear when using a
all along the sample in the Gacq gradient direction with dips
long rf saturation in the 129 Xe UFZ experiments, and every
at positions where saturation is effective according to the rf
solution to bring the radio frequency of the X channel of the
offset and the gradient Gsat . Thus after subtraction from the
spectrometer closer to the resonance frequency of the nuclei
profile acquired through the same sequence without satura-
of interest is appealing. An easy and low-cost solution was
tion and application of a scaling factor of the intensity for
found by placing a solenoid around the NMR tube or even
taking into account relaxation at the transient high polariza-
better by wrapping two copper foils around the NMR tube
tion, it corresponds to the Z spectrum. After the read pulse,
on either side of the region to be detected, as displayed in
the acquisition in the presence of a gradient Gacq causes all
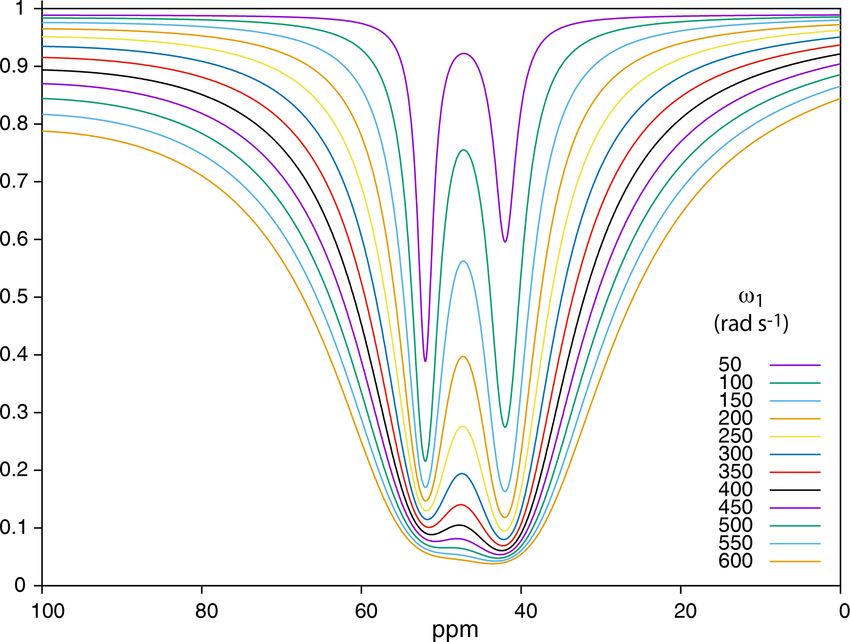
Fig. 10a–b, a setup inspired by Wheeler and Conradi (2012).
spectral information to be spread on a frequency range equal
The resulting inductive tuning decreases the inductance and
to γ ·Gacq ·r, where r is the dimension of the sample along the
thereby induces a raise in the resonance frequency of the cir-
gradient axis. In summary, two signals separated on a normal
cuit.
NMR spectrum by a value 1ωB12 are now separated in the
Figure 10c–d show the wobble curves obtained with the
UFZ spectrum by
naked NMR tube (c) and with copper foils manually adjusted
Gacq on the NMR tube axis (d). Remarkably, the quality factor of
1ωBUFZ
12
= 1ωB12 . (14) the probe is not degraded by the presence of the copper foils,
Gsat
and a better matching is even obtained. At the 129 Xe fre-
This shows that for a fixed acquisition gradient the biggest quency, the radiofrequency reflected amplitude at the probe
apparent separation between the dips is obtained by minimiz- which is ca. 35 µV without the foils (Fig. 10c) falls to 3 µV
ing the saturation gradient. The price to pay is that the dips with them (Fig. 10d).
or one of the dips can exit from the magnetization envelope As can be seen in Fig. 10b, given the gap between the two
if the condition 2|ωi − ωB1,2 |/Gsat > γ · r is encountered. copper foils, which should be smaller than the original de-
Magn. Reson., 2, 409–420, 2021 https://doi.org/10.5194/mr-2-409-2021K. Chighine et al.: Micromolar detection on a 1 T spectrometer 417
Figure 10. Example of the effect observed on the wobble curve of the X channel on the Magritek Spinsolve Carbon 43 when simple copper
foils are wrapped around the NMR tube. (a) Scheme of the setup, with the copper foils wrapped around the NMR tube; (b) picture of one of
these tubes. As we were limited to an outer diameter of 5 mm, the lower part of the NMR tube receiving the foils was only 4 mm; (c) wobble
curve of the X channel without the copper foils; (d) wobble curve with the copper coils.
tection zone, a partial rf shielding of the sample must occur. ating a inductive coupling with this arrangement is therefore
This decreases the detection volume accordingly. an easy task.
Note also that such a simple setup gives access to all nuclei
in the region 10.9–12.1 MHz, i.e., 13 C, 27 Al, 23 Na and 129 Xe.
It is a priori useable on every benchtop spectrometer, as they Code availability. The software code for the data conversion from
are commonly based on a Halbach magnet for the static mag- Spinsolve format to JCAMP-DX format used in this paper is avail-
netic field and a solenoid for the rf coil, whose principal axis able from the authors on request.
is colinear to the NMR tube and the magnet aperture. Cre-
https://doi.org/10.5194/mr-2-409-2021 Magn. Reson., 2, 409–420, 2021418 K. Chighine et al.: Micromolar detection on a 1 T spectrometer
Data availability. The raw NMR data sets and the GNUPLOT Berthault, P., Huber, G., and Desvaux, H.: Biosensing using laser-
scripts are available for download from https://mycore.core-cloud. polarized xenon NMR/MRI, Prog. Nucl. Mag. Res. Sp., 55, 35–
net/index.php/s/df2PLypVoITwznn (Chighine et al., 2021). 60, https://doi.org/10.1016/j.pnmrs.2008.11.003, 2009.
Bodet, O., Goerke, S., Behl, N. G. R., Roeloffs, V., Zaiss, M., and
Bachert, P.: Amide proton transfer of carnosine in aqueous so-
Supplement. The supplement related to this article is available lution studied in vitro by WEX and CEST experiments: Study
online at: https://doi.org/10.5194/mr-2-409-2021-supplement. of Amide Proton Transfer in Carnosine-Water System, NMR
Biomed., 28, 1097–1103, https://doi.org/10.1002/nbm.3343,
2015.
Author contributions. PB conceived and designed the experi- Boutin, C., Stopin, A., Lenda, F., Brotin, T., Dutasta, J.-
ments. KC had the idea and developed the coils to shift the working P., Jamin, N., Sanson, A., Boulard, Y., Leteurtre, F.,
frequency of the benchtop spectrometer. EL, PB and CB performed Huber, G., Bogaert-Buchmann, A., Tassali, N., Desvaux,
the NMR experiments at high and low magnetic fields. HD and PB H., Carrière, M., and Berthault, P.: Cell uptake of a
wrote the simulation programs. PB and EL processed the data. PB biosensor detected by hyperpolarized 129 Xe NMR: The
wrote the manuscript, which was reviewed by all the authors. transferrin case, Bioorgan. Med. Chem., 19, 4135–4143,
https://doi.org/10.1016/j.bmc.2011.05.002, 2011.
Boutin, C., Léonce, E., Brotin, T., Jerschow, A., and
Berthault, P.: Ultrafast Z-Spectroscopy for 129 Xe NMR-
Competing interests. The authors declare that they have no con-
Based Sensors, J. Phys. Chem. Lett., 4, 4172–4176,
flict of interest.
https://doi.org/10.1021/jz402261h, 2013.
Brotin, T. and Dutasta, J.-P.: Cryptophanes and Their Com-
plexes – Present and Future, Chem. Rev., 109, 88–130,
Special issue statement. This article is part of the special issue https://doi.org/10.1021/cr0680437, 2009.
“Geoffrey Bodenhausen Festschrift”. It is not associated with a con- Cai, K., Haris, M., Singh, A., Kogan, F., Greenberg, J. H.,
ference. Hariharan, H., Detre, J. A., and Reddy, R.: Magnetic res-
onance imaging of glutamate, Nat. Med., 18, 302–306,
https://doi.org/10.1038/nm.2615, 2012.
Acknowledgements. The authors warmly thank Thierry Brotin Cates, G. D., Schaefer, S. R., and Happer, W.: Relaxation of spins
(ENS Lyon, France) for providing samples of cryptophanes, Jean- due to field inhomogeneities in gaseous samples at low mag-
Claude Berthet (CEA Saclay, France) for the preparation of the netic fields and low pressures, Phys. Rev. A, 37, 2877–2885,
SEOP cells, and Craig Eccles (Magritek, Germany) for his help on https://doi.org/10.1103/PhysRevA.37.2877, 1988.
the SpinSolve Expert software. Chambers, J. M., Hill, P. A., Aaron, J. A., Han, Z., Christian-
son, D. W., Kuzma, N. N., and Dmochowski, I. J.: Cryptophane
Xenon-129 Nuclear Magnetic Resonance Biosensors Targeting
Financial support. This research has been supported by the Human Carbonic Anhydrase, J. Am. Chem. Soc., 131, 563–569,
Agence Nationale de la Recherche (grant nos. ANR-19-CE19-0024 https://doi.org/10.1021/ja806092w, 2009.
PHOENIX and ANR-17-LCV2-0002 DESIR). Chauvin, C., Liagre, L., Boutin, C., Mari, E., Léonce, E., Car-
ret, G., Coltrinari, B., and Berthault, P.: Note: Spin-exchange
optical pumping in a van, Rev. Sci. Instrum., 87, 016105,
Review statement. This paper was edited by Fabien Ferrage and https://doi.org/10.1063/1.4940928, 2016.
reviewed by Ville-Veikko Telkki and Alexej Jerschow. Chighine, K., Léonce, E., Boutin, C., Desvaux, H., and Berthault, P.:
Raw NMR data and Gnuplot scripts, MyCore, available at: https:
//mycore.core-cloud.net/index.php/s/df2PLypVoITwznn, last ac-
cess: 11 June 2021.
References Desvaux, H. and Berthault, P.: Study of dynamic processes
in liquids using off-resonance rf irradiation, Prog. Nucl.
Ahola, S., Zhivonitko, V. V., Mankinen, O., Zhang, G., Kan- Mag. Res. Sp., 35, 295–340, https://doi.org/10.1016/S0079-
tola, A. M., Chen, H.-Y., Hilty, C., Koptyug, I. V., and 6565(99)00011-4, 1999.
Telkki, V.-V.: Ultrafast multidimensional Laplace NMR for a Döpfert, J., Witte, C., and Schröder, L.: Fast Gradient-Encoded
rapid and sensitive chemical analysis, Nat. Commun., 6, 8363, CEST Spectroscopy of Hyperpolarized Xenon, ChemPhysChem,
https://doi.org/10.1038/ncomms9363, 2015. 15, 261–264, https://doi.org/10.1002/cphc.201300888, 2014a.
Berthault, P. and Boutin, C.: Biosensing and Study of Biologi- Döpfert, J., Zaiss, M., Witte, C., and Schröder, L.: Ul-
cal Cells using Hyperpolarized 129 Xe, chap. 14, in: New De- trafast CEST imaging, J. Magn. Reson., 243, 47–53,
velopments in NMR, edited by: Meersmann, T. and Brun- https://doi.org/10.1016/j.jmr.2014.03.008, 2014b.
ner, E, Royal Society of Chemistry, Cambridge, 261–271, Driehuys, B., Cofer, G. P., Pollaro, J., Mackel, J. B., Hedlund, L. W.,
https://doi.org/10.1039/9781782628378-00261, 2015. and Johnson, G. A.: Imaging alveolar-capillary gas transfer us-
Berthault, P., Bogaert-Buchmann, A., Desvaux, H., Huber, G., and ing hyperpolarized 129 Xe MRI, P. Natl. Acad. Sci. USA, 103,
Boulard, Y.: Sensitivity and Multiplexing Capabilities of MRI 18278–18283, https://doi.org/10.1073/pnas.0608458103, 2006.
Based on Polarized 129 Xe Biosensors, J. Am. Chem. Soc., 130,
16456–16457, https://doi.org/10.1021/ja805274u, 2008.
Magn. Reson., 2, 409–420, 2021 https://doi.org/10.5194/mr-2-409-2021K. Chighine et al.: Micromolar detection on a 1 T spectrometer 419
Dubost, E., Dognon, J.-P., Rousseau, B., Milanole, G., Dugave, 129 Xe NMR Spectroscopy, Chem. Eur. J., 24, 6534–6537,
C., Boulard, Y., Léonce, E., Boutin, C., and Berthault, https://doi.org/10.1002/chem.201800900, 2018.
P.: Understanding a Host-Guest Model System through Liu, Z., Dimitrov, I. E., Lenkinski, R. E., Hajibeigi, A., and Vino-
129 Xe NMR Spectroscopic Experiments and Theoret- gradov, E.: UCEPR: Ultrafast localized CEST-spectroscopy with
ical Studies, Angew. Chem. Int. Ed., 53, 9837–9840, PRESS in phantoms and in vivo: Ultrafast Localized CEST-
https://doi.org/10.1002/anie.201405349, 2014. Spectroscopy with PRESS, Magn. Reson. Med., 75, 1875–1885,
Gouilleux, B., Farjon, J., and Giraudeau, P.: Gradient-based pulse https://doi.org/10.1002/mrm.25780, 2016.
sequences for benchtop NMR spectroscopy, J. Magn. Reson., Milani, J., Vuichoud, B., Bornet, A., Miéville, P., Mottier, R.,
319, 106810, https://doi.org/10.1016/j.jmr.2020.106810, 2020. Jannin, S., and Bodenhausen, G.: A magnetic tunnel to shel-
Guo, Q., Zeng, Q., Jiang, W., Zhang, X., Luo, Q., Zhang, X., ter hyperpolarized fluids, Rev. Sci. Instrum., 86, 024101,
Bouchard, L.-S., Liu, M., and Zhou, X.: A Molecular Imag- https://doi.org/10.1063/1.4908196, 2015.
ing Approach to Mercury Sensing Based on Hyperpolarized Milanole, G., Gao, B., Paoletti, A., Pieters, G., Dugave, C., Deutsch,
129 Xe Molecular Clamp Probe, Chem. Eur. J., 22, 3967–3970, E., Rivera, S., Law, F., Perfettini, J.-L., Mari, E., Léonce, E.,
https://doi.org/10.1002/chem.201600193, 2016. Boutin, C., Berthault, P., Volland, H., Fenaille, F., Brotin, T.,
Hane, F. T., Li, T., Smylie, P., Pellizzari, R. M., Plata, J. A., and Rousseau, B.: Bimodal fluorescence/129 Xe NMR probe for
DeBoef, B., and Albert, M. S.: In vivo detection of cucur- molecular imaging and biological inhibition of EGFR in Non-
bit[6]uril, a hyperpolarized xenon contrast agent for a xenon Small Cell Lung Cancer, Bioorgan. Med. Chem., 25, 6653–6660,
magnetic resonance imaging biosensor, Sci. Rep., 7, 41027, https://doi.org/10.1016/j.bmc.2017.11.002, 2017.
https://doi.org/10.1038/srep41027, 2017. Riggle, B. A., Greenberg, M. L., Wang, Y., Wissner, R. F.,
Huber, G., Brotin, T., Dubois, L., Desvaux, H., Dutasta, J.- Zemerov, S. D., Petersson, E. J., and Dmochowski, I. J.:
P., and Berthault, P.: Water Soluble Cryptophanes Show- A cryptophane-based “turn-on” 129 Xe NMR biosensor for
ing Unprecedented Affinity for Xenon: Candidates as NMR- monitoring calmodulin, Org. Biomol. Chem., 15, 8883–8887,
Based Biosensors, J. Am. Chem. Soc., 128, 6239–6246, https://doi.org/10.1039/C7OB02391J, 2017.
https://doi.org/10.1021/ja060266r, 2006. Rose, H. M., Witte, C., Rossella, F., Klippel, S., Freund, C.,
Jeong, K., Slack, C. C., Vassiliou, C. C., Dao, P., Gomes, and Schroder, L.: Development of an antibody-based, modular
M. D., Kennedy, D. J., Truxal, A. E., Sperling, L. J., biosensor for 129 Xe NMR molecular imaging of cells at nanomo-
Francis, M. B., Wemmer, D. E., and Pines, A.: Investi- lar concentrations, P. Natl. Acad. Sci. USA, 111, 11697–11702,
gation of DOTA-Metal Chelation Effects on the Chem- https://doi.org/10.1073/pnas.1406797111, 2014.
ical Shift of 129 Xe, ChemPhysChem, 16, 3573–3577, Schilling, F., Schröder, L., Palaniappan, K. K., Zapf, S., Wemmer,
https://doi.org/10.1002/cphc.201500806, 2015. D. E., and Pines, A.: MRI Thermometry Based on Encapsulated
Khan, N. S., Riggle, B. A., Seward, G. K., Bai, Y., Hyperpolarized Xenon, Chem. Eur. J. Chem. Phys., 11, 3529–
and Dmochowski, I. J.: Cryptophane-Folate Biosen- 3533, https://doi.org/10.1002/cphc.201000507, 2010.
sor for 129 Xe NMR, Bioconjugate Chem., 26, 101–109, Schnurr, M., Volk, I., Nikolenko, H., Winkler, L., Dathe, M.,
https://doi.org/10.1021/bc5005526, 2015. and Schröder, L.: Functionalized Lipopeptide Micelles as
King, J. N., Lee, V. J., Ahola, S., Telkki, V.-V., and Mel- Highly Efficient NMR Depolarization Seed Points for Tar-
drum, T.: Ultrafast Multidimensional Laplace NMR Using a geted Cell Labelling in Xenon MRI, Adv. Biosys., 4, 1900251,
Single-Sided Magnet, Angew. Chem. Int. Ed., 55, 5040–5043, https://doi.org/10.1002/adbi.201900251, 2020.
https://doi.org/10.1002/anie.201511859, 2016. Schröder, L., Lowery, T. J., Hilty, C., Wemmer, D. E., and
King, J. N., Fallorina, A., Yu, J., Zhang, G., Telkki, V.- Pines, A.: Molecular Imaging Using a Targeted Magnetic
V., Hilty, C., and Meldrum, T.: Probing molecular dy- Resonance Hyperpolarized Biosensor, Science, 314, 446–449,
namics with hyperpolarized ultrafast Laplace NMR using a https://doi.org/10.1126/science.1131847, 2006.
low-field, single-sided magnet, Chem. Sci., 9, 6143–6149, Schröder, L., Meldrum, T., Smith, M., Lowery, T. J., Wem-
https://doi.org/10.1039/C8SC01329B, 2018. mer, D. E., and Pines, A.: Temperature Response of Xe
Korchak, S., Kilian, W., Schröder, L., and Mitschang, L.: De- 129 Depolarization Transfer and Its Application for Ultra-
sign and comparison of exchange spectroscopy approaches to sensitive NMR Detection, Phys. Rev. Lett., 100, 257603,
cryptophane–xenon host–guest kinetics, J. Magn. Reson., 265, https://doi.org/10.1103/PhysRevLett.100.257603, 2008.
139–145, https://doi.org/10.1016/j.jmr.2016.02.005, 2016. Spence, M. M., Rubin, S. M., Dimitrov, I. E., Ruiz, E. J., Wemmer,
Kunth, M., Witte, C., and Schröder, L.: Quantitative chemi- D. E., Pines, A., Yao, S. Q., Tian, F., and Schultz, P. G.: Function-
cal exchange saturation transfer with hyperpolarized nuclei alized xenon as a biosensor, P. Natl. Acad. Sci. USA, 98, 10654–
(qHyper-CEST): Sensing xenon-host exchange dynamics and 10657, https://doi.org/10.1073/pnas.191368398, 2001.
binding affinities by NMR, J. Chem. Phys., 141, 194202, Taratula, O., Bai, Y., D’Antonio, E. L., and Dmochowski, I. J.:
https://doi.org/10.1063/1.4901429, 2014. Enantiopure cryptophane- 129 Xe nuclear magnetic resonance
Kunth, M., Witte, C., and Schröder, L.: Continuous-wave satura- biosensors targeting carbonic anhydrase, Supramol. Chem., 27,
tion considerations for efficient xenon depolarization: Saturation 65–71, https://doi.org/10.1080/10610278.2014.906601, 2015.
Pulse Considerations for Efficient Xenon Depolarization, NMR Tassali, N., Kotera, N., Boutin, C., Léonce, E., Boulard, Y.,
Biomed., 28, 601–606, https://doi.org/10.1002/nbm.3307, 2015. Rousseau, B., Dubost, E., Taran, F., Brotin, T., Dutasta, J.-P.,
Léonce, E., Dognon, J.-P., Pitrat, D., Mulatier, J.-C., Brotin, T., and Berthault, P.: Smart Detection of Toxic Metal Ions, Pb2+
and Berthault, P.: Accurate pH Sensing using Hyperpolarized and Cd2+ , Using a 129 Xe NMR-Based Sensor, Anal. Chem., 86,
1783–1788, https://doi.org/10.1021/ac403669p, 2014.
https://doi.org/10.5194/mr-2-409-2021 Magn. Reson., 2, 409–420, 2021420 K. Chighine et al.: Micromolar detection on a 1 T spectrometer Truxal, A. E., Cao, L., Isaacs, L., Wemmer, D. E., and Xu, X., Yadav, N. N., Song, X., McMahon, M. T., Jerschow, A., Pines, A.: Directly Functionalized Cucurbit[7]uril as a Biosen- van Zijl, P. C., and Xu, J.: Screening CEST contrast agents us- sor for the Selective Detection of Protein Interactions by ing ultrafast CEST imaging, J. Magn. Reson., 265, 224–229, 129 Xe hyperCEST NMR, Chem. Eur. J., 25, 6108–6112, https://doi.org/10.1016/j.jmr.2016.02.015, 2016. https://doi.org/10.1002/chem.201900610, 2019. Yang, S., Jiang, W., Ren, L., Yuan, Y., Zhang, B., Luo, Q., Guo, Vinogradov, E., Sherry, A. D., and Lenkinski, R. E.: Q., Bouchard, L.-S., Liu, M., and Zhou, X.: Biothiol Xenon CEST: From basic principles to applications, chal- MRI Sensor Based on Thiol-Addition Reaction, Anal. Chem., lenges and opportunities, J. Magn. Reson., 229, 155–172, 88, 5835–5840, https://doi.org/10.1021/acs.analchem.6b00403, https://doi.org/10.1016/j.jmr.2012.11.024, 2013. 2016. Walker, T. G. and Happer, W.: Spin-exchange optical pump- Yang, S., Yuan, Y., Jiang, W., Ren, L., Deng, H., Bouchard, L. S., ing of noble-gas nuclei, Rev. Mod. Phys., 69, 629–642, Zhou, X., and Liu, M.: Hyperpolarized 129 Xe Magnetic Reso- https://doi.org/10.1103/RevModPhys.69.629, 1997. nance Imaging Sensor for H 2 S, Chem. Eur. J., 23, 7648–7652, Wei, Q., Seward, G. K., Hill, P. A., Patton, B., Dim- https://doi.org/10.1002/chem.201605768, 2017. itrov, I. E., Kuzma, N. N., and Dmochowski, I. J.: De- Zaiss, M., Schnurr, M., and Bachert, P.: Analytical solution signing 129 Xe NMR Biosensors for Matrix Metallopro- for the depolarization of hyperpolarized nuclei by chemi- teinase Detection, J. Am. Chem. Soc., 128, 13274–13283, cal exchange saturation transfer between free and encapsu- https://doi.org/10.1021/ja0640501, 2006. lated xenon (HyperCEST), J. Chem. Phys., 136, 144106, Wheeler, D. D. and Conradi, M. S.: Practical exercises for learning https://doi.org/10.1063/1.3701178, 2012. to construct NMR/MRI probe circuits, Concepts Magn. Reson., 40A, 1–13, https://doi.org/10.1002/cmr.a.21221, 2012. Xu, X., Lee, J.-S., and Jerschow, A.: Ultrafast Scanning of Ex- changeable Sites by NMR Spectroscopy, Angew. Chem. Int. Ed., 52, 8281–8284, https://doi.org/10.1002/anie.201303255, 2013. Magn. Reson., 2, 409–420, 2021 https://doi.org/10.5194/mr-2-409-2021
You can also read