Dynamic FoxP2 levels in male zebra finches are linked to morphology of adult-born Area X medium spiny neurons
←
→
Page content transcription
If your browser does not render page correctly, please read the page content below
www.nature.com/scientificreports

            OPEN           Dynamic FoxP2 levels in male zebra
                           finches are linked to morphology
                           of adult-born Area X medium spiny
                           neurons
                           Jennifer Kosubek-Langer* & Constance Scharff

                           The transcription factor FOXP2 is crucial for the formation and function of cortico-striatal circuits.
                           FOXP2 mutations are associated with specific speech and language impairments. In songbirds,
                           experimentally altered FoxP2 expression levels in the striatal song nucleus Area X impair vocal learning
                           and song production. Overall FoxP2 protein levels in Area X are low in adult zebra finches and decrease
                           further with singing. However, some Area X medium spiny neurons (MSNs) express FoxP2 at high
                           levels (FoxP2high MSNs) and singing does not change this. Because Area X receives many new neurons
                           throughout adulthood, we hypothesized that the FoxP2high MSNs are newly recruited neurons, not yet
                           integrated into the local Area X circuitry and thus not active during singing. Contrary to our expectation,
                           FoxP2 protein levels did not predict whether new MSNs were active during singing, assayed via
                           immediate early gene expression. However, new FoxP2high MSNs had more complex dendrites, higher
                           spine density and more mushroom spines than new FoxP2low MSNs. In addition, FoxP2 expression levels
                           correlated positively with nucleus size of new MSNs. Together, our data suggest that dynamic FoxP2
                           levels in new MSNs shape their morphology during maturation and their incorporation into a neural
                           circuit that enables the maintenance and social modulation of adult birdsong.

                           The forkhead box P2 transcription factor (FOXP2) is linked to speech and language disorders. Heterozygous
                           FOXP2 mutations in humans affect both the coordination of fine orofacial movements and language percep-
                           tion1–3. Because songbirds – like humans – need to learn most of their communicative vocalizations, they offer
                           a unique model to study the role of FoxP2 (for nomenclature FOXP2/FoxP2 see Methods) for vocal learning
                           and for the maintenance of learned vocalizations as adults4. Studying the relationship between FoxP2 and vocal
                           learning in songbirds may inform the neurogenetic mechanism underlying the speech deficits in patients carrying
                           FOXP2 mutations for the following reasons. The FoxP2 protein coding sequence is highly conserved between
                           humans and songbirds as are the brain expression patterns, notably in the cerebellum and striatum5–7. Moreover,
                           genetic manipulations of FoxP2 expression levels in the striatal song nucleus Area X during the critical phase of
                           song learning lead to inaccurate and incomplete imitation of the tutor’s song and more variable vocal produc-
                           tion3,8–10. This phenotype bears similarities to the specific speech deficits called developmental verbal dyspraxia,
                           DVD (or childhood apraxia of speech), that patients carrying FOXP2 mutations suffer from. The core-phenotype
                           of DVD consists of altered precision, consistency and sequencing of movements underlying speech in the absence
                           of neuromuscular deficits11. In addition, altered FoxP2 levels in adult Area X affect the dopaminergic modulation
                           of corticostriatal signaling important to song variability and affect song maintenance12,13, stressing the fact that
                           tight regulation of FoxP2 expression is a prerequisite for correct neural transmission in differentiated neural cir-
                           cuits. Additional effects of Foxp2 and its disruption on the embryonic development and the function of neural cir-
                           cuits have been described in mice14–23. Further evidence for the biological relevance of tight regulation of FoxP2
                           expression levels comes from the following studies. FoxP2 expression levels in Area X transiently increase during
                           song learning but are lower in adults7,24. Singing decreases overall FoxP2 levels in Area X but not in the surround-
                           ing striatum and the degree of FoxP2 down regulation correlates with the amount of produced song25–27. This
                           relationship is missing in deafened birds, pointing to an important role of auditory feedback for singing-driven
                           FoxP2 down regulation27. How does singing affect FoxP2 expression at the cellular level? Medium spiny neurons

                           Department of Animal Behavior, Institute of Biology, Freie Universität Berlin, Berlin, Germany. *email: kosubekla@
                           zedat.fu-berlin.de

Scientific Reports |   (2020) 10:4787 | https://doi.org/10.1038/s41598-020-61740-6                                                           1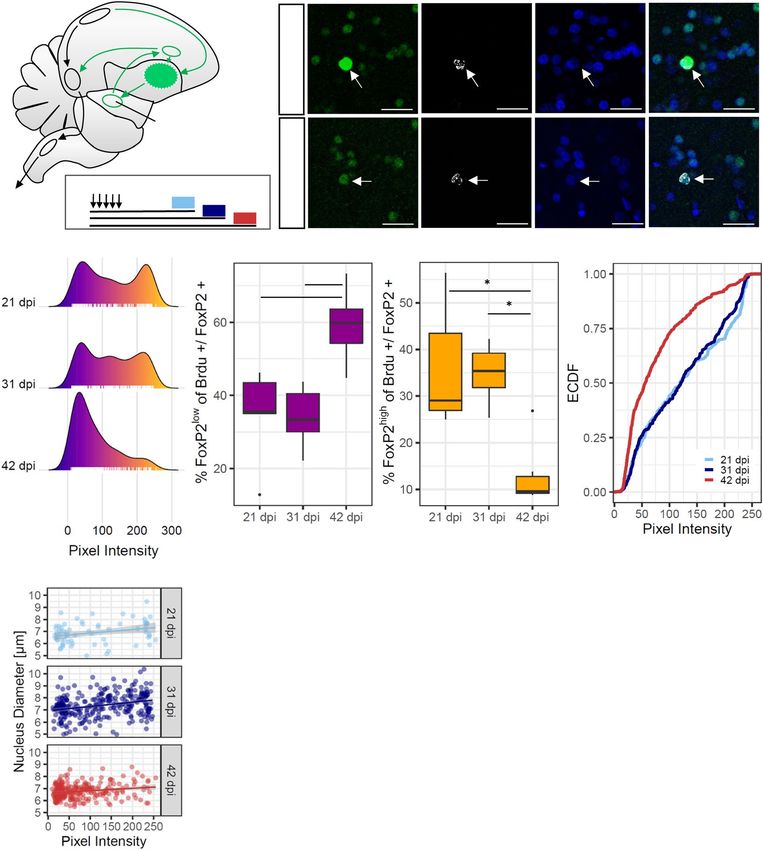
www.nature.com/scientificreports/                                                               www.nature.com/scientificreports

                           (MSNs), the most abundant cell type in the avian striatum, predominantly express FoxP2 at low levels (FoxP2low)
                           while a subset expresses FoxP2 at very high levels (FoxP2high). Both subtypes are not equally affected by singing;
                           the density of FoxP2high MSNs is not measurably different after singing, contrary to the decreasing density of
                           FoxP2low MSNs24. The authors hypothesized that the difference might be due to the neuronal age. Adult Area X
                           constantly receives new MSNs that originate at the ventricular zone28–33. FoxP2high MSNs colocalize more fre-
                           quently with a marker for new neurons than FoxP2low MSNs24. Recently we showed that new MSNs mature and
                           participate in singing activity – as measured by immediate early gene activation – within a timeframe of six
                           weeks34. Whether FoxP2 influences not only the function but also the integration of new neurons into existing
                           circuits is still an open question. Based on the results of Thompson et al. (ref. 21) we hypothesized that FoxP2high
                           MSNs are newly recruited into Area X and need to become FoxP2low MSNs before they can participate in singing.
                           To test this, we labelled neuronal progenitors in adult zebra finches. At different time points after these cells had
                           migrated into Area X, we quantified their expression levels of FoxP2 and whether they also expressed the imme-
                           diate early gene expression EGR-1 after singing.
                               In rodents, Foxp2 expression is associated with neurite outgrowth, neuronal morphology and synapse forma-
                           tion in cortico-striatal circuits18,19,35–37. Foxp2 expression levels vary in striatal MNSs and these differences may
                           be relevant for the morphology of striatal MSNs. Dopamine receptor 1 (D1) expressing MSNs38 express Foxp2
                           at higher levels than dopamine receptor 2 (D2) expressing MSNs23,35. These differences in Foxp2 levels may be
                           linked to anatomical differences between D1 and D2 MSNs35,39. Furthermore, in mice carrying humanized Foxp2
                           alleles (Foxp2hum/hum mice), Foxp2high MSNs are more numerous in the dorsal striatum and their MSNs have
                           longer dendrites than wildtype mice36,37. Based on the latter results we hypothesized that FoxP2 levels of new
                           MSNs in adult songbirds correlate with their neural morphology. To test this, we virally labelled neural progen-
                           itors and analyzed their FoxP2 expression, dendrite complexity and spine density after migration into Area X.

                           Results
                           Dynamic FoxP2 levels in new MSNs in Area X. To assess FoxP2 protein levels in individual newborn
                           neurons we labelled progenitor cells with Bromodeoxyuridine (BrdU) and detected BrdU+/FoxP2+ cells after
                           21, 31 and 42 days post BrdU injection (dpi) in Area X of adult male zebra finches (Fig. 1a,b). We found that
                           FoxP2 expression in Area X was very variable, with some neurons expressing FoxP2 at particularly high levels
                           and some at low levels (Fig. 1c). At 21 dpi and at 31 dpi, the mean pixel intensities of all BrdU+/FoxP2+ cells
                           formed a bimodal distribution, whereas at 42 dpi the distribution was unimodal and shifted to low FoxP2 expres-
                           sion (Fig. 1d). We classified all neurons that had expression intensities within the top 30% of the measured pixel
                           intensity distribution as FoxP2high neurons. Neurons within the bottom 30% of the measured pixel intensity dis-
                           tribution were considered as FoxP2low. Because we were interested in the two extremes of the expression levels in
                           this study, we did not analyze the new neurons with intermediate FoxP2 expression levels further (29.3% ± 9.4,
                           SD, see Methods). At 21 dpi and at 31 dpi 36.17% ± 6.02 (SEM) and 34.91% ± 2.53 (SEM) percent of all BrdU+
                           cells were FoxP2high neurons, respectively. At 42 dpi the percentage of FoxP2high cells had significantly decreased to
                           12.95% ± 2.87 (SEM) on average (p = 0.0077, Kruskal-Wallis test, Fig. 1f,g). The percentage of FoxP2low neurons
                           increased significantly from 21 dpi (34.59 ± 5.86, SEM) and 31 dpi (34.06 ± 3.35, SEM) to 42 dpi (59.19 ± 4.02,
                           SEM, p = 0.013, ANOVA, Fig. 1e,g). We also noticed that BrdU+ cells varied in their nucleus size. Quantification
                           revealed that the distribution of the nucleus size was shifted towards bigger nuclei at 31 dpi (data not shown).
                           BrdU+/FoxP2+ cells at 31 dpi had significantly bigger nuclei (7.37 µm ± 0.94 (SD) than BrdU+/FoxP2+ cell at
                           21 dpi (6.88 µm ± 0.9 (SD), p = 0.00025, chi-square = 75.358, df = 2) or 42 dpi (6.74 µm ± 0.59 (SD), p = 2 × 10⁻⁶,
                           chi-square = 75.358, df = 2, data not shown). Interestingly there was a significant positive relationship with a low
                           effect size between nucleus size and FoxP2 expression levels in all three experimental groups (21 dpi: r2 = 0.086,
                           p = 0.017, 31 dpi: r2 = 0.083, p = 5.2 × 10⁻⁷, 42 dpi = r2 = 0.039, p = 0.0012, Fig. 1h).

                           Singing induced activity of new MSNs is independent of FoxP2 levels.                         In adult zebra finches
                           FoxP2 expression levels in Area X are behaviourally regulated. Undirected singing leads to downregulation of
                           FoxP2 mRNA and protein24–26. Undirected singing is also associated with expression of the immediate early gene
                           EGR-1 in Area X, which is therefore often used as a molecular readout of the neuronal activity associated with
                           undirected song40–44. We hypothesized that FoxP2 levels in new FoxP2high neurons needed to be downregulated
                           before activation by singing could occur, resulting in EGR-1 expression. Consequently, we did not expect to find
                           BrdU+/FoxP2high/EGR-1+ MSNs in Area X. To test this, we analyzed BrdU+/EGR-1 ± /FoxP2+ cells in birds
                           that had sung before sacrifice after 21 dpi, 31 dpi and 42 dpi.
                               Contrary to our hypothesis we found BrdU+/FoxP2high/EGR-1+ cells in Area X (Fig. 2a) in all groups, with
                           large differences between birds. At 31 dpi, on average 41.45% ± 15.43 (SEM) of new neurons expressed FoxP2high
                           and were also activated by singing (BrdU+/FoxP2high/EGR-1+) and 40.28% ± 13.34 (SEM) of the new neu-
                           rons that expressed FoxP2high were not activated by singing (BrdU+/FoxP2high/EGR-1-) (Fig. 2b). At 42 dpi, the
                           more birds had sung the fewer FoxP2high new neurons were found, resulting in a significant negative relation-
                           ship between the number of BrdU+/FoxP2+/EGR-1+ neurons and the number of motifs sung before sacrifice
                           (r2 = 0.753, p = 0.025, Fig. 2c) which was not the case at 21 dpi (r2 = 0.168, p = 0.493, data not shown) nor at 31
                           dpi (r2 = 0.164, p = 0.425, data not shown).

                           FoxP2 levels in new MSNs influence dendritic arborization and spine density.                             Because of the
                           relationship of FoxP2 levels and nucleus size we wanted to further characterize the morphology of new neurons
                           expressing different FoxP2 levels. We used a lentiviral approach to express Green Fluorescent Protein (GFP) in
                           progenitor cells at their place of birth in the lateral wall of the lateral ventricle (Fig. 3a). After 31 and 42 dpi we
                           found labeled neurons (GFP+) in Area X and the surrounding striatum (Fig. 3b). GFP+ neurons exhibited the
                           typical morphology of medium spiny neurons with small somata and spiny dendrites (Fig. 3c) and expressed

Scientific Reports |   (2020) 10:4787 | https://doi.org/10.1038/s41598-020-61740-6                                                              2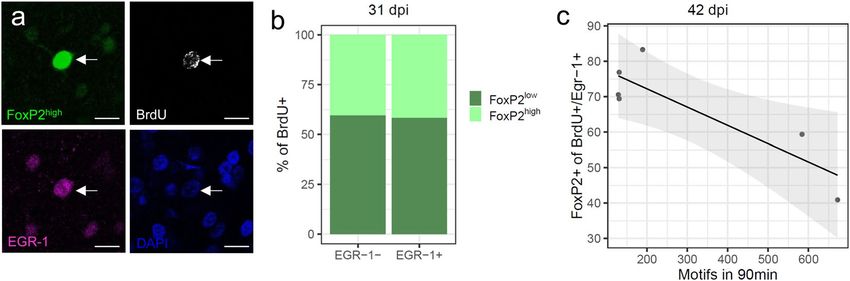
www.nature.com/scientificreports/                                                             www.nature.com/scientificreports

                           Figure 1. Dynamic FoxP2 expression levels in new MSNs. (a) The song motor pathway (main nuclei outlined
                           in black) controls the vocal organ (syrinx). The anterior forebrain pathway (shown in green) forms a cortico
                           (HVCm, lMAN) -basal ganglia (Area X) –thalamo (DLM) –cortical (RA) loop. (b) Experimental schedule: adult
                           male zebra finches received BrdU on five consecutive days and were sacrificed 21, 31 or 42 days after injections
                           (dpi). (c) Examples of FoxP2high (top row, immunoreactivity shown in green) and FoxP2low (bottom row) new
                           (BrdU+ immunoreactivity shown in white) MSNs in Area X at 31 dpi. Nuclear expression of FoxP2 and BrdU
                           coincides with DAPI label in blue. (d) Density plots of FoxP2 pixel intensities of individual new MSNs in Area
                           X at different time points after BrdU injections. The color scheme indicates increasing pixel intensity from low
                           (blue) to high (yellow) intensity. Ticks at the bottom of each plot represent individual MSNs. (e) Percentage
                           of new FoxP2low MSNs significantly increases from 21/31 dpi to 42 dpi. (f) Percentage of new FoxP2high MSNs
                           significantly decreases from 21/31 dpi to 42 dpi. (g) Empirical cumulative distribution function (ECDF) of
                           FoxP2 pixel intensities of individual new MSNs in Area X. FoxP2 pixel intensities are similar at 21 and 31 dpi
                           and are lower at 42 dpi. (h) FoxP2 pixel intensities of new MSNs positively correlate with nucleus diameter. Each
                           dot represents one new MSNs. Sample size (d-h): 733 MSNs of 17 zebra finches. *p ≤ 0.05, **p ≤ 0.01. Scale
                           bar: 20 µm (g). RA, Robust nucleus of the arcopallium; LMAN, Lateral magnocellular nucleus of the anterior
                           nidopallium; NXIIts, tracheosyringeal part of the hypoglossal nucleus; DLM, Dorsal lateral nucleus of the
                           medial thalamus.

                           FoxP2 (Fig. 3d,e). First, we traced FoxP2high and FoxP2low new neurons at 31 dpi (Fig. 4a) and found that FoxP2high
                           neurons had more primary dendrites (p = 0.021, Mann Whitney test, Fig. 4b), a higher total branch length
                           (p = 0.003, Mann Whitney test, Fig. 4e) and thicker dendrites than FoxP2low neurons (p = 0.003, t-test, Fig. 4f).
                           Second, we analyzed the extent of dendritic arborization of GFP+/FoxP2+ neurons using a Sholl analysis (see

Scientific Reports |   (2020) 10:4787 | https://doi.org/10.1038/s41598-020-61740-6                                                          3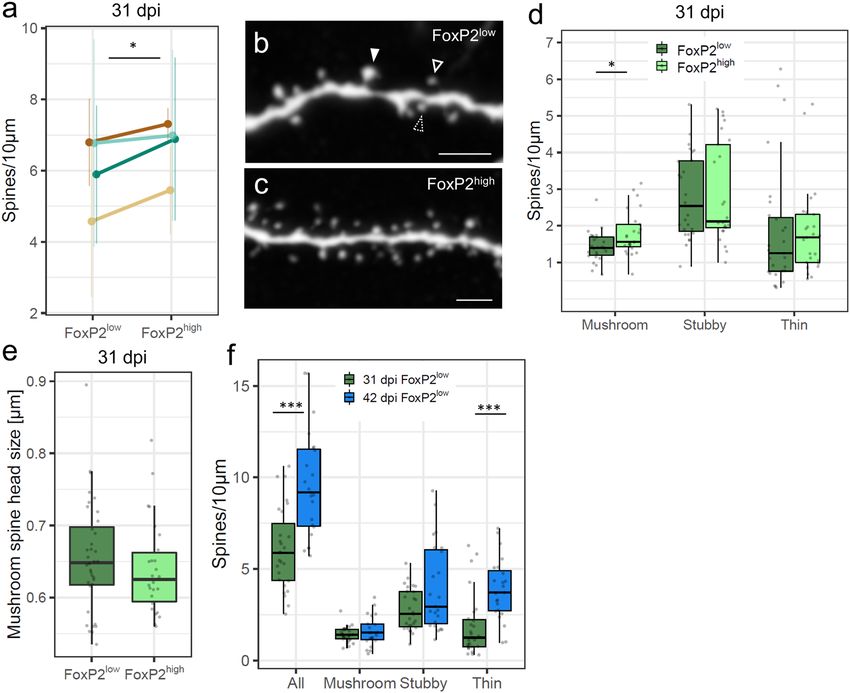
www.nature.com/scientificreports/ www.nature.com/scientificreports
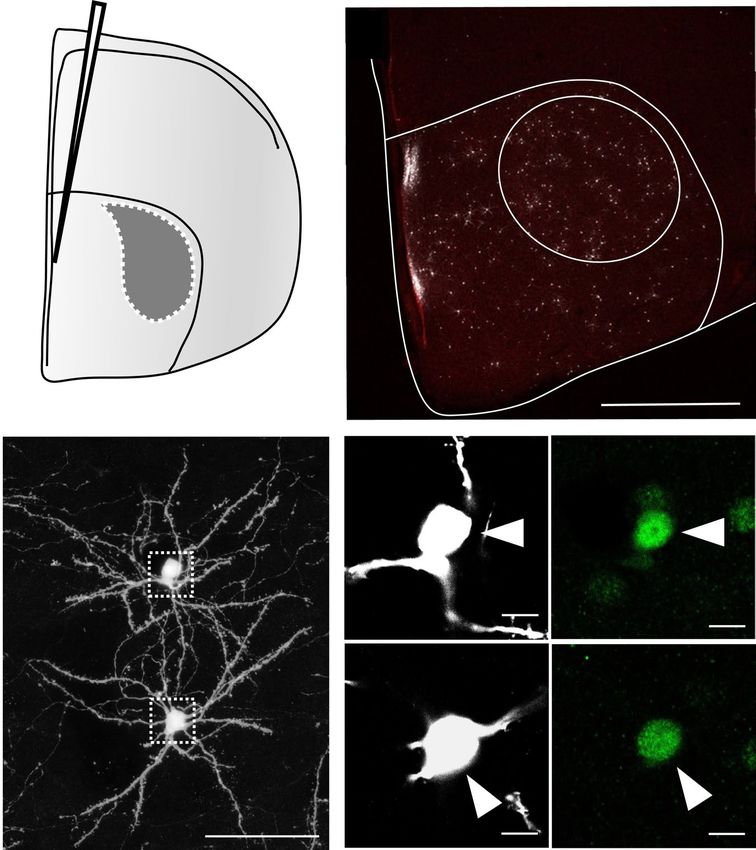
Figure 2. Singing-induced EGR-1 activation of new MSNs is independent of FoxP2 levels. (a) The white
arrow in all 4 panels points to a new (BrdU+ immunoreactivity, white) MSN that expresses FoxP2high
(immunoreactivity, green) and also EGR-1 (immunoreactivity, purple) after undirected singing. The blue DAPI
staining shows other cells that are not new, but express FoxP2 at low levels, some of which also express EGR-
1. Scale bar: 10 µm. (b) At 31 dpi new neurons can either be activated by undirected singing (EGR-1+, right
column) or not (EGR-1-, left column). In both cases, the new MSN can either express FoxP2low or FoxP2high. (c)
At 42 dpi the number of FoxP2/BrdU+/EGR-1+ neurons negatively correlate with the number of motifs sung
during the 90 min before sacrifice. Sample size (b): 108 MSNs of 6 zebra finches. Sample size (c): 156 MSNs of 6
zebra finches.
Figure 3. New MSNs that were GFP-labeled as progenitors at the ventricular zone and migrated to Area X
express FoxP2. (a) Injections with a lentivirus into the ventricular zone resulted in GFP expression in the neural
progenitors of MSN. (b) 31 dpi after viral injections, many GFP-labelled neurons can be observed in Area X and
the surrounding striatum. (c) New GFP-expressing MSNs in Area X. Somata in the dashed boxes are magnified
in (d) and (e). (d,e) Virally labelled MSNs (GFP immunoreactivity, white) express FoxP2 (immunoreactivity,
green). Scale bars: 10 µm (d, e), 50 µm (c), 1 mm (b).
Scientific Reports | (2020) 10:4787 | https://doi.org/10.1038/s41598-020-61740-6 4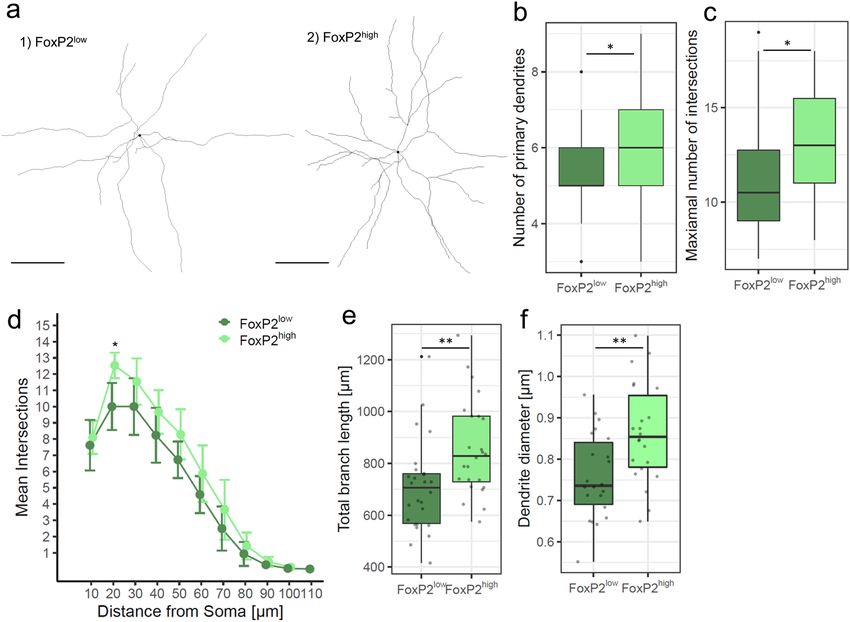
www.nature.com/scientificreports/                                                             www.nature.com/scientificreports

                           Figure 4. FoxP2 expression levels are linked to distinct morphologies of new MSNs at 31 dpi. (a) Examples of
                           dendrite tracings of new FoxP2low and FoxP2high MSNs. The black dot marks the center of the soma. (b) Number
                           of primary dendrites is significantly increased in FoxP2high compared to FoxP2low new MSN. (c) Maximal
                           number of intersections between dendrites and Sholl circles is significantly higher in FoxP2high than in FoxP2low
                           new MSN. (d) Sholl analysis revealed that dendrites of new FoxP2high MSNs had more complex arborizations
                           as indicated by more intersections at 20 µm from the soma than new FoxP2low MSNs. Shown are mean ± SEM.
                           Data points of FoxP2high neurons were slightly shifted to the right for better visibility. (e) FoxP2high new MSNs
                           have a significantly higher total branch length than FoxP2low new MSNs. (f) At 31 dpi new FoxP2high MSNs have
                           thicker dendrites than new FoxP2low MSNs. Sample size (a-f): 52 MSNs of 4 zebra finches. Scale bars: 25 µm.
                           *p ≤ 0.05; **p ≤ 0.01.

                           Methods). At 31 dpi FoxP2high neurons had more intersections at 20 µm distance from the soma (p = 0.024, paired
                           t-test, Fig. 4a,d) and a higher number of maximal intersections (p = 0.019, t-test, Fig. 4c) than FoxP2low neurons,
                           reflecting more extensive dendritic arborizations in FoxP2high than FoxP2low neurons. Second, Third, we used a
                           semi-automated quantification approach to assess the number of dendritic spines in GFP+/FoxP2+ neurons at
                           31 dpi. FoxP2high neurons in Area X had more dendritic spines than FoxP2low neurons (p = 0.034, paired t-test,
                           Fig. 5a–c). Overall, FoxP2high neurons had more mushroom spines than FoxP2low neurons (p = 0.0186, Mann
                           Whitney test, Fig. 5d). There was no difference in the number of stubby spines (p = 0.819, Mann Whitney test) or
                           thin spines (p = 0.409, Mann Whitney test) between FoxP2high and FoxP2low neurons (Fig. 5d). Because of the dif-
                           ference in mushroom spine number, we assumed that FoxP2 expression levels might influence mushroom spine
                           head size, too. However, quantification revealed no difference in mushroom spine head size between FoxP2high
                           and FoxP2low neurons (p = 0.317, Mann Whitney test, Fig. 5e). In a last step we compared spine densities between
                           new MSNs at 31 dpi and 42 dpi. Since at 42 dpi only few new neurons were FoxP2high we included only FoxP2low
                           new neurons in this analysis (Fig. 5f). At 42 dpi, the spine density of FoxP2low new neurons was higher than in
                           FoxP2low neurons at 31 dpi (p = 2.517 × 10⁻⁴, t-test, Fig. 5f). This elevated spine density was largely due to an
                           increase in thin spines (p = 8.422 × 10⁻⁴, Mann Whitney test) and not mushroom spines (p = 0.39, t-test) or
                           stubby spines (p = 0.119, Mann Whitney test).

                           Discussion
                           In the present study we investigated the dynamics of FoxP2 expression in adult-born MSNs in the striatal song
                           nucleus Area X of adult male zebra finches. We show that the new MSN strongly expressed FoxP2 at their arrival
                           in Area X from the ventricular zone (VZ) where they were born 21 days prior. During this stage and at interme-
                           diate maturation stages (31 days) one third of new MSNs expressed FoxP2 at high levels. At the late maturation
                           stage (42 days) most new MSNs expressed FoxP2 at low levels (Fig. 6). Together with our previous data we con-
                           clude that reaching low FoxP2 levels is a sign that adult-born born MSN in Area X have reached maturity by 6
                           weeks after their generation in the VZ34.

Scientific Reports |   (2020) 10:4787 | https://doi.org/10.1038/s41598-020-61740-6                                                          5
www.nature.com/scientificreports/ www.nature.com/scientificreports
Figure 5. FoxP2 levels are associated with dendritic spine density of new MSNs. (a) New FoxP2high MSNs
had significantly more dendritic spines than new FoxP2low MSNs at 31 dpi (shown are mean ± SEM). Lines
connect data from the same animal. (b) Confocal 12 µm projection showing an example of FoxP2low new MSN
dendrite with mushroom (filled arrow), stubby (dashed arrow) and thin spines (unfilled arrow). (c) Example of
FoxP2high new MSNs dendrite. (d) New FoxP2high MSNs have more mushroom spines than FoxP2low new MSN
at 31 dpi. (e) Mushroom spine head size is not different between MSNs with different FoxP2 levels. (f) New
FoxP2low MSNs at 42 dpi show overall more dendritic spines and more thin spines than new FoxP2low MSNs at
31 dpi. Sample size (a,d,e,f): 52 MSNs of 4 zebra finches. Sample size (f): 23 MSNs of 3 zebra finches. *p ≤ 0.05;
***p ≤ 0.001. Scale bars: 5 µm (b,c).
Since our previous work demonstrated that new MSNs participate in singing-associated neural activity in
Area X34 here we asked if this was linked to FoxP2 levels. After singing FoxP2 mRNA and protein levels are lower
in Area X tissue25–27 than when birds were silent whereas the expression of the immediate early gene EGR-1
increases linearly the more birds sing undirected song40,41. Analyzing expression levels in individual neurons
revealed that only FoxP2low MSNs, but not Foxp2high MSNs seemed to be subject to singing induced FoxP2 down-
regulation24. We therefore hypothesized that FoxP2high MSNs were not yet connected into the circuit and therefore
not regulated by singing. Our data contradict this hypothesis. We show that the induction of the immediate early
gene EGR-1 in MSNs after singing was equally likely in FoxP2low and FoxP2high MSNs, suggesting that both were
functionally incorporated into the song circuit.
Previous work showed that the degree of FoxP2 downregulation correlates with the quantity of produced song
and depends on auditory feedback, which is relayed to Area X via the cortical song nucleus HVC27,45. In our study,
the relationship between FoxP2 downregulation and song quantity was present in new MSNs at 42 dpi but not
earlier and we therefore suggest that new MSNs start to receive auditory feedback signals between 31 and 42 dpi.
What might cause the age-dependent FoxP2 downregulation in new MSNs? One possibility is that intrinsic
mechanisms, depending more on cell age than on extracellular inputs, downregulate FoxP2 during maturation.
Another possibility is that EGR-1 gradually decreases FoxP2 levels during every singing event. This latter scenario
is consistent with the findings that the FoxP2 promoter contains EGR-1 binding sites4,46 and that EGR-1 expres-
sion is crucial for functional integration of new neurons in the adult rodent hippocampus47.
We also tested if varying FoxP2 levels affect neuronal morphology in adult male zebra finches and analyzed
dendrite complexity and spine density of virally labelled new FoxP2low and FoxP2high MSNs. We now show dif-
ferences between the morphology of adult generated MSNs that express FoxP2 at high or low levels; high FoxP2
levels were associated with greater dendrite complexity and higher dendritic spine density in comparison to
neurons with low FoxP2 levels (Fig. 6). Concerning spine density, our results are consistent with previous studies
Scientific Reports | (2020) 10:4787 | https://doi.org/10.1038/s41598-020-61740-6 6www.nature.com/scientificreports/ www.nature.com/scientificreports
Figure 6. Graphical summary of the main results. The fraction of adult generated FoxP2high MSNs from zebra
finch Area X decreases with maturation. FoxP2high new MSNs show higher spine densities, more mushroom
spines and a more complex dendritic arborization than FoxP2low new MSNs.
in juvenile zebra finches, since experimental FoxP2 knockdown decreased overall spine densities of new Area X
MSNs48. Moreover, our results are in line with findings in mice that link Foxp2 to neuronal outgrowth and spine
density in striatal neurons and their progenitors18,19,35–37. Additionally, we find similarities between mice and birds
on the level of spine types. We show that FoxP2low new MSNs 31 dpi have fewer mushroom spines than FoxP2high
new MSNs. In mice, striatal spiny neurons of heterozygous Foxp2 knockdown mice show specifically a decrease
of mushroom and branched spines whereas stubby and thin spines are not affected19. In birds and mammals,
dendritic spines of striatal MSNs receive both glutamatergic dopaminergic input from cortical/pallial regions and
the midbrain, respectively. In the case of new MSNs in Area X, we hypothesize that high FoxP2 expression levels
during their maturation might increase their capacity for receiving both inputs.
What mechanisms might account for morphological differences between FoxP2low and FoxP2high MSNs? They
may originate from differential target gene activation in FoxP2low and FoxP2high MSNs. FoxP2 has hundreds of
downstream target genes of which many are part of networks associated with neurite development35,49–52. One
specific candidate is the myocyte enhancer factor 2C (Mef2c), a negative regulator of synaptogenesis19. Foxp2
specifically promotes corticostriatal synaptogenesis via the repression of Mef2c. Whether a similar mecha-
nism shapes the integration of new MSNs into the avian corticostriatal network remains to be elucidated by
future studies. In zebra finch Area X, two direct FoxP2 targets are associated with neuronal outgrowth; the
very-low-density-lipoprotein receptor (VLDLR) and the contactin-associated protein-like 2 (CNTNAP2). Their
expression correlates positively with FoxP2 in juveniles and in singing adults53,54. Thus, in new Area X neurons,
VLDLR and CNTNAP2 would be expected to be highly activated during singing in FoxP2high MSN but not in
FoxP2low MSNs and may thus generate the diverging MSNs morphology we found.
We would like to propose some speculations regarding possible functions of two MSNs subpopulations that
differ in FoxP2 expression levels. We found that these populations differed in nucleus size, dendritic complexity
and spine density during an early time period of their integration into Area X. We do not know if the observed
morphological differences persist long-term because of a lack of markers that could distinguish former FoxP2high
MSNs from former FoxP2low MSNs in later maturation phases. If these two subpopulations persist long-term, they
might resemble striato-nigral and striato-pallidal MSNs of the direct and indirect pathway in mammals. These
MSNs subtypes are morphologically and neurochemically different. Direct pathway MSNs express the dopa-
mine receptor D1 and their dendrites are more complex than indirect pathway MSNs that express the dopamine
receptor D239,55. High Foxp2 levels in D1 MSNs and low Foxp2 in D2 MSNs have been proposed to be linked to
this anatomical dichotomy35. The avian direct and indirect pathway through the basal ganglia however is not
characterized by different MSN projections but rather by direct and indirect pallidal-like output neurons that
project from Area X to the thalamus56. To date, it is not known if MSN subtypes exclusively synapse on either
direct or indirect pallidal-like neurons57. Contrary to mammalian MSNs, more than half of the Area X MSNs
express multiple dopamine receptors58 so that they cannot be used as markers for indirect versus direct pathway
neurons. Investigating potential avian MSNs subtypes and the developmental role FoxP2 plays in those will be of
interest for future studies.
What might be the function of new MSNs in Area X and how is it affected by FoxP2 expression lev-
els? Our previous study showed that once matured, new MSNs have similar characteristics as older, res-
ident MSNs and are active during singing34. General MSNs function is feed forward inhibition within a
cortico-striatal-thalamo-cortical loop during singing59. We hypothesize that new MSNs in adult zebra finches are
entrained to produce a correct firing pattern in a plastic phase during their maturation and thus may counteract
Scientific Reports | (2020) 10:4787 | https://doi.org/10.1038/s41598-020-61740-6 7www.nature.com/scientificreports/ www.nature.com/scientificreports
song drift, as has been suggested before33,60. This process might be in influenced by varying FoxP2 expression
levels and the resulting morphological differences between putative subpopulations of new MSNs. FoxP2high new
neurons with a higher dendrite complexity and more dendritic spines might be more receptive to tuning than
FoxP2low new neurons. For further interpretations of our findings it will be crucial to gain additional knowledge
on the microcircuitry of Area X and on the role neurons play for its function.
In summary, FoxP2 expression levels vary in adult-born MSN at different maturation times after they have
been recruited to Area X. We show that the different FoxP2 expression levels correlate with neuronal morphology
and spine density. Varying FoxP2 expression levels during a specific time window might permit different target
gene activation important for correct incorporation and function of new MSNs in Area X.
Methods
FoxP2 nomenclature. We follow the nomenclature proposed by61, FOXP refers to the human gene, Foxp
refers to the mouse gene and FoxP refers to all other species. FOXP, Foxp2 and FoxP2 correspond to the protein
product.
Animals. 42 adult male zebra finches (Taeniopygia guttata, age >120 days) were used in the present study,
bred and housed at the Department of Animal Behaviour at Freie Universität Berlin. The colony was kept under a
12:12 h light:dark-cycle with food and water ad libitum. All experiments were reviewed and approved by the vet-
erinary department of the Freie Universität Berlin and by the ethics committee of the Regional Office for Health
and Social Affairs Berlin and were performed in accordance with relevant guidelines and regulations. The permit
numbers are G0116/13 and G0296/15.
Experiments. We conduced three experiments. In the first, we analyzed FoxP2 expression levels of new neu-
rons (BrdU+, see below) in Area X at three time points, e.g. at 21 days (5 birds, 166 neurons), 31 days (6 birds,
295 neurons) or 42 days (6 birds, 272 neurons) after BrdU injections (dpi). In the second experiment we analyzed
FoxP2 expression levels and the expression of the early growth response protein 1 (EGR-1) at 21 dpi (6 birds, 127
neurons), 31 dpi (6 birds, 108 neurons) and at 42 dpi (6 birds 156 neurons). In the third experiment we analyzed
FoxP2 expression levels, dendrite morphology and spine density of new neurons that were labelled via lentiviral
infection. In total we analyzed 52 neurons of 4 zebra finches (13 ± 3 neurons/bird, mean ± SD) at 31 dpi and 23
neurons of 3 zebra finches at 42 dpi (7.6 ± 0.5 neurons/bird, mean ± SD).
BrdU injections. For the analysis of FoxP2 levels and EGR-1 expression in newborn neurons 35 birds
received BrdU (50 µg/g) via intramuscular injections in the mornings for 5 consecutive days. Birds were assigned
to three groups with different survival times (21, 31, and 42 days after BrdU injection, dpi).
Song monitoring. For FoxP2 expression level analysis after BrdU treatment or lentiviral injections, 17 birds
were isolated in sound attenuated chambers for one night before sacrifice. In the following morning, birds were
kept from singing by the experimenter sitting nearby for 1.5 h after lights went on. For EGR-1 expression analysis
in new neurons after singing, 18 birds were kept in sound attenuated chambers for three nights and were perfused
in the morning of the 4th day 1.5 h after the lights went on. During those 1.5 h birds had to sing at least 150 motifs
to be included in the subsequent analysis of EGR-1 expression. Vocalizations were continuously monitored via
Sound Analysis Pro62.
Lentiviral Vector injection. To label progenitor cells at the lateral wall of the ventricle, the lentiviral expres-
sion vector pFUGW63 containing a GFP reporter gene was generated as described in Lois et al.63 and stereotac-
tically injected into the ventricular zone of 7 birds under isoflurane anesthesia. Titers ranged from 2 × 10⁶ and
3 × 10⁷ viral particles/µl. Birds were fixed in a stereotaxic head holder, with the beak in a 45° angle from the
vertical axis. In each hemisphere, approximately 200 µl of virus containing solution were injected into four sites.
Following coordinates relative to the bifurcation of the midsagittal sinus were used: anterior-posterior 3.8–4.1,
medial-latera −1.3/+1.3, dorsal-ventral −5.0, injection angle: 10° lateral.
Immunohistochemistry. For immunohistochemical staining birds were overdosed with isoflurane and
immediately perfused transcardially with phosphate-buffered saline (PBS) followed by 4% paraformaldehyde
(PFA) in PBS. Brains were dissected, post-fixed in 4% PFA for one night and washed for another night in PBS.
Brains were cut sagitally or frontally into 50 µm sections using a vibrating microtome (VT1000S, Leica). BrdU
antigen retrieval required incubation in 2N HCl for 30 min at 37 °C and neutralization with borate buffer. GFP
signal was enhanced via antibody staining. All immunostainings were performed according to standard proto-
cols. The following primary antibodies were used: anti FoxP2 (goat, Abcam ab1307, dilution:1:1000), anti EGR-1
(rabbit, Santa Cruz sc-189, dilution:1:600), anti BrdU (rat, Bio-Rad MCA2060, dilution: 1:200), anti GFP (rabbit,
Abcam ab290, dilution:1:1000). Fluorescent secondary antibodies were the following: anti-rat-Alexa-Fluor-488
(Life Technologies, A21208, dilution: 1:200), anti-rabbit-Alexa-Fluor-568 (Life Technologies, A10042, dilution:
1:200), anti-goat-Alaxa-Fluor-647 (Life Technologies, A21447, dilution: 1:200). To visualize nuclei, all sections
were counterstained with 4′, 6-Diamidin-2-phenylindol (DAPI, Serva).
Confocal imaging and image processing and quantification. Z-Stacks of BrdU+ or GFP+ cells
in Area X were obtained with a SP8 confocal microscope (Leica). For FoxP2 scanning, all microscope settings
were kept constant. Scans of BrdU+ nuclei were performed using a 63x lens (digital zoom 2.0), an image size of
1024 × 1024 pixels and a z-stack size of 1 µm. Whole neurons (GFP+) were imaged using a 63x lens, an image size
of 2042 × 2042 pixel and a z-stack size of 1 µm. Acquired images were processed using the Fiji software package64.
Only neurons with spiny long dendrites were included in the analysis. The Rolling Ball Background Subtraction
Scientific Reports | (2020) 10:4787 | https://doi.org/10.1038/s41598-020-61740-6 8www.nature.com/scientificreports/ www.nature.com/scientificreports
plugin was used to subtract background. We measured the mean pixel intensity of nuclear FoxP2 expression, by
positioning a circle of 4 µm in diameter (12.56 µm2) in the center of the BrdU+ nucleus. In total we analyzed the
intensity of the FoxP2 expression dependent fluorescence of 166 BrdU+ cells at 21 dpi (n = 5), 295 BrdU+ cells
at 31 dpi (n = 6) and 272 BrdU+ cells at 42 dpi (n = 6). FoxP2high were defined as cells that fell into the top 30% of
measured mean pixel intensities in one animal (i.e. if the highest mean pixel intensity in one animal was 240 we
counted all BrdU+ cells that had a FoxP2 mean pixel intensity between 168 and 240 as FoxP2high neurons). We
decided on the 30% value because it covered the FoxP2high expressing cells in the bimodal distribution of all FoxP2
intensities. We defined the neurons that fell into the bottom 30% of measured mean pixel intensities as FoxP2low.
As for the FoxP2high cutoff, the bottom 30% contained the low-intensity peak of the bimodal density distribution.
Because we particularly wanted to address the effect of high and low FoxP2 expression levels on neuronal prop-
erties, neurons with intermediate FoxP2 expression levels were not considered for further analysis. The Simple
Neurite Tracer plugin (Fiji) was used to trace individual neurons and we analyzed their total branch length and
number of primary dendrites. The traces were then used by the Sholl analysis plugin in Fiji65. We measured inter-
sections of dendrites with concentric circles that were placed every 10 µm starting from the center of the soma.
The maximal number of intersections per neuron was extracted from the Sholl analysis dataset. For dendritic
spine analysis images were deconvolved using the Tikhonov-Miller algorithm in the DeconvolutionLab plugin
in Fiji66. Prior to deconvolution an individual point spread function was generated for each image using the Born
and Wolf 3D optical model in the PSF Generator plugin in Fiji67. Semiautomated dendritic spine counts were per-
formed using the software NeuronStudio68 that uses a spine classification algorithm. For spine classification, the
default settings were used to classify spines as mushroom, stubby or thin spines: a head-to-neck ratio threshold
of 1.1 µm, a height-to-width ratio threshold of 2.5 µm and a minimum mushroom head size of 0.35 µm. A spine is
considered mushroom if the head-to-neck ratio is above the threshold and its head is larger than 0.35 µm. A spine
is considered stubby if its head-to-neck ratio and its heights-to-width ratio are below threshold. In all other cases
spines were classified as thin. On average, we analyzed spines densities on secondary dendrites along the length
of 118 µm ± 1.92 (mean, SEM) per neuron. In total, we analyzed spines of 52 individual neurons of 4 animals in
experimental group 31 dpi, and 23 neurons of 3 animals at 42 dpi. Additionally, we measured the dendrite diam-
eter of 44 new neurons in 4 animals (8–12 neurons per animal) using the line measuring tool in Fiji64. We took 5
measures on each of 3 secondary dendrites per neuron (in total 15 measures per neuron). The experimenter was
blind to FoxP2 levels of individual neurons during the whole quantification process, because cells were selected
for quantification based on their BrdU+ fluorescence or their EGR-1 fluorescence and FoxP2 fluorescence in a
different channel was quantified last. The datasets generated and analysed during the current study are available
from the corresponding author on request.
Statistics. The software R was used to analyze data69. Significance level was p < 0.05 for all tests. Plots were
generated using the ggplot package in R70. For the analysis of FoxP2high neurons we used a Kruskal-Wallis test fol-
lowed by a Dunn’s test for pairwise comparison. For the analysis of FoxP2low neurons we used ANOVA followed
by a Bonferroni’s multiple comparison test. The relationship of (a) FoxP2 levels and nuclear diameter as well as (b)
FoxP2+ neurons and singing were determined using a linear regression analysis. Dendritic spine data (all spines)
and Sholl data were analyzed using the paired Student’s t-test. Data from the spine type analysis, mushroom head
size, total dendrite length, number of primary dendrites and dendrite thickness were analyzed using the Mann
Whitney test. Number of maximal intersections was analyzed using the Student’s t-test. Choice of test was based
on previous analysis for normality using the Shapiro-Wilk-test and variance analysis using the F-test or Levene’s
test.
Received: 29 October 2019; Accepted: 29 February 2020;
Published: xx xx xxxx
References
1. Lai, C. S., Fisher, S. E., Hurst, J. A., Vargha-Khadem, F. & Monaco, A. P. A forkhead-domain gene is mutated in a severe speech and
language disorder. Nature 413, 519–523, https://doi.org/10.1038/35097076 (2001).
2. Deriziotis, P. & Fisher, S. E. Speech and Language: Translating the Genome. Trends Genet 33, 642–656, https://doi.org/10.1016/j.
tig.2017.07.002 (2017).
3. Morgan, A., Fisher, S. E., Scheffer, I. & Hildebrand, M. In GeneReviews (eds Adam, M. P. et al.) (2016).
4. Wohlgemuth, S., Adam, I. & Scharff, C. FoxP2 in songbirds. Curr Opin Neurobiol 28, 86–93, https://doi.org/10.1016/j.
conb.2014.06.009 (2014).
5. Teramitsu, I., Kudo, L. C., London, S. E., Geschwind, D. H. & White, S. A. Parallel FoxP1 and FoxP2 expression in songbird and
human brain predicts functional interaction. J Neurosci 24, 3152–3163, https://doi.org/10.1523/JNEUROSCI.5589-03.2004 (2004).
6. Lai, C. S., Gerrelli, D., Monaco, A. P., Fisher, S. E. & Copp, A. J. FOXP2 expression during brain development coincides with adult
sites of pathology in a severe speech and language disorder. Brain 126, 2455–2462, https://doi.org/10.1093/brain/awg247 (2003).
7. Haesler, S. et al. FoxP2 expression in avian vocal learners and non-learners. J Neurosci 24, 3164–3175, https://doi.org/10.1523/
JNEUROSCI.4369-03.2004 (2004).
8. Heston, J. B. & White, S. A. Behavior-Linked FoxP2 Regulation Enables Zebra Finch Vocal Learning. J Neurosci 35, 2885–2894,
https://doi.org/10.1523/JNEUROSCI.3715-14.2015 (2015).
9. Haesler, S. et al. Incomplete and inaccurate vocal imitation after knockdown of FoxP2 in songbird basal ganglia nucleus Area X.
PLoS Biol 5, e321, https://doi.org/10.1371/journal.pbio.0050321 (2007).
10. Norton, P., Barschke, P., Scharff, C. & Mendoza, E. Differential Song Deficits after Lentivirus-Mediated Knockdown of FoxP1,
FoxP2, or FoxP4 in Area X of Juvenile Zebra Finches. J Neurosci 39, 9782–9796, https://doi.org/10.1523/JNEUROSCI.1250-19.2019
(2019).
11. Vargha-Khadem, F. et al. Neural basis of an inherited speech and language disorder. Proc Natl Acad Sci USA 95, 12695–12700,
https://doi.org/10.1073/pnas.95.21.12695 (1998).
12. Day, N. F., Hobbs, T. G., Heston, J. B. & White, S. A. Beyond Critical Period Learning: Striatal FoxP2 Affects the Active Maintenance
of Learned Vocalizations in Adulthood. eNeuro 6, https://doi.org/10.1523/ENEURO.0071-19.2019 (2019).
Scientific Reports | (2020) 10:4787 | https://doi.org/10.1038/s41598-020-61740-6 9www.nature.com/scientificreports/ www.nature.com/scientificreports
13. Murugan, M., Harward, S., Scharff, C. & Mooney, R. Diminished FoxP2 levels affect dopaminergic modulation of corticostriatal
signaling important to song variability. Neuron 80, 1464–1476, https://doi.org/10.1016/j.neuron.2013.09.021 (2013).
14. Tsui, D., Vessey, J. P., Tomita, H., Kaplan, D. R. & Miller, F. D. FoxP2 regulates neurogenesis during embryonic cortical development.
J Neurosci 33, 244–258, https://doi.org/10.1523/JNEUROSCI.1665-12.2013 (2013).
15. Garcia-Calero, E., Botella-Lopez, A., Bahamonde, O., Perez-Balaguer, A. & Martinez, S. FoxP2 protein levels regulate cell
morphology changes and migration patterns in the vertebrate developing telencephalon. Brain Struct Funct 221, 2905–2917, https://
doi.org/10.1007/s00429-015-1079-7 (2016).
16. Clovis, Y. M., Enard, W., Marinaro, F., Huttner, W. B. & De Pietri Tonelli, D. Convergent repression of Foxp2 3′UTR by miR-9 and
miR-132 in embryonic mouse neocortex: implications for radial migration of neurons. Development 139, 3332–3342, https://doi.
org/10.1242/dev.078063 (2012).
17. Kast, R. J., Lanjewar, A. L., Smith, C. D. & Levitt, P. FOXP2 exhibits projection neuron class specific expression, but is not required
for multiple aspects of cortical histogenesis. Elife 8, https://doi.org/10.7554/eLife.42012 (2019).
18. Chiu, Y. C. et al. Foxp2 regulates neuronal differentiation and neuronal subtype specification. Dev Neurobiol 74, 723–738, https://
doi.org/10.1002/dneu.22166 (2014).
19. Chen, Y. C. et al. Foxp2 controls synaptic wiring of corticostriatal circuits and vocal communication by opposing Mef2c. Nat
Neurosci, https://doi.org/10.1038/nn.4380 (2016).
20. Groszer, M. et al. Impaired synaptic plasticity and motor learning in mice with a point mutation implicated in human speech
deficits. Curr Biol 18, 354–362, https://doi.org/10.1016/j.cub.2008.01.060 (2008).
21. French, C. A. et al. An aetiological Foxp2 mutation causes aberrant striatal activity and alters plasticity during skill learning. Mol
Psychiatry 17, 1077–1085, https://doi.org/10.1038/mp.2011.105 (2012).
22. French, C. A. et al. Differential effects of Foxp2 disruption in distinct motor circuits. Mol Psychiatry 24, 447–462, https://doi.
org/10.1038/s41380-018-0199-x (2019).
23. van Rhijn, J. R., Fisher, S. E., Vernes, S. C. & Nadif Kasri, N. Foxp2 loss of function increases striatal direct pathway inhibition via
increased GABA release. Brain Struct Funct 223, 4211–4226, https://doi.org/10.1007/s00429-018-1746-6 (2018).
24. Thompson, C. K. et al. Young and intense: FoxP2 immunoreactivity in Area X varies with age, song stereotypy, and singing in male
zebra finches. Front Neural Circuits 7, 24, https://doi.org/10.3389/fncir.2013.00024 (2013).
25. Teramitsu, I. & White, S. A. FoxP2 regulation during undirected singing in adult songbirds. J Neurosci 26, 7390–7394, https://doi.
org/10.1523/JNEUROSCI.1662-06.2006 (2006).
26. Miller, J. E. et al. Birdsong decreases protein levels of FoxP2, a molecule required for human speech. J Neurophysiol 100, 2015–2025,
https://doi.org/10.1152/jn.90415.2008 (2008).
27. Teramitsu, I., Poopatanapong, A., Torrisi, S. & White, S. A. Striatal FoxP2 is actively regulated during songbird sensorimotor
learning. PLoS One 5, e8548, https://doi.org/10.1371/journal.pone.0008548 (2010).
28. Alvarez-Buylla, A., Kirn, J. R. & Nottebohm, F. Birth of projection neurons in adult avian brain may be related to perceptual or
motor learning. Science 249, 1444–1446 (1990).
29. Alvarez-Buylla, A., Ling, C. Y. & Yu, W. S. Contribution of neurons born during embryonic, juvenile, and adult life to the brain of
adult canaries: regional specificity and delayed birth of neurons in the song-control nuclei. J Comp Neurol 347, 233–248, https://doi.
org/10.1002/cne.903470207 (1994).
30. Lipkind, D., Nottebohm, F., Rado, R. & Barnea, A. Social change affects the survival of new neurons in the forebrain of adult
songbirds. Behav Brain Res 133, 31–43, https://doi.org/10.1016/s0166-4328(01)00416-8 (2002).
31. Rochefort, C., He, X., Scotto-Lomassese, S. & Scharff, C. Recruitment of FoxP2-expressing neurons to area X varies during song
development. Dev Neurobiol 67, 809–817, https://doi.org/10.1002/dneu.20393 (2007).
32. Barnea, A. & Pravosudov, V. Birds as a model to study adult neurogenesis: bridging evolutionary, comparative and neuroethological
approaches. Eur J Neurosci 34, 884–907, https://doi.org/10.1111/j.1460-9568.2011.07851.x (2011).
33. Pytte, C. L. Adult Neurogenesis in the Songbird: Region-Specific Contributions of New Neurons to Behavioral Plasticity and
Stability. Brain Behav Evol 87, 191–204, https://doi.org/10.1159/000447048 (2016).
34. Kosubek-Langer, J., Schulze, L. & Scharff, C. Maturation, Behavioral Activation, and Connectivity of Adult-Born Medium Spiny
Neurons in a Striatal Song Nucleus. Front Neurosci 11, 323, https://doi.org/10.3389/fnins.2017.00323 (2017).
35. Vernes, S. C. et al. Foxp2 regulates gene networks implicated in neurite outgrowth in the developing brain. PLoS Genet 7, e1002145,
https://doi.org/10.1371/journal.pgen.1002145 (2011).
36. Enard, W. et al. A humanized version of Foxp2 affects cortico-basal ganglia circuits in mice. Cell 137, 961–971, https://doi.
org/10.1016/j.cell.2009.03.041 (2009).
37. Reimers-Kipping, S., Hevers, W., Paabo, S. & Enard, W. Humanized Foxp2 specifically affects cortico-basal ganglia circuits.
Neuroscience 175, 75–84, https://doi.org/10.1016/j.neuroscience.2010.11.042 (2011).
38. Stanley, G., Gokce, O., Malenka, R. C., Sudhof, T. C. & Quake, S. R. Continuous and Discrete Neuron Types of the Adult Murine
Striatum. Neuron, https://doi.org/10.1016/j.neuron.2019.11.004 (2019).
39. Gertler, T. S., Chan, C. S. & Surmeier, D. J. Dichotomous anatomical properties of adult striatal medium spiny neurons. J Neurosci
28, 10814–10824, https://doi.org/10.1523/JNEUROSCI.2660-08.2008 (2008).
40. Jarvis, E. D., Scharff, C., Grossman, M. R., Ramos, J. A. & Nottebohm, F. For whom the bird sings: context-dependent gene
expression. Neuron 21, 775–788 (1998).
41. Mello, C. V. & Ribeiro, S. ZENK protein regulation by song in the brain of songbirds. J Comp Neurol 393, 426–438 (1998).
42. Knapska, E. & Kaczmarek, L. A gene for neuronal plasticity in the mammalian brain: Zif268/Egr-1/NGFI-A/Krox-24/TIS8/ZENK?
Prog Neurobiol 74, 183–211, https://doi.org/10.1016/j.pneurobio.2004.05.007 (2004).
43. Hessler, N. A. & Doupe, A. J. Social context modulates singing-related neural activity in the songbird forebrain. Nat Neurosci 2,
209–211, https://doi.org/10.1038/6306 (1999).
44. Zengin-Toktas, Y. & Woolley, S. C. Singing modulates parvalbumin interneurons throughout songbird forebrain vocal control
circuitry. PLoS One 12, e0172944, https://doi.org/10.1371/journal.pone.0172944 (2017).
45. Schmidt, M. F. & Konishi, M. Gating of auditory responses in the vocal control system of awake songbirds. Nat Neurosci 1, 513–518,
https://doi.org/10.1038/2232 (1998).
46. Warren, W. C. et al. The genome of a songbird. Nature 464, 757–762, https://doi.org/10.1038/nature08819 (2010).
47. Veyrac, A. et al. Zif268/egr1 gene controls the selection, maturation and functional integration of adult hippocampal newborn
neurons by learning. Proc Natl Acad Sci USA 110, 7062–7067, https://doi.org/10.1073/pnas.1220558110 (2013).
48. Schulz, S. B., Haesler, S., Scharff, C. & Rochefort, C. Knockdown of FoxP2 alters spine density in Area X of the zebra finch. Genes
Brain Behav 9, 732–740, https://doi.org/10.1111/j.1601-183X.2010.00607.x (2010).
49. Spiteri, E. et al. Identification of the transcriptional targets of FOXP2, a gene linked to speech and language, in developing human
brain. Am J Hum Genet 81, 1144–1157, https://doi.org/10.1086/522237 (2007).
50. Vernes, S. C. et al. High-throughput analysis of promoter occupancy reveals direct neural targets of FOXP2, a gene mutated in
speech and language disorders. Am J Hum Genet 81, 1232–1250, https://doi.org/10.1086/522238 (2007).
51. Hickey, S. L., Berto, S. & Konopka, G. Chromatin Decondensation by FOXP2 Promotes Human Neuron Maturation and Expression
of Neurodevelopmental Disease Genes. Cell Rep 27, 1699–1711 e1699, https://doi.org/10.1016/j.celrep.2019.04.044 (2019).
52. Konopka, G. et al. Human-specific transcriptional regulation of CNS development genes by FOXP2. Nature 462, 213–217, https://
doi.org/10.1038/nature08549 (2009).
Scientific Reports | (2020) 10:4787 | https://doi.org/10.1038/s41598-020-61740-6 10www.nature.com/scientificreports/ www.nature.com/scientificreports
53. Adam, I., Mendoza, E., Kobalz, U., Wohlgemuth, S. & Scharff, C. FoxP2 directly regulates the reelin receptor VLDLR developmentally
and by singing. Mol Cell Neurosci 74, 96–105, https://doi.org/10.1016/j.mcn.2016.04.002 (2016).
54. Adam, I., Mendoza, E., Kobalz, U., Wohlgemuth, S. & Scharff, C. CNTNAP2 is a direct FoxP2 target in vitro and in vivo in zebra
finches: complex regulation by age and activity. Genes Brain Behav 16, 635–642, https://doi.org/10.1111/gbb.12390 (2017).
55. Calabresi, P., Picconi, B., Tozzi, A., Ghiglieri, V. & Di Filippo, M. Direct and indirect pathways of basal ganglia: a critical reappraisal.
Nat Neurosci 17, 1022–1030, https://doi.org/10.1038/nn.3743 (2014).
56. Farries, M. A., Ding, L. & Perkel, D. J. Evidence for “direct” and “indirect” pathways through the song system basal ganglia. J Comp
Neurol 484, 93–104, https://doi.org/10.1002/cne.20464 (2005).
57. Pidoux, M., Bollu, T., Riccelli, T. & Goldberg, J. H. Origins of basal ganglia output signals in singing juvenile birds. J Neurophysiol
113, 843–855, https://doi.org/10.1152/jn.00635.2014 (2015).
58. Kubikova, L., Wada, K. & Jarvis, E. D. Dopamine receptors in a songbird brain. J Comp Neurol 518, 741–769, https://doi.org/10.1002/
cne.22255 (2010).
59. Perkel, D. J., Farries, M. A., Luo, M. & Ding, L. Electrophysiological analysis of a songbird basal ganglia circuit essential for vocal
plasticity. Brain Res Bull 57, 529–532, https://doi.org/10.1016/s0361-9230(01)00690-6 (2002).
60. Wilbrecht, L. & Kirn, J. R. Neuron addition and loss in the song system: regulation and function. Ann N Y Acad Sci 1016, 659–683,
https://doi.org/10.1196/annals.1298.024 (2004).
61. Kaestner, K. H., Knochel, W. & Martinez, D. E. Unified nomenclature for the winged helix/forkhead transcription factors. Genes Dev
14, 142–146 (2000).
62. Tchernichovski, O., Nottebohm, F., Ho, C. E., Pesaran, B. & Mitra, P. P. A procedure for an automated measurement of song
similarity. Anim Behav 59, 1167–1176, https://doi.org/10.1006/anbe.1999.1416 (2000).
63. Lois, C., Hong, E. J., Pease, S., Brown, E. J. & Baltimore, D. Germline transmission and tissue-specific expression of transgenes
delivered by lentiviral vectors. Science 295, 868–872, https://doi.org/10.1126/science.1067081 (2002).
64. Schindelin, J. et al. Fiji: an open-source platform for biological-image analysis. Nat Methods 9, 676–682, https://doi.org/10.1038/
nmeth.2019 (2012).
65. Ferreira, T. A. et al. Neuronal morphometry directly from bitmap images. Nat Methods 11, 982–984, https://doi.org/10.1038/
nmeth.3125 (2014).
66. Sage, D. et al. DeconvolutionLab2: An open-source software for deconvolution microscopy. Methods 115, 28–41, https://doi.
org/10.1016/j.ymeth.2016.12.015 (2017).
67. Kirshner, H., Aguet, F., Sage, D. & Unser, M. 3-D PSF fitting for fluorescence microscopy: implementation and localization
application. J Microsc 249, 13–25, https://doi.org/10.1111/j.1365-2818.2012.03675.x (2013).
68. Rodriguez, A., Ehlenberger, D. B., Dickstein, D. L., Hof, P. R. & Wearne, S. L. Automated three-dimensional detection and shape
classification of dendritic spines from fluorescence microscopy images. PLoS One 3, e1997, https://doi.org/10.1371/journal.
pone.0001997 (2008).
69. R: A Language and Environment for Statistical Computing (R Foundation for Statistical Computing, 2013).
70. Wickham, H. gglot2: Elegant Graphics for Data Analysis. (Springer, 2016).
Acknowledgements
J.K.L. received funds from the Elsa Neumann scholarship by the state of Berlin, the Christiane Nüsslein-Volhard
Foundation and the Max Planck School of Cognition.
Author contributions
J.K.L. and C.S. designed experiments, J.K.L. performed experiments and data analysis, J.K.L. and C.S. wrote the
manuscript.
Competing interests
The authors declare no competing interests.
Additional information
Correspondence and requests for materials should be addressed to J.K.-L.
Reprints and permissions information is available at www.nature.com/reprints.
Publisher’s note Springer Nature remains neutral with regard to jurisdictional claims in published maps and
institutional affiliations.
Open Access This article is licensed under a Creative Commons Attribution 4.0 International
License, which permits use, sharing, adaptation, distribution and reproduction in any medium or
format, as long as you give appropriate credit to the original author(s) and the source, provide a link to the Cre-
ative Commons license, and indicate if changes were made. The images or other third party material in this
article are included in the article’s Creative Commons license, unless indicated otherwise in a credit line to the
material. If material is not included in the article’s Creative Commons license and your intended use is not per-
mitted by statutory regulation or exceeds the permitted use, you will need to obtain permission directly from the
copyright holder. To view a copy of this license, visit http://creativecommons.org/licenses/by/4.0/.
© The Author(s) 2020
Scientific Reports | (2020) 10:4787 | https://doi.org/10.1038/s41598-020-61740-6 11You can also read