Two-dimensional liquid water flow through snow at the plot scale in continental snowpacks: simulations and field data comparisons - The Cryosphere
←
→
Page content transcription
If your browser does not render page correctly, please read the page content below
The Cryosphere, 15, 1423–1434, 2021
https://doi.org/10.5194/tc-15-1423-2021
© Author(s) 2021. This work is distributed under
the Creative Commons Attribution 4.0 License.

Two-dimensional liquid water flow through snow at the
plot scale in continental snowpacks: simulations and
field data comparisons
Ryan W. Webb1,2,3 , Keith Jennings4,5,6 , Stefan Finsterle7 , and Steven R. Fassnacht8,9,10
1 Department   of Civil, Construction, & Environmental Engineering, University of New Mexico,
Albuquerque, NM 87131, USA
2 Center for Water and the Environment, University of New Mexico, Albuquerque, NM 87131, USA
3 Institute of Arctic and Alpine Research, University of Colorado Boulder, Boulder, CO 80303, USA
4 Lynker, Boulder, CO 80301, USA
5 Department of Geography, University of Nevada, Reno, NV 89557, USA
6 Desert Research Institute, Reno, NV 89512, USA
7 Finsterle GeoConsulting, Kensington, CA 94708, USA
8 Ecosystem Science and Sustainability – Watershed Science, Colorado State University, Fort Collins, CO 80523, USA
9 Coopertive Institute for Research in the Atmosphere, Colorado State University, Fort Collins, CO 80521, USA
10 Natural Resources Ecology Laboratory, Colorado State University, Fort Collins, CO 80523, USA

Correspondence: Ryan W. Webb (rwebb@unm.edu)

Received: 15 July 2020 – Discussion started: 11 August 2020
Revised: 29 January 2021 – Accepted: 10 February 2021 – Published: 19 March 2021

Abstract. Modeling the multidimensional flow of liquid wa-          flow than vertically percolating water, and the below-treeline
ter through snow has been limited in spatial and temporal           site resulted in negligible longitudinal flow of liquid water.
scales to date. Here, we present simulations using the in-          These results show the increasing influence of longitudinal
verse TOUGH2 (iTOUGH2) model informed by the model                  intra-snowpack flow paths with elevation, similar to field ob-
SNOWPACK, referred to as SnowTOUGH. We use Snow-                    servations. Results of this study suggest that intra-snowpack
TOUGH to simulate snow metamorphism, melt/freeze pro-               longitudinal flow may be an important process for consider-
cesses, and liquid water movement in two-dimensional snow-          ation in hydrologic modeling for higher-elevation headwater
packs at the plot scale (20 m) on a sloping ground surface          catchments.
during multi-day observation periods at three field sites in
northern Colorado, USA. Model results compare well with
sites below the treeline and above the treeline but not at a site
near the treeline. Results show the importance of longitudinal      1   Introduction
intra-snowpack flow paths (i.e., parallel to ground surface in
the downslope direction and sometimes referred to as lateral        The presence, storage, and movement of liquid water within
flow), particularly during times when the snow surface (i.e.,       a snowpack has direct implications for land surface albedo
snow–atmosphere interface) is not actively melting. At our          (Dietz et al., 2012), wet-snow avalanches (Mitterer et al.,
above-treeline site, simulations show that longitudinal flow        2011), streamflow generation (Hirashima et al., 2010; Wever
can occur at rates orders of magnitude greater than vertically      et al., 2014), and rain-on-snow runoff generation (Würzer
downward percolating water flow at a mean ratio of 75 : 1           et al., 2016). During snowmelt and rain-on-snow events, the
as a result of hydraulic barriers that divert flow. Our near-       movement of liquid water through snow is a major factor in
treeline site simulations resulted in slightly less longitudinal    controlling the timing and magnitude of runoff (Brauchli et
                                                                    al., 2017; Colbeck, 1972; Musselman et al., 2018; Würzer et

Published by Copernicus Publications on behalf of the European Geosciences Union.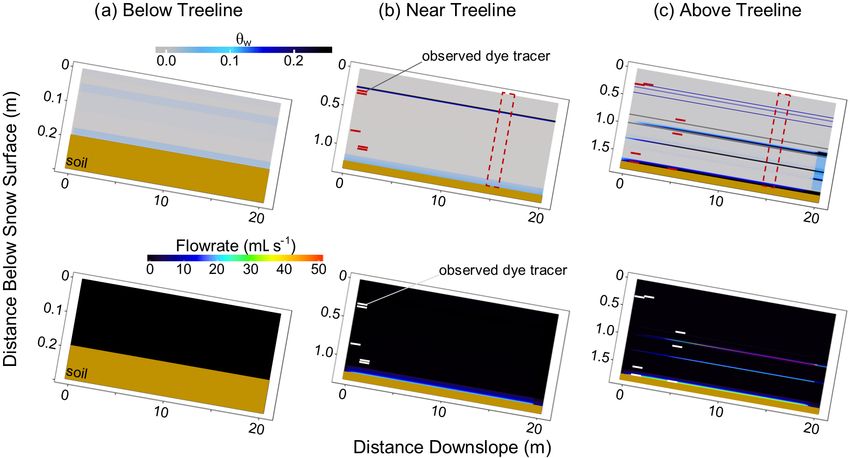
1424                                                                    R. W. Webb et al.: Two-dimensional liquid water flow

al., 2016). Although liquid water flow is typically thought of
as acting primarily in the vertical direction, previous work
has shown that intra-snowpack longitudinal flow can affect
the timing, volume, and spatial patterning of runoff. We de-
fine intra-snowpack longitudinal flow as flow parallel to the
ground surface in the downslope direction (sometimes re-
ferred to as lateral flow). Such intra-snowpack longitudinal
flow has been shown to deposit runoff directly into streams,
bypassing soil interactions (Eiriksson et al., 2013; Liu et al.,
2004), and to create focused soil infiltration capable of alter-
ing runoff processes (i.e. produce infiltration excess; Webb et     Figure 1. Conceptual diagram of the model domain showing the
al., 2018d). Field observations have shown intra-snowpack           snowpack above soil, the location of the drain in the soil, and ele-
flow paths to range in scale from centimeters up to tens of         ment discretization. Figure not to scale.
meters (Avanzi et al., 2017; Kattelmann, 1985; Schneebeli,
1995; Webb et al., 2018a; Williams et al., 2010). However,
                                                                    pack at the plot scale, and (3) to compare results to field ob-
modeling of this spatiotemporally complex process has been
                                                                    servations under varying snowpack conditions.
limited to one-dimensional (i.e., vertical) or centimeter-scale
simulations (e.g., Wever et al., 2014; Würzer et al., 2017).
   Multidimensional numerical models simulating preferen-           2     Methods
tial flow (vertical and/or longitudinal) through snow have
only been recently developed (Hirashima et al., 2019 2017,          We simulated liquid water flow through snow at three exper-
2014; Leroux and Pomeroy, 2017). These models apply long-           imental plots, modeled as 20 m long, two-dimensional do-
understood soil physics using the laboratory parameteriza-          mains with a hillslope angle of 10◦ (Fig. 1). Within this do-
tion of snow properties (Calonne et al., 2012; Yamaguchi            main, the iTOUGH2 numerical model simulated the flow of
et al., 2010). As a result, these processes have been simu-         liquid water with time-varying snow layer properties pro-
lated primarily in centimeter-scale studies (e.g., Hirashima        vided by the SNOWPACK model. It is important to note that
et al., 2019). However, there remains a need to understand          the models were not fully coupled. For each iTOUGH2 time
these processes at the plot scale (multiple meters) to further      step, material properties were updated using output from
understand the hydrological impacts, namely the amount of           SNOWPACK at that time step. For the remainder of this pa-
liquid water transported in the horizontal relative to the verti-   per, this soft coupling of SNOWPACK and iTOUGH2 will
cal direction. Processes to consider during liquid water flow       be referred to as SnowTOUGH. For SnowTOUGH testing,
through snow include snow metamorphism, the melting of              we limited the time domain of simulations to match field ob-
snow, and the refreezing of liquid water. These processes cre-      servations. We initiated the simulations during the first snow
ate temporally dynamic media properties, specifically snow          pit observations and ended them approximately 3 d later at
grain size and porosity, creating a more complex environ-           the completion of experiments at each study plot.
ment relative to soil (Webb et al., 2018b). The layered char-
acteristics of a snowpack and rapid metamorphism that oc-           2.1    SNOWPACK
curs during melt (McGurk and Marsh, 1995; Marsh, 1987;
Marsh and Woo, 1985) create temporary hydraulic barriers            The time-dependent material properties of the SnowTOUGH
(Webb et al., 2018b) and thus temporally dynamic flow paths.        simulations were informed using the physically based
Understanding and modeling these dynamic flow paths at the          SNOWPACK model (Bartelt and Lehning, 2002; Lundy et
plot scale remain an outstanding challenge in snow science.         al., 2001). SNOWPACK discretizes the snow profile into
   The goal of this study is to advance the understanding           layers, adding layers during accumulation events and con-
of the spatiotemporal scales of longitudinal intra-snowpack         solidating them during compaction and melt. SNOWPACK
flow paths by simulating liquid water flow through a lay-           closes the mass and energy balances at each time step and in-
ered snowpack at the plot scale. The research objectives are        cludes physically based routines for internal snowpack pro-
(1) to use the model SNOWPACK (Bartelt and Lehning,                 cesses, including energy exchange, snow grain metamor-
2002) to simulate snow metamorphism, melting, and refreez-          phism, and liquid water transport. SNOWPACK has been ex-
ing processes, (2) to utilize enhancements to the TOUGH2            tensively validated in multiple environments and snow condi-
(Pruess et al., 2012) non-isothermal multiphase flow and            tions (e.g., Jennings et al., 2018; Lundy et al., 2001; Meromy
transport model, as implemented in the inverse TOUGH2               et al., 2015; Wever et al., 2016).
(iTOUGH2) simulation-optimization framework (Finsterle,                Simulations were run at hourly time steps with quality-
2020; Finsterle et al., 2017), to simulate water flow through       controlled meteorological observations. Air temperature, rel-
a two-dimensional, temporally dynamic, and layered snow-            ative humidity, wind speed, incoming shortwave radiation,
                                                                    incoming longwave radiation, and snow depth data were

The Cryosphere, 15, 1423–1434, 2021                                                      https://doi.org/10.5194/tc-15-1423-2021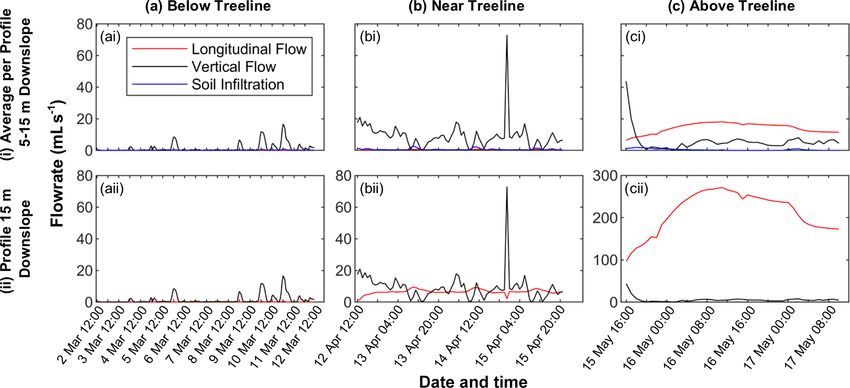
R. W. Webb et al.: Two-dimensional liquid water flow                                                                       1425

used as forcing data for the SNOWPACK simulations. The             2.2   iTOUGH2
SNOWPACK canopy module was activated for the below-
treeline (BT) study plot (described below) using physically        iTOUGH2 is a simulation-optimization framework for the
representative values of leaf area index (4.0 m2 m−2 ), canopy     TOUGH suite of numerical models that have been utilized
height (7.0 m), and direct throughfall fraction (0.2, dimen-       and validated for a range of processes in porous media
sionless). Liquid water transport was simulated using the de-      (e.g., Fujimaki et al., 2008; Hannon and Finsterle, 2018; Ho
fault bucket scheme for full water year simulations and the        and Webb, 1998; Kechavarzi et al., 2008; Lippmann and
Richards equation option (Wever et al., 2014) for simulat-         Bodavarsson, 1983). For this study, we used the equation
ing the intensive observation period (IOP) at each study plot.     of state module 9 (EOS9), applying the Richards equation
Full water year simulations were used to offer context to the      (Richards, 1931) for the transport of liquid water only which
timing of each IOP relative to peak snow water equivalent          does not consider energy transport (Pruess et al., 2012).
(SWE) and snowmelt processes (Fig. 2). For the IOP simula-         We used new enhancements to the iTOUGH2 code (Fin-
tions, initial conditions were provided through manual snow        sterle, 2020) that allow for time-dependent material proper-
pit observations (Webb et al., 2020, 2018c) so that we could       ties and time-dependent material-related source/sink terms
focus our analysis on the intra-snowpack flow of liquid water      to simulate the snow metamorphism and melt/freeze pro-
and comparisons to field observations rather than the accu-        cesses in a layered snowpack. The layered snowpack was
racy of the SNOWPACK-simulated stratigraphy and the po-            modeled above a 10–30 cm deep soil, increasing in depth
tential implications for our results. We revised input files for   under deeper snow. Deeper soil was modeled under deeper
these simulations to be as consistent as possible with SNOW-       snow to increase pore storage volume available for any in-
PACK’s representation of measured and non-measured pa-             filtrating water released from the snowpack. The boundary
rameters. For example, we set liquid water fraction values         conditions of the upslope and downslope ends of the do-
based on snow pit observations (very wet/slush = 0.07, wet         main were simulated as no-flow conditions, and a drain was
= 0.05, little water = 0.03, sticky = 0.01; Bradford et al.,       modeled at the downslope end to remove excess liquid wa-
2009; Techel and Pielmeier, 2011; Webb et al., 2018c). We          ter that may build up on the no-flow boundary (Fig. 1). Soil
also defined sphericity to be 1 and dendricity to be 0 as most     types for each site are known as silty loam, and retention
of the snow had metamorphosed by the time of observation,          parameters common to this soil type were used. These pa-
and we set grain types based on Lehning et al. (2002). We          rameters were a van Genuchten m value of 0.29, a poros-
estimated bond radius as 30 % of the measured grain ra-            ity of 0.67, and a van Genuchten α value of 0.02 cm−1 . The
dius. For more information on SNOWPACK simulations, see            slightly high porosity was chosen to allow for additional
Webb et al. (2020, 2018c).                                         soil moisture storage, if necessary. Saturated hydraulic con-
   Snow layer variables were calculated by SNOWPACK at             ductivity estimates of the soils were taken as the mean of
hourly intervals, specifically snow grain diameter (d), bulk       more than 15 mini-disk infiltrometer observations distributed
snow density (ρs ), volumetric liquid water content (θw ), and     evenly across a 10 m × 20 m plot at each site. These sat-
volumetric ice content (θi ). The dry density of each snow         urated hydraulic conductivity values for the below-treeline
layer (ρds ) was calculated by multiplying θi by the density       (BT), near-treeline (NT), and above-treeline (AT) sites were
of ice (917 kg m−3 ). The melt/freeze rate of each layer was       1.36 × 10⁻³ , 6.93 × 10⁻⁴ , and 8.46 × 10⁻⁴ cm s−1 , respec-
determined by changes in θi . Van Genuchten parameters (Van        tively. The model was discretized into elements 25 cm in
Genuchten, 1980) of unsaturated flow and water retention           length and 1 cm in height (Fig. 1). Similar to SNOWPACK
(i.e., α and n) were determined from SNOWPACK output               simulations used for the IOP, initial conditions were provided
using equations developed by Yamaguchi et al. (2012):              through manual snow pit observations (Webb et al., 2020,
                                                                   2018c).
          ρ −0.98
               ds                                                      The material properties that we defined to vary through
α = 4.4 106              ,                                  (1)    time were permeability, the van Genuchten m term (m =
               d
                  ρ 0.61
                      ds
                                                                   1−1/n), and the van Genuchten α term. The time-dependent
n = 1 + 2.7 10−3             .                              (2)    source/sink terms were used to simulate the melt/freeze pro-
                      d
                                                                   cesses. The melt rate of snow and refreezing of liquid wa-
The intrinsic permeability (K) of each snow layer was de-          ter, determined from SNOWPACK, were used to quantify
fined using SNOWPACK output and the equation developed             time-dependent source terms for liquid water introduction
by Calonne et al. (2012):                                          via snowmelt and as corresponding sink terms for the re-
                                                                   freezing of water. The movement of liquid water simulated
        2
                                                                   by SnowTOUGH was then compared to field observations at
K = 3.0res exp (−0.013θi ρi ) ,                             (3)    the three study plots.
                                                                       Flow rates for each simulation were calculated for a
where res is the equivalent sphere radius and ρi is the density    1 m × 1 m footprint of hillslope. Thus, longitudinal flow is
of ice.                                                            for a 1 m wide section of hillslope summed over the entire

https://doi.org/10.5194/tc-15-1423-2021                                                 The Cryosphere, 15, 1423–1434, 2021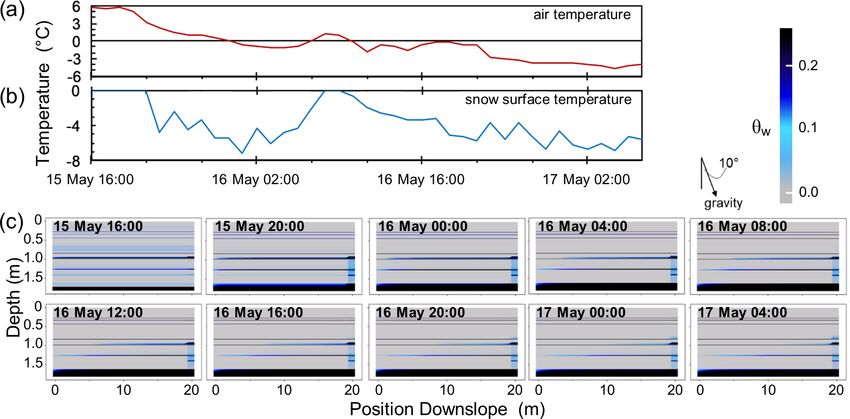
1426 R. W. Webb et al.: Two-dimensional liquid water flow
Figure 2. Results of SNOWPACK simulations of the entire water year for below-treeline (BT), near-treeline (NT), and above-treeline
(AT) study sites. Results shown are (a) snow temperature and (b) volumetric liquid water content (θw ) with the observation (obs.) and
SnowTOUGH simulation period highlighted in the dashed box. Note that the axes have different scales for each site and that these are not
used as input for the SnowTOUGH simulations but used for context in the timing of observations to seasonal processes.
depth of the snowpack, and vertical flow is for a 1 m2 area Additionally, ground-based remote sensing techniques
on the ground surface summed over the entire depth of the were used to estimate the plot-scale distribution of bulk θw
snowpack. These calculations were conducted at a location multiple times throughout each IOP for the NT and AT sites.
15 m downslope and as an average per snow profile for 10 m Snow depths derived from terrestrial lidar scanning were
upslope from this location. Bulk θw values were also calcu- collected in combination with ground penetrating radar sur-
lated for all snow profiles for this same area between 5 and veys to obtain spatially distributed dielectric properties of the
15 m downslope for SnowTOUGH simulations to compare to snowpack that were used to estimate the spatial distribution
field observations. SnowTOUGH results were analyzed for of bulk snowpack θw . For further details of these ground-
this 10 m length of hillslope to eliminate boundary effects of based remote sensing methods, see Webb et al. (2018c).
the upslope and downslope boundary conditions in analyses.
4 Results
3 Field sites
4.1 SNOWPACK
Field observations of snowpack θw , stratigraphy, and lon-
gitudinal flow paths were conducted at three locations in
SNOWPACK output shows the progression of liquid wa-
the Colorado Rocky Mountains using a combination of dye
ter development, snow layer metamorphism, and melt/freeze
tracer experiments and ground-based remote sensing. These
processes at our three sites on both the seasonal timescale
sites ranged in elevation from a north-facing BT site at
(Fig. 2) and during the IOP (Fig. 3). The timing of our ob-
2700 m a.s.l. (above sea level) in a lodgepole pine forest, a
servations was such that we captured a period early in the
south-facing NT site at 3350 m a.s.l. in a large forest clear-
melt season for each plot. Spring snowmelt, defined to be-
ing, and a southeast-facing AT site at 3500 m a.s.l. Each site
gin on the first simulated day of persistent liquid water in the
had continuous observations of snow depth and air tempera-
snowpack in the full season simulations, began on 3 March,
ture with additional meteorological stations at the AT and BT
18 March, and 4 May for the BT, NT, and AT study plots,
sites. All sites had a ground surface slope of ∼ 10◦ . For more
respectively (Fig. 2). The first day of the IOP for each plot
information on site descriptions and meteorological data, see
was 5 March, 12 April, and 15 May for the BT, NT, and AT
Webb et al. (2020, 2018c).
study plots, respectively. The BT plot was the only site that
During the IOPs, which we timed to occur near peak SWE
was not actively melting and releasing liquid water immedi-
in spring 2017, a dye tracer (Rhodamine WT) was applied at
ately prior to our IOP, while the NT site was melting for the
each of the study plots immediately prior to the first snow
longest time prior to our observations (Fig. 2a). The IOP at
pit observation. This was the time of initiation for Snow-
the AT site captured the onset of a storm and refreezing of the
TOUGH simulations. The dye tracer was subsequently al-
snow surface (Fig. 3c). Thus, these three sites and IOPs cap-
lowed to move into and through the snow undisturbed for at
tured varying stratigraphy and conditions that occur within
least 2 full days prior to a second set of snow pits being dug
any given melt season in mountainous environments.
downslope of application. These snow pits allowed us to ob-
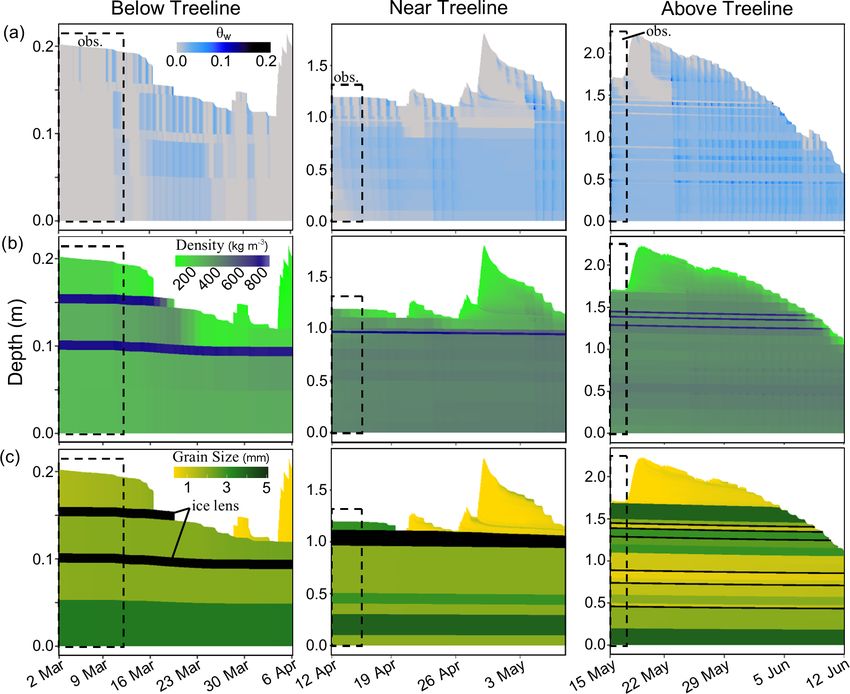
During the IOP simulations, SNOWPACK results show lit-
serve locations of longitudinal flow paths that transported the
tle metamorphism with the majority of the grain size changes
dye tracer. For further information concerning the dye tracer
occurring near the snow–atmosphere interface as a result of
experiments, see Webb et al. (2020).
surface melt (Fig. 3). All three site simulations expressed
The Cryosphere, 15, 1423–1434, 2021 https://doi.org/10.5194/tc-15-1423-2021
R. W. Webb et al.: Two-dimensional liquid water flow                                                                                 1427

Figure 3. Results of SNOWPACK simulations of the intensive observation periods (IOPs) for below-treeline (BT), near-treeline (NT), and
above-treeline (AT) study sites. Results shown are (a) volumetric liquid water content (θw ), (b) snow density, and (c) grain size with the
observation (obs.) and SnowTOUGH simulation period highlighted in the dashed box. Note that the axes have different scales for each site.

diurnal melt cycles, including the retention of liquid water            longitudinally downslope (Fig. 4). Conversely, the BT sim-
overnight. The BT simulations resulted in diurnal melt cy-              ulations simulated minimal longitudinal liquid water flow
cles that ranged from 0 to 1.1 mm h−1 . The NT simulations              (mean < 0.1 mL s−1 ), though increased water retention of
resulted in melt rates ranging from 0 to 3.9 mm h−1 , and               vertical flow in specific layers did occur as a result of the
the AT simulations resulted in melt rates ranging from 0 to             layer water retention properties. During the IOP, the mean
2.7 mm h−1 . Additionally, the NT and AT SNOWPACK sim-                  vertical flux of water at the BT site was 1.5 mL s−1 (Fig. 5).
ulations display the occurrence of hydraulic barriers that per-         This dominance of vertical flow contrasts with the simula-
sist throughout the entire melt season (Fig. 3). These results          tions of the two higher-elevation snowpacks which display
also highlight the increased stratigraphy and formation of ice          the higher occurrence of hydraulic barriers as a result of the
lenses that occur at higher elevations and impact liquid wa-            more complex stratigraphy (Figs. 3 and 4). Furthermore, soil
ter flow processes (e.g., Webb et al., 2018b). Thus, the IOP            infiltration was minimal at all three sites during the IOPs
SNOWPACK simulations resulted in three different snow-                  (Fig. 5), indicating that the majority of vertically moving liq-
pack conditions that varied in melt–freeze cycles, metamor-             uid water was either held within the pore space of a snow
phism, and snow accumulation/disappearance throughout the               layer or transported longitudinally. For all study sites, the
profiles.                                                               vertical flow of liquid water displayed negligible differences
                                                                        between locations at 5 and 15 m downslope. Conversely, lon-
4.2   SnowTOUGH                                                         gitudinally diverted flow accumulated along flow paths for
                                                                        the entire length of the hillslope (Fig. 5).
SnowTOUGH incorporated the melt/freeze processes and                       For the NT site, peak longitudinal flow rates occurred just
temporally dynamic snow layer variables into a two-                     prior to 12:00 each day local time (Fig. 5b; all times refer
dimensional plot-scale model. At the AT and NT sites, Snow-             to mountain time zone of North America). The vertical flow
TOUGH simulated the presence of multiple hydraulic barri-               of water was more variable than longitudinal flow at the NT
ers, holding vertically percolating water and transporting it           site with a mean of 9.1 mL s−1 and a standard deviation of

https://doi.org/10.5194/tc-15-1423-2021                                                        The Cryosphere, 15, 1423–1434, 2021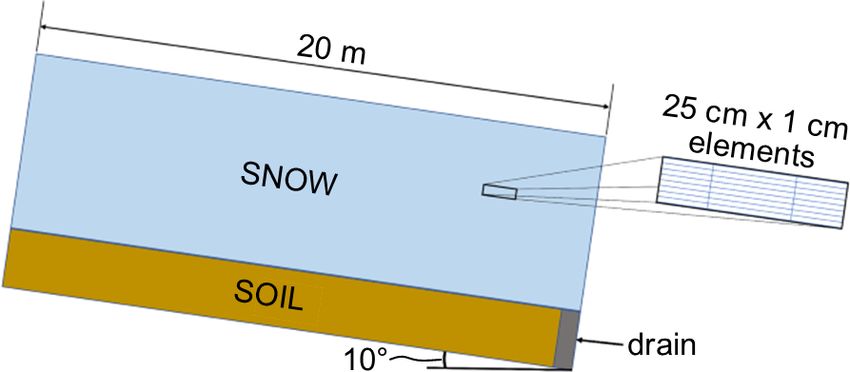
1428                                                                          R. W. Webb et al.: Two-dimensional liquid water flow

Figure 4. Results of SnowTOUGH simulations for the study sites: (a) below the treeline (BT) on 3 March at 06:00, (b) near the treeline
(NT) on 14 April at 04:00, and (c) above treeline (AT) on 15 May at 23:00. Results shown are (top) volumetric liquid water content (θw )
distribution and (bottom) liquid water flow rates in the longitudinal (i.e., parallel to ground surface) direction. The soil elements within the
model domain are shown in solid brown to focus results on intra-snowpack distributions. Dashed red boxes in the θw plots indicate the profile
of model elements used for flow rate calculations at 15 m downslope.

8.5 mL s−1 . The longitudinal flow remained relatively steady             4.3    Comparison to field data
at the 15 m downslope profile with a mean rate of 6.6 mL s−1
and a standard deviation of 1.4 mL s−1 . Infiltration into the            Comparisons of SnowTOUGH to field observations indi-
soil at the NT site showed a mean value of 0.7 mL s−1 with                cated varying results based on site and parameter of inter-
a standard deviation of 0.5 mL s−1 . Longitudinal flow at the             est. The simulated bulk θw showed little temporal variabil-
NT site occurred within a single longitudinal intra-snowpack              ity for both the NT and AT sites, while field observations
flow path near the snow–soil interface.                                   showed greater variability (Fig. 7). Simulated bulk θw re-
   The AT site had unique meteorological conditions dur-                  mained near 3 % for both the NT and AT sites throughout
ing the IOP relative to the other sites. An incoming storm                the IOPs. The average of all field observations was generally
resulted in all surface melt halting during the afternoon of              greater than simulated values, though simulated values were
15 May (Fig. 6). The snow surface temperature later warmed                always within 1 standard deviation of field observations. The
back to 0 ◦ C for a 2 h period with minimal surface melt sim-             mean of all field observations for the NT and AT sites was
ulated to occur during this brief time (1.2 mm). Though sur-              4.2 % and 3.5 %, respectively. The large standard deviations
face melt stopped, liquid water continued to flow for the en-             of field observations were largely driven by converging intra-
tirety of the simulation, predominantly in the longitudinal di-           snowpack flow paths creating areas of bulk θw as high as
rection (Figs. 5c and 6). The vertical flow of water at the AT            20 % (Webb et al., 2020). Though different, the comparison
site decreased rapidly as the storm moved in. For the entire              of θw between SnowTOUGH simulations and field obser-
IOP simulation, the AT site resulted in a mean vertical flow              vations are within the estimated error of the field methods
rate of 5.8 mL s−1 with a standard deviation of 6.6 mL s−1 .              (∼ 2 %).
At the 15 m downslope profile, the AT simulations resulted                   Dye tracer experiments compared well at the AT and BT
in a mean longitudinal flow rate of 212 mL s−1 with a stan-               sites but not the NT site (Fig. 4). The number of intra-
dard deviation of 47 mL s−1 . Soil infiltration for the AT site           snowpack flow paths shown in the SnowTOUGH simulations
showed a mean value of 0.5 mL s−1 with a standard devi-                   were similar to those shown from dye tracer experiments at
ation of 0.3 mL s−1 . SnowTOUGH simulations of the AT                     the AT (three longitudinal flow paths) and BT (no longitudi-
site resulted in three longitudinal intra-snowpack flow paths.            nal flow paths) sites presented in Webb et al. (2020), though
The simulated number of intra-snowpack longitudinal flow                  the depths of these flow paths beneath the snow surface dif-
paths for the AT and BT sites was equal to field observa-                 fered slightly. The field-observed dye tracer locations that
tions, whereas the NT site simulations did not match well                 were not simulated as longitudinal flow paths for some in-
with field-observed locations of the dye tracer during exper-             stances still display increased liquid water retention or ice
iments described in Webb et al. (2020).                                   lens formation (Fig. 6). Additionally, simulation results sug-

The Cryosphere, 15, 1423–1434, 2021                                                             https://doi.org/10.5194/tc-15-1423-2021
R. W. Webb et al.: Two-dimensional liquid water flow                                                                                       1429

Figure 5. Results of SnowTOUGH simulations over the entire intensive observations periods (IOPs) for the study sites (a) below the treeline
(BT), (b) near the treeline (NT), and (c) above the treeline (AT). Results shown are (i) the average longitudinal flow, vertical flow, and infil-
tration across the snow–soil interface per square meter area of hillslope from 5 to 15 m downslope in simulated plots and (ii) the longitudinal
flow and vertical flow rates at 15 m downslope for a 1 m2 area of hillslope.

Figure 6. Time series results of SnowTOUGH simulations for the above-treeline (AT) site showing (a) measured air temperature, (b) simu-
lated snow surface temperature, and (c) volumetric liquid water content (θw ) distribution at 4 h intervals.

gest increasing longitudinal fluxes in liquid water with eleva-            produce observed changes in liquid water content from melt
tion, which was similarly observed at these sites (Webb et al.,            rate estimates if all meltwater was diverted longitudinally and
2020). The largest discrepancy between simulations and field               collected in a single observation location. Therefore, these
observations occurred at the NT site where only one intra-                 observations are not directly comparable to SnowTOUGH
snowpack flow path was simulated using SnowTOUGH and                       simulations, but insights can still be gained from compar-
three were observed in the field at different depths beneath               isons. These field observations resulted in peak EUCA of
the snow surface (Fig. 4).                                                 6 and 17 m2 for the NT and AT sites, respectively. For the
   Comparing simulated longitudinal flow rates to field ob-                NT site, this occurred over a 2 h time period with a total of
servations is difficult because no flow rates were directly                ∼ 5 mm of melt. At this same time in the NT SnowTOUGH
measured in the field. However, locations of converging                    simulations, the location 15 m downslope resulted in an accu-
intra-snowpack flow paths were used in Webb et al. (2020) to               mulation of longitudinal flow of 28.7 mm of water (Fig. 5bii;
estimate effective upslope contributing areas (EUCAs), de-                 12 April at 12:00, mean longitudinal flow of ∼ 4 mL s−1 for
fined as the minimum upslope contributing area required to                 2 h) or roughly 5.7 times greater than the simulated melt.

https://doi.org/10.5194/tc-15-1423-2021                                                            The Cryosphere, 15, 1423–1434, 2021
1430                                                                  R. W. Webb et al.: Two-dimensional liquid water flow

Figure 7. Comparison of SnowTOUGH-simulated volumetric liquid water content (θw ) and field observations using ground-based remote
sensing for the (a) near-treeline and (b) above-treeline sites.

For the AT site, the simulated melt was ∼ 7.5 mm with a to-        stratigraphy would be difficult to characterize at this scale
tal accumulation of simulated longitudinal flow at the 15 m        without disturbing the snow at the location of the dye tracer
downslope location of 386 mm (Fig. 5cii; 16 May at 12:00,          experiment. Maintaining undisturbed conditions is essential
mean of 268 mL s−1 for 2 h) or roughly 51 times greater than       to study the natural transport of the dye. Additional stud-
the estimated contributing melt. Therefore, relative to the cal-   ies are necessary to characterize the horizontal heterogene-
culations from Webb et al. (2020), SnowTOUGH-simulated             ity of stratigraphy in varying snowpack conditions. Previous
longitudinal fluxes are similar to observations at the NT site     snow studies have suggested that the discontinuity of layers
and greater by a factor of 3 at the AT site.                       (such as ice lenses) can be a major factor in flow path conti-
                                                                   nuity (Eiriksson et al., 2013; Kattelmann and Dozier, 1999;
                                                                   McGurk and Marsh, 1995; Schneebeli, 1995; Yamaguchi et
5   Discussion                                                     al., 2018). However, previous studies of capillary barriers at
                                                                   the interface between soil layers have shown that homoge-
This is the first study, to our knowledge, that has simulated      nous layer assumptions, as those made in the present Snow-
the two-dimensional flow of liquid water through a snowpack        TOUGH simulations, capture the average of randomized het-
at the experimental plot scale. Our simulations show the pres-     erogeneous simulations (Ho and Webb, 1998). The validity
ence of hydraulic barriers that divert liquid water longitudi-     of this assumption for snow should be further studied. In gen-
nally via preferential flow paths at the two upper-elevation       eral, it is likely that the natural heterogeneity of both perme-
sites (AT and NT) that were also present in field observa-         ability and capillary barriers will decrease the amount of lon-
tions.                                                             gitudinal flow simulated in this study. Thus, SnowTOUGH
   SnowTOUGH simulations produced the greatest rates of            simulations are likely overestimating the amount of longitu-
longitudinal flow at the highest-elevation site, the AT plot,      dinal flow for specific flow paths.
similar to field observations using dye tracer experiments and        Relative to estimates of EUCA, the AT site simulations
ground-based remote sensing techniques (Webb et al., 2020).        overestimated longitudinal flow. However, it is important to
The number of longitudinal flow paths observed in the field        note that the field methods used to estimate the EUCA likely
at this site was equal to simulations. The depths of these flow    underestimate the value because it assumes all diverted liq-
paths beneath the snow surface, however, differed slightly be-     uid water remains in the snowpack at the point of calcula-
tween field observations and simulations. This is likely a re-     tion. Additionally, the low melt rates as a result of the in-
sult of SnowTOUGH simulations not accounting for snow              coming storm add uncertainty to the appropriateness of these
depth variability across the plot and natural snowpack layer       calculations using snowmelt rates. Therefore, it is likely that
heterogeneity (Leroux and Pomeroy, 2017; Marsh and Woo,            the true value of EUCA is between 17 and 51 m2 for the AT
1985; Molotch et al., 2016). At the NT plot, some of the           site. Conversely, the NT site simulations resulted in a similar
field-observed dyed flow paths were noted as dyed ice lenses       amount of longitudinal flow within the plot-scale simulations
(Webb et al., 2020) where SnowTOUGH-simulated liquid               as field-observed EUCA suggests. Considering the underesti-
water storage increased and ice lenses formed with no longi-       mation of the number of flow paths simulated at this site and
tudinal flow. This may result in a longitudinal flow path dur-     the underestimation of EUCA from field methods, as pre-
ing later melt events, though further experiments with longer      viously mentioned, the true EUCA is likely larger than the
IOPs are necessary. The natural heterogeneity of snowpack          SnowTOUGH-simulated longitudinal flow. Additionally, the

The Cryosphere, 15, 1423–1434, 2021                                                    https://doi.org/10.5194/tc-15-1423-2021
R. W. Webb et al.: Two-dimensional liquid water flow 1431 longitudinal flux for the single flow path is likely overesti- ables for snow layers have been developed at the centime- mated. We recommend the use of snow lysimeters similar to ter scale in controlled laboratory environments (Calonne et those implemented in Eiriksson et al. (2013) in future stud- al., 2012; Yamaguchi et al., 2010) and shown improvement ies to further quantify intra-snowpack longitudinal flow for for one-dimensional (vertical) models on flat terrain (e.g., comparison with the SnowTOUGH model. Wever et al., 2016, 2014). However, difficulties arise with The continued flow of liquid water after surface melt layer heterogeneity, as previously mentioned, for sloping ter- ceased at the AT site provides insights into the movement of rain, as presented in this study, and if snow grain types vary liquid water during the melt season. The flow paths contin- (Yamaguchi et al., 2012). While these variable parameteri- ued to direct liquid water longitudinally downslope 40 h after zations worked well for the BT and AT study plots to iden- surface melt ceased (Fig. 4) and was confirmed during dye tify longitudinal flow paths, the NT site simulations did not tracer collection and ground-based remote sensing observa- match field observations well, indicating the variables do not tions. The dyed flow paths still contained liquid water at the work as well when hydraulic barriers of lesser strength are time of field observations, implying that further longitudinal present (i.e., smaller differences in layer properties across flow would have likely occurred for an uncertain time and interfaces). Future studies at the plot scale may improve ef- distance. Furthermore, multiple layers retained liquid water fective parameterization of specific layer variables through that will be more readily available for transport during later the application of snowmelt lysimeters and inverse model- melt events (Fig. 6). During this time of no surface melt, lit- ing techniques. The improved parameterization of snow vari- tle vertical movement of water towards the ground surface ables for modeling liquid water flow through snow would occurred in the SnowTOUGH simulations and the dominant likely improve the modeling accuracy for hydraulic barriers flow direction was longitudinal as a result of hydraulic barri- that dominate liquid water transport during times of little or ers. The simulated longitudinal movement of water through no surface melt (Fig. 4). These hydraulic barriers cause lon- the snowpack was orders of magnitude greater than vertical gitudinal flow paths at the plot scale and control the stor- downward movement of meltwater with mean values of 212 age and release of liquid water. A logical next step for fu- and 5.8 mL s−1 , respectively (mean ratio of 75 : 1; Fig. 5cii). ture studies aiming to model this process is to develop a fully Though this ratio is likely overestimated, as previously men- coupled two-dimensional model and build upon parameter- tioned, we estimate that the order of magnitude is correct. ization of variables to determine effective properties at the This suggests that during regular diurnal melt cycles in the plot to hillslope scales and the implications for hydrological spring snowmelt season, meltwater may continue flowing modeling. downslope overnight or during cold periods, accumulating Current hydrological models do not account for longitudi- at downslope convergent locations. For the AT plot, this lo- nal intra-snowpack flow paths. Snowmelt is assumed to ver- cation is where the ground surface and snow surface slope tically percolate through the snow and infiltrate the soil at gradients decrease; this location was observed to accumulate the same location at which it originated as melt. However, liquid water in the ground-based remote sensing observations the present study indicates that longitudinal intra-snowpack (Webb et al., 2020, 2018c) which produced large variability flow (i.e., lateral flow in hydrologic modeling terms) can in snowmelt lysimeter discharge in previous years (Rikkers et be a dominant process at the plot scale. Given the higher al., 1996). This process also has implications for SWE distri- hydraulic conductivities of snow relative to common soils bution during midwinter melt events. Midwinter melt events (Calonne et al., 2012), the flow paths identified in our study may initiate flow paths that divert liquid water along longitu- may have important implications for headwater catchment dinal flow paths with no infiltration across the snow–soil in- dynamics during the snowmelt period. These processes may terface. This meltwater may flow downslope for many hours be of particular interest if models are to be used in a predic- due to the relatively slow refreezing process, accumulating tive manner for future meteorological scenarios (i.e., climate flow at convergent locations prior to refreezing. As a result, warming). the distribution of SWE may be such that increased bulk den- sity occurs at downslope locations of convergent flow paths with no obvious increase in depth and potentially a decrease 6 Conclusions in depth. For example, Webb et al. (2018a) observed a 170 % increase in SWE with a decrease in snow depth as a result of Through the soft coupling of SNOWPACK and iTOUGH2, increased liquid water content from upslope locations. we successfully simulated the two-dimensional movement The SnowTOUGH simulations bring new modeling capa- of liquid water through a layered snowpack, including snow bilities of two-dimensional liquid water flow through snow. metamorphism and melt/freeze processes, at spatial scales To date, multidimensional modeling has been limited to the previously unstudied. The simulations compared well with centimeter scale (e.g. Hirashima et al., 2017; Leroux and field data at two of the three field sites. Results show the im- Pomeroy, 2017). For simulations at the scale of meters to portance of longitudinal intra-snowpack flow paths, particu- tens of meters as presented in the current study, variable pa- larly during times when the snow surface refreezes. We show rameterization remains a challenge. Current hydraulic vari- the importance of longitudinal flow paths at the multiple- https://doi.org/10.5194/tc-15-1423-2021 The Cryosphere, 15, 1423–1434, 2021
1432                                                                       R. W. Webb et al.: Two-dimensional liquid water flow

meter scale and for temporal scales beyond regular diurnal              References
fluctuations. At the above-treeline study site, the longitudinal
flow was orders of magnitude greater than vertically down-              Avanzi, F., Petrucci, G., Matzl, M., Schneebeli, M., and De Michele,
ward percolating water with a mean ratio of 75 : 1. At the                 C.: Early formation of preferential flow in a homogeneous snow-
                                                                           pack observed by micro-CT, Water Resour. Res., 53, 3713–3729,
near-treeline site, longitudinal flow was simulated as slightly
                                                                           https://doi.org/10.1002/2016WR019502, 2017.
less than vertically downward percolating water. The below-             Bartelt, P. and Lehning, M.: A physical SNOWPACK model for
treeline simulations resulted in negligible longitudinal flow.             the Swiss avalanche warning Part I: numerical model, Cold
This study shows the increasing influence of longitudinal                  Reg. Sci. Technol., 35, 123–145, https://doi.org/10.1016/S0165-
intra-snowpack flow paths at higher elevations where a snow-               232X(02)00074-5, 2002.
pack develops a more complex and persistent stratigraphy.               Bradford, J., Harper, J., and Brown, J.: Complex dielec-
Results of this study suggest that intra-snowpack longitudi-               tric permittivity measurements from ground-penetrating
nal flow may be an important process for the consideration of              radar data to estimate snow liquid water content in
streamflow timing in snowmelt-dominated hydrographs for                    the pendular regime, Water Resour. Res., 45, W08403,
hydrologic modeling purposes.                                              https://doi.org/10.1029/2008WR007341, 2009.
                                                                        Brauchli, T., Trujillo, E., Huwald, H., and Lehning, M.: Influence of
                                                                           Slope-Scale Snowmelt on Catchment Response Simulated With
                                                                           the Alpine3D Model, Water Resour. Res., 53, 10723–10739,
Data availability. Availability of field collected data is as
                                                                           https://doi.org/10.1002/2017WR021278, 2017.
follows: lidar data are available through UNAVCO https://
                                                                        Calonne, N., Geindreau, C., Flin, F., Morin, S., Lesaffre, B., Rol-
tls.unavco.org/projects/U-060/ (Webb and Fend, 2017a, b, c,
                                                                           land du Roscoat, S., and Charrier, P.: 3-D image-based numeri-
d, e, f), and GPR data are available at http://datadryad.
                                                                           cal computations of snow permeability: links to specific surface
org (https://doi.org/10.5061/dryad.hn626p7, Webb et al., 2018e).
                                                                           area, density, and microstructural anisotropy, The Cryosphere, 6,
SNOWPACK configuration, input, and output files can be found at
                                                                           939–951, https://doi.org/10.5194/tc-6-939-2012, 2012.
https://doi.org/10.17632/9wjjvsy82p.1 (Jennings and Webb, 2021).
                                                                        Colbeck, S. C.: A Theory of Water Percolation in Snow, J. Glaciol.,
                                                                           11, 369–385, https://doi.org/10.3189/S0022143000022346,
                                                                           1972.
Author contributions. RWW conceived of the study, collected field       Dietz, A., Kuenzer, C., Gessner, U., and Dech, S.: Remote sensing
data, conducted SnowTOUGH model simulations, and analyzed                  of snow – a review of available methods, Int. J. Remote Sens.,
results. KJ conducted SNOWPACK simulations. SF modified                    33, 4094–4134, https://doi.org/10.1080/01431161.2011.640964,
TOUGH2 code and advised RWW during model simulations. SRF                  2012.
mentored RWW during study conceptualization. RWW led the writ-          Eiriksson, D., Whitson, M., Luce, C. H., Marshall, H. P., Bradford,
ing and editing of the paper with contributions from all coauthors.        J., Benner, S. G., Black, T., Hetrick, H., and McNamara, J. P.:
                                                                           An evaluation of the hydrologic relevance of lateral flow in snow
                                                                           at hillslope and catchment scales, Hydrol. Process., 27, 640–654,
Competing interests. The authors declare that they have no conflict        https://doi.org/10.1002/hyp.9666, 2013.
of interest.                                                            Finsterle, S.: Enhancements to the TOUGH2 Simulator Integrated
                                                                           in iTOUGH2, Report FGC-18-02/LBNL-7016E, Finsterle Geo-
                                                                           Consulting, Kensington, Calif., 2020.
Acknowledgements. We would like to acknowledge the contribu-            Finsterle, S., Commer, M., Edmiston, J., Jung, Y., Kowalsky,
tions of Guillaume Chambon, Nander Wever, and Hiroyuki Hi-                 M. B., Pau, G. S. H., Wainwright, H., and Zhang, Y.:
rashima for their constructive feedback that was offered for an ear-       iTOUGH2: A multiphysics simulation-optimization framework
lier version of this paper. Additionally, we would like to acknowl-        for analyzing subsurface systems, Comput. Geosci., 108, 8–20,
edge the contributions of the staff at the Niwot Ridge long-term eco-      https://doi.org/10.1016/j.cageo.2016.09.005, 2017.
logical research (LTER) site and the Boulder Creek Critical Zone        Fujimaki, H., Ando, Y., Cui, Y., and Inoue, M.: Parameter Estima-
Observatory (CZO). This work was supported by the National Sci-            tion of a Root Water Uptake Model under Salinity Stres, Vadose
ence Foundation award 1624853, the Niwot Ridge LTER cooper-                Zone J., 7, 31–38, https://doi.org/10.2136/vzj2007.0025, 2008.
ative agreement number DEB-1637686, and Boulder Creek CZO               Hannon, M. J. and Finsterle, S.: The Effect of Anisotropy on Multi-
cooperative agreement number EAR-1331828.                                  dimensional Pressure-Pulse-Decay Experiments, Transport
                                                                           Porous Med., 123, 545-5-62, https://doi.org/10.1007/s11242-
                                                                           017-0941-x, 2018.
Financial support. This research has been supported by the United       Hirashima, H., Yamaguchi, S., Sato, A., and Lehning, M.:
States National Science Foundation (grant nos. 1624853, DEB-               Numerical modelling of liquid water movement through
1637686, EAR-1331828).                                                     layered snow based on new measurements of the wa-
                                                                           ter retention curve, Cold Reg. Sci. Technol., 64, 94–103,
                                                                           https://doi.org/10.1016/j.coldregions.2010.09.003, 2010.
Review statement. This paper was edited by Guillaume Chambon            Hirashima, H., Yamaguchi, S., and Katsushima, T.: A multi-
and reviewed by Hiroyuki Hirashima and Nander Wever.                       dimensional water transport model to reproduce preferential
                                                                           flow in the snowpack, Cold Reg. Sci. Technol., 108, 80–90,
                                                                           https://doi.org/10.1016/j.coldregions.2014.09.004, 2014.

The Cryosphere, 15, 1423–1434, 2021                                                          https://doi.org/10.5194/tc-15-1423-2021
R. W. Webb et al.: Two-dimensional liquid water flow 1433 Hirashima, H., Avanzi, F., and Yamaguchi, S.: Liquid water infiltra- using infrared heaters in subalpine forests of the Southern tion into a layered snowpack: evaluation of a 3-D water transport Rocky Mountains, USA, Agr. Forest Meteorol., 203, 142–157, model with laboratory experiments, Hydrol. Earth Syst. Sci., 21, https://doi.org/10.1016/j.agrformet.2014.12.015, 2015. 5503–5515, https://doi.org/10.5194/hess-21-5503-2017, 2017. Mitterer, C., Hirashima, H., and Schweizer, J.: Wet-snow instabili- Hirashima, H., Avanzi, F., and Wever, N.: Wet-Snow Meta- ties: comparison of measured and modelled liquid water content morphism Drives the Transition From Preferential to Ma- and snow stratigraphy, Ann. Glaciol., 52, 201–208, 2011. trix Flow in Snow, Geophys. Res. Lett., 46, 14548–14557, Molotch, N. P., Barnard, D. M., Burns, S. P., and Painter, https://doi.org/10.1029/2019gl084152, 2019. T. H.: Measuring spatiotemporal variation in snow op- Ho, C. K. and Webb, S. W.: Capillary barrier performance in het- tical grain size under a subalpine forest canopy using erogeneous porous media, Water Resour. Res., 34, 603–609, contact spectroscopy, Water Resour. Res., 52, 7513–7522, https://doi.org/10.1029/98wr00217, 1998. https://doi.org/10.1002/2016WR018954, 2016. Jennings, K. and Webb, R.: SNOWPACK files Musselman, K., Lehner, F., Ikeda, K., Clark, M., Prein, A., Liu, C., for Webb et al. (2021), Mendeley Data, v1, Barlage, M., and Rasmussen, R.: Projected increases and shifts https://doi.org/10.17632/9wjjvsy82p.1, 2021. in rain-on-snow flood risk over western North America, Nat. Jennings, K. S., Kittel, T. G. F., and Molotch, N. P.: Observations Clim. Change, 8, 808, https://doi.org/10.1038/s41558-018-0236- and simulations of the seasonal evolution of snowpack cold con- 4, 2018. tent and its relation to snowmelt and the snowpack energy bud- Pruess, K., Oldenburg, C., and Moridis, G.: TOUGH2 User’s Guide, get, The Cryosphere, 12, 1595–1614, https://doi.org/10.5194/tc- Version 2.1, Report LBNL-43134, Lawrence Berkeley National 12-1595-2018, 2018. Laboratory, Berkeley, CA, 2012. Kattelmann, R.: Macropores in Snowpacks of Sierra-Nevada, Ann. Richards, L. A.: Capillary conduction of liquids through porous Glaciol., 6, 272–273, 1985. mediums, Physics, 1, 318–333, 1931. Kattelmann, R. and Dozier, J.: Observations of snowpack ripening Rikkers, M., Williams, M. W., and Sommerfeld, R. A.: Spatial vari- in the Sierra Nevada, California, USA, J. Glaciol., 45, 409–416, ance of snowmelt at a continental alpine site Western Snow Con- 1999. ference, 64th Annual Meeting, Bend, Oregon, 23–31, 1996. Kechavarzi, C., Soga, K., Illangasekare, T., and Nikolopou- Schneebeli, M.: Development and stability of preferential flow los, P.: Laboratory Study of Immiscible Contaminant Flow paths in a layered snowpack, Biogeochemistry of Seasonally in Unsaturated Layered Sands, Vadose Zone J., 7, 1–9, Snow-Covered Catchments, Boulder, CO, IAHS Publication No. https://doi.org/10.2136/vzj2006.0177, 2008. 228, IAHS Press, Wallingford, Oxfordshire, UK, 89–95, 1995. Lehning, M., Bartelt, P., Brown, B., Fierz, C., and Satyawali, P.: A Techel, F. and Pielmeier, C.: Point observations of liquid water con- physical SNOWPACK model for the Swiss avalanche warning: tent in wet snow – investigating methodical, spatial and temporal Part II. Snow microstructure, Cold Reg. Sci. Technol., 35, 147– aspects, The Cryosphere, 5, 405–418, https://doi.org/10.5194/tc- 167, 2002. 5-405-2011, 2011. Leroux, N. R. and Pomeroy, J. W.: Modelling capillary hys- Van Genuchten, M. T.: A closed-form equation for predicting the teresis effects on preferential flow through melting and hydraulic conductivity of unsaturated soils, Soil Sci. Soc. Am. cold layered snowpacks, Adv. Water Resour., 107, 250–264, J., 44, 892–898, 1980. https://doi.org/10.1016/j.advwatres.2017.06.024, 2017. Webb, R. W. and Fend, M.: Snowpack Water Flow – Niwot Ridge Lippmann, M. J. and Bodavarsson, G. S.: Numerical stud- Above Treeline TLS U-060 PS01 SV03, available at: https: ies of the heat and mass transport in the Cerro Prieto //tls.unavco.org/projects/U-060/PS01/SV03 (last access: March Geothermal Field, Mexico, Water Resour. Res., 19, 753–767, 2019), https://doi.org/10.7283/r3d10v, 2017a. https://doi.org/10.1029/WR019i003p00753, 1983. Webb, R. W. and Fend, M.: Snowpack Water Flow – Niwot Ridge Liu, F., Williams, M. W., and Caine, N.: Source waters Above Treeline TLS U-060 PS01 SV01, available at: https: and flow paths in an alpine catchment, Colorado Front //tls.unavco.org/projects/U-060/PS01/SV01 (last access: March Range, United States, Water Resour. Res., 40, W09401, 2019), https://doi.org/10.7283/r3v678, 2017b. https://doi.org/10.1029/2004wr003076, 2004. Webb, R. W. and Fend, M.: Snowpack Water Flow – Niwot Ridge Lundy, C., Brown, R., Adams, E., Birkeland, K., and Lehn- Near Treeline TLS U-060 PS02 SV01, available at: https:// ing, M.: A statistical validation of the snowpack model in tls.unavco.org/projects/U-060/PS02/SV01/ (last access: March a Montana climate, Cold Reg. Sci. Technol., 33, 237–246, 2019), https://doi.org/10.7283/r31t24, 2017c. https://doi.org/10.1016/S0165-232X(01)00038-6, 2001. Webb, R. W. and Fend, M.: Snowpack Water Flow – Niwot Ridge Marsh, P.: Grain growth in a wet arctic snow cover, Cold Reg. Sci. Near Treeline TLS U-060 PS02 SV03, available at: https:// Technol., 14, 23–31, 1987. tls.unavco.org/projects/U-060/PS02/SV03/ (last access: March Marsh, P. and Woo, M.-K.: Meltwater movement in natural hetero- 2019), https://doi.org/10.7283/r34h4q, 2017d. geneous snow covers, Water Resour. Res., 21, 1710–1716, 1985. Webb, R. W. and Fend, M.: Snowpack Water Flow – Upper Gordon McGurk, B. J. and Marsh, P.: Flow-finger continuity in serial thick- Gulch North Facing TLS U-060 PS03 SV03, available at: https: sections in melting Sierran snowpack, Biogeochemistry of Sea- //tls.unavco.org/projects/U-060/PS03/SV03/ (last access: March sonally Snow-Covered Catchments, Boulder, CO, IAHS Publica- 2019), https://doi.org/10.7283/r30t1f, 2017e. tion No. 228. IAHS Press, Wallingford, Oxfordshire, UK, 81–88, Webb, R. W. and Fend, M.: Snowpack Water Flow – Upper Gordon 1995. Gulch North Facing TLS U-060 PS03 SV01, available at: https: Meromy, L., Molotch, N. P., Williams, M. W., Musselman, //tls.unavco.org/projects/U-060/PS03/SV01/ (last access: March K. N., and Kueppers, L. M.: Snowpack-climate manipulation 2019), https://doi.org/10.7283/r39996z, 2017f. https://doi.org/10.5194/tc-15-1423-2021 The Cryosphere, 15, 1423–1434, 2021
1434                                                                     R. W. Webb et al.: Two-dimensional liquid water flow

Webb, R. W., Fassnacht, S. R., and Gooseff, M. N.: Hydrologic         Wever, N., Würzer, S., Fierz, C., and Lehning, M.: Simulat-
  flow path development varies by aspect during spring snowmelt         ing ice layer formation under the presence of preferential
  in complex subalpine terrain, The Cryosphere, 12, 287–300,            flow in layered snowpacks, The Cryosphere, 10, 2731–2744,
  https://doi.org/10.5194/tc-12-287-2018, 2018a.                        https://doi.org/10.5194/tc-10-2731-2016, 2016.
Webb, R. W., Fassnacht, S. R., Gooseff, M. N., and Webb,              Williams, M. W., Erickson, T. A., and Petrzelka, J. L.: Visual-
  S. W.: The Presence of Hydraulic Barriers in Layered                  izing meltwater flow through snow at the centimetre-to-metre
  Snowpacks: TOUGH2 Simulations and Estimated Di-                       scale using a snow guillotine, Hydrol. Process., 24, 2098–2110,
  version Lengths, Transport Porous Med., 123, 457–476,                 https://doi.org/10.1002/hyp.7630, 2010.
  https://doi.org/10.1007/s11242-018-1079-1, 2018b.                   Würzer, S., Jonas, T., Wever, N., and Lehning, M.: Influence
Webb, R. W., Jennings, K., Fend, M., and Molotch, N.: Combin-           of Initial Snowpack Properties on Runoff Formation dur-
  ing Ground Penetrating Radar with Terrestrial LiDAR Scanning          ing Rain-on-Snow Events, J. Hydrometeorol., 17, 1801–1815,
  to Estimate the Spatial Distribution of Liquid Water Content          https://doi.org/10.1175/JHM-D-15-0181.1, 2016.
  in Seasonal Snowpacks, Water Resour. Res., 54, 10339–10349,         Würzer, S., Wever, N., Juras, R., Lehning, M., and Jonas, T.: Mod-
  https://doi.org/10.1029/2018WR022680, 2018c.                          elling liquid water transport in snow under rain-on-snow condi-
Webb, R. W., Williams, M. W., and Erickson, T. A.: The Spatial          tions – considering preferential flow, Hydrol. Earth Syst. Sci., 21,
  and Temporal Variability of Meltwater Flow Paths: Insights From       1741–1756, https://doi.org/10.5194/hess-21-1741-2017, 2017.
  a Grid of Over 100 Snow Lysimeters, Water Resour. Res., 54,         Yamaguchi, S., Katsushima, T., Sato, A., and Ku-
  1146–1160, https://doi.org/10.1002/2017WR020866, 2018d.               makura, T.: Water retention curve of snow with dif-
Webb, R. W., Jennings, K. S., Fend, M., and Molotch, N. P.:             ferent grain sizes, Cold Reg. Sci. Technol., 64, 87–93,
  Data from: Combining ground-penetrating radar with terres-            https://doi.org/10.1016/j.coldregions.2010.05.008, 2010.
  trial LiDAR scanning to estimate the spatial distribution of        Yamaguchi, S., Watanabe, K., Katsushima, T., Sato, A., and
  liquid water content in seasonal snowpacks, Dryad, Dataset,           Kumakura, T.: Dependence of the water retention curve
  https://doi.org/10.5061/dryad.hn626p7, 2018e.                         of snow on snow characteristics, Ann. Glaciol., 53, 6–12,
Webb, R. W., Wigmore, O., Jennings, K., Fend, M., and Molotch, N.       https://doi.org/10.3189/2012AoG61A001, 2012.
  P.: Hydrologic connectivity at the hillslope scale through intra-   Yamaguchi, S., Hirashima, H., and Ishii, Y.: Year-to-year changes in
  snowpack flow paths during snowmelt, Hydrol. Process., 34,            preferential flow development in a seasonal snowpack and their
  1616–1629, https://doi.org/10.1002/hyp.13686, 2020.                   dependence on snowpack conditions, Cold Reg. Sci. Technol.,
Wever, N., Fierz, C., Mitterer, C., Hirashima, H., and Lehning, M.:     149, 95–105, https://doi.org/10.1016/j.coldregions.2018.02.009,
  Solving Richards Equation for snow improves snowpack melt-            2018.
  water runoff estimations in detailed multi-layer snowpack model,
  The Cryosphere, 8, 257–274, https://doi.org/10.5194/tc-8-257-
  2014, 2014.

The Cryosphere, 15, 1423–1434, 2021                                                        https://doi.org/10.5194/tc-15-1423-2021
You can also read