Trace Metal Speciation in Fresh and Brackish Waters Using Ultrafiltration, DGT and Transplanted Aquatic Moss
←
→
Page content transcription
If your browser does not render page correctly, please read the page content below
2005:77
LICENTIATE T H E S I S
Trace Metal Speciation in Fresh and
Brackish Waters Using Ultrafiltration,
DGT and Transplanted Aquatic Moss
Jerry Forsberg
Luleå University of Technology
Department of Chemical Engineering and Geosciences
Division of Applied Geology
2005:77|: -1757|: -lic -- 05⁄77 -- Trace Metal Speciation in Fresh and Brackish Waters Using
Ultrafiltration, DGT and Transplanted Aquatic Moss
Jerry Forsberg
Division of Applied Geology
Department of Chemical Engineering and Geosciences
Luleå University of Technology
SE-971 87 Luleå, Sweden
Luleå 2005Abstract
Distribution, mobility and toxicity of metals in natural waters are strongly related to their aqueous
speciation. To understand the behaviour of an aqueous element and the transformation between
chemical species, there is a need for reliable methods that enable measurements of specific fractions
of metals.
Ultrafiltration has frequently been used to study speciation of metals in natural waters. Several
disadvantages are, however, associated with ultrafiltration. The procedure is complicated, time
consuming and implies sampling and storage of water which may result in a change in metal
speciation. A possible alternative or complement to ultrafiltration is the technique of diffusive
gradients in thin films (DGT), which provides an in situ measurement of labile metal species. DGT
accumulates metals in a time-integrated way and produces a mean concentration over the chosen
deployment period.
The relatively common occurrence of aquatic mosses and their ability to accumulate metals have
led to an extensive use of moss as bioindicators in monitoring of aquatic environments. For waters
where no native species can be used as bioindicator, transplant techniques have been developed.
The aim of this study was to investigate differences and similarities between the trace metal
speciation methods, DGT, 1 kDa ultrafiltration, 0.22 μm membrane filtration and transplanted
aquatic moss, and to examine their dependence on water geochemistry.
Two studies have been conducted and included in this work. In 2003 and 2004, DGT and 1 kDa
ultrafiltration were simultaneously applied at two sampling stations in the Baltic Sea with different
salinity and total trace metal concentrations. A total of 16 samplings were performed at the two
sites. In 2004 and 2005, DGT, 1 kDa ultrafiltration and aquatic moss were simultaneously applied
in the small freshwater stream Gråbergsbäcken in northern Sweden together with a standard 0.22
μm membrane filtration. The sampling was conducted 10 times over a whole icefree period.
In the Baltic Sea concentrations of Mn, Zn and Cd measured by DGT were similar to the
concentrations measured in 1 kDa ultrafiltered samples, especially for Mn. For Cu and Ni, the
ultrafiltered concentrations clearly exceeded the DGT-labile concentrations. This indicates the
existence of low molecular weight Cu and Ni species, small enough to pass through the 1 kDa
ultrafilter but not labile enough to be retained in the DGT units.
In Gråbergsbäcken, it was shown that 0.22 μm membrane filtration, 1 kDa ultrafiltration and DGT
generally measure different metal fractions, wherePreface
This thesis consists of the following papers.
I. Forsberg J., Dahlqvist R., Gelting-Nyström J., Ingri J. (2005). Trace Metal Speciation in
Brackish Water Using DGT and Ultrafiltration: Comparison of Techniques. (Submitted to
Environmental Science and Technology)
II. Forsberg J., Ingri J., Öhlander B. (2005) Speciation of Trace Metals in a Freshwater
Stream Using Membrane Filtration, Ultrafiltration, DGT and Transplanted Aquatic Moss.
(Manuscript)
The following paper has also been written. It is, however, not included in my licentiate thesis.
Widerlund A., Shcherbakova E., Forsberg J., Holmström H., Öhlander B. 2004. Laboratory
Simulation of Flocculation Processes in a Flooded Tailings Impoundment at the Kristineberg
Zn-Cu Mine, Northern Sweden. Applied Geochemistry 19 1537-1551.Contents
Abstract
Preface
Introduction 1
Site descriptions 2
Methods and experimental procedure 3
Diffusive gradient in thin films (DGT) 3
Ultrafiltration 6
Membrane filtration 8
Aquatic moss 8
Field work 8
Analysis 9
Main results and conclusions 9
Acknowledgements 11
References 11
Paper I
Paper IIIntroduction Distribution, mobility and bioavailability of metals in natural waters are strongly related to their aqueous speciation and to the chemical and physical processes they participate in. Environmental changes in a water strongly influence the form in which a metal exists and thus the potential toxicity of the element. For example, if pH decreases in a water, a transformation of non-toxic aluminosilicates and organic Al-complexes into free ionic or inorganic toxic Al may occur, causing, in extreme cases, substantial fish-kills. To understand the behaviour of an aqueous element and the transformation between chemical forms, there is a need for reliable methods that enable measurements of specific fractions of metals. Aquatic metal species are mainly divided in to three groups: particles, colloids and soluble forms. These groups can be further divided in to several sub-groups based on both size and chemical form. A wide range of definitions of the different groups can be found in the literature, which reflects the complexity of speciation. Approximate size ranges of the three groups have been presented (1,2). In practice, an operational definition is usually applied depending on the speciation techniques used. In this study, a size definition, based on the methods used, is applied in general; Particles: >0.22 μm, colloids: 0.22 μm – 1 kDa, soluble forms:
In 2004 and 2005, DGT, 1 kDa ultrafiltration and aquatic moss were applied at the same time
in a small freshwater stream in northern Sweden together with a standard 0.22 μm membrane
filtration. The sampling was conducted 10 times over a whole icefree period. A close comparison
of the techniques was achieved regarding trace metal speciation in fresh water, and the ability
to characterize the distribution of metal species by a simultaneous deployment of the methods
was investigated. The possible capability of DGT to measure the bioavailable fraction of metals
was explored and the use of DGT as a substitute for ultrafiltration, addressed in ppI, was further
evaluated. This work is presented in ppII.

Site descriptions

In ppI, two sampling stations in the Baltic Sea were chosen, with different salinity and total trace
metal concentrations. Ekhagen Bay is situated in the inner parts of the Stockholm archipelago,
and Landsort is situated 40 km off the Swedish coast in the open Baltic Sea (Figure 1). Ekhagen
is mainly characterized by low-salinity estuarine water, substantially influenced by freshwater
discharge. The trace metal concentration is higher than in the open Baltic Sea and the mean salinity
during the sampling period was 3.3 ‰. The sampling point Landsort is situated in open waters,
away from any major rivers. Trace metal concentrations are low and the mean salinity was 6.3 ‰
during sampling.

                                                 Ekhagen

                                                   Stockholm

                            Luleå
                                       a

                                                         Landsort
                                 ic Se

                    Stockholm
                                Balt

                   Figure 1. Sampling sites in the Baltic Sea, Ekhagen and Landsort (ppI).

                                                     2
The sampling in ppII was performed in the small stream Gråbergsbäcken draining the tailings
area of the abandoned Cu mine Laver in northern Sweden (Figure 2). The sampling point is situated
downstream a clarification pond and a mire area. The trace metal geochemistry of the water is
mainly characterized by elevated concentrations of Cu and Zn (22). The aquatic moss used in
Gråbergsbäcken was collected in the small brook Riskölbäcken approximately 60 km from the
Laver mine site. This is a non-polluted water running through a forest area. Metal concentrations in
moss from Riskölbäcken were low during the sampling period.
70°N
L
ul
Pite
älv
eä
lv
L AVE R Luleå
Piteå 67°N
0 50 100 km
N
64°N
E
D
61°N
E
W
Stockholm
58°N
S
12°E 20°E 28°E 36°E
Figure 2. Location of the Laver Cu-mine (ppII).
Methods and experimental procedure
Diffusive gradients in thin films (DGT)
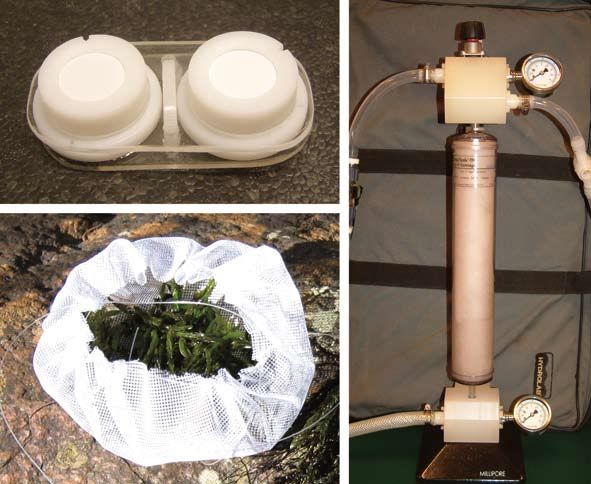
A DGT device consists of a binding gel followed by an ion permeable hydrogel and a protective
membrane filter in contact with solution (Figure 3). When the device is immersed in water, ions
in solution pass through the membrane filter and the diffusive layer and accumulate on the binding
agent, immobilized in the binding gel. This process establishes a linear concentration gradient in
the hydrogel (Figure 4). The flux, J, of ions through the gel can then be explained by Fick’s first law of
diffusion where D is the diffusion coefficient and dC/dx is the concentration gradient (Equation 1).
dC
J =D (1)
dx
Since ions are rapidly immobilized in the binding gel, the concentration of ions in the interface
between binding gel and hydrogel can be expected to be effectively zero, as long as the binding
agent is unsaturated. This assumption implies that dC is equal to the ion concentration in the bulk
solution C. If the diffusive boundary layer is negligibly small, Equation 1 can be expressed as
follows:
3C (2)
J =D
Δg
The flux can also be explained with the mass accumulated in the binding layer, M, the exposed area
of the diffusive gel, A, and the deployment time, t (Equation 3).
M
J= (3)
At
Equations 2 and 3 provides an expression of the concentration in the bulk solution explained by the
accumulated mass in the resin, deployment time, and known values of 6g, A and D (Equation 4).
MΔg
C= (4)
DAt
To measure the mass of accumulated ions, the resin gel is eluted with a known volume, Ve, of
solution (1M HNO3 in this study). The concentration of ions in the eluent, Ce, is then analytically
measured. All metals bound in the resin gel cannot be eluted and the ratio of eluted to bound metal
is called the elution factor, fe. The accumulated mass of ions in the resin can be calculated from
Equation 5 where Vg is the volume of the resin gel.
C e (V g + Ve )
M = (5)
fe
The diffusion coefficient, D, in the gel is dependent on the composition of the diffusion layer and
on temperature. Hydrogels based on acrylamide can have a wide range of pore sizes depending
on the proportion of cross-linker used, which determines the diffusion coefficient. Correction
for temperature can be made using the Stoke-Einstein relationship, which links the temperature
dependence to viscosity (23).
A
B 20 mm
C
C
Membrane filter
$g Diffusive gel
Binding gel
Figure 3. Assembly (A) and cross sections (B, C) of a DGT device.
4$g D
Diffusive gel C
Concentration
Resin gel
DBL
Distance
Figure 4. Schematic view of a DGT device in contact with solution, showing the steady state concentration gradient.
C = bulk metal concentration, 6g = thickness of the diffusive gel, b = thickness of the diffusive boundary layer (DBL).
Several types of hydrogels with different diffusive properties can be used in the DGT as diffusive
layer. Most commonly used are polyacrylamide hydrogels with different types and proportions of
cross-linker (24). Most commonly used is the APA-gel, an open pore gel with a pore size >5 nm.
The CGa-gel is a restricted gel with a pore size 5 nm (used in this work) permits
free metal ions, inorganic metal complexes and small organic metal complexes to diffuse, while
particles and large colloids are excluded (23,24). Since complexes must dissociate in the hydrogel
to be measured, only complexes with sufficient dissociation rate will be retained in the resin (23).
The time available for this dissociation is roughly the time taken for a metal to diffuse through the
diffusive gel which, is determined by the gel thickness. Generally, DGT measures species able to
dissociate within 1 min. Consequently, only labile metal complexes are measured, while less labile
and inert species will be discriminated.
5When using DGT some limitations must be taken into consideration. If the ionic strength in
the water is below ~10-4 M, irregular results can be expected. This problem has been addressed
in previous studies (29-31). The pH is another factor limiting the DGT method. In the pH 5-10
interval, DGT can be expected to work according to theory (32). If the pH decreases to pH 4-5,
hydrogen ions start to compete with metal ions for the sites on the resin which results in erroneous
measurements. At a pH above 10 the structure of the diffusive gel may change and affect the DGT
response. To prevent a diffusive boundary layer (DBL) from forming, sufficient water movement
must be ensured. A flow velocity above 0.02 m s-1 was reported as a minimum limit (32).
Ultrafiltration
Ultrafiltration techniques have frequently been used to study fractionation of elements in aquatic
environments (3,4). The ultrafiltration method used in this work and addressed in further text,
is a tangential flow filtration technique (TFF) (Figure 5). In a TFF process, the water sample is
recirculated parallel to the filter membrane at a high flow rate. This enables colloids and particles to
remain in suspension and prevents fouling and clogging of the filter. A hydrostatic pressure drives
components smaller than the membrane pore size through the filter. Constituents larger than the
membrane pore size will be recycled in the process and retained in the retentate reservoir.
TFF
filter
Pump
Feed Retentate Permeate
Figure 5. Schematic set up of the ultrafiltration.
The following terminology and parameters are used regarding ultrafiltration:
- Permeate: The solution which passes the filter membrane during ultrafiltration.
- Retentate: The solution in which compounds discriminated by the filter membrane are retained.
- CF: Concentration factor. The factor by which colloids and particles are concentrated in the
retentate, i.e., the ratio between the total water volume and the retentate volume after the process
has been completed. CF is calculated from:
6{( permeate volume) + (retentate volume)}
CF = (6)
retentate volume
- CFR: Cross flow ratio. Retentate flow divided by permeate flow.
- Recovery: The concentration of a certain element in permeate and retentate as percent of the
concentration in the feed (Equation 7).
⎛ {( permeate conc.) + (retentate conc.)} ⎞
Recovery = ⎜⎜ ⎟⎟ × 100 (7)
⎝ feed conc. ⎠
The TFF ultrafiltration system used in ppI and ppII was a MilliPore Prep/Scale system. Prep/Scale
Spiral Wound TFF-6 modules were used with manufacturer-specified cutoffs of 1 and 10 kDa. For
both modules, the filter membrane area was 0.54 m2 and the filter material was regenerated cellulose.
The filters were used alone and in combination and with different pre-filtration procedures at the
different sampling sites (Figure 6). Operational settings for the different procedures are presented
in ppI and ppII. The retentate volume was kept constant at ~4 l during the filtration process and
was circulated for approximately 10 min, with the permeate line closed, at the end of the process.
Pre-filtered water was sampled prior to ultrafiltration and permeate and retentate were sampled
from the bulk solutions after completed ultrafiltration. Before every new sampling occasion and
after every filtration, the filters were rinsed with MilliQ water and solutions of NaOH and HCl,
according to a procedure described by Ingri et al. (33).
Retentate Retentate
EKHAGEN >10 kDa >1 kDa
< 0.22 m < 10 kDa
Permeate Permeate
Sea water 0.22 m 10 kDa 1 kDa
< 0.22 m < 10 kDa < 1 kDa
Membrane Ultra filter Ultra filter
filter
Retentate
>1 kDa
LANDSORT < 0.22 m
Permeate
Sea water 0.22 m 1 kDa
< 0.22 m < 1 kDa
Membrane Ultra filter
filter
Retentate
< 70m
LAVER > 1kDa
Stream Permeate
water 70 m 1 kDa
< 70m < 1 kDa
Prefiltration Ultra filter
Figure 6. Flow schemes for the ultrafiltration procedures in Ekhagen (A), Landsort (B) and Laver (C).
7It is important to use correct and consistent operational parameters when ultrafiltration is
performed. Larsson et al. (5) propose a concentration factor (CF) >10 and a cross flow ratio (CFR)
of at least 15 for reliable results. A CF between 10 and 15 was also suggested by Wilding et al.
(34).
A pore size of 1 kDa equals approximately 2 nm. It should be noted that the pores of a filter with
manufacturer-specified cutoff of 1 kDa range between ~0.7 and ~1.3 kDa (34), and also that the
cutoff in Daltons is a nominal value, and that the real cutoff depends on the structure and chemical
composition of the present metal species (5). Studies have shown that a manufacturer-defined
cutoff of 1 kDa corresponds to a real cutoff of 2.1 – 2.5 kDa (5,34). It can be expected that a 1 kDa
permeate, in addition to free metal ions, will contain different forms of small colloids.
Membrane filtration
0.22 μm membrane filtration was used in ppI as a laboratory-based pre-filtration preceding the
ultrafiltration and as an independent speciation method used directly in field in ppII. Nitrocellulose
Millipore filters were used mounted in a 142 mm Geotech polycarbonate filter holder. Water was
brought to the filter holder using plastic polyamide tubing connected to a peristaltic pump. The
permeate was collected in acid-washed 125 ml plastic bottles and stored at 4°C before analysis.
Prior to use, filters were acid-cleaned in 5% acetic acid for at least 3 days and thereafter thoroughly
rinsed in MilliQ water. Blanks were collected for analysis. The filter holder and tubing were acid-
cleaned before every sampling in 5% HNO3 for approximately 48 h and then rinsed in MilliQ
water.
Aquatic moss
Aquatic moss accumulates metals in a time-integrated way and reaches an equilibrium related to
the metal concentration in the surrounding water (35). The uptake of metals can be divided into
two main phases based on the cellular compartment in which the metal accumulates; extracellular
followed by intracellular uptake (36). Extracellular uptake is dominated by exchange adsorption to
the cell walls. This is a rapid uptake (minutes to a few hours) and the metals are readily exchangeable
if the concentration levels in the water change. The intracellular uptake is a slow accumulation
(hours to several weeks) within the cell, and the metal concentrations in this compartment are not as
greatly affected by a change in the surrounding water concentrations. Retention of particulate metal
or precipitation of metal oxides to the surface of the plant may also contribute to the measured
concentrations (37). If metal concentrations in the water decrease, the moss re-equilibrates to the
new levels. This release rate is, however, slower than the uptake rate (35). The accumulation in
the moss is affected by several factors including temperature, light intensity and physicochemical
water parameters.
The aquatic moss Fontinalis Antipyretica L. ex Hedw. was used in the work of ppII. Shoots from
the moss were collected from an unpolluted reference brook and transported to the study site for
exposure. After 14-22 days the moss bags were retrieved. Before analysis, a preparation procedure
similar to the one used by Say et al. (17) was performed.
Field work
In Ekhagen, sampling was performed from a 40m-long wooden pier. Three replicate DGT devices
were deployed for approximately 2 weeks in 6 deployment periods between April 2 and June 2
82003. The units were suspended with plastic rope from a buoy to 4m depth. A StowAway TidbiT
temperature logger was connected to the DGT device to record temperatures every second hour
during the deployment. On six occasions between March 18 and June 2 2003, usually at the start
and end of the DGT deployments, water was collected at the sampling site for membrane filtration
and ultrafiltration in laboratory. Unfiltered water samples for direct analysis were also collected at
the sampling point.
In Landsort, all sampling was conducted from the research ship M/S Fyrbyggaren. DGT units were
deployed in duplicate, 10 times, for 2 to 4 weeks, over the period March 10 to September 9, 2004.
At 5m depth, the DGT units were attached to a rope suspended from a buoy and stretched out with
a plastic-covered weight. As in Ekhagen, temperature loggers were attached to the DGT devices.
On 13 occasions between March 10 and September 9, 2004, water was collected at Landsort for
filtration and unprocessed samples. Filtration with 0.22 μm membrane filter was performed onboard
the ship. The 1 kDa ultrafiltration was conducted in laboratory within 24h after sampling.
Sampling in Gråbergsbäcken was performed 7 times between June16 and November 3, 2004
and 3 times between May 18 and June 29, 2005. 0.22 μm membrane filtration was conducted on
every sampling occasion. Water was collected for ultrafiltration in laboratory. Two DGT devices
and two moss bags were deployed every sampling occasion and left in the water until the next
time of sampling. The deployment periods were between 14 and 22 days. The DGT units and moss
bags were attached to a plastic rope anchored to the bottom and stretched to the surface by a buoy.
A StowAway TidbiT temperature logger was connected to the rope to record temperatures every
second hour during the deployment. Reference moss samples were collected in Riskölbäcken for
direct analysis. Water for DOC analysis was filtered through a 0.8 μm Whatman glass microfibre
filter mounted in a steel filter holder. Conductivity and pH were monitored during sampling with
a Hydrolab MiniSonde. The water flow was measured by timing a small bottle, filled with water,
floating with the stream a known distance (10m) in a part of the stream with known cross-section
area.
Analysis
DGT resin gels were eluted in 5 ml of 10% HNO3 (suprapur). DGT eluents, 0.22 μm filtrate and
permeate and retentate from the ultrafiltration were analysed by Inductively Coupled Plasma –
Sector Field Mass Spectrometry (ICP-SFMS) or Inductively Coupled Plasma – Atomic Emission
Spectroscopy (ICP-AES). For analysis of particulate Cd, Co, Cu, Mn, Ni and Zn, the 0.22 μm
membrane filters were digested in a microwave oven with HNO3 and H2O2 in closed Teflon
containers and analysed with ICP-SFMS. For particulate Fe and Al, the filters were placed in Pt
crucibles, digested in a regular oven at 1000°C and analysed with ICP-AES. Moss samples were
dried at 105°C and digested in a microwave oven with HNO3 and H2O2 in closed Teflon containers.
The digests were analysed with ICP-AES or ICP-SFMS. The DOC samples were analysed by high-
temperature combustion using a Shimadzu TOC-5000.
Main results and conclusions
In Ekhagen and Landsort (ppI), concentrations of Mn, Zn and Cd measured by DGT were similar
to the concentrations measured in 1 kDa ultrafiltered samples, especially for Mn. The generally
good agreement between the two techniques is likely due to the fact that these metals rarely form
organic complexes. For Cu and Ni, the ultrafiltered concentrations clearly exceeded the DGT-labile
concentrations. This indicates the existence of low molecular weight Cu and Ni species, small
enough to pass through the 1 kDa ultrafilter but not labile enough to be retained in the DGT units.
9Fe measured in ultrafiltered water was in the same concentration range as DGT-labile Fe, but did not follow the same temporal pattern. As an alternative to 1 kDa ultrafiltration, DGT can be used for measurement of labile Mn, Zn and Cd in the Baltic Sea. Fe concentrations were low and analysis of ultrafiltered permeate were often below or close to detection limits. DGT, with its accumulating capacity, may be a favourable alternative for measurements of labile Fe The comparison of DGT and ultrafiltration in the Baltic Sea shows that both methods have strengths and weaknesses. Fouling of the diffusive window is one of the drawbacks for DGT, especially during long-term exposures, and the effect has not yet been elucidated. DGT measures a time- integrated average concentration, while the ultrafiltrated concentrations are based on single grab samples. The ultrafiltered concentrations may therefore not be representative for a longer period of time. On the other hand, if the results are supposed to be compared to unfiltered grab samples or membrane filtrates, the ultrafiltration might render a more direct comparison than DGT. A change in metal speciation between sampling and filtration is a problem of importance for ultrafiltration. This is not a problem with an in situ method like DGT. The time and money saving factor using DGT is important, especially when sampling is conducted over prolonged periods. In waters with very low metal concentrations, where analysis of ultrafiltration permeate results in values below detection limits, DGT is useful because of the pre-concentration capability. In Gråbergsbäcken (ppII), significant correlations were found for all metals except Fe between concentrations in
Acknowledgements

First of all, I would like to thank my supervisor, Professor Johan Ingri, for guidance and support
during this work. I am also grateful for support from Professor Björn Öhlander, especially regarding
the study in Laver. Furthermore, I thank Johan Gelting-Nyström for all his help during fieldwork,
Dr. Ralf Dahlqvist for producing DGT devices, Rickard Hernell (Analytica AB) for preparing
DGT-gels for analysis, and Kaj Lax (SGU) for introducing me to the aquatic moss technique.
Financial support from the Swedish research council, Norrbotten research council, SGU, Analytica
AB and Luleå University of Technology is gratefully acknowledged. Finally, I thank Milan Vnuk
for drafting all figures in this thesis and all other staff at the Division of Applied Geology for advice
and constructive discussions.

References

(1)    Florence, T. M.; Batley, G. E. Crit. Rev. Anal. Chem. 1980, 9, 219.

(2)    Noller, B. N. Chem. Australia 1992, 59, 403.

(3)    Guo, L.; Santschi, P. H.; Warnken, K. W. Mar. Chem. 2000, 70, 257.

(4)    Dahlqvist, R.; Benedetti, M. F.; Andersson, K.; Turner, D.; Larsson, T.; Stolpe, B.;
       Ingri, J. Geochim. Cosmochim. Acta 2004, 68, 4059.

(5)    Larsson, J.; Gustafsson, Ö.; Ingri, J. Environ. Sci. Technol. 2002, 36, 2236.

(6)    Buffle, J.; Leppard, G. G. Environ. Sci. Technol. 1995, 29, 2169.

(7)    Buffle, J.; Leppard, G. G. Environ. Sci. Technol. 1995, 29, 2176.

(8)    Laxen, D. P. H.; Chandler, M. I. Anal. Chem. 1982, 54, 1350.

(9)    Dunn, R. J. K.; Teasdale, P. R.; Warnken, J.; Schleich, R. R. Environ. Sci. Technol.
       2003, 37, 2794.

(10)   Davison, W.; Zhang, H. Nature 1994, 367, 546.

(11)   Denney, S.; Sherwood, J.; Leyden, J. Sci. Total Environ. 1999, 239, 71.

(12)   Munksgaard, N. C.; Parry, D. L. J. Environ. Monit. 2003, 5, 145.

(13)   Twiss, M. R.; Moffett, J. W. Environ. Sci. Technol. 2002, 36, 1061.

(14)   Odzak, N.; Kistler, D.; Xue, H.; Sigg, L. Aquat. Sci. 2002, 64, 292.

(15)   Meylan, S.; Odsak, N.; Behra, R.; Sigg, L. Anal. Chim. Acta 2004, 510, 91.

(16)   Gimpel, J.; Zhang, H.; Davison, W.; Edwards, A. C. Environ. Sci. Technol. 2003,
       37, 138.

                                                  11
(17) Say, P. J.; Harding, J. P. C.; Whitton, B. A. Environ. Pollut. Ser B 1981, 2, 295.
(18) Mouvet, C. Verh. Int. Ver. Limnol. 1985, 22, 2420.
(19) Mouvet, C. Environ. Technol. Lett. 1984, 5, 541.
(20) Bruns, I.; Friese, K.; Markert, B.; Krauss, G. J. Sci. Total Environ. 1997, 204, 161.
(21) Rasmussen, G.; Andersen, S. Water Air Soil Pollut. 1999, 109, 41.
(22) Ljungberg, J.; Ohlander, B. J. Geochem. Explor. 2001, 74, 57.
(23) Zhang, H.; Davison, W. Anal. Chem. 1995, 67, 3391.
(24) Zhang, H.; Davison, W. Anal. Chim. Acta 1999, 398, 329.
(25) Zhang, H.; Davison, W.; Gadi, R.; Kobayashi, T. Anal. Chim. Acta 1998, 370, 29.
(26) Teasdale, P. R.; Hayward, S.; Davison, W. Anal. Chim. Acta 1999, 71, 2186.
(27) Dahlqvist, R.; Zhang, H.; Ingri, J.; Davison, W. Anal. Chim. Acta 2002, 460, 247.
(28) DGT Research Ltd. Practical guide for using DGT for metals in waters;
http://www.dgtresearch.com (accessed August 2005).
(29) Alfaro-De la Torre, M. C.; Beaulieu, P.-Y.; Tessier, A. Anal. Chim. Acta 2000, 418,
53.
(30) Sangi, M. R.; Halstead, M. J.; Hunter, K. A. Anal. Chim. Acta 2002, 456, 241.
(31) Peters, A. J.; Zhang, H.; Davison, W. Anal. Chim. Acta 2003, 478, 237.
(32) Gimpel, J.; Zhang, H.; Hutchinson, W.; Davison, W. Anal. Chim. Acta 2001, 448,
93.
(33) Ingri, J.; Widerlund, A.; Land, M.; Gustafsson, Ö.; Andersson, P.; Öhlander, B.
Chem. Geol. 2000, 166, 23.
(34) Wilding, A.; Liu, R.; Zhou, J. L. J. Colloid Interface Sci. 2004, 280, 102.
(35) Bengtsson, Å.; Lithner, G. Swedish Environmental Protection Agency report No.
1391, 1981.
(36) Brown, D. H.; Beckett, R. P. Ann. Bot. 1985, 55, 179.
(37) Figueira, R.; Ribeiro, T. Environ. Pollut. 2005, 136, 293.
12I
Trace Metal Speciation in Brackish Water
Using DGT and Ultrafiltration:
Comparison of Techniques
Jerry Forsberg, Ralf Dahlqvist, Johan Gelting-Nyström and Johan IngriTrace Metal Speciation in Brackish Water Using DGT and Ultrafiltration:
Comparison of Techniques
Jerry Forsberg*, 1, Ralf Dahlqvist2, 3, Johan Gelting-Nyström1 and Johan Ingri1
1
Division of Applied Geology, Luleå University of Technology, 971 87 Luleå, Sweden
2
Department of Geology and Geochemistry, Stockholm University, 106 91 Stockholm, Sweden
3
Laboratory for Isotope Geology, Swedish Museum of Natural History, Box 50007, 104 05 Stockholm, Sweden
* Corresponding author. Tel: +46 920 491931. Fax: +46 920 91399. E-mail: jerry.forsberg@ltu.se
Abstract
Diffusive gradients in thin films (DGT) and ultrafiltration technique were used to measure trace
metal concentrations in the Baltic Sea. The results provide the first comparison of these two
fundamentally different speciation methods for trace metals. Cd, Cu, Fe, Mn, Ni and Zn were
measured at two sites with different total trace metal concentrations. Piston-type DGT units prepared
with APA-gel as diffusive layer and Chelex 100 resin (Na-form, 200-400 mesh) as binding agent
were used throughout the study. The ultrafiltration was performed with Millipore Prep/Scale Spiral
Wound TFF-6 modules with manufacturer-specified cutoffs of 1 and 10 kDa. Filter material was
regenerated cellulose. Concentration levels of Mn, Zn, Cd and, to some extent, Fe measured by
DGT agreed with the concentrations measured in 1 kDa ultrafiltered samples. In contrast, for Cu
and Ni the ultrafiltered concentrations exceeded the DGT-labile concentrations. This indicates the
existence of low molecular weight Cu and Ni species, small enough to pass through the 1 kDa
ultrafilter but not labile enough to be measured by the DGT units. The ability of DGT to pre-
concentrate metals was found to be an analytical advantage compared with ultrafiltration. DGT
appears to be a good alternative to 1 kDa ultrafiltration for measurement of truly dissolved Mn, Cd,
Zn and Fe in the Baltic Sea.
1Introduction has been used for trace metal speciation in
natural waters (e.g., 15,16) and provides an in
Distribution, mobility and toxicity of metals situ measurement of labile metal species, which
in natural waters are strongly related to prevents problems with speciation changes
their aqueous speciation (1). The biological associated with sampling and storage. DGT
response of an organism depends not simply accumulates metals in proportion to time and
on total concentrations but on the activities produces a mean concentration over the chosen
of the metal ions and their complexes, and on deployment period. The pre-concentration
the concentration of labile metal species in ability is an important quality in waters with
solution (2,3). To understand the behaviour extremely low dissolved metal concentrations.
of an aqueous element and the transformation DGT is also a cheap, time-saving and easy-
between chemical forms there is a need for to-use method. In several studies, DGT has
reliable methods that enable measurements of been compared to other speciation methods in
specific fractions of metals. different types of natural waters. It has been used
Ultrafiltration has frequently been used to together with membrane filtration in estuarine
study speciation of metals in natural waters waters (13) and compared to competitive
(e.g., 4,5). In a recent study Ingri et al. (6) used ligand exchange followed by voltammetric
cross-flow ultrafiltration technique to determine measurements regarding speciation of Cu in
the size distribution of trace metals and organic coastal marine waters (CLE-ACSV) (17),
carbon in the Baltic Sea. Various evaluations of Cu and Zn in stream water (CLE-DPASV or
ultrafiltration techniques have been performed CLE-DPCSV) (18) and speciation of Cu, Zn,
(7,8). Two cross-flow ultrafiltration systems Ni, Cd, Pb and Mn in eutrophic lake water
were optimized by Larsson et al. (9) for Baltic (CLE-DPCSV) (16). DGT has also been used
Sea surface waters. Some disadvantages in conjunction with dialysis to study speciation
are however associated with ultrafiltration. of trace metals in lake water (19).
The procedure is complicated and demands The aim of this study was to compare in
a rigorous handling protocol for satisfying situ DGT measurements of trace metals with
results. The laboratory-based filtration process concentrations measured in 1 kDa ultrafiltered
implies sampling and storage of water which water. Both techniques were simultaneously
may trigger aggregation and oxidation of applied at two sampling points in the Baltic
metals and result in a change in metal speciation Sea with different salinity and total trace metal
(10,11). Laxen and Chandler (12) found a concentrations (Table 1). Ekhagen is a low-
change in metal speciation in water stored for salinity coastal bay in the vicinity of Stockholm
more than 2h between sampling and filtration. and the second point was Landsort, 40 km
Since ultrafiltration is based on grab samples, off the Swedish coast in the open Baltic Sea.
extensive sampling is necessary if correct Sampling was performed in Ekhagen 6 times
average concentrations or temporal variations in 2003, and 10 times in 2004 in Landsort.
are to be measured (13), particularly in dynamic Sampling periods include the plankton bloom
waters like coastal or estuarine waters where when concentrations of especially dissolved Fe
metal concentrations may fluctuate extensively. reach very low levels. This study provides the
If sampling frequency is low, the measurements first comparison of these two fundamentally
may represent a temporary increase or decrease different techniques for speciation of trace
in concentration level instead of the average metals. It is also the first study of DGT
metal concentration. Ultrafiltration is, in performance in brackish seawater.
addition to above mentioned drawbacks, an
expensive and time-consuming procedure.
A possible alternative or complement to Experimental Methods
ultrafiltration is the emerging technique
of diffusive gradients in thin films (DGT) Diffusive gradients in thin films (DGT).
introduced by Davison and Zhang (14). DGT Standard piston-type DGT units (20) were used
2Table 1. Mean values of salinity (‰) and total metal concentrations at Ekhagen and Landsort during sampling
periods, n=6 for Ekhagen, n=13 for Landsort. Concentrations in mg l-1 for Ca, Mg, K, Na and S, and in g l-1 for Fe,
Cd, Cu, Mn, Ni and Zn
Salinity Ca Mg K Na S Fe Cd Cu Mn Ni Zn
Ekhagen 3.3 51.4 110 33.5 896 79.5 32.9 0.0251 2.11 12.3 1.93 3.41
Landsort 6.3 92 223 70.8 1847 161 1.65 0.0209 0.55 1.68 0.69 0.382
throughout this study. The units were prepared In Ekhagen the mean amount and the standard
as described previously (21) with an APA-gel deviations of the blanks (n = 5) for each element
(15% acrylamide, 0.3% patented agarose- were (in ng per disc): 3.87 ± 1.46 for Zn, 1.17
derived cross-linker) as a diffusive layer, a ± 0.77 for Cu, 6.78 ± 0.76 for Fe, 0.35 ± 0.22
Chelex 100 resin (Na-form, 200-400 mesh) as for Mn and 0.12 ± 0.06 for Ni. The percentage
a binding agent and a 0.22 m cellulose nitrate masses of metal in the blanks compared to the
membrane filter as a protective outer layer. amount accumulated in the field devices were
Calculations were performed as explained 2% for Zn, 3% for Cu, 8% for Fe and less than
elsewhere (20). With Fick’s first law of diffusion 1% for Mn and Ni. Measured masses in blanks
and known diffusion coefficient of metal ions from Landsort (n=10) were (in ng per disc): 4.65
within the diffusive gel, the concentration of ± 2.44 for Zn, 1.51 ± 0.71 for Cu, 0.73 ± 0.37
metal in the bulk waters can be determined for Mn, 0.42 ± 0.30 for Ni and 0.028 ± 0.028
from the measured mass of metal accumulated for Cd. The percentage masses of metal in the
in the resin according to Equation 1. blanks compared to the amount accumulated in
the field devices were 10% for Zn, 9% for Cu,
M Δg 2% for Cd and 1% for Mn and Ni. The masses
C= (1)
DAt of trace metals in these control blanks were
used to correct the masses extracted from the
C is the concentration of metal in solution, M
devices deployed in the field.
the mass of metal accumulated in the resin,
¨g the thickness of hydrogel and membrane
Ultrafiltration. The ultrafiltration system used
filter, D the diffusion coefficient of the metal
in this study was a MilliPore Prep/Scale system.
ion within the gel, A the exposure area and t
Two Prep/Scale Spiral Wound TFF-6 modules
the deployment time. Diffusion coefficients
were used with manufacturer-specified cutoffs
provided by DGT Research Ltd. (22) were used
of 1 and 10 kDa. For both modules the filter
for the average water temperatures calculated
membrane area was 0.54 m2 and the filter
from in situ temperature measurements every
material was regenerated cellulose. A Watson
second hour during the deployment periods.
Marlow peristaltic base-plate pump was
The hydrogel thicknesses were 0.75 ± 0.02 mm
connected to the system.
at Ekhagen and 0.77 ± 0.02 mm at Landsort.
The sampled water in Ekhagen was pre-
Membrane filter thickness was 0.13 mm for all
filtered through a 0.22 m membrane filter
DGT units and exposed diffusion area was 3.14
before ultrafiltration, starting with the 10 kDa
cm2. The elution factor was assumed to be 0.8
filter. During the filtration, the permeate (10 kDa) was
diffusive boundary layer (DBL) was assumed
retained in the retentate. The collected permeate
to be negligible.
(kDa retentate. At Landsort, permeate from the On six occasions between March 18 and
0.22 m membrane filter was directly filtrated June 2 2003, usually at the start and end of
through the 1 kDa Prep/Scale module. Samples the DGT deployments, water was collected at
were collected for analysis from 0.22 m and 1 the sampling site for membrane filtration and
kDa permeate and from 1 kDa retentate. ultrafiltration in laboratory. A Flow jet pump
Concentration factors (CF) in Ekhagen were was used to collect approximately 25 l of water
between 16 and 24 for the 10 kDa filter, and from 4m depth in an acid-cleaned polyethene
between 11 and 14 for the 1 kDa filter. Cross- (PE) container. The water was immediately
flow ratios (CFR) (retentate flow: permeate transported to the laboratory were the filtering
flow) were >20 for the 10 kDa filter and >80 process began within 2h. Unfiltered water
for the 1 kDa filter. At Landsort, concentration samples for direct analysis were also collected
factors were between 16 and 22 and cross-flow at the sampling point.
ratios >60 for the 1 kDa filter. CF and CFR Landsort. All sampling was conducted from
were calculated as described previously (23). the research ship M/S Fyrbyggaren. DGT
Mean recoveries for each metal are presented units were deployed in duplicate, 10 times,
in Table 2. for 2 to 4 weeks, over the period March 10
Before every new sampling occasion and to September 9 2004. At 5m depth, the DGT
after every filtration the filters were rinsed with units were attached to a rope suspended from
MilliQ water and solutions of NaOH and HCl, a buoy and stretched out with a plastic-covered
according to a procedure described by Ingri et weight. The buoy was connected to another
al. (23). rope anchored at the bottom. As in Ekhagen,
temperature loggers were attached to the DGT
devices. The recovered DGT units were, as in
Table 2. Mean recoveries for ultrafiltration.
Ekhagen, rinsed with MilliQ water and placed
Ekhagen (n=6), Landsort (n=13)
in plastic bags. On every sampling occasion two
Fe Mn Ni Cu Zn Cd DGT units were assembled but not immersed
Ekhagen in the water column. These units were used as
(10 kDa) 78 88 90 88 89 - blanks.
Ekhagen On 13 occasions between March 10 and
(1 kDa) 76 91 74 81 66 - September 9 2004 water was collected at
Landsort Landsort for filtration and unprocessed
(1 kDa) - 96 73 94 73 78 samples. Water was sampled from 5m depth
in an acid-cleaned polyethene (PE) container
using a Masterflex peristaltic pump. The
Field work. Ekhagen. The sampling was tubing used to collect water was attached to
done from a 40m-long wooden pier in the a flagpole which was mounted to the stem of
Ekhagen Bay. Three replicate DGT devices the ship. The water was therefore sampled
were deployed for approximately 2 weeks in 6 approximately 10 meters in front of the ship
deployment periods between April 2 and June during slow steaming to avoid contamination
2 2003. The units were suspended with plastic derived from the hull. Filtration with 0.22 m
rope from a buoy to 4m depth. A StowAway membrane filter was performed on board the
TidbiT temperature logger was connected to ship immediately after sampling. The 1 kDa
the DGT device to record temperatures every ultrafiltration was conducted in laboratory
second hour during the deployment. The within 24h after sampling.
recovered DGT units were thoroughly rinsed
with MilliQ water on the deployment site and Analysis. After exposure and transport to
then placed in clean, airtight plastic bags. On laboratory, the DGT devices were disassembled
every deployment occasion 1-3 DGT units and the resin gels were eluted in 5 ml of 10%
were chosen as control blanks. These devices HNO3 (suprapur). DGT eluents, unfiltered
were not deployed in the water column. samples, 0.22 m membrane filtrate and
4permeate and retentate from the ultrafiltration instrumental deviation for ultrafiltered results
were analysed by Inductively Coupled Plasma and the standard deviation of replicate devices,
- Mass Spectrometry (ICP-MS). simultaneously deployed, for DGT.
Concentrations of Cd are not shown in the
results from Ekhagen because almost all values
Results and Discussion were below the detection limit for ICP-MS.
In Landsort, no Fe concentrations are shown,
Measurement definition. Before the results since blank values in the DGT devices were
are presented it is important to emphasize the unreasonably high (~70%) in proportion to
basic differences between the measurement measured concentrations.
techniques. DGT measures a flux which is
calculated into an average concentration over Mn, Zn, Cd. Concentrations of Mn, Zn and
the deployment period and the discrimination Cd measured by DGT were similar to the
of metal species in the gel is based on size concentrations measured in 1 kDa ultrafiltered
and lability. A gel pore size of approximately samples, especially for Mn (Figures 1-2). The
5 nm permits free metal ions, inorganic metal generally good agreement between the two
complexes and small organic metal complexes techniques is likely due to the weak tendency
to diffuse, while particles and large colloids are of these metals to form organic complexes. Mn
excluded (20, 24). Since the complexes must seems to exist predominantly in particulate
dissociate in the hydrogel to be measured, only fractions or in truly dissolved species in
Ekhagen (6). Munksgaard and Parry (15) found
complexes with sufficient dissociation rate will
that almost 100% of the dissolved Cd is labile
be retained in the resin (20). Kinetically inert
in estuarine waters. The agreement between the
species are excluded.
two techniques is not as evident for Zn as for
The ultrafiltration is performed in laboratory
Mn and Cd. Studies have shown that Zn can be
and based on a grab sampling approach. The
strongly bound in small non-labile complexes
discrimination of metal species by ultrafiltration
(16). The measured concentrations of Zn in
is based on size. A pore size of 1 kDa equals
ultrafiltered water from Landsort were close
approximately 2 nm. It should be noted that the to the detection limit for some samples, which
pores of a filter with manufacturer-specified must be taken into consideration.
cutoff of 1 kDa range between ~0.7 and ~1.3
kDa (7) and also that the cutoff, in daltons, is a Cu, Ni. For Cu and Ni the ultrafiltered
nominal value and that the real cutoff depends concentrations clearly exceeded the DGT-labile
on the structure and chemical composition of concentrations (Figures 1 and 2). This indicates
the present metal species (9). Studies with CFF the existence of low molecular weight Cu and
ultrafilters have shown that a manufacturer- Ni species, small enough to pass through the
defined cutoff of 1 kDa corresponds to a real 1 kDa ultrafilter but not labile enough to be
cutoff of 2.1 – 2.5 kDa (7,9). Since a major part retained in the DGT units. As much as 50%
of seawater colloids are just above 1 kDa in of the Cu in seawater may be kinetically inert
size (25) it can be expected that the 1 kDa CFF (26). A substantial complexation by organic
permeate, besides free metal ions, will contain substances has been found for Cu and Ni in
different forms of complexes and colloids. The seawater (17,27-29). Ingri et al. (6) found
ultrafiltration will, unlike DGT, not discriminate that 35% of the NiFe. Fe measured in ultrafiltered water was in the DGT-labile concentration. Light biofouling has
same concentration range as DGT-labile Fe, but been seen for some of the DGT-units at Ekhagen,
did not follow the same temporal pattern (Figure which also would result in an underestimation
1). In waters with physicochemical conditions of the DGT-labile concentration. In this study
like Ekhagen, Fe can be expected to exist we have assumed no influence of biofouling
predominantly in colloids and particles (31). In and a negligible DBL and might therefore be
addition, sampling was done during the bloom, presenting underestimates of the DGT-labile
when uptake by plankton of bioavailable Fe is metal levels. Since only one diffusive layer
expected. This ends up in very low measurable thickness was used, no DBL could be calculated.
concentrations close to the detection limit, Webb and Keough (32) found a substantial
especially in ultrafiltered samples, which must effect of biofouling on DGT performance, while
be considered when interpreting the results. another study found no impact on the operation
of DGT through fouling with suspended
DBL and Biofouling. For all metals at Ekhagen, particulate matter (15).
except for Fe, concentrations measured in
ultrafiltered samples were higher compared General assessment. Both methods have
with DGT-labile concentrations. Unlike the strengths and weaknesses. Biofouling,
Landsort samples, this is seen even for Mn and mentioned above, is one of the drawbacks
Zn in Ekhagen. This could be explained by the for DGT, especially during long-term
presence of a diffusive boundary layer (DBL) on exposures. DGT measures a time-integrated
the surface of the diffusive windows. The DBL average concentration, while the ultrafiltrated
would increase the thickness of the diffusive concentrations are based on a single grab sample.
layer and result in an underestimation of the The ultrafiltered concentrations can therefore
16 25
Cu Ni
12 20
Conc (nM)
Conc (nM)
8 15
4 10
0 5
10-Mar 30-Mar 19-Apr 09-May 29-May 18-Jun 10-Mar 30-Mar 19-Apr 09-May 29-May 18-Jun
240 70
Mn Zn
200 60
160 50
Conc (nM)
Conc (nM)
120 40
80 30
40 20
0 10
10-Mar 30-Mar 19-Apr 09-May 29-May 18-Jun 10-Mar 30-Mar 19-Apr 09-May 29-May 18-Jun
40
DGT Ultra filtration
35 Fe
30
Conc (nM)
25
20
15
10
5
0
10-Mar 30-Mar 19-Apr 09-May 29-May 18-Jun
Figure 1. Concentrations of Mn, Zn, Cu, Ni and Fe in Ekhagen measured by DGT and ultrafiltration.
68 10
7 Cu 9
Ni
6
8
Conc (nM)
5
Conc (nM)
7
4
6
3
5
2
1 4
0 3
23-Feb 13-Apr 02-Jun 22-Jul 10-Sep 23-Feb 13-Apr 02-Jun 22-Jul 10-Sep
80 12
70
Mn Zn
10
60
Conc (nM) 8
Conc (nM)
50
40 6
30
4
20
10 2
0 0
23-Feb 13-Apr 02-Jun 22-Jul 10-Sep 23-Feb 13-Apr 02-Jun 22-Jul 10-Sep
0.18
Cd DGT Ultra filtration
0.16
0.14
Conc (nM)
0.12
0.10
0.08
0.06
0.04
23-Feb 13-Apr 02-Jun 22-Jul 10-Sep
Figure 2. Concentrations of Mn, Zn, Cu, Ni and Cd in Landsort measured by DGT and ultrafiltration.
be non-representative for a period of time. As an alternative to 1 kDa ultrafiltration, DGT
On the other hand, if the results are supposed can be used for measurement of labile Mn, Zn and
to be compared to unfiltered grab samples or Cd in the Baltic Sea. Fe concentrations were low
membrane filtrates, the ultrafiltration might and analysis of ultrafiltered permeate often were
render a more direct comparison. A comparison below or close to detection limits. Problems with
with DGT demands a composite sample high levels of Fe in the blank DGT units in relation
comprised of several grab samples collected to deployed units can be prevented by increasing
during the DGT deployment period. This the deployment time. DGT, with its accumulating
was addressed in a study by Dunn et al. (13). capacity, may be a favourable alternative for
The importance of speciation change during measurements of labile Fe.
transport and storage has been shown in earlier
work (12,19) and a change in metal speciation,
during the time between sampling and filtration, Acknowledgements
cannot be ruled out for water collected for
ultrafiltration in this study. The time and This research has been carried out with financial
money saving factor using DGT is important, support from the Swedish Research Council,
especially when sampling are conducted over the Norrbotten Research Council, Analytica
prolonged time periods. In waters with very AB and the Geological Survey of Sweden
low metal concentrations, where analysis of (SGU). We thank the crew of M/S Fyrbyggaren
ultrafiltration permeate results in values below and the Stockholm Marine Research Center
detection limits, DGT is useful because of the (Leif Lundgren) for support in field, and the
pre-concentration capability. Institute of Applied Environmental Research,
7Stockholm University (Örjan Gustafsson) for (13) Dunn, R. J. K.; Teasdale, P. R.;Warnkel,
letting us use their facilities. J.; Schleich, R. R. Environ. Sci. Technol.
2003, 37, 794
Literature Cited (14) Davison, W.; Zhang, H. Nature 1994,
367, 546.
(1) Ure, A. M.; Davidson, C. M. In Chemical
speciation in the environment; Ure, A. (15) Munksgaard, N. C.; Parry, D. L. J.
M., Davidson, C. M., Eds.; Blackie Environ. Monit. 2003, 5, 145.
Academic & Professional: London, 1995,
p 1-5. (16) Odzak, N.; Kistler, D.; Xue, H.; Sigg, L.
Aquat. Sci. 2002, 64, 292.
(2) Morel, F. M. M.; Hering, J. G. Principles
and Applications of Aquatic Chemistry; (17) Twiss, M. R.; Moffett, J. W. Environ.
Wiley: New York, 1993. Sci. Technol. 2002, 36, 1061.
(3) Hudson, R. J. M.; Morel, F. M. M. Limnol. (18) Meylan, S.; Odsak, N.; Behra, R.; Sigg,
Oceanogr. 1990, 35(5), 1002-1020. L. Anal. Chim. Acta 2004, 510, 91.
(4) Guo, L.; Santschi, P. H.; Warnken, K. W. (19) Gimpel, J.; Zhang, H.; Davison, W.;
Mar. Chem. 2000, 70, 257. Edwards, A. C. Environ. Sci. Technol.
2003, 37, 138.
(5) Dahlqvist R.; Benedetti, M. F.;Andersson,
K.; Turner, D.; Larsson, T.; Stolpe, B.; (20) Zhang, H.; Davison, W. Anal. Chem.
Ingri, J. Geochim. Cosmochim. Acta 1995, 67, 3391.
2004, 68, 4059.
(21) Dahlqvist, R.; Zhang, H.; Ingri, J.;
(6) Ingri, J.; Nordling, S.; Larsson, J.; Davison, W. Anal. Chim. Acta 2002, 460,
Ronnegard, J,: Nilsson, N.; Raduschkin, 247.
I.; Dahlqvist, R.; Andersson, P.;
Gustavsson, O. Mar. Chem. 2004, 91, (22) DGT Research Ltd. Practical guide for
117. using DGT for metals in waters; http:/
www.dgtresearch.com (accessed August
(7) Wilding, A.; Liu, R.; Zhou, J. L. J. 2005)
Colloid Interface Sci. 2004, 280, 102.
(23) Ingri,J.; Widerlund, A.; Land, M.;
(8) Gueguen, C.; Belin, C.; Dominik, J. Gustafsson, Ö.; Andersson, P.; Öhlander,
Water Res. 2002, 36, 1677. B. Chem Geol. 2000, 166, 23.
(9) Larsson, J.; Gustafsson, Ö.; Ingri, J. (24) Zhang, H.; Davison, W. Anal. Chim. Acta
Environ. Sci. Technol. 2002, 36, 2236. 1999, 398, 329.
(10) Buffle, J.; Leppard, G. G. Environ. Sci. (25) Guo, L.; Santschi, P. H. Mar. Chem. 1997,
Technol. 1995, 29, 2169. 59, 1.
(11) Buffle, J.; Leppard, G. G. Environ. Sci. (26) Bruland, K. W.; Rue, E. L.; Donat, J. R.;
Technol. 1995, 29, 2176. Skrabal, S. A.; Moffett, J. W. Anal. Chim.
Acta 2000, 405, 99.
(12) Laxen, D. P. H.; Chandler, M. I. Anal.
Chem. 1982, 54, 1350. (27) Achterberg, E. P.; Van Den Berg, C. M.
G. Deep-Sea Res. II 1997, 44, 693.
8(28) Martino, M.; Turner, A.; Nimmo, M. Mar.
Chem. 2004, 88, 161.
(29) Muller, F. L. L.; Gulin, S. B.; Kalvoy, A.
Mar. Chem. 2001, 76, 233.
(30) Zhang, H.; Davison, W. Anal. Chem.
2000, 72, 4447.
(31) Langmuir, D. Aqueous environmental
geochemistry; Prentice Hall: Upper
Saddle River, N.J., 1997.
(32) Webb, J. A.; Keough, M. J. Mar. Pollut.
Bull. 2002, 44, 222.
9II
Speciation of Trace Metals in a Freshwater Stream
Using Membrane Filtration, Ultrafiltration,
DGT and Transplanted Aquatic Moss
Jerry Forsberg, Johan Ingri and Björn ÖhlanderSpeciation of Trace Metals in a Freshwater Stream Using Membrane
Filtration, Ultrafiltration, DGT and Transplanted Aquatic Moss
Jerry Forsberg*, Johan Ingri and Björn Öhlander
Division of Applied Geology, Luleå University of Technology, 971 87 Luleå, Sweden
* Corresponding author. Tel: +46 920 491931. Fax: +46 920 91399. E-mail: jerry.forsberg@ltu.se
Abstract
Four metal speciation techniques; DGT, 1 kDa ultrafiltration, 0.22 m membrane filtration and
aquatic moss, were simultaneously applied in a small freshwater stream in northern Sweden to
investigate differences and similarities between the methods regarding trace metal speciation and
how they depend on geochemical water properties. Piston-type DGT units prepared with APA-
gel as diffusive layer and Chelex 100 resin (Na-form) as binding agent were used throughout
the study. The ultrafiltration was performed with a Millipore Prep/Scale Spiral Wound TFF-6
module with a manufacturer-specified cutoff of 1 kDa. The membrane filters used were Millipore
nitrocellulose filters with a diameter of 142 mm and a pore size of 0.22 m. The aquatic moss
Fontinalis Antipyretica L. ex Hedw. was used in this study. Shoots from the moss were collected
in a non-polluted brook with a native moss population, and transported to the sampling site for
exposure. It was shown that 0.22 m membrane filtration, 1 kDa ultrafiltration and DGT generally
measured different metal fractions whereIntroduction The in situ measurement prevents problems
with speciation changes associated with
Knowledge of aqueous metal speciation is sampling and storage and DGT is also cheap,
essential to studies of metal toxicity and time-saving and easy to use.
mobility. The bioavailability of metals depends The relatively common occurrence of aquatic
not simply on total concentrations but on the bryophytes and their ability to accumulate
activities of the metal ions and their complexes, metals have led to an extensive use of
and on the concentration of labile metal species bryophytes as bioindicators in monitoring of
in solution (1,2). Therefore, there is a need for aquatic environments (19,20). For waters where
reliable methods that enable measurements no native species can be used as bioindicator,
of specific fractions of metals in aqueous transplant techniques have been developed
environments. (21). The aquatic moss Fontinalis Antipyretica
Ultrafiltration has frequently been used to is one of the most commonly used species
study speciation of metals in natural waters (e.g., for transplant purposes and has been widely
3,4), and various evaluations of ultrafiltration used in monitoring of metals in fresh waters
techniques have been performed (5,6). Some (22,23). A comparison of metal uptake in moss
disadvantages are, however, associated with and the metal speciation in the ambient water is
ultrafiltration. The procedure is complicated interesting for evaluating the relation between
and demands a rigorous handling protocol metal concentrations in moss and water.
for satisfying results. The laboratory-based The aim of this study was to investigate
filtration process implies sampling and storage differences and similarities between four
of water, which may trigger aggregation and trace metal speciation methods; DGT, 1 kDa
oxidation of metals and result in a change in ultrafiltration, 0.22 m membrane filtration and
metal speciation (7-9). Since ultrafiltration is transplanted aquatic moss, and to examine their
based on grab samples, extensive sampling is dependence on water geochemistry. The ability
necessary if correct temporal variations are to characterize the distribution of metal species
to be measured (10). A very time-consuming by a simultaneous deployment of the methods
procedure and relatively expensive materials was investigated, and the possible capability
are additional drawbacks. of DGT to measure the bioavailable fraction
Diffusive gradients in thin films (DGT), of metals was explored. DGT as a possible
introduced by Davison and Zhang (11), has alternative to ultrafiltration is also evaluated.
been used for trace metal speciation in natural The techniques were simultaneously applied in
waters (e.g., 12,13) and provides an in situ a small freshwater stream in northern Sweden
measurement of labile metal species (14). The with relatively high trace metal concentrations.
method has been proposed as a possible method The sampling was conducted 10 times over a
to measure the bioavailable fraction in aquatic whole ice-free period.
systems (10,13). DGT accumulates metals
in proportion to time and produces a mean
concentration over the chosen deployment Methods and materials
period. In several studies, DGT has been
compared to other speciation methods. It has Study area. The study was performed in the
been used together with membrane filtration small stream Gråbergsbäcken draining the
in estuarine waters (10) and compared to tailings area of the abandoned Cu mine Laver in
membrane filtration together with competitive northern Sweden (Figure 1). The sampling point
ligand exchange followed by voltammetric is situated downstream a clarification pond and
measurements (15-17). DGT has also been a mire area. The trace metal geochemistry in
used in conjunction with dialysis to study the water is mainly characterized by elevated
speciation of trace metals in lake water (18). concentrations of Cu and Zn (24).
The method has emerged as an interesting The aquatic moss used in Gråbergsbäcken
alternative or complement to ultrafiltration. was collected in the small brook Riskölbäcken
2You can also read


