Experimental evaluation of oxygen isotopic exchange between inclusion water and host calcite in speleothems - Climate of the Past
←
→
Page content transcription
If your browser does not render page correctly, please read the page content below

Clim. Past, 16, 17–27, 2020
https://doi.org/10.5194/cp-16-17-2020
© Author(s) 2020. This work is distributed under
the Creative Commons Attribution 4.0 License.

Experimental evaluation of oxygen isotopic exchange between
inclusion water and host calcite in speleothems
Ryu Uemura1 , Yudai Kina2 , Chuan-Chou Shen3,4,5 , and Kanako Omine2
1 Graduate School of Environmental Studies, Nagoya University, Furo-cho, Chikusa-ku, Nagoya, 464-8601, Japan
2 Department  of Chemistry, Biology, and Marine Science, Faculty of Science, University of the Ryukyus,
1 Senbaru, Nishihara, Okinawa, 903-0213, Japan
3 High-Precision Mass Spectrometry and Environment Change Laboratory (HISPEC), Department of Geosciences,

National Taiwan University, Taipei 10617, Taiwan
4 Research Center for Future Earth, National Taiwan University, Taipei 10617, Taiwan
5 Global Change Research Center, National Taiwan University, Taipei 10617, Taiwan

Correspondence: Ryu Uemura (ryu.uemura@nagoya-u.jp)

Received: 26 June 2019 – Discussion started: 1 August 2019
Accepted: 18 November 2019 – Published: 7 January 2020

Abstract. The oxygen and hydrogen isotopic compositions            surrounding the inclusion reacted with the water. The amount
of water in fluid inclusions in speleothems are important hy-      of CaCO3 that reacted with the water is equivalent to 2 % of
droclimate proxies because they provide information on the         the water inclusions in molar terms. These results suggest
isotopic compositions of rainwater in the past. Moreover, be-      that the magnitude of the isotopic exchange effect has a mi-
cause isotopic differences between fluid inclusion water and       nor influence on paleotemperature estimates for Quaternary
the host calcite provide information on the past isotopic frac-    climate reconstructions.
tionation factor, they are also useful for quantitative estima-
tion of past temperature changes. The oxygen isotope ratio
of inclusion water (δ 18 Ofi ), however, may be affected by iso-   1   Introduction
topic exchange between the water and the host carbonate.
Thus, it is necessary to estimate the bias caused by this post-    Speleothems have provided invaluable terrestrial climate
depositional effect for precise reconstruction of paleotemper-     records over historical (e.g., Zhang et al., 2008) and glacial–
atures. Here, we evaluate the isotopic exchange reaction be-       interglacial (e.g., Wang, 2001; Wang et al., 2017) timescales.
tween inclusion water and host calcite based on a laboratory       Among multiple climate proxies in speleothems (Fairchild et
experiment involving a natural stalagmite. Multiple stalag-        al., 2006), the stable oxygen isotope ratio of CaCO3 (δ 18 Oca )
mite samples cut from the same depth interval were heated          is the most widely used hydroclimate proxy. Changes in
at 105 ◦ C in the laboratory from 0 to 80 h. Then, the isotopic    δ 18 Oca have been interpreted as proxies for monsoon strength
compositions of the inclusion water were measured. In the          (Wang, 2001), precipitation amount (Wang et al., 2017) or
105 ◦ C heating experiments, the δ 18 Ofi values increased from    temperature (Dorale, 1998; Mori et al., 2018), depending on
the initial value by 0.7 ‰ and then remained stable after ca.      the hydroclimatic setting of each cave site.
20 h. The hydrogen isotope ratio of water showed no trend             The indeterminate nature of δ 18 Oca interpretation is re-
in response to the heating experiments, suggesting that the        lated to the fact that the δ 18 Oca values are mainly controlled
hydrogen isotopic composition of fluid inclusion water ef-         by two factors: the temperature in the cave and the annual
fectively reflects the composition of past drip water. We then     mean δ 18 O value of the rainwater. To overcome this am-
evaluated the process behind the observed isotopic variations      biguity, the isotopic compositions of water in fluid inclu-
using a partial equilibration model. The experimental results      sions in stalagmites have been regarded as important prox-
are best explained by the assumption that a thin CaCO3 layer       ies (Schwarcz et al., 1976; McDermott, 2004). Cave drip
                                                                   waters are sealed in microscale cavities as fluid inclusions,

Published by Copernicus Publications on behalf of the European Geosciences Union.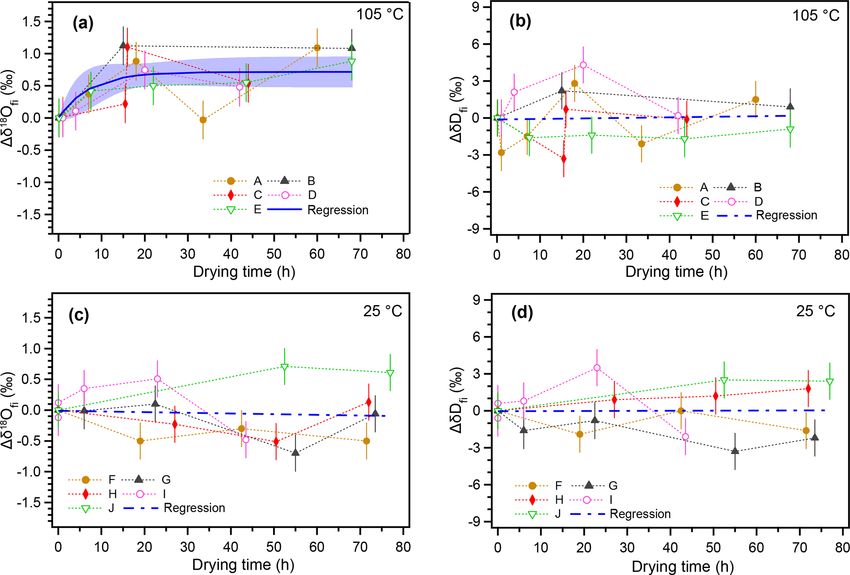
18                                                  R. Uemura et al.: Evaluation of oxygen isotopic exchange in speleothems

whose δ 18 O value is usually close to the δ 18 O value of the      isotopic data from fluid inclusion have been accumulating.
infiltration-weighted mean of local rain (Baker et al., 2019).      Interestingly, these studies suggest that postdepositional ex-
Generally, stalagmites contain inclusion water, which ac-           change is not significant. In fact, the fluid inclusions analyses
counts for 0.05 wt % to 0.5 wt % of a speleothem (McDer-            of modern stalagmites have shown that their δ 18 Ofi values are
mott, 2005). Thus, the isotopic compositions of fluid inclu-        consistent with the δ 18 O values of modern drip waters (Grif-
sions in stalagmites (δ 18 Ofi ) trapped under humid conditions     fiths et al., 2010; Dennis et al., 2001; Arienzo et al., 2013;
should directly preserve the δ 18 O value of drip water in the      Uemura et al., 2016; Labuhn et al., 2015), although a postde-
past.                                                               positional alternation induced by recrystallization has been
   δ 18 Ofi values are also useful for estimating past temper-      suggested (Demény et al., 2016). Moreover, several studies
ature variations. Although experimental studies suggest that        successfully quantitatively estimated past temperatures at the
the δ 18 Oca values of speleothems are affected by kinetic ef-      time of calcite formation (van Breukelen et al., 2008; Meck-
fects (e.g., Hansen et al., 2019; Dietzel et al., 2009), a model-   ler et al., 2015; Uemura et al., 2016). Therefore, these data
ing study suggests the temperature dependence of δ 18 Oca is        imply that the oxygen isotopic exchange between inclusion
within the range of −0.20 ‰ ◦ C−1 and −0.34 ‰ ◦ C−1 even            water and stalagmite calcite appears to be limited and/or very
under a kinetic condition (Mühlinghaus et al., 2009). The           slow over natural temperature ranges.
combination of the two isotopic compositions, δ 18 Ofi and             The indirect evidence for the insignificant postdepositional
δ 18 Oca , provides a direct estimate for the oxygen isotopic       effect cannot provide explanations for the mechanisms be-
fractionation between calcite and water, which is controlled        hind this phenomenon. Thus, it is essential to investigate the
mainly by the formation temperature. Thus, variations in past       isotopic exchange reaction and evaluate how much the past
temperature (i.e., not absolute values but relative changes)        temperature reconstruction would be biased by this effect.
can be estimated on the assumption that the kinetic effect is       However, to our knowledge, no study has investigated the
constant during the speleothem formation period.                    magnitude of isotopic exchange within natural stalagmites.
   Early studies analyzed the hydrogen isotope ratio of fluid       In addition to this natural process, the isotopic exchange re-
inclusion water (δDfi ), and the δ 18 Ofi value was inferred        action may occur during the drying process of stalagmite
from the modern δD vs. δ 18 O relation in meteoric water            samples at high temperatures, which was commonly con-
(Schwarcz et al., 1976; Harmon et al., 1979; Genty et al.,          ducted before fluid inclusion measurement in the laboratory
2002; Matthews et al., 2000; and McGarry et al., 2004).             (Affolter et al., 2014; Vonhof et al., 2006; Uemura et al.,
These studies measured δDfi because of the technical dif-           2016; Dublyansky and Spötl, 2009).
ficulties associated with measuring the small amounts re-              Here, we evaluate the isotopic exchange reaction between
quired to estimate δ 18 Ofi values and a fundamental concern        inclusion water and host calcite based on a laboratory heat-
about the integrity of the δ 18 Ofi data, namely, oxygen iso-       ing experiment of natural stalagmite samples. We conducted
topic exchange between inclusion water and host calcite in          a heating experiment because a higher temperature induces
speleothems.                                                        an increase in the degree of isotopic disequilibrium between
   After being trapped in the host calcite, inclusion water may     water and calcite and increases the rate of isotopic exchange.
continue to exchange oxygen isotopes with the surrounding           As a result, an isotopic shift caused by the exchange reaction
host calcite as follows:                                            will be easier to detect. The stalagmite samples and exper-
                                                                    imental settings are described in Sect. 2. Section 3 presents
3H18       16     16       18
  2 O + CaC O3 3H2 O + CaC O3 .                             (1)
                                                                    the experimental results and discusses them using an isotopic
This isotopic re-equilibration effect potentially alters  δ 18 O
                                                              fi    exchange model for inclusion water and host calcite. Con-
values after the initial trapping of the inclusion water in the     cluding remarks are given in Sect. 4.
stalagmite. Such postdepositional isotopic exchange does not
occur for hydrogen because of the small amount of hydro-
                                                                    2     Methods
gen in the host calcite. Many studies on geothermal water
have shown positive δ 18 O shifts from the global meteoric          2.1    Speleothem and drip water samples
water line (GMWL) (Clark and Fritz, 1999, and references
therein). These data suggest an isotopic exchange of oxy-           A stalagmite (named HSN1) was collected in Hoshino
gen between the geothermal water and the host aquifer rocks.        Cave, Minami-Daito Island, Okinawa, Japan (25◦ 510 3400 N,
This observation is one of the reasons why the earlier stud-        131◦ 130 2900 E). The stalagmite is 246 mm in length, and most
ies mentioned above explored δD values of fluid inclusions          parts are milky white with thin transparent layers (Fig. 1).
rather than δ 18 Ofi values (Harmon et al., 1979; Matthews et       The fabric of the milky white layer is an open columnar
al., 2000; McGarry et al., 2004).                                   structure. To compare the isotope ratios of fluid inclusions
   Recently, because of technological developments involv-          after different heating times, 10 layers, A–J, were taken (2.4–
ing continuous-flow isotope ratio mass spectrometry (Vonhof         3.9 mm in thickness) from a quartered section of the stalag-
et al., 2006) and cavity ring-down spectrometry (CRDS) (Ue-         mite (Tables 1 and 2). The position relative to the axis may
mura et al., 2016; Arienzo et al., 2013; Affolter et al., 2014),    have an influence on the water content. Thus, to minimize

Clim. Past, 16, 17–27, 2020                                                                       www.clim-past.net/16/17/2020/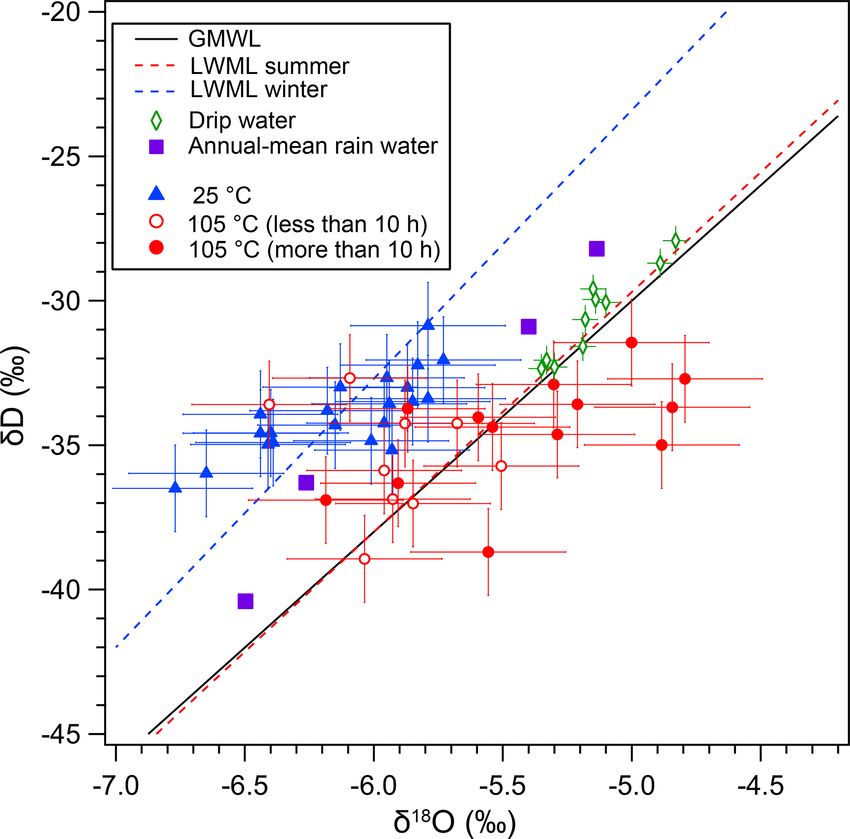
R. Uemura et al.: Evaluation of oxygen isotopic exchange in speleothems                                                                      19

Table 1. Isotopic compositions of inclusion waters and calcite in the HSN1 stalagmite for the 105 ◦ C experiment.

            ID              Depth        Weight       δ 18 Oca     Water     δ 18 Ofi      δDfi     Drying     1δ 18 Ofi     1δDfi
                            (mm)          (mg)            (‰,    content        (‰,         (‰,       time         (‰,         (‰,
                                                      VPDB)       (wt %)   VSMOW)       VSMOW)          (h)   VSMOW)       VSMOW)
            A          74.2–76.8             151        −5.29      0.14       −5.88       −34.25        0.1       0.00          0.0
                                              97        −5.29      0.15       −5.85       −37.02        1.0       0.03         −2.8
                                             100        −5.29      0.14       −5.51       −35.72        7.0       0.37         −1.5
                                             114        −5.29      0.26       −5.00       −31.45       18.0       0.88          2.8
                                              51        −5.29      0.10       −5.91       −36.32       33.5      −0.03         −2.1
                                              97        −5.29      0.14       −4.79       −32.70       60.0       1.09          1.5
            B          83.3–86.3               54       −5.53      0.12       −5.96       −35.88        0.1        0.00          0.0
                                               91       −5.53      0.16       −4.84       −33.69       15.0        1.12          2.2
                                               75       −5.53      0.08       −4.88       −34.99       68.0        1.08          0.9
            C       102.0–105.9              128        −5.18      0.06       −6.41       −33.59        0.1        0.00         0.0
                                             193        −5.18      0.09       −6.19       −36.90       15.5        0.22        −3.3
                                             183        −5.18      0.09       −5.30       −32.90       16.0        1.10         0.7
                                             158        −5.18      0.09       −5.87       −33.73       44.0        0.54        −0.1
            D∗      106.3–109.0              151        −5.73      0.07       −6.04       −38.94        1.0        0.00          0.0
                                             156        −5.73      0.16       −5.93       −36.87        4.0        0.11          2.1
                                             160        −5.73      0.06       −5.29       −34.63       20.0        0.75          4.3
                                             192        −5.73      0.08       −5.56       −38.70       42.0        0.48          0.2
            E       130.5–133.4                91       −5.31      0.23       −6.09       −32.68        0.1        0.00         0.0
                                               58       −5.31      0.10       −5.68       −34.24        7.5        0.42        −1.6
                                               56       −5.31      0.23       −5.60       −34.04       22.0        0.50        −1.4
                                               70       −5.31      0.19       −5.54       −34.37       43.5        0.55        −1.7
                                               63       −5.31      0.18       −5.21       −33.58       68.0        0.88        −0.9
          ∗ The initial value for sample D was 1 h of drying.

this effect, three to six wedge-shaped chipped subsamples                        cryogenically at the temperature of liquid nitrogen, thereby
(51–193 mg) were cut from each layer (illustrated in Fig. 1).                    preventing interaction between CaCO3 and water vapor. The
Subsamples from the same depth interval were assumed to                          1σ reproducibility for the inclusion water analysis, based on
have the same isotopic compositions.                                             the replicate analyses, was ±0.3 ‰ for δ 18 O and ±1.6 ‰ for
   Drip water samples were collected in Hoshino Cave from                        δD (Uemura et al., 2016).
March 2011 to May 2016 (one to five times per year). At                             The δ 18 O and δD values were measured simultaneously
present, there is no drip water at the sampling point of HSN1;                   using a cavity ring-down spectrometer (L2130-i, Picarro
the drip water samples were collected at a point ca. 50 m                        Inc.) with a vaporizer unit (V1120-i, Picarro Inc.). The 1σ re-
away from the sampling point.                                                    producibility, based on repeated analyses of a working stan-
                                                                                 dard water, was ±0.08 ‰ for δ 18 O and ±0.26 ‰ for δD.
2.2   Isotope measurements                                                          Stalagmite carbonate subsamples were measured using an
                                                                                 isotope ratio mass spectrometer (Thermo Scientific DELTA
The oxygen and hydrogen isotopic compositions of the water                       V Advantage) equipped with a Thermo Scientific Gas-
in the fluid inclusions were measured using a homemade ex-                       Bench II system at the University of the Ryukyus. Powdered
traction device (Uemura et al., 2016). Briefly, the speleothem                   subsamples of 150–200 µg were reacted with 100 % phos-
sample was crushed under vacuum, and then extracted wa-                          phoric acid at 72 ◦ C in septa-capped vials before measuring
ter vapor was transferred to a CRDS isotope ratio analyzer                       the released CO2 . The 1σ (n = 124) reproducibility for the
(L2130-i, Picarro Inc.) at the University of the Ryukyus.                        analysis was ±0.04 ‰ for δ 18 O and ±0.03 ‰ for δ 13 C, based
Compared with the system described in Uemura et al. (2016),                      on repeated analyses of a carbonate standard (IAEA-CO-1).
the system has been improved in the following three ways:                           The isotopic composition is expressed in units of per mill
(1) the valves were automatically controlled using pneumatic                     (‰) using delta notation (δ = Rsample /Rref − 1), where R is
valves; (2) the entire system was heated at 105 ◦ C, because                     the isotopic ratio and Rsample and Rref are the isotopic ratios
most parts were easily damaged at 150 ◦ C; and (3) the water                     of the sample and reference, respectively. For water samples
vapor extracted from the stalagmite was immediately trapped

www.clim-past.net/16/17/2020/                                                                                    Clim. Past, 16, 17–27, 2020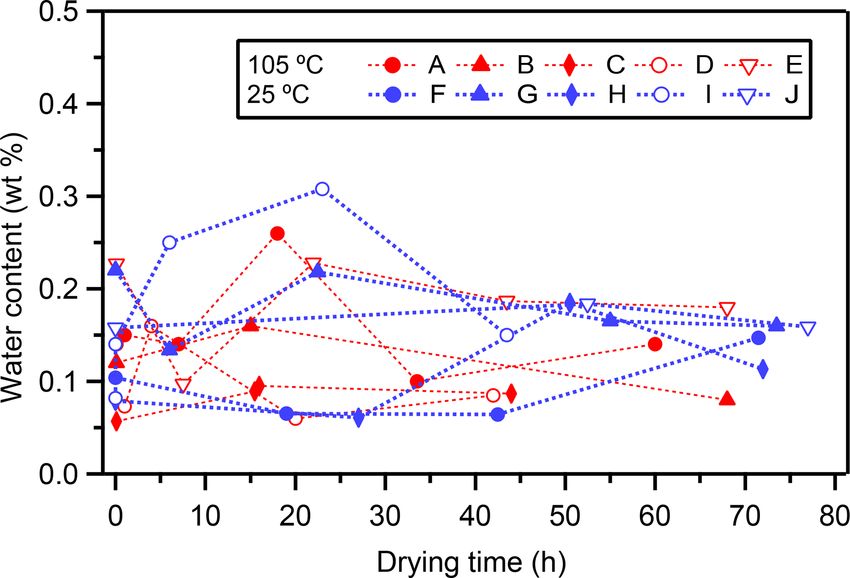
20                                                     R. Uemura et al.: Evaluation of oxygen isotopic exchange in speleothems

Table 2. Isotopic compositions of inclusion waters and calcite in the HSN1 stalagmite for the 25 ◦ C experiment.

            ID          Depth    Weight     δ 18 Oca     Water     δ 18 Ofi       δDfi      Drying      1δ 18 Ofi     1δDfi
                        (mm)      (mg)          (‰,    content        (‰,          (‰,        time          (‰,         (‰,
                                            VPDB)       (wt %)   VSMOW)        VSMOW)           (h)    VSMOW)       VSMOW)
            F       95.4–98.6        176     −5.52        0.10       −5.87        −33.01        0.0          0.0        0.0
                                     155     −5.52        0.07       −6.39        −34.91       19.0         −0.5       −1.9
                                     169     −5.52        0.06       −6.13        −32.99       42.5         −0.3        0.0
                                     111     −5.52        0.15       −6.40        −34.58       71.5         −0.5       −1.6
            G     117.0–119.4         76     −5.35        0.22       −5.95        −32.67        0.0         0.00        0.0
                                      90     −5.35        0.13       −5.96        −34.24        6.0        −0.01       −1.6
                                      86     −5.35        0.22       −5.85        −33.49       22.5         0.10       −0.8
                                      79     −5.35        0.16       −6.65        −35.98       55.0        −0.70       −3.3
                                      92     −5.35        0.16       −6.01        −34.85       73.5        −0.06       −2.2
            H     120.0–123.5        151     −5.38        0.08       −5.93        −35.17        0.0         0.00         0.0
                                     116     −5.38        0.06       −6.15        −34.31       27.0        −0.23         0.9
                                     155     −5.38        0.19       −6.44        −33.93       50.5        −0.51         1.2
                                     119     −5.38        0.11       −5.79        −33.39       72.0         0.13         1.8
            I     148.6–152.2         84     −4.94        0.08       −6.41        −34.98        0.0        −0.12       −0.6
                                     113     −4.94        0.14       −6.18        −33.81        0.0         0.12        0.6
                                     107     −4.94        0.25       −5.94        −33.57        6.0         0.35        0.8
                                      95     −4.94        0.31       −5.79        −30.86       23.0         0.51        3.5
                                      71     −4.94        0.15       −6.77        −36.49       43.5        −0.48       −2.1
            J     177.9–180.6         92     −5.30        0.16       −6.44        −34.59        0.0          0.00        0.0
                                     134     −5.30        0.18       −5.73        −32.05       52.5          0.71        2.5
                                    84.7     −5.30        0.16       −5.83        −32.23       77.0          0.61        2.4

from fluid inclusions, δ 18 O and δD data are presented rela-           2.3   Heating experiment
tive to Vienna Standard Mean Ocean Water (VSMOW) and
are normalized to the VSMOW–SLAP scale. For calcite sam-
ples, δ 18 O and δ 13 C data are expressed relative to the Vienna       To evaluate the effect of isotopic exchange between water
Pee Dee Belemnite (VPDB) and/or VSMOW references. For                   and host calcite, a heating experiment was conducted. As a
clarity, δ values for fluid inclusion water and stalagmite cal-         pretreatment process, each stalagmite sample was placed in
cite are expressed with the subscripts “fi” and “ca”, respec-           a small glass tube (o.d. 0.5 in. and 6 cm in length) with an
tively. δ 18 Ofi , for example, indicates the δ 18 O value of the       airtight screw cap sealed with two Viton O-rings. Then, the
water in fluid inclusions.                                              samples were dried in a vacuum line for 17 h at room temper-
    Two layers (depths of 75.0 and 190.0 mm) of the HSN1                ature using a turbo molecular pump (with a pressure down to
stalagmite were dated using U–Th techniques (Shen et al.,               10−5 Pa).
2008, 2012). U–Th isotopic compositions and concentra-                     After this pre-drying process for all samples, the sam-
tions were measured on a multicollector inductively coupled             ple tube was subjected to different temperatures of 105 or
plasma mass spectrometer (Neptune, Thermo Fisher Scien-                 25 ◦ C. For the 105 ◦ C heating experiment, the sample tube
tific Inc.) at the High-Precision Mass Spectrometry and En-             was heated with a silicone cable heater at 105 ◦ C for a defined
vironment Change Laboratory (HISPEC) of the Department                  time period (from 0 to 70 h) under the same vacuum condi-
of Geosciences at National Taiwan University (Shen et al.,              tions (i.e., a pressure down to 10−5 Pa). For comparison, we
2012). U–Th ages were calculated based on decay constants,              also performed a non-heating experiment at room tempera-
half-lives and 238 U/235 U ratios (Jaffey et al., 1971; Cheng et        ture (25 ◦ C) for the same time periods (from 0 to 70 h) under
al., 2013; Hiess et al., 2012). Uncertainties in the U–Th iso-          the same vacuum conditions.
topic data and 230 Th dates (yr BP, before 1950 CE) are given              Then, the heated (or non-heated) sample was transferred
at the two-sigma (2σ ) level or 2 standard deviations of the            in the closed sample tube to the fluid inclusion analysis ap-
mean (2σm ) unless otherwise noted.                                     paratus so that atmospheric exposure when introducing the
                                                                        sample lasted for less than 30 s. To evacuate the analytical
                                                                        line, the samples were subjected to an additional 105 ◦ C con-
                                                                        dition for 20 min. Then, the sample was crushed, and the iso-

Clim. Past, 16, 17–27, 2020                                                                            www.clim-past.net/16/17/2020/
R. Uemura et al.: Evaluation of oxygen isotopic exchange in speleothems 21
nor 1δDfi values showed any systematic variation (Fig. 2c
and d).
Overall, the results suggest that the observed increase in
δ 18 Ofi values in the 105 ◦ C heating experiment is caused by
the oxygen isotopic exchange between inclusion water and
the surrounding calcite. The data from the control experi-
ment at room temperature suggest that the oxygen isotopic
exchange reaction is too small to detect under 25 ◦ C condi-
tions. The δDfi data for the 25 ◦ C experiment confirm that
there is no systematic isotopic variation caused by subsam-
ple cutting and length of drying time. In addition, the 1δDfi
value for the 105 ◦ C experiment did not change because there
is no significant hydrogen reservoir in calcite.
The new calcite precipitation in fluid inclusions did not
occur because the δ 18 Ofi is expected to be lower if the new
calcite, whose δ 18 O value is higher than that of water, formed
inside the inclusions. This is opposite to the heating experi-
ment result. In the case of internal calcite dissolution, the
δ 18 O value of water will be changed through the isotopic
exchange reaction between the bicarbonate in the solution
and the water. Thus, if the amount of dissolution is limited,
it is not different from the case in which the water is re-
equilibrated with a limited amount of CaCO3 (this will be
discussed in Sect. 3.4).
3.2 Evaporation during heating
Long-term heating may induce leakage from water inclu-
Figure 1. Photograph of HSN1 stalagmite. Half section of the sions through microscopic channels in the calcite caused
HSN1 stalagmite from Hoshino Cave. The horizontal bar represents by decrepitation of the calcite. The measured water content
5 cm. The positions of samples (A–J) used for the experiments are (weight ratio of water in fluid inclusions to carbonate) of the
shown as bold black boxes. An example of wedge-shaped subsam- experiments is shown in Fig. 3. Overall, the water content
ples from a layer is illustrated schematically. ranged from 0.05 wt % to 0.3 wt %, which is within the typi-
cal observed range of 0.05 %–0.5 % (McDermott, 2005).
Although there are large variations in water content among
topic composition of the inclusion water was measured as different layers, there is no significant trend between heat-
described in Sect. 2.2. ing time and water content (Fig. 3). This result suggests that
the fluid inclusion water does not evaporate/leak even after
long-term heating. We should note that larger data sets of
3 Results and discussion
various stalagmites are needed to generalize this result be-
3.1 Isotope composition of inclusion water cause the behavior of leakage would also be influenced by
the fabric and microstructure of the stalagmite. In addition,
The temporal variations in δ 18 Ofi and δDfi values resulting this finding suggests that our standard drying procedure (17 h
from the 105 ◦ C heating and non-heating experiments are at room temperature, as described in Methods) is enough to
shown in Fig. 2. The isotopic compositions of inclusion wa- remove the water adsorbed onto the calcite. Therefore, this
ter are shown as a deviation from the initial value (1δ 18 Ofi result confirms that the increase in δ 18 Ofi values (Fig. 2a) in
and 1δDfi ). For the 105 ◦ C heating experiment, the δ 18 Ofi the heating experiments is not caused by evaporation due to
values gradually increased with the heating time and then thermal decrepitation.
reached a constant value after ca. 20 h (Fig. 2a). The re-
gression curve of the data represents an exponential function 3.3 Evidence of a postdepositional effect in the D–O plot
(Sect. 3.5). The δ 18 Ofi values increased by ca. 0.7 ‰ with
respect to the initial values during ca. 20 h from the start of The distinct behavior of δDfi and δ 18 Ofi values is clearly de-
heating (Fig. 2a). In contrast, no significant trend was found picted in the δD–δ 18 O plot (Fig. 4). The GMWL, local mete-
for 1δDfi in the 105 ◦ C heating experiment (Fig. 2b). For oric water line (LMWL) and precipitation-weighted annual
the room-temperature drying experiment, neither 1δ 18 Ofi mean values (2009–2012) of the rainwater on Okinawa Is-
www.clim-past.net/16/17/2020/ Clim. Past, 16, 17–27, 202022 R. Uemura et al.: Evaluation of oxygen isotopic exchange in speleothems
Figure 2. Changes in isotopic compositions of inclusion water with increasing drying time. (a) Changes in the δ 18 O value of inclusion water
18 ) with time under 105 ◦ C heating. Time on the x axis indicates drying time in addition to the standard 17 h
from the initial value (1δfi(t)
18 value over time at room temperature (25 ◦ C).
drying process at room temperature. (b) The same as (a) but for δDfi . (c) Changes in the 1δfi(t)
(d) The same as (c) but for δDfi . The error bar of the data point represents the analytical reproducibility (1σ ). The regression curve (blue)
18 = A(1 − exp (−kt))) (A = 0.71: k = 0.14). The
in panel (a) was calculated with IGOR (WaveMetrics Inc.) software to fit a function (1δfi(t)
blue shade indicates the 95 % confidence interval. Blue dashed lines in panels (b)–(d) indicate linear regression lines (the correlations are
insignificant).
land (also called Okinawa-jima) are shown in Fig. 4. The In contrast, the average value of δD does not differ between
LMWLs for summer and winter seasons are calculated based these experiments (−34.5±1.9 ‰ in the heating experiment;
on the rainwater data from Okinawa Island (Uemura et al., −33.9 ± 1.3 ‰ in the room-temperature experiment).
2012), ca. 400 km west of Minami-Daito Island. The present- Such a positive δ 18 O shift is opposite to the negative δ 18 O
day drip water isotopic data of Hoshino Cave are close to the shift for inclusion water in speleothems possibly induced by
higher ones of annual mean precipitation values on Okinawa recrystallization (Demény et al., 2016). Instead, the positive
Island (Fig. 4). Generally, the initial δDfi and δ 18 Ofi values in shift is similar to the δ 18 O shift from GMWL found in ob-
the 25 ◦ C experiment are scattered between the summer and servations of geothermal water (Clark and Fritz, 1999). Al-
winter LWMLs. though the magnitude of the shift is much larger for geother-
The thorium-230 dating results of stalagmite HSN1 from mal water, 5 ‰–15 ‰, the δ 18 Ofi shift found in our experi-
Hoshino Cave are shown in Table 3. The ages of layers at ment is likely caused by the exchange of 18 O between the
depths of 75.0 and 190.0 mm were 6429 ± 55 and 7092 ± inclusion water and the host calcite. The possible reasons for
48 years BP, respectively. Thus, a more detailed comparison the small magnitude of the δ 18 O shift, 0.7 ‰, in our experi-
between the HSN1 fluid inclusions and the present-day rain- ment will be discussed later (Sect. 3.4 and 3.5).
water is not straightforward, because the HSN1 speleothem In fluid inclusion studies, closeness to the LMWL in δD–
was grown during the mid-Holocene, and the rainwater iso- δ 18 O plots has been used as proof for the validity of ana-
tope ratio is likely different from that of modern rainfall. lytical methods and the integrity of the sample. Our result
An important characteristic of this result is that the δ 18 Ofi calls for caution regarding the δD–δ 18 O plot test. Most of
values from the heating experiment are systematically shifted the inclusion data from the heating and room-temperature
in the isotopically enriched direction. The average δ 18 Ofi experiments are distributed between the summer and win-
value for the heating experiments (−5.4 ± 0.4 ‰) is higher ter LWMLs. As discussed above, the artificial increase in
than that for the 25 ◦ C experiment (−6.1 ± 0.3 ‰) by 0.7 ‰. the δ 18 O value by heating is systematic. However, it is dif-
Clim. Past, 16, 17–27, 2020 www.clim-past.net/16/17/2020/R. Uemura et al.: Evaluation of oxygen isotopic exchange in speleothems 23
Table 3. Thorium-230 dating results of stalagmite HSN1 from Hoshino Cave.
Depth Weight 238 U 232 Th δ 234 U [230 Th/238 U] [230 Th/232 Th] Age Age δ 234 Uinitial
(mm) (g) (ppb) (ppt) (measureda ) (activityc ) (ppmd ) (uncorrected) (yr BPc,e ) (correctedb )
75.0 0.2972 164.20 ± 0.46 2.2 ± 1.6 61.8 ± 3.3 0.06145 ± 0.00047 76286 ± 54629 6497 ± 55 6429 ± 55 63.0 ± 3.0
190.0 0.2601 137.39 ± 0.26 3.7 ± 1.8 58.1 ± 2.1 0.06729 ± 0.00041 41683 ± 20343 7160 ± 48 7092 ± 48 59.3 ± 2.1
h i h i
Chemical analyses were performed in March 2017. Analytical errors are 2σ of the mean. a 238 U = 235 U × 137.818 (±0.65 ‰) (Hiess et al., 2012); δ 234 U
h i h i
= 234 U/238 U − 1 × 1000. b δ 234 Uinitial corrected was calculated based on 230 Th age (T ); i.e., δ 234 Uinitial = δ 234 Umeasured × eλ234×T , and T is the corrected age. c 230 Th/238 U
activity
activity = 1 − e−λ230×T + δ 234 Umeasured /1000 λ230 / λ230 − λ234 1 − e−(λ230 −λ234) T , where T is the age. The decay constants are 9.1705 ×10⁻⁶ yr−1 for 230 Th, 2.8221 × 10⁻⁶ yr−1
h i
for 234 U and 1.55125 × 10 −10 −1
yr for 238 d
U. The degree of detrital 230 Th contamination is indicated by the 230 Th/232 Th atomic ratio instead of the activity ratio. e Age corrections for
samples were calculated using an estimated atomic 230 Th/232 Th ratio of 4 ± 2 ppm. These are the values for a material at secular equilibrium, with a crustal 232 Th/238 U of 3.8 and an arbitrary
uncertainty of 50 %. BP indicates before present, where present is defined as 1950 CE.
Figure 3. Changes in water content with increasing drying time.
Changes in water content (in wt %) of each subsample with time (in
hours). Symbols indicate the 105 ◦ C experiment (red, layer A–E)
and 25 ◦ C drying experiment (blue, layer F–J).
ficult to detect such a shift in the δD–δ 18 O plot because the
shift is small in the scattered data points. The data from the Figure 4. D–O plot of inclusion water. Blue triangles indicate the
heating experiment (more than 10 h) plot outside the sum- isotopic compositions of the fluid inclusion in the 25 ◦ C drying ex-
mer LMWL, but a 0.7 ‰ deviation could be interpreted as periment. Red circles indicate the isotopic compositions of the fluid
inclusion in the 105 ◦ C drying experiment for < 10 h (open red cir-
resulting from different climate conditions. Because the oxy-
cles) and > 10 h (solid red circles). The black line indicates GMWL.
gen isotopic exchange results in higher δ 18 O values without Local meteoric water lines based on present-day rain data from Ok-
a δD shift, the isotopic exchange results in a lower deuterium inawa Island for the summer season (red dotted line) and the winter
excess value (d = δD − 8δ 18 O), a −6 ‰ shift in our experi- season (blue dotted line) are also shown. Purple solid squares in-
ment. We should note that the d value could become higher if dicate precipitation-weighted annual mean values (2009–2012) of
the exchange takes place at lower temperatures than the orig- the rainwater on Okinawa Island. Green open diamonds indicate
inal precipitation temperature. Therefore, the oxygen isotope present-day observation of drip water in Hoshino Cave.
exchange under changing temperatures may cause a slight
deviation from the LMWL.
pothesis”). These hypotheses are schematically explained in
3.4 Partial isotopic exchange between water and calcite Fig. 5.
For the fully reacted hypothesis, the number of oxygen
To interpret the experimental result, we consider two hy- atoms in calcite can be considered infinite compared with
potheses: (i) the oxygen isotopic exchange reaction occurred those in the water inclusions because the water content of
between inclusion water and the entirety of the host calcite a stalagmite is very small, 0.05 wt %–0.5 wt % (McDermott,
(hereafter referred to as the “fully reacted hypothesis”), and 2005). Thus, δ 18 Ofi is simply controlled by the δ 18 O value
(ii) the δ 18 Ofi values are equilibrated with a limited amount of calcite and the equilibrium fractionation factor between
of CaCO3 (hereafter referred to as the “partially reacted hy- CaCO3 and H2 O at the ambient temperature (Fig. 5b). At
www.clim-past.net/16/17/2020/ Clim. Past, 16, 17–27, 202024 R. Uemura et al.: Evaluation of oxygen isotopic exchange in speleothems
Figure 5. Schematic illustration of isotopic re-equilibration between inclusion water and stalagmite. (a) Schematic illustration of a water-
filled fluid inclusion and surrounding CaCO3 . (b) Changes in the isotopic composition for the fully reacted hypothesis, in which the δ 18 Ofi
value changes in response to equilibration with an infinite amount of host CaCO3 . In this case, the sample at room temperature (25 ◦ C at
time of 0) is heated to 105 ◦ C and reaches a new isotopic equilibrium at time t1 . (c) The same as (b) but for the partially reacted hypothesis,
in which the δ 18 Ofi value changes in response to equilibration with a limited amount of CaCO3 . Note that the calcite–water fractionation
factor is the same for both hypotheses.
105 ◦ C, the fractionation factor between CaCO3 and water perature (time t = 0, initial temperature is T0 ) are heated to
is 1.0167. Because the δ 18 Oca value of the HSN1 stalagmite 105 ◦ C (T1 ) and reach a new isotope equilibrium at time t1 .
is 25.5 ‰ vs. VSMOW (i.e., −5.3 ‰ vs. VPDB), the δ 18 Ofi For the partially reacted hypothesis, we assumed that a
value in equilibrium with the calcite should be 8.6 ‰ vs. VS- limited amount of CaCO3 in the reacted layer exchanged
MOW. Thus, the δ 18 Ofi value should be enriched by 14 ‰ to oxygen isotopes with the inclusion water (Fig. 5a). The iso-
15 ‰. This simple hypothesis, however, is not realistic be- tope mass balance between the initial and partially equili-
cause the inclusion water likely reacts only with the inner brated conditions at a heating time during a course of reac-
surface of CaCO3 surrounding the inclusions. In fact, the re- tion at time t can be written as follows:
sults in Fig. 2a show that the actual change in the δ 18 Ofi value
18 18 18 18
is only 0.7 ‰. 3 · γ δca_ra(0) + δfi(0) = 3 · γ δca_ra(t) + δfi(t) , (2)
The small δ 18 Ofi shift observed in the experiment can
be interpreted as the result of (i) insufficient reaction time where γ is the molar ratio of CaCO3 involved in the re-
between water and calcite and/or (ii) reaction with a lim- action to the inclusion water (i.e., γ = CaCO3 in reacted
18
layer/H2 O in inclusion: MCaCO3 /MH2 O ), δca_ra(t) indicates the
ited amount of CaCO3 . The first hypothesis can be re-
18
δ O value of the CaCO3 in the reacted layer and δfi(t) 18 indi-
jected because the 1δ 18 Ofi enrichment plateaued within 20 h
(Fig. 2a). Therefore, the experimental results support the lat- cates the δ 18 O value of the inclusion water at time t. If the
ter hypothesis. A model for this partially reacted hypothesis CaCO3 does not react with the water (i.e., γ = 0), for ex-
will be discussed in the following section. ample, the δ 18 Ofi value does not change before and after the
reaction.
18
At t1 , δca_ra(t) 18 reach an isotopic equilibrium state.
and δfi(t)
3.5 Isotopic re-equilibration model
This equilibrium state can be written as follows:
We describe a partial isotopic equilibration model that con-
18 18
siders the changes in δ 18 Ofi values from the time when the δca_ra(t1) − δfi(t1) = εT181 , (3)
inclusion water was entrapped in CaCO3 (time 0) to a cer-
tain time required to reach a new isotopic equilibrium (time where εT181 indicates the oxygen isotopic enrichment factor at
t1 ; at a certain temperature T1 ). An example of this re- the temperature T1 . Whereas the rate constant of the isotope
equilibration scenario is that inclusion waters at room tem- exchange reaction only varies with temperature, the number
Clim. Past, 16, 17–27, 2020 www.clim-past.net/16/17/2020/R. Uemura et al.: Evaluation of oxygen isotopic exchange in speleothems 25
of transferred isotopes varies with the temporal evolution of aware of this effect during experimental procedures, such as
the isotope ratios of the end-members. The reaction can be the heat drying process, before fluid inclusion measurements.
written as follows: Second, we consider a case in which the drip water enclosed
in the fluid inclusions during a glacial period with a temper-
18
d δca_ra(t) 18 − ε 18
− δfi(t) T1
18 18
ature of 15 ◦ C re-equilibrates at the modern average temper-
− = k18 δca_ra(t) − δfi(t) − εT181 , (4) ature of 25 ◦ C. The isotopic enrichment factors (εT18 ) for 15
dt
and 25 ◦ C are 30.6 ‰ and 28.4 ‰, respectively. Thus, based
18
where (δca_ra(t) 18 ) is the isotopic difference, ε 18 is the
− δfi(t) T1 on Eq. (7) with a γ value of 0.02, the fluid inclusion oxygen
isotopic enrichment factor at the new equilibrium state and isotope ratio δ 18 Ofi would increase by only 0.1 ‰. With the
k18 indicates a reaction constant. The integration of Eq. (4) temperature dependence of the δ 18 O fractionation factor be-
yields tween water and calcite (0.2 ‰ ◦ C−1 ), this isotopic exchange
results in a 0.5 ◦ C bias in the paleotemperature estimate. We
18 18
δca_ra(t) − δfi(t) − εT18 = εT180 − εT181 exp(−k18 t), (5) should note that we do not know the reaction rate of the iso-
topic exchange under normal ambient temperatures. Calcite
where εT180 (= δca_eq(0)
18 18 ) represents the oxygen isotopic
− δfi(0) and fluid inclusion water might not reach a new equilibrium
enrichment factor at the initial temperature, T0 . state even after thousands of years. Thus, this estimate is an
To fit our experimental data, in which we measured the upper limit of the bias. Because the bias, 0.1 ‰, is within
difference between heated and initial (i.e., non-heated) con- the typical analytical error for inclusion analyses, the postde-
ditions, we took the difference between Eq. (5) and the initial positional effect has little influence on the paleotemperature
condition (t = 0) of Eq. (5) (δca 18
eq(0)
−δf18i(0) −εT181 = εT180 −εT181 ). estimates for glacial–interglacial cycles.
Thus, with Eq. (2), we obtain
18 3γ
1δfi(t) = εT180 − εT181 (1 − exp (−k18 t)), (6) 4 Conclusions
1 + 3γ
18 (= δ 18 − δ 18 ) represents the δ 18 O difference
where 1δfi(t) Our experiment shows that δ 18 O values of fluid inclusion
fi(t) fi(0) fi
between the reacted and initial conditions. When the new water in speleothems change because of isotopic exchange
equilibrium state is reached (t = t1 ), Eq. (6) yields reactions with the host calcite. Unlike the δ 18 O value of in-
clusion water, the δD value showed no trend even after pro-
longed heating and thus effectively reflects the original iso-
18 3γ
1δfi(t1) = εT180 − εT181 . (7) topic composition of past drip water. This study is the first
1 + 3γ
to present experimental data showing that such a postdepo-
This equation provides an estimate of γ based on the experi- sitional effect occurs in natural speleothem samples. How-
mental results. ever, the changes in the δ 18 O values of fluid inclusion water
A regression curve based on Eq. (5) is shown in Fig. 2a. were very small, 0.7 ‰, in the 105 ◦ C heating experiment.
Based on Eq. (7), the value of γ is estimated to be 0.02. Based on this result, the inclusion water reacts only with a
This suggests that the amount of CaCO3 reacted with water thin layer of surrounding CaCO3 . The amount of CaCO3 that
is equivalent to 2 % of the water inclusions in molar terms. reacted with the water is equivalent to 2 % of the water inclu-
The thickness of the reacted layer of CaCO3 can be roughly sions in molar terms. Thus, the oxygen isotopic exchange re-
estimated based on the assumption that the fluid inclusions sults in a minor impact on the estimation of past temperature
filled with water are cubic with 50 µm edges. With a calcite changes: a maximum bias of 0.5 ◦ C for a 10 ◦ C climate shift.
density of 2.71 g cm−3 , the thickness of the reacted layer of This study provides a quantitative explanation of the mech-
CaCO3 is estimated to be 0.6 µm. anism by which the effect of isotopic exchange appears to
This result is explained schematically in Fig. 5a and c. The be insignificant in previous speleothem studies. The results
δ 18 Ofi value increased by only 0.7 ‰. Since the equilibrium also suggest that the sample treatment in the laboratory (i.e.,
fractionation factor between CaCO3 and water at 105 ◦ C is heated drying process) should be conducted with caution be-
1.0167, the δ 18 Oca of the reacted layer should be 11.3 ‰ vs. cause isotopic exchange may affect the δ 18 O value of fluid
VSMOW. Thus, in this case, the δ 18 Oca value of the reacted inclusions.
layer changed significantly.
3.6 Impact for paleoclimate reconstruction Data availability. The data generated and used in this study are
available in Tables 1 and 2 in this article.
In this section, we estimate the impact of the isotopic
exchange effect on Quaternary paleoclimate reconstruc-
tions. First, at 105 ◦ C, detectable isotopic exchange occurred Author contributions. RU designed the experiment and study.
within 20 h. This finding suggests that researchers should be YK and KO conducted the experiments. C-CS performed the U–
www.clim-past.net/16/17/2020/ Clim. Past, 16, 17–27, 202026 R. Uemura et al.: Evaluation of oxygen isotopic exchange in speleothems
Th dating. All authors contributed to the discussion. RU analyzed Demény, A., Czuppon, G., Kern, Z., Leél-Őssy, S., Németh, A., Sz-
the results, generated figures and wrote the paper. abó, M., Tóth, M., Wu, C.-C., Shen, C.-C., Molnár, M., Németh,
T., Németh, P., and Óvári, M.: Recrystallization-induced oxy-
gen isotope changes in inclusion-hosted water of speleothems
Competing interests. The authors declare that they have no con- – Paleoclimatological implications, Quatern. Int., 415, 25–32,
flict of interest. https://doi.org/10.1016/j.quaint.2015.11.137, 2016.
Dennis, P. F., Rowe, P. J., and Atkinson, T. C.: The recov-
ery and isotopic measurement of water from fluid inclu-
Acknowledgements. We thank Eri Iwase, Satoru Mishima, Ko- sions in speleothems, Geochim. Cosmochim. Ac., 65, 871–884,
suke Masaka, Yuina Uechi, Tatsuki Matsuura, Masaaki Chinen https://doi.org/10.1016/s0016-7037(00)00576-7, 2001.
(University of the Ryukyus) and Ryuji Asami (Tohoku University) Dietzel, M., Tang, J., Leis, A., and Köhler, S. J.: Oxygen isotopic
for supporting the preparation and isotopic measurements and Tsai- fractionation during inorganic calcite precipitation – Effects of
Luen Yu for U–Th dating. We also thank Kazuaki Higashi for the temperature, precipitation rate and pH, Chem. Geol., 268, 107–
assistance with field work. 115, https://doi.org/10.1016/j.chemgeo.2009.07.015, 2009.
Dorale, J. A.: Climate and Vegetation History of the Mid-
continent from 75 to 25 ka: A Speleothem Record from
Crevice Cave, Missouri, USA, Science, 282, 1871–1874,
Financial support. This research has been supported by the Japan
https://doi.org/10.1126/science.282.5395.1871, 1998.
Society for the Promotion of Science (grant nos. 15H01729,
Dublyansky, Y. V. and Spötl, C.: Hydrogen and oxygen isotopes of
16H02235, 17KK0012, 18H03794). This study was also supported
water from inclusions in minerals: design of a new crushing sys-
by the University of the Ryukyus Research Promotion Grant. U–
tem and on-line continuous-flow isotope ratio mass spectromet-
Th dating was provided by grants from the Science Vanguard Re-
ric analysis, Rapid Commun. Mass Spectrom., 23, 2605–2613,
search Program of the Ministry of Science and Technology (108-
https://doi.org/10.1002/rcm.4155, 2009.
2119-M-002-012 to Chuan-Chou Shen) and the Higher Education
Fairchild, I. J., Smith, C. L., Baker, A., Fuller, L., Spötl, C., Mattey,
Sprout Project of the Ministry of Education, Taiwan (108L901001
D., McDermott, F., and EIMF: Modification and preservation of
to Chuan-Chou Shen).
environmental signals in speleothems, Earth-Sci. Rev., 75, 105–
153, https://doi.org/10.1016/j.earscirev.2005.08.003, 2006.
Genty, D., Plagnes, V., Causse, C., Cattani, O., Stievenard, M.,
Review statement. This paper was edited by Dominik Fleitmann Falourd, S., Blamart, D., Ouahdi, R., Van-Exter, S., and Cail-
and reviewed by two anonymous referees. lon, N.: Fossil water in large stalagmite voids as a tool for paleo-
precipitation stable isotope composition reconstitution and pale-
otemperature calculation, Chem. Geol., 184, 83–95, 2002.
Griffiths, M. L., Drysdale, R. N., Vonhof, H. B., Gagan,
References M. K., Zhao, J.-X., Ayliffe, L. K., Hantoro, W. S., Hell-
strom, J. C., Cartwright, I., Frisia, S., and Suwargadi, B.
Affolter, S., Fleitmann, D., and Leuenberger, M.: New online W.: Younger Dryas–Holocene temperature and rainfall his-
method for water isotope analysis of speleothem fluid inclusions tory of southern Indonesia from δ 18 O in speleothem cal-
using laser absorption spectroscopy (WS-CRDS), Clim. Past, 10, cite and fluid inclusions, Earth Planet. Sc. Lett., 295, 30–36,
1291–1304, https://doi.org/10.5194/cp-10-1291-2014, 2014. https://doi.org/10.1016/j.epsl.2010.03.018, 2010.
Arienzo, M. M., Swart, P. K., and Vonhof, H. B.: Measurement of Hansen, M., Scholz, D., Schöne, B. R., and Spötl, C.: Sim-
δ 18 O and δ 2 H values of fluid inclusion water in speleothems us- ulating speleothem growth in the laboratory: Determination
ing cavity ring-down spectroscopy compared with isotope ratio of the stable isotope fractionation (δ 13 C and δ 18 O) be-
mass spectrometry, Rapid Commun. Mass Spectrom., 27, 2616– tween H2 O, DIC and CaCO3 , Chem. Geol., 509, 20–44,
2624, https://doi.org/10.1002/rcm.6723, 2013. https://doi.org/10.1016/j.chemgeo.2018.12.012, 2019.
Baker, A., Hartmann, A., Duan, W., Hankin, S., Comas-Bru, L., Harmon, R. S., Schwarcz, H. P., and O’Neil, J. R.: D/H ra-
Cuthbert, M. O., Treble, P. C., Banner, J., Genty, D., Baldini, L. tios in speleothem fluid inclusions: A guide to variations
M., Bartolome, M., Moreno, A., Perez-Mejias, C., and Werner, in the isotopic composition of meteoric precipitation?, Earth
M.: Global analysis reveals climatic controls on the oxygen iso- Planet. Sc. Lett., 42, 254–266, https://doi.org/10.1016/0012-
tope composition of cave drip water, Nat. Commun., 10, 2984, 821x(79)90033-5, 1979.
https://doi.org/10.1038/s41467-019-11027-w, 2019. Hiess, J., Condon, D. J., McLean, N., and Noble, S. R.: 238 U/235 U
Cheng, H., Lawrence Edwards, R., Shen, C.-C., Polyak, V. J., As- Systematics in Terrestrial Uranium-Bearing Minerals, Science,
merom, Y., Woodhead, J., Hellstrom, J., Wang, Y., Kong, X., 335, 1610–1614, https://doi.org/10.1126/science.1215507, 2012.
Spötl, C., Wang, X., and Calvin Alexander, E.: Improvements Jaffey, A. H., Flynn, K. F., Glendenin, L. E., Bentley, W. C., and
in 230 Th dating, 230 Th and 234 U half-life values, and U–Th Essling, A. M.: Precision Measurement of Half-Lives and Spe-
isotopic measurements by multi-collector inductively coupled cific Activities of 235 U and 238 U, Phys. Rev. C, 4, 1889–1906,
plasma mass spectrometry, Earth Planet. Sc. Lett., 371–372, 82– https://doi.org/10.1103/PhysRevC.4.1889, 1971.
91, https://doi.org/10.1016/j.epsl.2013.04.006, 2013. Labuhn, I., Genty, D., Vonhof, H., Bourdin, C., Blamart, D., Dou-
Clark, I. and Fritz, P.: Water-Rock Interaction, in: Environmental ville, E., Ruan, J., Cheng, H., Edwards, R. L., Pons-Branchu, E.,
Isotopes in Hydrogeology, Lewis Publishers, New York, 245– and Pierre, M.: A high-resolution fluid inclusion δ18O record
266, 1999.
Clim. Past, 16, 17–27, 2020 www.clim-past.net/16/17/2020/R. Uemura et al.: Evaluation of oxygen isotopic exchange in speleothems 27 from a stalagmite in SW France: modern calibration and compar- Shen, C.-C., Wu, C.-C., Cheng, H., Lawrence Edwards, R., ison with multiple proxies, Quaternary Sci. Rev., 110, 152–165, Hsieh, Y.-T., Gallet, S., Chang, C.-C., Li, T.-Y., Lam, D. https://doi.org/10.1016/j.quascirev.2014.12.021, 2015. D., Kano, A., Hori, M., and Spötl, C.: High-precision Matthews, A., Ayalon, A., and Bar-Matthews, M.: D/H ra- and high-resolution carbonate 230 Th dating by MC-ICP-MS tios of fluid inclusions of Soreq cave (Israel) speleothems with SEM protocols, Geochim. Cosmochim. Ac., 99, 71–86, as a guide to the Eastern Mediterranean Meteoric Line re- https://doi.org/10.1016/j.gca.2012.09.018, 2012. lationships in the last 120 ky, Chem. Geol., 166, 183–191, Uemura, R., Yonezawa, N., Yoshimura, K., Asami, R., Kadena, https://doi.org/10.1016/s0009-2541(99)00192-8, 2000. H., Yamada, K., and Yoshida, N.: Factors controlling iso- McDermott, F.: Palaeo-climate reconstruction from stable isotope topic composition of precipitation on Okinawa Island, variations in speleothems: a review, Quaternary Sci. Rev., 23, Japan: Implications for paleoclimate reconstruction in the 901–918, https://doi.org/10.1016/j.quascirev.2003.06.021, 2004. East Asian Monsoon region, J. Hydrol., 475, 314–322, McDermott, F., Schwarcz, H. P., and Rowe, P. J.: Isotopes in https://doi.org/10.1016/j.jhydrol.2012.10.014, 2012. speleothems, in: Isotopes in Palaeoenvironmental Research, Uemura, R., Nakamoto, M., Asami, R., Mishima, S., Gibo, M., Springer, the Netherlands, Dordrecht, 185–226, 2005. Masaka, K., Jin-Ping, C., Wu, C.-C., Chang, Y.-W., and Shen, McGarry, S., Bar-Matthews, M., Matthews, A., Vaks, A., C.-C.: Precise oxygen and hydrogen isotope determination in Schilman, B., and Ayalon, A.: Constraints on hydrologi- nanoliter quantities of speleothem inclusion water by cavity ring- cal and paleotemperature variations in the Eastern Mediter- down spectroscopic techniques, Geochim. Cosmochim. Ac., 172, ranean region in the last 140ka given by the δD values of 159–176, https://doi.org/10.1016/j.gca.2015.09.017, 2016. speleothem fluid inclusions, Quaternary Sci. Rev., 23, 919–934, van Breukelen, M. R., Vonhof, H. B., Hellstrom, J. C., https://doi.org/10.1016/j.quascirev.2003.06.020, 2004. Wester, W. C. G., and Kroon, D.: Fossil dripwater in sta- Meckler, A. N., Affolter, S., Dublyansky, Y. V., Krüger, Y., Vo- lagmites reveals Holocene temperature and rainfall varia- gel, N., Bernasconi, S. M., Frenz, M., Kipfer, R., Leuenberger, tion in Amazonia, Earth Planet. Sc. Lett., 275, 54–60, M., Spötl, C., Carolin, S., Cobb, K. M., Moerman, J., Ad- https://doi.org/10.1016/j.epsl.2008.07.060, 2008. kins, J. F., and Fleitmann, D.: Glacial–interglacial temperature Vonhof, H. B., van Breukelen, M. R., Postma, O., Rowe, P. J., change in the tropical West Pacific: A comparison of stalagmite- Atkinson, T. C., and Kroon, D.: A continuous-flow crushing based paleo-thermometers, Quaternary Sci. Rev., 127, 90–116, device for on-line δ 2 H analysis of fluid inclusion water in https://doi.org/10.1016/j.quascirev.2015.06.015, 2015. speleothems, Rapid Commun. Mass Spectrom., 20, 2553–2558, Mori, T., Kashiwagi, K., Amekawa, S., Kato, H., Okumura, T., https://doi.org/10.1002/rcm.2618, 2006. Takashima, C., Wu, C.-C., Shen, C.-C., Quade, J., and Kano, A.: Wang, X., Edwards, R. L., Auler, A. S., Cheng, H., Kong, X., Wang, Temperature and seawater isotopic controls on two stalagmite Y., Cruz, F. W., Dorale, J. A., and Chiang, H.-W.: Hydroclimate records since 83 ka from maritime Japan, Quaternary Sci. Rev., changes across the Amazon lowlands over the past 45,000 years, 192, 47–58, https://doi.org/10.1016/j.quascirev.2018.05.024, Nature, 541, 204–207, https://doi.org/10.1038/nature20787, 2018. 2017. Mühlinghaus, C., Scholz, D., and Mangini, A.: Modelling fractiona- Wang, Y. J.: A High-Resolution Absolute-Dated Late Pleistocene tion of stable isotopes in stalagmites, Geochim. Cosmochim. Ac., Monsoon Record from Hulu Cave, China, Science, 294, 2345– 73, 7275–7289, https://doi.org/10.1016/j.gca.2009.09.010, 2009. 2348, https://doi.org/10.1126/science.1064618, 2001. Schwarcz, H. P., Harmon, R. S., Thompson, P., and Ford, D. C.: Zhang, P., Cheng, H., Edwards, R. L., Chen, F., Wang, Y., Stable isotope studies of fluid inclusions in speleothems and their Yang, X., Liu, J., Tan, M., Wang, X., Liu, J., An, C., Dai, paleoclimatic significance, Geochim. Cosmochim. Ac., 40, 657– Z., Zhou, J., Zhang, D., Jia, J., Jin, L., and Johnson, K. 665, https://doi.org/10.1016/0016-7037(76)90111-3, 1976. R.: A Test of Climate, Sun, and Culture Relationships from Shen, C.-C., Li, K.-S., Sieh, K., Natawidjaja, D., Cheng, an 1810-Year Chinese Cave Record, Science, 322, 940–942, H., Wang, X., Edwards, R. L., Lam, D. D., Hsieh, Y.-T., https://doi.org/10.1126/science.1163965, 2008. Fan, T.-Y., Meltzner, A. J., Taylor, F. W., Quinn, T. M., Chiang, H.-W., and Kilbourne, K. H.: Variation of initial 230 Th/232 Th and limits of high precision U–Th dating of shallow-water corals, Geochim. Cosmochim. Ac., 72, 4201– 4223, https://doi.org/10.1016/j.gca.2008.06.011, 2008. www.clim-past.net/16/17/2020/ Clim. Past, 16, 17–27, 2020
You can also read