COVID-19 EPIDEMIC IN THE BRAZILIAN STATE OF AMAZONAS WAS DRIVEN BY LONG-TERM PERSISTENCE OF ENDEMIC SARS-COV-2 LINEAGES AND THE RECENT EMERGENCE ...
←
→
Page content transcription
If your browser does not render page correctly, please read the page content below
COVID-19 epidemic in the Brazilian state of
Amazonas was driven by long-term persistence of
endemic SARS-CoV-2 lineages and the recent
emergence of the new Variant of Concern P.1
Felipe Naveca ( felipe.naveca@ ocruz.br )
Fiocruz/ILMD https://orcid.org/0000-0002-2888-1060
Valdinete Nascimento
Fiocruz/ILMD
Victor Souza
Fiocruz/ILMD
André Corado
Fiocruz/ILMD
Fernanda Nascimento
Fiocruz/ILMD
George Silva
Fiocruz/ILMD
Ágatha Costa
Fiocruz/ILMD
Débora Duarte
Fiocruz/ILMD
Karina Pessoa
Fiocruz/ILMD
Matilde Mejía
Fiocruz/ILMD
Maria Brandão
Fiocruz/ILMD
Michele Jesus
Fiocruz/ILMD
Luciana Gonçalves
FVS-AM
Cristiano da Costa
FVS-AM
Vanderson Sampaio
Fundação de Medicina Tropical Dr Heitor Vieira Dourado https://orcid.org/0000-0001-7307-8851
Page 1/21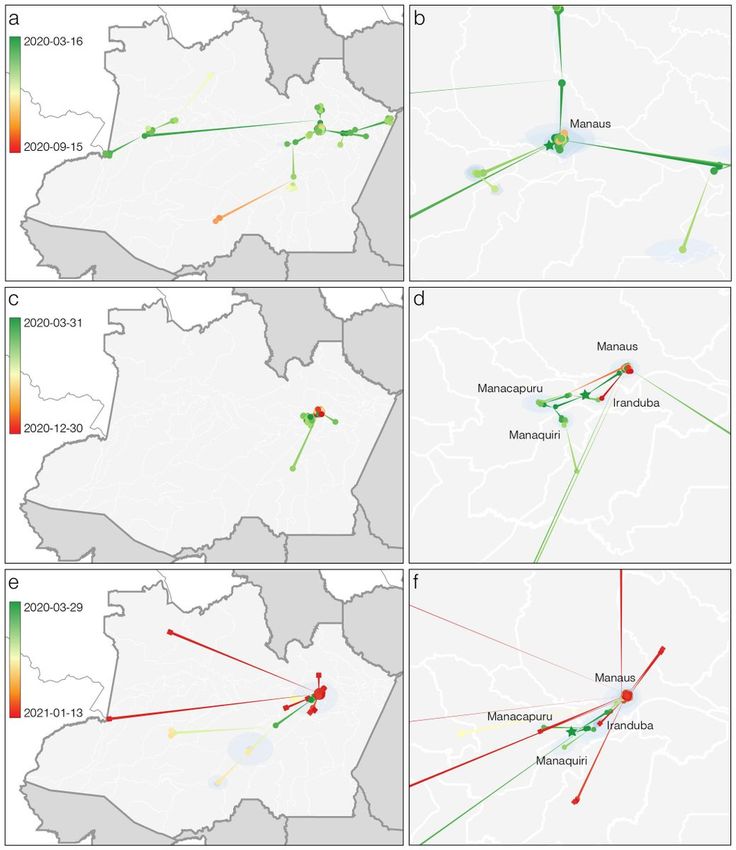
Daniel Barros
FVS-AM
Marineide Silva
LACEN-AM
Tirza Mattos
LACEN-AM
Gemilson Pontes
Instituto Nacional de Pesquisas da Amazônia
Ligia Abdalla
UEA
João Santos
Hospital Adventista de Manaus
Ighor Arantes
Fiocruz/IOC
Filipe Dezordi
Fiocruz/IAM
Marilda Siqueira
Fiocruz/IOC
Gabriel Wallau
Fiocruz/IAM
Paola Resende
Fiocruz/IOC
Edson Delatorre
UFES
Tiago Gräff
Fiocruz/IGM
Gonzalo Bello
Fiocruz/IOC
Article
Keywords:
DOI: https://doi.org/10.21203/rs.3.rs-275494/v1
License: This work is licensed under a Creative Commons Attribution 4.0 International License.
Read Full License
Page 2/21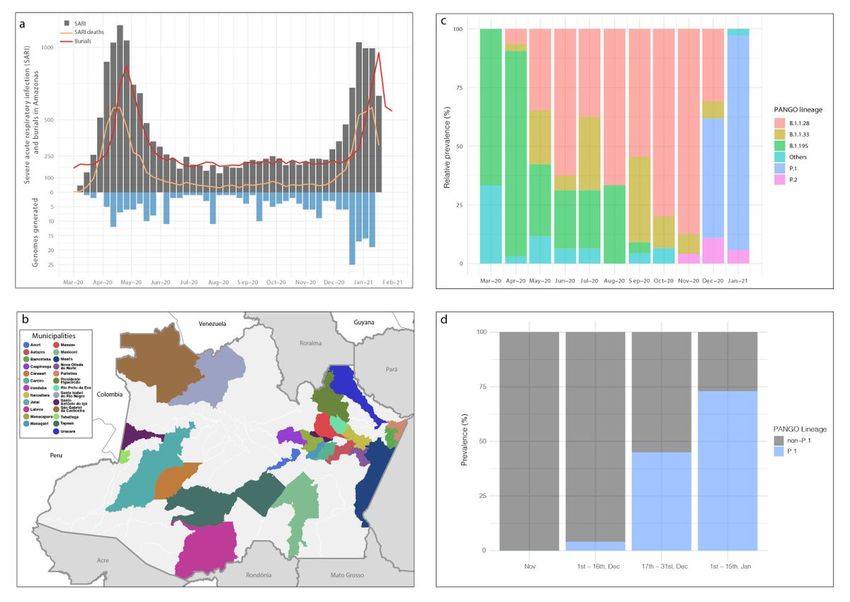
Abstract
The Northern Brazilian state of Amazonas is one of the most heavily affected country regions by the
COVID-19 epidemic and experienced two exponential growing waves in early and late 2020. Through a
genomic epidemiology study based on 250 SARS-CoV-2 genomes from different Amazonas
municipalities sampled between March 2020 and January 2021 we revealed that the rst exponential
growth phase was driven mostly by the dissemination of lineage B.1.195 which was gradually replaced
by lineage B.1.1.28. The second wave coincides with the emergence of the variant of concern (VOC) P.1
which evolved from a local B.1.1.28 clade in late November and rapidly replaced the parental lineage in
less than two months. Our ndings support that successive lineage replacements in Amazonas were
driven by a complex combination of variable levels of social distancing measures and the emergence of
a more transmissible VOC P.1 virus. These data provide unique insights to understanding the
mechanisms that underlie the COVID-19 epidemic waves and the risk of disseminating SARS-CoV-2 VOC
P.1 in Brazil and potentially worldwide.

Text
The Amazonas state reported the rst sequence con rmed SARS-CoV-2 case in Manaus, the state capital
city, in March 2020 in a traveler returning from Europe 1. By late February 2021, more than 306,000
laboratory-con rmed cases and more than 10,400 deaths had been reported 2. The COVID-19 epidemic in
the Amazonas was characterized by two exponentially growing curves of cases (Fig. 1a). Epidemiological
data from syndromic surveillance of severe acute respiratory illness (SARI) and burials indicates the rst
wave of the epidemic started in March 2020 and peaked around early May 2020, when the number of
cases dropped and then remained roughly stable from June to November 2020. However, in mid-
December, the number of cases started to grow exponentially, establishing the second wave of the
epidemic.

Recent ndings bring attention to the emergence of a new SARS-CoV-2 variant of concern (VOC) in
Manaus, designated P.1, also known as N501Y.V3. Lineage P.1 was rst detected in four travelers
returning from the Amazonas state on 2nd January 2021 3 and soon later recognized as an emergent
lineage in Manaus 4. The VOC P.1 harbors 21 lineage-de ning mutations, including 10 synapomorphic
mutations in the Spike protein (L18F, T20N, P26S, D138Y, R190S, K417T, E484K, N501Y, H655Y, T1027I).
The emergence of P.1 was alleged as one of the putative causes of the second wave of COVID-19 in
Manaus 5. However, the precise relationship between circulating SARS-CoV-2 variants and epidemic
dynamics in the Amazonas remains unclear due to the paucity of viral sequences sampled in this
Brazilian state before December 2020.

Results
Evidence of successive SARS-CoV-2 lineage replacements in Amazonas. To have a more in-depth
understanding of the genetic diversity of the SARS-CoV-2 variants circulating in the Amazonas state since
                                                 Page 3/21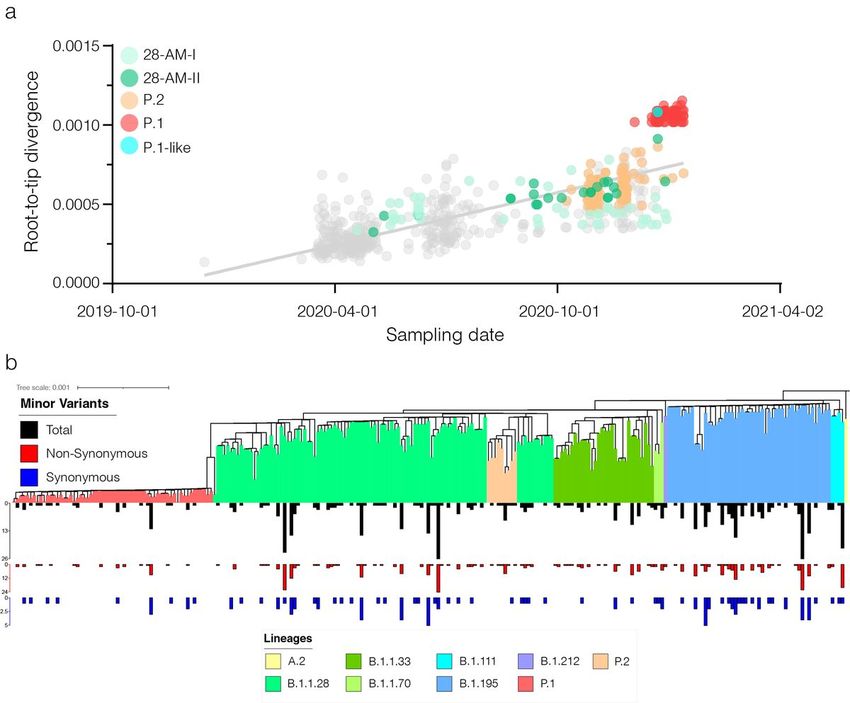
the early epidemic phase, we generated 250 SARS-CoV-2 high-quality whole-genome sequences from
individuals living in 25 municipalities of the Amazonas state between 16th March 2020 and 13th January
2021 (Figs. 1a and 1b). Viral sequences were generated at FIOCRUZ Amazônia, which is part of both the
Amazonas state health genomics network and the o cial consortium “FIOCRUZ Genomics Network” of
the Brazilian Ministry of Health, for diagnostics and genomic surveillance of the SARS-CoV-2 in Brazil
(http://www.genomahcov. ocruz.br/). Our genomic survey revealed that most sequences were classi ed
into ve lineages: B.1.1.28 (n = 93; 37%), P.1 (n = 60; 24%), B.1.195 (n = 49; 20%), B.1.1.33 (n = 29; 12%)
and P.2 (n = 9; 4%) (Supplementary Table 1), with a changing temporal prevalence over time (Fig. 1c). The
lineage B.1.195 was the most prevalent variant during the rst exponential growth phase. However, its
prevalence gradually decreased after the rst epidemic peak in early May and was surpassed by lineage
B.1.1.28. This lineage persisted as the most prevalent one from May to December 2020, when the second
lineage replacement took place, coinciding with the second phase of exponential growth. The VOC P.1
was rst detected on 4th December 2020 in Manaus and displayed an extremely rapid increase in
prevalence up to January 2021.

To better estimate the temporal trajectory of the P.1 emergence in the Amazonas state in late 2020 and
early 2021, we designed a real-time PCR assay to detect the deletion at orf1b (NSP6: S106del, G107del,
F108del), which is a genetic signature of the VOCs (P.1, B.1.1.7 and B.1.351). Thus, we evaluate all SARS-
CoV-2 positive samples available between 1st November 2020 and 31st January 2021 that were not
sequenced. None of the SARS-CoV-2 positive samples genotyped by real-time PCR before 16th December
was positive for the NSP6 deletion, supporting our sequencing results that indicate a very low prevalence
of VOC P.1 before mid-December 2020 in Amazonas. However, positive samples for the NSP6 deletion
were quite frequent in the second half of December 2020 and January 2021. The combined results of
genomic sequencing and real-time PCR testing support the sharp increase of lineage P.1 prevalence in the
Amazonas state, from 0% in November 2020 (n = 0/88), to 4% in 1st-16th December 2020 (n = 2/54), 45%
in 17th-31st December 2020 (n = 104/232), and 73% in 1st-15th January 2021 (n = 119/162) (Fig. 1d).

Major SARS-CoV-2 local clades drove the COVID-19 epidemic in the Amazonas state. Time-scale
maximum likelihood (ML) phylogeographic analyses support at least 36 importation events of the
widespread Brazilian lineages B.1.1.28 (n = 20), P.2 (n = 8), and B.1.1.33 (n = 8) into the Amazonas state;
mostly from the Southeastern (69%) and Southern (14%) Brazilian regions (Figs. 2a and 2b). Despite
multiple seeding events, most B.1.1.28 and B.1.1.33 viruses from the Amazonas state branched in three
highly supported (approximate likelihood-ratio test [aLRT] > 80%) local clades (Figs. 2a and 2b). The
clades 28-AM-I and 28-AM-II comprised 49% (n = 46) and 26% (n = 24) of all B.1.1.28 sequences from
Amazonas, respectively, and clade 28-AM-II further gave origin to lineage P.1. The clade 33-AM-I
comprises 48% (n = 14) of all B.1.1.33 sequences from Amazonas here detected. Bayesian
phylogeographic analysis of the B.1.195 sequences sampled worldwide, by contrast, support a single
importation event of this lineage in the Amazonas state either from other Brazilian states (posterior
probability [PSP] = 0.61) or from abroad (PSP = 0.39) (Fig. 2c). The clustering of B.1.195 Amazonian
sequences in a single highly supported (PP = 0.92) monophyletic clade (195-AM) was resolved after
incorporating a nine nucleotide deletion at Nsp1 (delta 640–648: K141, S142, F143) as an informative
                                                  Page 4/21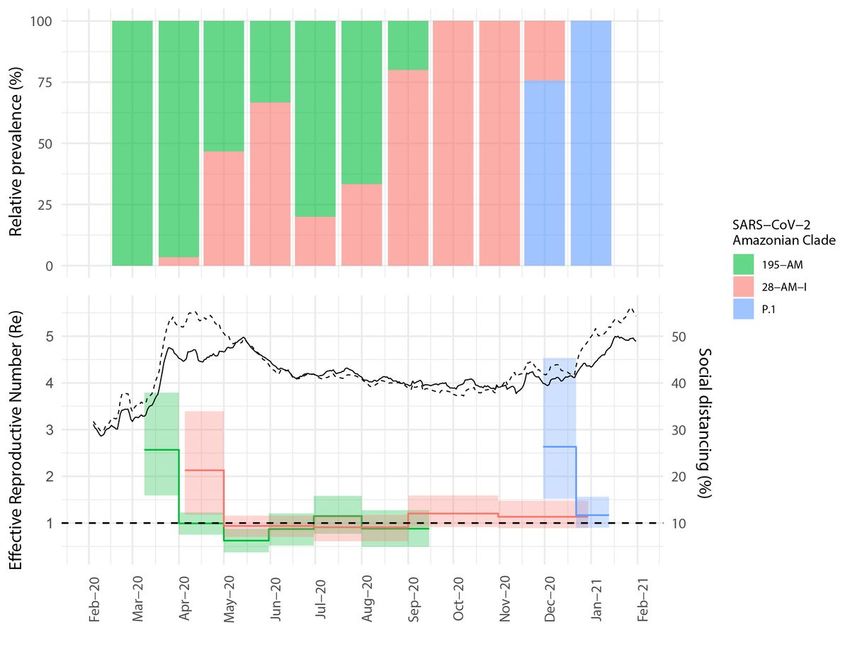
trait in phylogenetic reconstruction using a Bayesian framework. Such deletion was the only molecular
signature of clade 195-AM and was also detected in three sequences sampled outside Brazil that were
nested within clade 195-AM: two from the Colombian Amazonian region and one from a Japanese
traveler returning from Amazonas.

Analysis of the identi ed Amazonian clades revealed single lineage-de ning mutations in clades 28-AM-I
(C29284T), 28-AM-II (A6613G), and 33-AM-I (A28108C, ORF8:Q72P), relative to other B.1.1.28 and
B.1.1.33 Brazilian sequences. Furthermore, only one signature mutation at the Spike (V1176F)
distinguishes Amazonian lineages B.1.1.195 and B.1.1.28, which contrasts with the high number of
mutations accumulated by the lineage P.1. A closer inspection of the genetic diversity within the
Amazonian clade 28-AM-II further revealed a P.1-like sequence sampled in Manaus on 23rd December
2020 that branched basal to the P.1 lineage and also accumulated an unusually high number of genetic
changes concerning other B.1.1.28 Brazilian sequences (Fig. 3a). The P.1-like sequence harbors 6/10 P.1
lineage-de ning mutations in the Spike protein, including those at the RBD domain (K417T, E484K, and
N501Y) (Supplementary Table 1). To investigate the events underlying P1 and P1-like lineages'
emergence, we analyzed the intrahost SARS-CoV-2 variability in our samples. We found a total of 484
well-supported minor variants (MVs) with a predominance of non-synonymous (n = 368) over
synonymous (n = 105) substitutions (Fig. 3b). However, no MVs corresponding to the Spike lineage-
de ning mutations of clades P.1 and P.1-like were identi ed (Supplementary Table 2). Furthermore, the
frequency of MVs observed in samples taken during the early (March-September) and late (October-
January) epidemic phases were comparable (Extended Data Fig. 1).

Differences in the epidemic trajectory of major SARS-CoV-2 Amazonian clades. Reconstruction of the
spatiotemporal dissemination dynamic using a Bayesian phylogeographic approach supports that the
early prevalent local clade 195-AM probably emerged in mid-March 2020 in the city of Manaus
(Supplementary Table 3). Consequently, this lineage quickly spread from Manaus to several
municipalities of the Manaus metropolitan region and inner Amazonas state (Figs. 4a and 4b). The origin
of clades 28-AM-I and 28-AM-II was estimated to be in late March 2020 (Supplementary Table 3) in the
area comprising Manacapuru, Iranduba, and Manaquiri municipalities, located on the Solimoes river, and
from this area these clades were disseminated to Manaus and other inner municipalities (Figs. 4c to 4f).
The clade 33-AM-I probably arose in late April (Supplementary Table 3) and remained restricted to the city
of Manaus. Finally, our analyses indicate the VOC P.1 probably arose in Manaus around late November
2020 (Supplementary Table 3) and rapidly spread to other municipalities of the metropolitan region and
also to municipalities located up to 1,100 km distant from Manaus, at the border with Peru, Colombia and
Venezuela (Figs. 4e and 4f). These analyses further traced the most recent common ancestor of lineages
P.1 and P.1-like to the Manaus city in late August (Supplementary Table 3).

We next applied the birth-death skyline (BDSKY) model to estimate the effective reproductive number (Re)
of the Amazonian clades with more than 40 genomes. The estimated Re trajectories matched the relative
prevalence of lineages and social distancing metrics (Fig. 5) very closely. The Re of clade 195-AM was
high (2.6, 95% HPD: 1.6–3.8) in March, but displayed a steep decrease to 1.0 (95% HPD: 0.8–1.2) in April,
                                                 Page 5/21
coinciding with an increase of social distancing above 50% in Manaus. Clade 28-AM-I, which was
estimated to have emerged in Amazonas countryside municipalities, also presented a high Re (2.1, 95%
HPD: 1.2–3.4) in its initial spread, reducing to 0.9 (95% HPD: 0.7–1.2) in May, when the social distancing
index reached 50% in the interior of Amazonas state. The increasing relative prevalence of clade 28.AM-I
over clade 195-AM from April to June agrees with the estimated Re differences during April. From June to
August 2020, the Re of clades 195-AM and 28-AM-I remained roughly stable around 1.0, as well as their
relative prevalence. When the social distancing index decreased to below 40% in September 2020, the
clade 195-AM became apparently extinct while the Re of the clade 28-AM-I increased to 1.2 (95% HPD:
0.9–1.6) and then remained roughly stable above 1.0 up to the end of 2020, leading to an increasing
prevalence of clade 28-AM-I between September and November 2020. The lineage P.1 arose in late
November and displayed a high Re of 2.6 (95% HPD: 1.5–4.5) during December 2020, becoming the
predominant lineage. With the consequently increased social distance after the health system collapse,
this VOC's Re was estimated to decrease to 1.2 (95% HPD: 0.9–1.6) in late December and January.
SARS-CoV-2 P.1 infections are associated with higher viral loads. The estimated Re trajectories of SARS-
CoV-2 Amazonian lineages support that VOC P.1 could be more transmissible than earlier prevalent viral
lineages circulating in Amazonas. To test whether this estimated Re difference might re ect a distinct
virological phenotype, we used the real-time RT-PCR cycle threshold (Ct) scores as a proxy of the viral
load in the upper respiratory tract (URT) of P.1-positive and P.1-negative samples collected at similar time
from the onset of symptoms (Fig. 6 and Supplementary Table 4). Our analysis revealed a signi cant
(Mann-Whitney test, P < 0.0001) lower median score in URT samples from P.1-infected (Ct = 19.8)
compared with non-P.1-infected (Ct = 23.0) subjects, indicating that viral load was ~ 10-fold higher in P.1
infections than in non-P.1 infections. The Ct scores of P.1 infections were signi cantly lower than of non-
P.1 infections in adult (18–59 years old) men (P = 0.0005), adult women (P < 0.0001), and old (> 59 years
old) women (P = 0.0149); but not signi cantly different in old men (P = 0.4624). As expected, non-P.1
infected old men displayed higher viral load (Ct = 20.8) than adults male (Ct = 22.7) and female of all
ages (Ct = 23.8). Old P.1-infected male, by contrast, displayed viral load (Ct = 19.8) similar to adult male
(Ct = 19.4) and female of all ages (Ct = 20.1), suggesting that P.1-infected individuals above 18 years old
could be equally infectious, irrespective of sex and age.
Discussion
The present study is the most comprehensive SARS-CoV-2 genomic investigation performed to date in
Amazonas, one of the most heavily hitten Brazilian states by the COVID-19 pandemic. Our genomic
analyses revealed that most Amazonian cases were driven by the successful dissemination of a few
local viral clades that together comprise 77% of the 250 SARS-CoV-2 Amazonian genomes here sampled
between March 2020 and January 2021. Early major SARS-CoV-2 Amazonian clades arose in Manaus or
at the metropolitan region between mid-March and late April 2020 and were widely disseminated within
the Amazonas state, reaching the most isolated inner localities. By contrast, we found almost no
evidence of disseminating early local SARS-CoV-2 Amazonian lineages outside the state, supporting that
Amazonas has not been a major hub of viral dissemination within Brazil during 2020. The low land
Page 6/21accessibility of major Amazonian cities from other Brazilian states, combined with the considerable
reduction in tourism activities and air tra c during 2020, might have signi cantly reduced the chance of
exportation of Amazonian SARS-COV-2 variants to other Brazilian regions. However, travels during
Christmas and New Year celebrations, combined with the emergence of a potentially more transmissible
VOC P.1, might have changed this scenario.
Two SARS-CoV-2 lineage replacements characterized the COVID-19 epidemic in the Amazonas state
during early and late 2020. The rst lineage replacement started after the rst epidemic peak and was a
gradual process of nearly ve months during which lineage B.1.1.28 progressively substituted lineage
B.1.195 that was the dominant variant at the rst epidemic wave. Our analyses suggest that
epidemiological rather than virological factors probably drove this rst lineage replacement. The SARS-
CoV-2 Amazonian clades 28-AM-I and 28-AM-II, which became the dominant variants in the phase
between peaks, displayed only single lineage-de ning synonymous mutations, with few synapomorphic
differences at the Spike protein concerning clade 195-AM and evolved at a relatively constant rate
between April and November 2020. The most notable difference was that clade 195-AM arose in the city
of Manaus, and its Re was signi cantly reduced around mid-April when social distancing in Manaus
increased to > 50%. Clades 28-AM-I and 28-AM-II, by contrast, arose outside the city of Manaus and the Re
of clade 28-AM-I remained above 1.0 until mid-May 2020, when social distancing outside the capital city
increased to > 50%. When mitigation measures were relaxed, and the social distancing index fell below
40% in September 2020, the Re of clade 28-AM-I returned to above 1.0, while the clade B.1.195 became
extinct, completing the lineage replacement process. Thus, the lower social distancing observed in the
Amazonas state's interior municipalities compared to Manaus was the probable driver of the rst lineage
replacement.
A study of blood donors conducted in Manaus estimated that the rst wave of SARS-CoV-2 infected 76%
(95% CI 67–98) of the city’s population by October 2020, suggesting that herd immunity had already been
reached 6. Assuming that reinfection is rare and that immunity against infection did not signi cantly
wane by December 2020, a second COVID-19 wave would not be expected so early. Several hypotheses
were proposed to explain this unexpected second wave that resulted in the collapse of the health system
in Manaus in December 2020 and January 2021 5. Our ndings support that non-pharmaceutical
interventions (NPI) could explain a large portion of the epidemic dynamics in Amazonas. A drastic
reduction in the median Re (from 2.1–2.6 to 0.9-1.0) for Amazonian lineages B.1.195 and B.1.1.28
around April-May 2020, was reconstructed in our analysis. This is entirely consistent with the epidemic
trajectories estimated from epidemiological modeling 7,8 and further coincides with the timing of
implementation of NPIs that effectively increased social distancing in Amazonas. This evidence indicates
that the rst epidemic wave in Amazonas was brought under relative control by the implementation of
NPIs, before herd-immunity. Our results also con rm that NPIs were not stringent enough to consistently
reduce the Re of SARS-CoV-2 Amazonian lineages to below 1.0 and that a stationary state of endemic
community transmission was maintained from May to September 2020 7,8.
Page 7/21September 2020 onwards, mitigation measures were relaxed, and the Re of clade 28-AM-I returned to
above 1.0. Notwithstanding, the second epidemic wave only started in December 2020, coinciding with
the emergence of the VOC P.1 and the second lineage replacement event. Several complementary
evidence supports that these events were probably driven by the emergence of a more transmissible VOC
P.1 in a context of relaxed social distancing. First, the second lineage replacement event was an abrupt
process as the VOC P.1 evolved from the local clade 28-AM-II around late November 2020, and it took less
than two months to become the dominant variant. Second, the estimated median Re of the VOC P.1
during December 2020 was 2.2 times higher than that estimated for clade 28-AM-I in the same period,
indicating that P.1 could have been nearly two times more transmissible than the co-circulating B.1.1.28
parental lineage. Third, the level of SARS-CoV-2 RNA (estimated from the median Ct) in the URT samples
from P.1 infections, particularly from adults (18–59 years old), was ~ 10-fold higher than the level
detected in non-P.1 infections; suggesting that P.1-infected adult individuals are more infectious than
those harboring non-P.1 viruses 9,10. Phylodynamic modeling also indicates that NPIs implemented in
Manaus since the late-December were effective to reduce the median Re of the VOC P.1 ~ 50% (from 2.6
to 1.2), but probably failed to bring the epidemic under control (Re < 1.0), allowing the continued spread of
this VOC in the Amazonas state.
Understanding the factors that drive the emergence and expansion of VOC harboring key mutations in the
RBD of the Spike protein is of crucial importance. One hypothesis is that VOC evolved by the selective
pressure of a large number of people having developed antibodies against SARS-CoV-2. Our study
revealed no unusual pattern of intrahost viral variability in the Amazonian clades between April and
December 2020, showing that the local emergence of VOC in heavily affected regions is an evolutionary
event challenging to anticipate from the analysis of parental lineages. Concurrently, we identi ed a P.1-
like virus in Manaus in December 2020 that harbors several of the P.1 lineage-de ning mutations and
probably shared a most recent common ancestor with lineage P.1 in September 2020. This nding
revealed that the diversity of SARS-CoV-2 variants carrying mutations of concern at the Spike protein in
Manaus could be larger than initially described and that those variants probably circulated for some time
before the expansion of lineage P.1. Although only the lineage P.1 seems to have displayed a rapid
dissemination so far, our ndings alert for the potential spread of other P.1-related VOC in the Amazonas
state and for the importance of a continuous molecular surveillance system to track the viral diversity in
real-time in Brazil.
These ndings collectively support those lineage replacements could be a recurrent phenomenon in the
local evolution of SARS-CoV-2 driven by ecological and virological factors. Moreover, our ndings indicate
that NPIs deployed in the Amazonas state in April 2020 were su ciently effective to reduce the Re of
early prevalent local SARS-CoV-2 clades. In contrast, NPIs were insu cient to bring the epidemic under
control, allowing the establishment and local persistence of several endemic viral lineages and
subsequent emergence of the VOC P.1 in late November 2020. The lack of e cient social distancing and
other mitigation measures probably accelerated the early transmission of VOC P.1, while the high
transmissibility of this VOC further fueled the rapid upsurge in SARS-CoV-2 cases and hospitalizations
Page 8/21observed in Manaus following its emergence. The feeble adoption of non-pharmaceutical interventions
as it occurred in Amazonas and other Brazilian states represents a signi cant risk for the continuous
emergence and dissemination of new variants. Implementing e cient mitigation measures combined
with massive vaccination will be crucial to control the spread of SARS-CoV-2 VOCs in Brazil.
Materials And Methods
SARS-CoV-2 samples and ethical aspects. We collected nasopharyngeal and pharyngeal swabs (NPS)
from 644 residents in the Amazonas state which were positively tested by Real-Time PCR as a routine
diagnostic for COVID-19 using any of the following different commercial assays: SARS-CoV2 (E/RP)
(Biomanguinhos); Allplex 2019-nCoV Assay (Seegene) or an in-house protocol following the USA/CDC
guidelines (https://www.fda.gov/media/134922/download). Among those 644 NPS samples, 250 were
submitted to nucleotide sequencing and other 394 were evaluated for P.1/VOCs by the real-time PCR
developed in this study. Fiocruz/ILMD is one of the o cial labs for SARS-CoV-2 testing under the
auspices of a network coordinated by the Amazonas State Health Foundation (FVS-AM) and the Brazilian
Ministry of Health. This study was conducted as a request of the SARS-CoV-2 surveillance program of
FVS-AM and was approved by the Ethics Committee of the Amazonas State University CAAE:
25430719.6.0000.5016.
SARS-CoV-2 P.1/VOCs detection by Real-time PCR. A total of 394 SARS-CoV-2 positive samples collected
from 1st November to 13th January were submitted to a real-time PCR screening test designed for
detection of VOCs that use a forward primer (P1/VOCs-FNF 5'- GGGTGATGCGTATTATGACATGGTTGG), a
reverse primer (P1/VOCs-FNR 5'- CTAGCACCATCATCATACACAGTTCTTGC) and a probe (P1/VOCs-FNP
5'(ZEN)- TGGTTGATACTAGTTTGAAGCTAAAA) to detect the deletion in the ORF1b (NSP6: S106del,
G107del, F108del) found in the three VOCs (P.1; B.1.1.7 and B.1.351), both primers were used at 300nM
and probe at 150nM ( nal concentration) with TaqMan one-step Fast Virus master Mix (ThermoFisher
Scienti c). We validated this assay against 89 high-quality full SARS-CoV-2 genomes, 39 non-P.1 and 48
P.1 (further details in the Supplementary Table 5). All oligos used in this study were manufactured by IDT
DNA (https://www.idtdna.com/). Because we do not detect circulation of VOCs B.1.1.7 and B.1.351 in the
Amazonas state, we use the frequency of NSP6 deletion target among PCR positives as a reliable proxy
for frequency of the VOC P.1.
SARS-CoV-2 ampli cation and sequencing. A total of 250 SARS-CoV-2 positive samples (122 male, 128
female; median age 43-year-old IQR 32-46) collected from residents of 25 out of 62 municipalities of the
Amazonas state, including the capital Manaus, between 13th March and 13th January were subjected to
ampli cation and NGS sequencing as previously described 1, now with a reduced number of amplicons
(nine instead of 15) of a mean average size of ~3,500bp 2. Brie y, RNAs were extracted with Maxwell®
RSC Viral Total Nucleic Acid Puri cation Kit (Promega) and then converted to cDNA with Superscript IV
reverse transcriptase (ThermoFisher Scienti c). Amplicons covering the entire SARS-CoV-2 genome were
ampli ed with SuperFi II Green PCR master mix (ThermoFisher Scienti c), precipitated with PEG 8000
(Promega), and quanti ed using a uorimeter. Pooled amplicons of each sample were used to prepare
Page 9/21NGS libraries with Nextera XT and clustered with MiSeq Reagent Kit v2 (500-cycles) on 2 x 150 cycles
paired-end runs (Illumina).
SARS-CoV-2 whole-genome consensus sequences and genotyping. FASTQ reads were generated by the
Illumina pipeline at BaseSpace (https://basespace.illumina.com). All les were downloaded and imported
into Geneious v10.2.6 for trimming and assembling using a customized work ow employing BBDuk and
BBMap tools (v37.25) and the NC_045512.2 RefSeq as a template. Using this approach, we generated
consensus sequences with mean depth coverage of 2,600X, excluding duplicate reads. Whole-genome
SARS-CoV-2 consensus sequences were initially assigned to viral lineages according to the nomenclature
proposed by Rambaut et al. (doi.org/10.1038/s41564-020-0770-5), using the Pangolin web application
(https://pangolin.cog-uk.io) and later con rmed using phylogenetic analyses as explained below.
Intra-host SARS-CoV-2 genomic variability. Raw sequencing reads and primer sequences were removed
with Trimmomatic 0.26 3 using default parameters. Reads that passed quality ltering were then mapped
against the Wuhan SARS-CoV-2 reference genome (NC_045512.2) using Bowtie2 software 4. A .bed le
was generated with bedtools v 2.15.0 5, samtools 6 and vcftools v 0.1.13 7 using the internal parameter
vcf-annotated (parameters- lter Qual = 20/MinDP = 100/SnpGap = 20, meaning that only nucleotide
variants supported by reads with mapping quality >= 20 and at least 100 sequencing coverage depth
would be retained in the intermediate variant call le). To characterize the viral intra-host population, we
identi ed all minor variants (MVs) found in the samples, that is, highly supported nucleotides that are
supported by 10 to 49% of the reads in a given position, and that was not added in the nal majority
consensus genome. We then replaced the nucleotide supported by the majority of the reads by the MVs in
the consensus genome to evaluate the impact of the synonymous and nonsynonymous nucleotide
variation between the major and minor variants. We performed the synonymous and nonsynonymous
analysis using a R pipeline developed for SARS-CoV-2 (10.3389/fmicb.2020.01800).
Discrete Maximum likelihood and Bayesian phylogeography. All high quality (29
kb) SARS-CoV-2 genomes of lineages B.1.1.28 (n = 512) and B.1.1.33 (n = 595) sampled in Brazil and of
lineage B.1.195 sampled worldwide (n = 110), that were available on GISAID (https://www.gisaid.org/) as
of January 13, 2021, were downloaded. SARS-CoV-2 complete genome sequences were aligned using
MAFFT v7.467 8. The B.1.1.28 and B.1.1.33 datasets were subject to maximum likelihood (ML) and
phylogenetic analysis using IQ-TREE v1.6.12 9 under the GTR + F + I + G4 nucleotide substitution model,
as selected by the ModelFinder application 10, and the branch support was assessed by the approximate
likelihood-ratio test based on the Shimodaira–Hasegawa-like procedure (SH-aLRT) with 1,000 replicates.
Time-scaled phylogeographic ML phylogenetic trees of Brazilian B.1.1.28 and B.1.1.33 datasets were
reconstructed using Treetime 11 with a xed substitution rate (8 x 10⁻⁴ substitutions/site/year) coupled
with an ancestral character reconstruction (ACR) of epidemic locations using PASTML 12 with Marginal
Posterior Probabilities Approximation (MPPA) with an F81-like model. A time-scaled Bayesian
phylogeographic analysis was performed for the B.1.195 sampled worldwide using the Bayesian Markov
13
Chain Monte Carlo (MCMC) approach implemented in BEAST 1.10 with BEAGLE library v3 14 to
Page 10/21improve computational time. Bayesian tree was reconstructed using the GTR + F + I + G4 nucleotide
substitution model, the non-parametric Bayesian skyline (BSKL) model as the coalescent tree prior 15, a
strict molecular clock model with a uniform substitution rate prior (8 x 10⁻⁴ substitutions/site/year) and a
reversible discrete phylogeographic model 16 with a continuous-time Markov chain (CTMC) rate reference
prior 17. Three MCMC chains were run for 100 million generations and then combined to ensure
stationarity and good mixing. Convergence (effective sample size> 200) in parameter estimates was
assessed using TRACER v1.7 18. The maximum clade credibility (MCC) tree was summarized with
TreeAnnotator v1.10. ML and MCC trees were visualized using FigTree v1.4.4
(http://tree.bio.ed.ac.uk/software/ gtree/).
Continuous Bayesian phylogeography. The phylogenetic diffusion of the SARS-CoV-2 clades from
Amazonas state was estimated with the heterogeneous relaxed random walk (RRW) model and a Cauchy
distribution 19, previously applied to SARS-CoV-2 in Brazil 20, using BEAST v.1.10.4 as explained
above. The viral spatio-temporal diffusion was analyzed and visualized in SPREAD 21 and further
projected in maps generated with the QGIS software (http://qgis.org) using public access data
downloaded from the GADM database (https://gadm.org).
Effective Reproductive Number (Re) Estimation. To estimate the Re of the Amazonian SARS-CoV-2 clades
through time, we used the birth-death skyline (BDSKY) model 22 implemented within BEAST2 v2.6.2 23.
The sampling rate (d) was set to zero for the period before the oldest sample and estimated from the
data afterward. The BDSKY prior settings for the BDSKY model were as follows: Become Uninfectious
Rate (exponential, mean = 36); Reproductive Number (log normal, mean = 0.8, sd = 0.5); Sampling
Proportion (beta, alpha = 1, beta = 100). Origin parameter was conditioned to the root height, and the Re
was estimated in a piecewise manner over six time-intervals (monthly) to the 195-AM clade, ve time-
intervals (bimonthly) to the 28-AM-I clade and two equal time-intervals to the P.1 clade. Time-intervals
were de ned from the date of the most recent sample up to the root of the tree. One MCMC chain was run
for 20 million generations and then checked for stationarity and mixing, as explained above.
Statistical analysis. Descriptive statistics, test for normal distribution (D'Agostino & Pearson and
Anderson-Darling), and the non-parametric Mann-Whitney test were used to compare the cycle threshold
(Ct) of SARS-CoV-2 RT-PCR positive samples from the upper respiratory tract of patients infected with P.1
vs. non-P.1 viruses. Only Ct values from samples analyzed with the same RT-PCR diagnostic assay (e.g.,
the CDC assay) were compared. The threshold for statistical signi cance was set to P < 0.05. Graphics
and statistical analyses were performed using GraphPad v9.01 and 9.02 (Prism Software, United States).
Declarations
Acknowledgements
The authors wish to thank all the health care workers and scientists who have worked hard to deal with
this pandemic threat, the GISAID team, and all the EpiCoV database's submitters, in particular, the
Page 11/21Japanese National Institute of Infectious Diseases (NIID) members Dr. Tsuyoshi Sekizuka, Dr. Kentaro
Itokawa, Rina Tanaka and Masanori Hashino to publish the genomes. GISAID acknowledgment table
containing sequences used in this study is shown in Supplementary Table 6. We would also wish to
thank Dr. Nuno Faria from https://www.caddecentre.org for sharing their unpublished ndings regarding
the SARS-CoV-2 B.1.1.28 lineage. We also appreciate the support of Genomic Coronavirus Fiocruz
Network members and the Respiratory Viruses Genomic Surveillance Network of the General Laboratory
Coordination (CGLab) of the Brazilian Ministry of Health (MoH), Brazilian Central Laboratory States
(LACENs), and the Amazonas surveillance teams for the partnership in the viral surveillance in Brazil.
Funding support FAPEAM (PCTI-EmergeSaude/AM call 005/2020 and Rede Genômica de Vigilância em
Saúde - REGESAM); Conselho Nacional de Desenvolvimento Cientí co e Tecnológico (grant
403276/2020-9); Inova Fiocruz/Fundação Oswaldo Cruz (Grant VPPCB-007-FIO-18-2-30 - Geração de
conhecimento). In the loving memory of all we have lost due COVID-19.
Author contributions
FGN contributed to writing of the report, data analysis, laboratory management, and obtaining nancial
support. VN, VS, AC, FN, GS, AC, DD, KP, MM, MJB, MJ, and LG contributed to diagnostics and sequencing
analysis. CFC, VS, DB, MS, TM, GP, LA, JHS contributed to patient and public health surveillance data. IA,
FZD contributed to formal data analysis of sequence diversity. MMS, GLW, PCR, ED, TG, and GB
contributed to formal data analysis, writing, and editing of the report.
Competing interests
All authors have declared that no con icts of interest exist.
Data availability
All the SARS-CoV-2 genomes generated and analyzed in this study are available at GISAID
(https://www.gisaid.org/), under the IDs EPI_ISL_792560; EPI_ISL_801386 - EPI_ISL_801403;
EPI_ISL_811148; EPI_ISL_811149; EPI_ISL_833131 - EPI_ISL_833140; EPI_ISL_1034304 -
EPI_ISL_1034306; EPI_ISL_1068078 - EPI_ISL_1068292.
References
1. Nascimento, V. A. D. et al. Genomic and phylogenetic characterisation of an imported case of SARS-
CoV-2 in Amazonas State, Brazil. Mem Inst Oswaldo Cruz 115, e200310, doi:10.1590/0074-
02760200310 (2020).
2. Amazonas., FVS. (ed Fundação em Vigilância e Saúde do Amazonas) (http://www.fvs.am.gov.br/,
2021).
3. Fujino, T. et al. Novel SARS-CoV-2 Variant Identi ed in Travelers from Brazil to Japan. Emerg Infect
Dis 27, doi:10.3201/eid2704.210138 (2021).
Page 12/214. Faria, N. C., M.I.; Candido, D., Franco, L.A.M; Andrade, P.; Coletti, T.; Silva, C.A.M, Sales, F.C, Manuli,
E.R.; Aguiar, R.A; Gaburo N.; Camilo, C.C.; Fraiji, N.A.; Crispim, C.A.E.; Carvalho, M.P.S.S.; Rambaut, A.;
Loman, N., Pybus, O.; Sabino, E.; on behalf of CADDE Genomic Network;. Genomic characterisation of
an emergent SARS-CoV-2 lineage in Manaus: preliminary ndings. Virologica.org, (2021).
.
5. Sabino, E. C. et al. Resurgence of COVID-19 in Manaus, Brazil, despite high seroprevalence. Lancet
397, 452–455, doi:10.1016/S0140-6736(21)00183-5 (2021).
6. Buss, L. F. et al. Three-quarters attack rate of SARS-CoV-2 in the Brazilian Amazon during a largely
unmitigated epidemic. Science 371, 288–292, doi:10.1126/science.abe9728 (2021).
7. Mellan, T. A. et al. Subnational analysis of the COVID-19 epidemic in Brazil. medRxiv,
doi:10.1101/2020.05.09.20096701 (2020).
8. He, D., Artzy-Randrup, Y., Musa, S. S. & Stone, L. The unexpected dynamics of COVID-19 in Manaus,
Brazil: Herd immunity versus interventions. medRxiv, doi:10.1101/2021.02.18.21251809 (2021).
9. Singanayagam, A. et al. Duration of infectiousness and correlation with RT-PCR cycle threshold
values in cases of COVID-19, England, January to May 2020. Euro Surveill 25, doi:10.2807/1560-
7917.ES.2020.25.32.2001483 (2020).
10. Jaafar, R. et al. Correlation between 3790 qPCR positives samples and positive cell cultures including
1941 SARS-CoV-2 isolates. Clin Infect Dis, doi:10.1093/cid/ciaa1491 (2020).
11. Nascimento, V. A. D. et al. Genomic and phylogenetic characterisation of an imported
case of SARS-CoV-2 in Amazonas State, Brazil. Mem Inst Oswaldo Cruz 115, e200310,
doi:10.1590/0074-02760200310 (2020).
12. Naveca F., C. C., Nascimento V., Souza V., Corado A., Nascimento F., Costa A., Duarte
D., Silva G., Mejía M., Pessoa K., Gonçalves L., Brandão M.J., Jesus M., Pinto R., Silva
M., Mattos T., Abdalla L., Santos J.H., Costa-Filho R., Wallau G.L., Siqueira M.,
Delatorre E., Gräf T., Bello G., Resende P.R. SARS-CoV-2 reinfection by the new
Variant of Concern (VOC) P.1 in Amazonas, Brazil. Virological.org (2021).
.
13. Bolger, A. M., Lohse, M. & Usadel, B. Trimmomatic: a flexible trimmer for Illumina
sequence data. Bioinformatics 30, 2114-2120, doi:10.1093/bioinformatics/btu170
(2014).
14. Langmead, B. & Salzberg, S. L. Fast gapped-read alignment with Bowtie 2. Nat
Methods 9, 357-359, doi:10.1038/nmeth.1923 (2012).
15. Quinlan, A. R. BEDTools: The Swiss-Army Tool for Genome Feature Analysis. Curr
Protoc Bioinformatics 47, 11 12 11-34, doi:10.1002/0471250953.bi1112s47 (2014).
16. Li, H. et al. The Sequence Alignment/Map format and SAMtools. Bioinformatics 25,
2078-2079, doi:10.1093/bioinformatics/btp352 (2009).
Page 13/2117. Danecek, P. et al. The variant call format and VCFtools. Bioinformatics 27, 2156-2158,
doi:10.1093/bioinformatics/btr330 (2011).
18. Katoh, K. & Standley, D. M. MAFFT multiple sequence alignment software version 7:
improvements in performance and usability. Mol Biol Evol 30, 772-780,
doi:10.1093/molbev/mst010 (2013).
19. Nguyen, L. T., Schmidt, H. A., von Haeseler, A. & Minh, B. Q. IQ-TREE: a fast and
effective stochastic algorithm for estimating maximum-likelihood phylogenies. Mol Biol
Evol 32, 268-274, doi:10.1093/molbev/msu300 (2015).
20. Kalyaanamoorthy, S., Minh, B. Q., Wong, T. K. F., von Haeseler, A. & Jermiin, L. S.
ModelFinder: fast model selection for accurate phylogenetic estimates. Nat Methods 14,
587-589, doi:10.1038/nmeth.4285 (2017).
21. Sagulenko, P., Puller, V. & Neher, R. A. TreeTime: Maximum-likelihood phylodynamic
analysis. Virus Evolution 4, doi:10.1093/ve/vex042 (2018).
22. Ishikawa, S. A., Zhukova, A., Iwasaki, W. & Gascuel, O. A Fast Likelihood Method to
Reconstruct and Visualize Ancestral Scenarios. Molecular Biology and Evolution 36,
2069-2085, doi:10.1093/molbev/msz131 (2019).
23. Suchard, M. A. et al. Bayesian phylogenetic and phylodynamic data integration using
BEAST 1.10. Virus Evol 4, vey016, doi:10.1093/ve/vey016 (2018).
24. Suchard, M. A. & Rambaut, A. Many-core algorithms for statistical phylogenetics.
Bioinformatics 25, 1370-1376, doi:10.1093/bioinformatics/btp244 (2009).
25. Drummond, A. J., Rambaut, A., Shapiro, B. & Pybus, O. G. Bayesian coalescent
inference of past population dynamics from molecular sequences. Mol Biol Evol 22,
1185-1192, doi:10.1093/molbev/msi103 (2005).
26. Lemey, P., Rambaut, A., Drummond, A. J. & Suchard, M. A. Bayesian phylogeography
finds its roots. PLoS Comput Biol 5, e1000520, doi:10.1371/journal.pcbi.1000520
(2009).
27. Ferreira, M. A. R. S., M.A. Bayesian analysis of elapsed times in continuous‐time
Markov chains. The Canadian Journal of Statistics 36, 355-368,
doi: https://doi.org/10.1002/cjs.5550360302 (2008).
28. Rambaut, A., Drummond, A. J., Xie, D., Baele, G. & Suchard, M. A. Posterior
summarisation in Bayesian phylogenetics using Tracer 1.7. Syst Biol,
doi:10.1093/sysbio/syy032 (2018).
29. Lemey, P., Rambaut, A., Welch, J. J. & Suchard, M. A. Phylogeography takes a relaxed
random walk in continuous space and time. Mol Biol Evol 27, 1877-1885,
doi:10.1093/molbev/msq067 (2010).
30. Candido, D. S. et al. Evolution and epidemic spread of SARS-CoV-2 in Brazil. Science
369, 1255-1260, doi:10.1126/science.abd2161 (2020).
Page 14/2131. Bielejec, F., Rambaut, A., Suchard, M. A. & Lemey, P. SPREAD: spatial phylogenetic
reconstruction of evolutionary dynamics. Bioinformatics 27, 2910-2912,
doi:10.1093/bioinformatics/btr481 (2011).
32. Stadler, T., Kuhnert, D., Bonhoeffer, S. & Drummond, A. J. Birth-death skyline plot
reveals temporal changes of epidemic spread in HIV and hepatitis C virus (HCV). Proc
Natl Acad Sci U S A 110, 228-233, doi:10.1073/pnas.1207965110 (2013).
33. Bouckaert, R. et al. BEAST 2.5: An advanced software platform for Bayesian
evolutionary analysis. PLoS Comput Biol 15, e1006650,
doi:10.1371/journal.pcbi.1006650 (2019).
Figures
Figure 1
Geographic and temporal distribution of SARS-CoV-2 positive samples and viral lineages in the
Amazonas state. a) Graph depicting the temporal evolution of SARI cases/deaths (source
http://info.gripe. ocruz.br) and burials (source SEMULSP-Manaus) as a proxy for the COVID-19 epidemic
Page 15/21curve in the Amazonas state, along with the number of SARS-CoV-2 whole-genome sequences generated
in this study. b) Map of the Amazonas state showing the municipalities covered by the SARS-Cov-2
sequences generated in this study. c) Prevalence of major SARS-CoV-2 lineages between March 2020 and
January 2021 estimated from the whole-genome sequencing. d) Prevalence of SARS-CoV-2 lineages P.1
and non-P.1 between November 2020 and January 2021 estimated from the whole-genome sequencing
and real-time PCR screening.
Figure 2
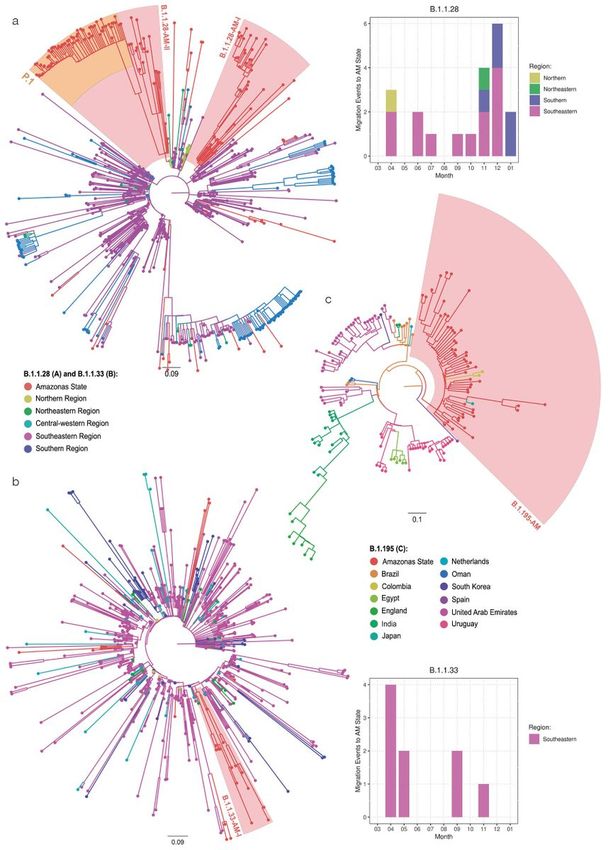
Page 16/21. Origin of major SARS-CoV-2 lineages circulating in the Amazonas state. a-b) ML phylogeographic
analysis of lineages B.1.1.28 and B.1.1.33 in Brazil. Graphs depict the estimated numbers of
introductions into Amazonas colored by region of origin. c) Bayesian phylogeographic analysis of lineage
B.1.195 sequences sampled worldwide. Tips and branches are colored according to the sampling
location and the most probable location state of their descendent nodes, respectively, as indicated in the
legends. Shaded boxes highlight the major SARS-CoV-2 Amazonian clades. The trees were automatically
rooted under the assumption of a strict molecular clock, and all horizontal branch lengths are drawn to a
scale of years.
Figure 3
Genomic variability of SARS-CoV-2 in the Amazonas state. a) Correlation between the sampling date of
B.1.1.28, P.1, and P.2 Brazilian sequences and their genetic distance from the root of the ML phylogenetic
tree. Sequences from Amazonian clades and VOCs are colored according to the legend at left. b) ML
Page 17/21phylogenetic tree of the 250 genomes from Amazonas with lineages assignment and total (black), non-
synonymous (red), and synonymous (blue) changes estimated when incorporating the MVs into the
consensus genome.
Figure 4
Spatial dissemination of the major SARS-CoV-2 Amazonian clades. Phylogeny branches were arranged in
space according to the internal nodes’ locations inferred by the continuous phylogeographic model for
Page 18/21lineages 195-AM (a and b), 28-AM-I (c and d), and 28-AM-II (e and f). Branches were colored according to
time, as indicated by the legend. Blue shaded areas depict the phylogeographic estimates' uncertainty as
the 80% highest posterior density interval of the nodes. Panels b, d, and f depict a close view of the
migration events in the Manaus metropolitan area for each lineage. Green stars represent the estimated
location of the most recent common ancestor of each lineage. Squares represent nodes comprising P.1
lineage.
Figure 5
Epidemic temporal trajectories of major SARS-CoV-2 Amazonian clades. a) Relative prevalence of viral
Amazonian clades between March 2020 and January 2021 estimated from the whole-genome
sequencing. b) Graph depicting the temporal variation of the Re of viral Amazonian clades estimated
using the BDSKY approach along with social distancing data trends reported as percentage change
measured against baseline in Manaus (dashed line) and outside Manus (solid line). The lines represent
the weekly average (Source: http://inloco.com.br).
Page 19/21Figure 6
Viral load estimation on the upper respiratory tract by real-time RT-PCR of patients infected with P.1 vs.
non-P.1 viruses. A) Evaluation of the sample collection time from the onset of symptoms between groups.
B, C, D, E, and F) Comparison of the Ct values among different groups by sex and age range. Horizontal
bars represent sample medians and interquartile range. P values (non-parametric Mann-Whitney test) are
shown for each group.
Page 20/21Supplementary Files
This is a list of supplementary les associated with this preprint. Click to download.
2NavecaetalCOVIDAmazonasBrazilSupplementaryTable2.pdf
3NavecaetalCOVIDAmazonasBrazilSupplementaryTable6gisaid.pdf
SupplementaryTablesandFigure.docx
Page 21/21You can also read