The effect of non-pharmaceutical interventions on COVID-19 cases, deaths and demand for hospital services in the UK: a modelling study
←
→
Page content transcription
If your browser does not render page correctly, please read the page content below
The effect of non-pharmaceutical interventions on COVID-19 cases,
deaths and demand for hospital services in the UK: a modelling
study

Nicholas G. Davies*1, Adam J. Kucharski^1, Rosalind M. Eggo^1, Amy Gimma1, CMMID
COVID-19 working group†1, W. John Edmunds1

^
 Contributed equally.
1
 Department of Infectious Disease Epidemiology, London School of Hygiene & Tropical
Medicine, Keppel Street, London, WC1E 7HT, UK

†
 The Centre for Mathematical Modelling of Infectious Diseases COVID-19 working group is
(members listed in random order): Thibaut Jombart, Kathleen O'Reilly, Akira Endo, Joel
Hellewell, Emily S Nightingale, Billy J Quilty, Christopher I Jarvis, Timothy W Russell, Petra
Klepac, Nikos I Bosse, Sebastian Funk, Sam Abbott, Graham F Medley, Hamish Gibbs, Carl
A B Pearson, Stefan Flasche, Mark Jit, Samuel Clifford, Kiesha Prem, Charlie Diamond, Jon
C Emery, Arminder K Deol, Simon R Procter, Kevin van Zandvoort, Yueqian Fiona Sun,
James D Munday, Alicia Rosello, Megan Auzenbergs, Gwen Knight, Rein M G J Houben,
Yang Liu.

*
    Correspondence: nicholas.davies@lshtm.ac.uk
Abstract
Background
Non-pharmaceutical interventions have been implemented to reduce transmission of
SARS-CoV-2 in the UK. Projecting the size of an unmitigated epidemic and the potential
effect of different control measures has been critical to support evidence-based policymaking
during the early stages of the epidemic.

Methods
We used a stochastic age-structured transmission model to explore a range of intervention
scenarios, including the introduction of school closures, social distancing, shielding of elderly
groups, self-isolation of symptomatic cases, and extreme “lockdown”-type restrictions. We
simulated different durations of interventions and triggers for introduction, as well as
combinations of interventions. For each scenario, we projected estimated new cases over
time, patients requiring inpatient and critical care (intensive care unit, ICU) treatment, and
deaths.

Findings
We found that mitigation measures aimed at reducing transmission would likely have
decreased the reproduction number, but not sufficiently to prevent ICU demand from
exceeding NHS availability. To keep ICU bed demand below capacity in the model, more
extreme restrictions were necessary. In a scenario where “lockdown”-type interventions were
put in place to reduce transmission, these interventions would need to be in place for a large
proportion of the coming year in order to prevent healthcare demand exceeding availability.

Interpretation
The characteristics of SARS-CoV-2 mean that extreme measures are likely required to bring
the epidemic under control and to prevent very large numbers of deaths and an excess of
demand on hospital beds, especially those in ICUs.

                                                                                               2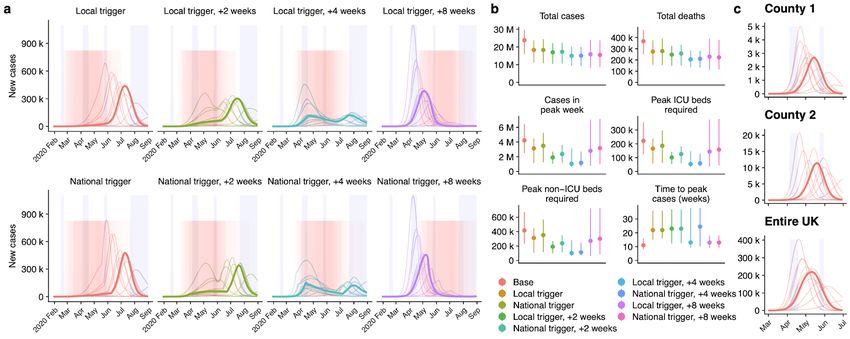
Research in Context
Evidence before this study
As countries have moved from early containment efforts to planning for the introduction of
large-scale non-pharmaceutical interventions to control COVID-19 outbreaks, epidemic
modelling studies have explored the potential for extensive social distancing measures to
curb transmission. However, it remains unclear how different combinations of interventions,
timings, and triggers for the introduction and lifting of control measures may affect the impact
of the epidemic on health services, and what the range of uncertainty associated with these
estimates would be.

Added value of this study
Using a stochastic, age-structured epidemic model, we explored how eight different
intervention scenarios could influence the number of new cases and deaths, as well as
intensive care beds required over the projected course of the epidemic. We also assessed
the potential impact of local versus national targeting of interventions, reduction in leisure
events, impact of increased childcare by grandparents, and timing of triggers for different
control measures. We simulated multiple realisations for each scenario to reflect uncertainty
in possible epidemic trajectories.

Implications of all the available evidence
Our results support early modelling findings, and subsequent empirical observations, that in
the absence of control measures, a COVID-19 epidemic could quickly overwhelm a
healthcare system. We found that even a combination of moderate interventions – such as
school closures, shielding of older groups and self-isolation – would be unlikely to prevent an
epidemic that would far exceed available ICU capacity in the UK. Intermittent periods of
more intensive lockdown-type measures are predicted to be effective for preventing the
healthcare system from being overwhelmed.

                                                                                              3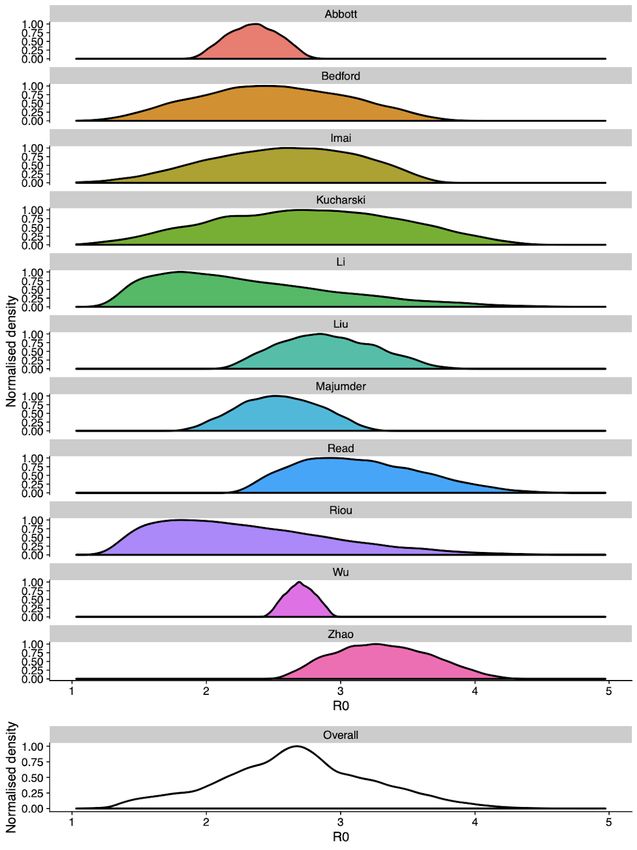
Introduction
The novel coronavirus SARS-CoV-2 has spread to multiple countries after causing an initial
outbreak of disease (COVID-19) in Wuhan, China [1]. Early evidence indicated SARS-CoV-2
was capable of sustained human-to-human transmission [2] and could cause severe disease
[3], with a higher risk of severe and fatal outcomes in older individuals [4]. The first two
cases of COVID-19 in the United Kingdom (UK) were confirmed on 31 January 2020.
Although implementation of testing, isolation and contact tracing likely slowed early
transmission [5], it was not sufficient to contain the outbreak in the UK.

Following the introduction of extensive control measures in Wuhan in late January,
including—among other measures—travel restrictions, social distancing, and requirements
for residents to stay within their homes, there was a substantial decline in local transmission
[6–8]. Social distancing measures, such as closure of schools, bars, restaurants, and
constraints on individual movements and interactions, are now in place in many countries
with the aim of reducing transmission of SARS-CoV-2 [9,10]. However, it remains unclear
precisely how the timing, duration, and intensity of different measures targeting transmission
and burden can reduce the impact of COVID-19. Here, based upon scenarios originally
presented to scientific advisory bodies in the UK, we use a mathematical model to assess
the potential impact of different control measures for mitigating the burden of COVID-19, and
evaluate possible medium-term scenarios as the most restrictive short-term measures are
eventually lifted.

Methods
Dynamic transmission model
We analysed a stochastic compartmental model stratified into 5-year age bands, with
individuals classified according to current disease status (Fig. 1) and transmission between
groups based on UK social mixing patterns ([11,12]; full details in Supplementary
Information). After infection with SARS-CoV-2 in the model, susceptible individuals pass
through a latent period before becoming infectious, either with a preclinical and then clinical
infection, or with a subclinical infection, before recovery or isolation. We refer to those
infections causing few or no symptoms as subclinical. We assume older individuals are more
likely to show clinical symptoms [11]. The model tracks 66.4 million people aggregated to the
186 county-level administrative units in England, Wales, Scotland, and Northern Ireland.

Key model parameters
We collated multiple sources of evidence to estimate key model parameters (Table S1). In a
meta-analysis, we estimated that the basic reproduction number, R0—which describes the
average number of secondary infections caused by a typical primary infection in a
completely susceptible population—was 2.7 (95% credible interval: 1.6–3.9) across settings
without substantial control measures in place. We derived age-stratified case fatality ratios
(CFR) to estimate a CFR that ranged substantially across age groups, from 0.1% in the
20–29 age group to 7.7% in the over-80 age group. Using these values along with the
relationship between CFR and severe and critical cases, we also estimated the proportion of

                                                                                             4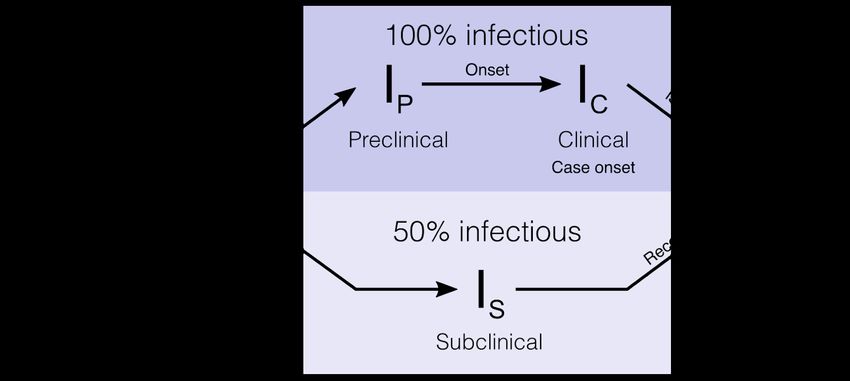
clinical cases in each age group that would require hospitalisation, which was 0.8% in the
20-29 age group and 62% in the over-80 age group (Table S2).

Fig. 1. State transitions in the model. Individuals in the stochastic compartmental model are
classified into susceptible, exposed, infectious (preclinical, clinical, or subclinical), and recovered
states. The model is stratified into 5-year age bands and epidemics are simulated in the 186
county-level administrative units of the UK.

Intervention scenarios
We explored a variety of non-pharmaceutical interventions, which we assumed would impact
the rate of contact between individuals as well as the relative infectiousness of symptomatic
individuals. Contact matrices were constructed by summing home, work, school, and “other”
contacts calculated from survey data [12], with interventions altering the relative number of
contacts of each type (Table 2). We simulated self-isolation of symptomatic individuals by
decreasing their infectiousness by 35% during the intervention period. This was based on a
calculation that approximately 70% of contacts occur outside the home; we assumed that
these could be reduced by half for individuals under self-isolation, consistent with findings
that accelerated case isolation in Shenzhen, China reduced transmission by 35% [13]. We
included regular school closures for holidays in all models.

                                                                                                          5
Table 2. Intervention scenarios. Each intervention was assumed to affect either a component of the
contact matrix or the infectiousness of symptomatic individuals, reducing it to the percentage shown.
Infectiousness of
Home Work School Other symptomatic
contacts contacts contacts contacts individuals
Baseline 100% 100% 100% 100% 100%
School Closures 100% 100% 0% 100% 100%
Social Distancing 100% 50% 100% 50% 100%
Elderly Shielding 100% 25% (70+); 100% 25% (70+); 100%
100% (others) 100% (others)
Self-Isolation 100% 100% 100% 100% 65%
Combined 100% 25% (70+); 0% 25% (70+); 65%
50% (others) 50% (others)
Intensive 100% 25% (70+); 100% (open) 16% (70+); 65%
interventions 65% (others) 0% (closed) 59% (others)
(see Supporting
Information)
Lockdown 100% 10% 10% (open); 10% 65%
0% (closed)
Statement on data availability
All analysis code and data are available at https://github.com/cmmid/covid-uk.
Funding statement
NGD was funded by the National Institute for Health Research Health Protection Research
Unit in Immunisation (NIHR; HPRU-2012-10096). AJK was funded by the Wellcome Trust
(WT; 206250/Z/17/Z). RME was funded by Health Data Research UK (MR/S003975/1). AG
was funded by the Global Challenges Research Fund (GCRF; ES/P010873/1). WJE was
funded by the European Union's Horizon 2020 research and innovation programme - project
EpiPose (No 101003688).
We acknowledge the London School of Hygiene & Tropical Medicine COVID-19 modelling
group, who contributed to this work. Their funding sources are as follows: TJ: Research
Council UK / Economic and Social Research Council ES/P010873/1; UK Public Health
Rapid Support Team; NIHR HPRU in Modelling Methodology. KO'R: Bill and Melinda Gates
Foundation (BMGF) OPP1191821. AE: The Nakajima Foundation; The Alan Turing Institute.
JH: Wellcome Trust (WT) 210758/Z/18/Z. ESN: BMGF OPP1183986. BJQ: NIHR 16/137/109
using UK Aid funding. CIJ: GCRF project ‘RECAP’ managed through RCUK and ESRC
ES/P010873/1. TWR: WT 206250/Z/17/Z. PK: BMGF INV-003174. NIB: WT 210758/Z/18/Z.
S Funk: WT 210758/Z/18/Z. SA: WT 210758/Z/18/Z. HG: Department of Health and Social
Care ITCRZ 03010 using UK Aid funding, managed by the NIHR. CABP: BMGF
OPP1184344. S Flasche: WT 208812/Z/17/Z. MJ: BMGF INV-003174, NIHR 16/137/109.
SC: WT 208812/Z/17/Z. KP: BMGF INV-003174. CD: NIHR 16/137/109. JCE: European
Research Council (ERC) Starting Grant, Action Number #757699. SRP: BMGF
OPP1180644. KvZ: Elrha’s Research for Health in Humanitarian Crises Programme, funded
by the UK Government (DFID), WT, and NIHR. YFS: NIHR EPIC grant (16/137/109). JDM:
6WT 210758/Z/18/Z. AR: NIHR PR-OD-1017-20002. MA: BMGF OPP1191821. GK: UK
Medical Research Council MR/P014658/1. RMGJH: ERC Starting Grant, Action Number
#757699. YL: BMGF INV-003174, NIHR 16/137/109. The views expressed in this publication
are those of the authors and not necessarily those of any of their funders. Funders had no
role in the study design, analysis, or decision to submit for publication.
Results
Projections for an unmitigated epidemic
Simulations of an unmitigated COVID-19 epidemic resulted in a median 24 million (95%
prediction interval: 16–30 million) clinical cases in the UK up to December 2021 (Fig. 2;
Table 4). Under this scenario, 85% of the population (68–96%) would be infected by
SARS-CoV-2, with roughly 40% of those infected showing clinical symptoms. In turn, this
would result in a projected 370 thousand (250–470 thousand) deaths directly attributable to
COVID-19, without accounting for any potential increase in the case fatality ratio caused by
exceeding hospital capacity. The projected peak number of ICU beds required was 220
thousand (120–360 thousand). This is roughly 25–80 times ICU capacity in the UK, which
we tallied at 4,562 beds [14–17] in the absence of any efforts to further expand capacity.
Impact of non-pharmaceutical interventions
Non-pharmaceutical interventions against previous epidemics—particularly school closures
in response to pandemic influenza or SARS—have typically been put in place for periods of
one week to three months [18]. Accordingly, we first evaluated a number of scenarios under
which non-pharmaceutical interventions would be deployed for 12 weeks. The interventions
we analysed were school closures; social distancing; shielding of the elderly; self-isolation of
symptomatic individuals; and combinations of these policies (Table 2). These mitigation
measures decreased the total number of cases by 70–75% and delayed the peak of the
epidemic by 3–8 weeks on average (Fig. 2a, b). While social distancing was predicted to
have the greatest impact on the total number of cases, elderly shielding was predicted to
have the greatest impact on the number of deaths (Table 4).
7Fig. 2. Impact of interventions lasting 12 weeks. (a) Daily new cases and ICU beds required over
the course of the simulated scenarios in the UK. From 50 realisations of each projection, we show 11
representative simulations, corresponding to each decile of the total number of cases; the bold curve
shows the simulation resulting in the median projected number of cases. Blue shaded regions show
regular school closures, while the pink shaded region shows the distribution of 12-week interventions.
(b) Summary of simulated outputs, in total number of clinical cases and deaths, clinical cases in peak
week, peak ICU beds required, peak non-ICU beds required, and the time from seeding until peak of
the epidemic. (c) The sampled distribution of the basic reproduction number, R0, under each
intervention scenario.
Table 4. Projected impact of 12-week interventions in the UK. Median and 95% prediction interval
reported. Totals are calculated up to December 31, 2021.
Base School Social Elderly Self-Isolation Combination
Closures Distancing Shielding
Total cases 24 M (16 18 M (11 M–25 17 M (10 M–23 17 M (10 M–23 18 M (10 M–24 18 M (11 M–24
M–30 M) M) M) M) M) M)
Total deaths 370 k (250 280 k (150 250 k (140 220 k (130 260 k (140 280 k (150 k–390
k–470 k) k–400 k) k–360 k) k–330 k) k–390 k) k)
Cases in peak week 4.2 M (2.5 2.8 M (940 2.2 M (1 M–4.2 2.9 M (1.1 2.7 M (900 3.5 M (1.2 M–5.3
M–6.4 M) k–6.2 M) M) M–6.4 M) k–6.1 M) M)
Deaths in peak week 62 k (35 k–98 41 k (13 k–96 k) 31 k (14 k–62 k) 34 k (12 k–79 k) 39 k (12 k–92 k) 51 k (17 k–82 k)
k)
Peak ICU beds 220 k (120 150 k (45 k–350 110 k (49 k–220 120 k (42 k–300 140 k (44 k–330 190 k (61 k–300
required k–360 k) k) k) k) k) k)
Peak non-ICU beds 420 k (230 280 k (85 k–670 210 k (92 k–420 230 k (79 k–560 270 k (83 k–630 350 k (120 k–570
required k–670 k) k) k) k) k) k)
Time to peak cases 11 (8.2–16) 14 (10–25) 19 (11–28) 14 (9.2–21) 14 (10–25) 22 (16–36)
(weeks)
8We found that, when implemented alone, none of these shorter-duration interventions were
able to decrease the healthcare need to below available capacity. We estimated that neither
school closures, social distancing, elderly shielding, or self-isolation alone would reduce R0
enough to lead to a substantial decline in the total number of cases (Fig. 2c). In particular,
school closures had a limited impact in our projections, despite our model accounting for
substantial asymptomatic transmission among children. This contrasts with strategies aimed
at suppressing the spread of pandemic influenza, for which school closures are often a key
intervention [19].
Next, we sought to evaluate the potential impact of combining control measures. The most
comprehensive of these involves deploying all four individual strategies at the same time.
This combination strategy was projected to have a more marked impact on R0 (Fig. 2c), and
in a small proportion (8%) of simulations, was sufficient to halt the epidemic altogether
during the intervention period. However, lifting the interventions leads to a rapid resurgence
of cases in the model, even when R0 had been kept below 1 during the intervention period.
Triggering of interventions
When interventions have a limited duration, their impact can be influenced by timing. If
interventions are triggered at the same time across all locations, they may arrive too early in
some locations and too late in others. We therefore estimated the impact of triggering
interventions at different times, both nationally and at a local level. We projected that
triggering interventions locally instead of nationally could modestly reduce the total number
of cases and deaths, as well as reduce peak demands on the healthcare system (Fig. 3a, b;
Table S3). However, our simulations do not account for any differences in the
implementation of or adherence to control measures which might arise from these timings
varying in different parts of the country. Examining the simulated dynamics at a county level
(Fig. 3c) shows that the timing of local epidemics may vary among counties, and highlights
that epidemics at a local level are predicted to peak more sharply than they do across the
entire UK.
Our projections also showed that, when only a short intervention is deployed, rather than
centring measures over the peak (as predicted in the absence of control measures), it was
preferable to trigger the intervention later in order to minimise the total health burden (Fig.
3b). This is because the introduction of control measures will change the timing of the peak
relative to the baseline scenario (Fig. 3a). In particular, the most effective timing for
introduction of measures could involve a delay of as much as four weeks (Fig. 3b). However,
optimally timing an intervention may be more difficult in practice than these scenarios
suggest, since here they are run with complete knowledge of when the simulated peak
would occur in the absence of any intervention.
We concluded that a period of intense restrictions on interpersonal contacts, combined with
shielding the most vulnerable members of society, had the potential to substantially reduce
the burden of COVID-19 for as long as they were in place—but that this strategy alone,
particularly if enacted only over relatively short timeframes, would not substantially reduce
the overall impact of the COVID-19 epidemic.
9Fig. 3. Local versus national triggering and timing of interventions. (a) Dynamics of the epidemic
under local versus national triggers for introduction of interventions (pink shaded regions). Blue
shaded regions show regular school closures, while the pink shaded region shows the intervention
period. Bolded lines show daily incidence of cases in the median simulation under each scenario. (b)
Summary of simulated outputs, in total number of clinical cases, deaths, clinical cases in peak week,
peak ICU beds required, peak non-ICU beds required, and the time from seeding until peak of the
epidemic (c) Illustration of peak timings of new cases varying across two counties in the UK, in
comparison with predicted national trends, for a single simulation with no control interventions. Case
incidence at a local scale is expected to rise and fall more rapidly than case incidence across the
country as a whole.
Leisure activities and older-adult care of children
As other countries in Europe began restricting mass gatherings, there was a question about
the impact such measures might have in the UK, with a particular focus on stopping
spectator sports [20]. By analysing the total attendance at spectator sports in the UK, we
performed additional simulations to evaluate the potential impact of such restrictions (Fig.
4a, Table S2). Although yearly attendance at sporting events is high (75.1 million spectators
per year [21]), even if we assume that people make the equivalent of their mean daily
physical contacts at such events (i.e. 5 contacts per person, to make a total of 375 million),
this number is very low relative to the number of yearly contacts which occur outside the
context of sporting events (269 billion [12]). We estimated that stopping spectator sports
would have little direct effect on the number of cases (Fig. 4a, Table S4). We simulated a
more general reduction in leisure contacts—which mainly occur in pubs, bars, restaurants
and cinemas—by reducing leisure contacts by 75%, and found a larger (though still modest)
impact on the epidemic. Previous work on pandemic influenza has estimated that many
individuals are likely to choose to avoid such settings, as they perceive them to be risky [22].
We also evaluated the potential impact of schoolchildren being cared for by grandparents
during weekdays as a result of school closures, because of concerns over whether this
might counteract the benefit of closing schools as a result of higher-risk older adults being
exposed to more transmission from children. We found that, over a period of school closure
from 17th March to 1st September, one additional contact per weekday between children
under 15 and an older individual (at least 55 years older than the child) could, in the worst
10case (i.e. high R0), almost entirely eliminate the benefit of closing schools in terms of the
number of deaths and peak ICU bed occupancy over this period (Fig. 4b, Table S5).
Fig. 4. Impact of reducing leisure events and impact of increased childcare from older age
groups. (a) Effect of banning spectator sports, and decreasing leisure activities on the total cases,
total deaths, and peak number of cases, ICU beds, non-ICU beds, and the time to peak week in the
simulated epidemics. The “Background” to which these interventions are compared is school closures
plus elderly shielding. (b) Effect of varying increases in contacts between children and older adults
during school closures and effect on the total cases, total deaths, and peak number of cases, ICU
beds, non-ICU beds, and the time to peak week in the simulated epidemics. The “Background” to
which these interventions are compared is the “Intensive Interventions” of Table 2, without any
additional period of school closure.
Intensive interventions and lockdown
As well as single 12-week measures, during the first half of March 2020 we also analysed
the impact of longer-term and repeated interventions. On March 16th 2020, our group was
advised that, supported by the results of modelling analyses from multiple sources (including
our preliminary projections), a package of intensive interventions would be put in place,
including a significant programme of social distancing, with a particular impact on leisure
activities; workers being asked to work from home where possible; shielding of both elderly
(70+) individuals and people in high-risk-groups of all ages; school closures; and
self-isolation of symptomatic individuals. With these more concrete proposals, we updated
our model to estimate the likely impact of the proposed strategy. We projected that the
intensive interventions being proposed had the potential to delay the peak of the epidemic by
118 weeks on average (95% prediction interval: 1–50 weeks), and to reduce the total number
of deaths by half (Fig. 5a; Table 5).
In spite of this substantial reduction in burden, the projections still showed a large number of
cases (6.6–21 million), and a large number of ICU beds (12–140 thousand) occupied during
the peak of the epidemic (Fig 5b). Indeed, we projected that ICU bed capacity could be
exceeded by 5-fold or more for several weeks. While we could not explicitly predict the
impact of this on mortality rates, this would likely lead to an increased case fatality ratio.
We had previously presented scenarios on 11th March showing that shorter, repeated
periods of particularly strict restrictions on movement—“lockdowns”—could be used to
supplement a longer-term, more moderate package of interventions, with lockdowns to be
deployed as needed to prevent the resources of the health system becoming overburdened.
Accordingly, we supplemented the intensive interventions with lockdowns phased in when
ICU bed capacity reached certain thresholds, which would be kept in place until ICU bed
usage fell back below the same trigger threshold, to then be brought in again as needed.
We found that adding these periods of lockdown would still result in a high number of ICU
beds being occupied, but at much lower levels than the scenario without lockdowns (Fig.
5a). Lockdown periods were sufficient to bring R0 near or below 1 (Fig. 5c), and hence to
lead to a reduction in total COVID-19 cases (Fig. 5b). We found that, depending on the
threshold ICU bed occupancy at which lockdown periods were triggered, there was a
tradeoff between having fewer, longer lockdown periods (lower threshold) and having more,
shorter lockdown periods (higher threshold), with the higher thresholds resulting in less time
spent in lockdown overall, but higher peak demands on ICU bed capacity (Table 5). Lower
thresholds also resulted in more individuals remaining susceptible at the end of the
simulation period, potentially increasing the total duration for which recurrent lockdowns
would need to be maintained. We assumed that lockdowns would be triggered at a national
level rather than at a local level, and that the trigger threshold would not change over time.
There are likely to be better strategies for selecting timing and duration of lockdowns.
However, we presented our results as supporting evidence that periodic lockdowns could
reduce the burden of COVID-19 without measures being in place indefinitely.
12Fig. 5. Projected impact of intensive control measures with reactive lockdowns. (a) Dynamics of
the epidemic under different triggers for introduction and lifting of lockdowns (median timing of
lockdowns shown as grey shaded areas). Bolded lines show ICU bed occupancy in the median run
under each scenario. Horizontal guides show the estimated number of ICU beds in the UK as of
January 2020 (solid line) and with a hypothetical doubling of capacity (dashed line). Blue shaded
regions show school closures, while the pink shaded region shows a background period of intensive
interventions. (b) Summary of epidemic runs. (c) Estimated distribution of R0 under three different
interventions: intensive social distancing with schools open and closed, and lockdown.
Table 5. Projected impact of intensive control measures and lockdown in the United Kingdom. Median and
95% prediction interval reported. Totals are calculated up to December 31, 2021.
statistic Intensive Interventions Lockdown with Lockdown with Lockdown with
1000-bed trigger 2000-bed trigger 5000-bed trigger
Total cases* 11 M (6.6 M–21 M) 4 M (1.8 M–12 M) 6.5 M (3 M–14 M) 9.7 M (5.2 M–17 M)
Total deaths* 130 k (73 k–270 k) 51 k (21 k–170 k) 84 k (34 k–200 k) 130 k (60 k–240 k)
Cases in peak week 820 k (330 k–3.2 M) 110 k (79 k–800 k) 190 k (110 k–1.1 M) 330 k (200 k–1.5 M)
Deaths in peak week 9.3 k (3.5 k–40 k) 1.4 k (850–11 k) 2.3 k (1.3 k–15 k) 3.7 k (2.3 k–20 k)
Peak ICU beds 33 k (12 k–140 k) 5 k (3.2 k–39 k) 8.1 k (4.8 k–55 k) 13 k (8.4 k–71 k)
required
Peak non-ICU beds 62 k (23 k–270 k) 9.4 k (6.2 k–73 k) 16 k (9 k–100 k) 26 k (16 k–130 k)
required
Time to peak cases 19 (9.2–66) 60 (8–96) 46 (8–71) 34 (8–63)
(weeks)
Proportion of time – 0.73 (0.27–0.9) 0.61 (0.23–0.77) 0.35 (0.12–0.5)
spent in lockdown (29
Jan 2020–31 Dec 2021)
Total infected* 28 M (18 M–48 M) 11 M (4.3 M–33 M) 18 M (6.9 M–36 M) 27 M (12 M–41 M)
* Simulations were run to December 31, 2021, so total cases, deaths, and infections under the
lockdown strategies may not reflect the full number during the entire epidemic.
13Discussion
Using an age-structured transmission dynamic model, we explored different scenarios for
COVID-19 transmission and control in the UK. We found that moderate interventions lasting
for 12 weeks, such as school closures, self-isolation or shielding of elderly groups, would
likely not have been sufficient to control the epidemic and to avoid far exceeding available
ICU capacity, even when these measures were used in combination. However, we estimated
that a scenario in which more intense lockdown measures were implemented for shorter
periods may be able to keep projected case numbers at a level that would not overwhelm
the health system.
The model presented here is subject to several limitations. Because the model does not
explicitly structure individuals by household, we are unable to evaluate the impact of
measures based on household contacts, e.g. household quarantine, i.e., where all members
of a household with a suspected COVID-19 case remain in isolation. Such contact-targeted
measures could increase the impact of a package of interventions by limiting spread in the
community. However, the presence of asymptomatic infections [23] means that isolation
based on symptomatic case identification would be unlikely to fully prevent ongoing
transmission. We also do not include individual level variation in transmission (i.e.
‘superspreading events’, [24]). There are several examples of such events for COVID-19
[25], and individual-level variation is likely important in influencing the success of control
measures in the very early stages of an outbreak [5]. However, as outbreaks of
directly-transmitted infections become larger, the population-level dynamics will
predominantly be driven by the average mixing pattern between key epidemiological groups,
particularly between different ages [11,26]. We therefore used a stochastic model
implementation to capture variation in these population-level dynamics. We also assumed
that subclinically-infected individuals were 50% as infectious as clinical cases. A study of
2,147 close contacts in Ningbo, China estimated that the mean onward transmission from
asymptomatic infections was 65% (95% HDI: 20–120%) that of symptomatic cases [23].
However, symptomatic cases were found to be more likely to generate new symptomatic
infections compared to asymptomatic infections. This suggests that the overall relative
contribution of asymptomatic individuals to new infections may be lower than 65%, and
hence 50% is a plausible assumption. We used mixing matrices for the UK measured in
2006 [12], and changes in contact patterns since then may alter the potential effect of
interventions. The fractions of hospitalisation, ICU use, and death are estimated using data
from China, and any differences in UK populations could affect our estimates of health care
demand.
The results we present here summarize the key analyses and scenarios we presented to
decision makers during February and March 2020, which evolved continuously as additional
information became available. A reasonable worst-case scenario with and without school
closures, focusing on Birmingham as an illustrative example, was presented to the Scientific
Pandemic Influenza Group on Modelling (SPI-M), which gives expert advice to the UK
Department of Health and Social Care and wider UK government, on 26th February 2020.
This was followed by an exploration of national-level impact of shorter-duration interventions
14(as in Fig. 2) presented on 2nd March 2020, which explored various assumptions
concerning intervention length and efficacy. We expanded our analysis to explicitly cover all
counties in England and analysed the timing of measures, and local versus national
deployment of interventions (as in Fig. 3), on 8th March 2020. Our analyses of the impact of
curtailing sporting events and leisure activities (as in Fig. 4a), and of the potential impact of
repeated lockdown measures (as in Fig. 5), were presented on 11th March 2020. Our
sensitivity analysis for increased child-grandparent contacts (as in Fig. 4b) was presented
on 17th March 2020. The results shown in the main text are based on the final version of the
model, and reflect our current state of knowledge about the transmission dynamics of
COVID-19. However, our overall conclusions about the relative effectiveness of different
strategies for reducing the burden of COVID-19 in the UK are the same as those presented
to decision makers in real-time.
Contributions
WJE, NGD, AJK and RME designed the study and wrote the report. NGD, RME, AJK, and
WJE designed the model. NGD led the development and analysis of the transmission model,
AJK led the development and analysis of the health burden model, and AG led the R_0
meta-analysis. The CMMID COVID-19 working group contributed to writing the report. All
authors read and approved the final report.
Acknowledgements
We thank Anna Foss, Quentin Leclerc, Ruwan Ratnayake, and David Simons for comments
on a draft manuscript.
References
1. Li Q, Guan X, Wu P, Wang X, Zhou L, Tong Y, et al. Early Transmission Dynamics in Wuhan,
China, of Novel Coronavirus-Infected Pneumonia. N Engl J Med. 2020;382: 1199–1207.
2. Riou J, Althaus CL. Pattern of early human-to-human transmission of Wuhan 2019 novel
coronavirus (2019-nCoV), December 2019 to January 2020. Euro Surveill. 2020;25.
doi:10.2807/1560-7917.ES.2020.25.4.2000058
3. Huang C, Wang Y, Li X, Ren L, Zhao J, Hu Y, et al. Clinical features of patients infected with 2019
novel coronavirus in Wuhan, China. Lancet. 2020;395: 497–506.
4. The Novel Coronavirus Pneumonia Emergency Response Epidemiology Team. The
Epidemiological Characteristics of an Outbreak of 2019 Novel Coronavirus Diseases (COVID-19)
— China, 2020. CCDCW. 2020;2: 113–122.
5. Hellewell J, Abbott S, Gimma A, Bosse NI, Jarvis CI, Russell TW, et al. Feasibility of controlling
COVID-19 outbreaks by isolation of cases and contacts. Lancet Glob Health. 2020;8: e488–e496.
6. Kucharski AJ, Russell TW, Diamond C, Liu Y, Edmunds J, Funk S, et al. Early dynamics of
transmission and control of COVID-19: a mathematical modelling study. Lancet Infect Dis. 2020.
doi:10.1016/S1473-3099(20)30144-4
7. Wang C, Liu L, Hao X, Guo H, Wang Q, Huang J, et al. Evolving Epidemiology and Impact of
Non-pharmaceutical Interventions on the Outbreak of Coronavirus Disease 2019 in Wuhan,
China. medRxiv. 2020; 2020.03.03.20030593.
158. Prem K, Liu Y, Russell TW, Kucharski AJ, Eggo RM, Davies N, et al. The effect of control
strategies to reduce social mixing on outcomes of the COVID-19 epidemic in Wuhan, China: a
modelling study. The Lancet Public Health. 2020. doi:10.1016/S2468-2667(20)30073-6
9. Cowling BJ, Ali ST, Ng TWY, Tsang TK, Li JCM, Fong MW, et al. Impact assessment of
non-pharmaceutical interventions against COVID-19 and influenza in Hong Kong: an
observational study. medRxiv. 2020; 2020.03.12.20034660.
10. Cereda D, Tirani M, Rovida F, Demicheli V, Ajelli M, Poletti P, et al. The early phase of the
COVID-19 outbreak in Lombardy, Italy. 2020. Available: http://arxiv.org/abs/2003.09320
11. Davies NG, Klepac P, Liu Y, Prem K, Jit M, CMMID COVID-19 working group, et al.
Age-dependent effects in the transmission and control of COVID-19 epidemics. medRxiv. 2020;
2020.03.24.20043018.
12. Mossong J, Hens N, Jit M, Beutels P, Auranen K, Mikolajczyk R, et al. Social contacts and mixing
patterns relevant to the spread of infectious diseases. PLoS Med. 2008;5: e74.
13. Liu Y, Centre for Mathematical Modelling of Infectious Diseases nCoV Working Group, Funk S,
Flasche S. The contribution of pre-symptomatic infection to the transmission dynamics of
COVID-2019 [version 1; peer review: awaiting peer review]. Wellcome Open Research. 2020;5:
58.
14. Statistics for Wales. NHS beds by organisation and site. In: StatsWales [Internet]. [cited 30 Mar
2020]. Available:
https://statswales.gov.wales/Catalogue/Health-and-Social-Care/NHS-Hospital-Activity/NHS-Beds/
nhsbeds-by-organisation-site
15. Scottish Intensive Care Society Audit Group (SICSAG). Audit of Critical Care in Scotland 2019.
Reporting on 2018. 2019. Available:
https://www.sicsag.scot.nhs.uk/publications/_docs/2019/2019-08-13-SICSAG-report.pdf
16. Northern Ireland’s health minister in plea for more ventilators as seven more coronavirus cases
reported. In: The Irish News [Internet]. 16 Mar 2020 [cited 30 Mar 2020]. Available:
http://www.irishnews.com/news/northernirelandnews/2020/03/16/news/northern-ireland-has-recor
ded-seven-new-cases-of-coronavirus---total-now-52-1869287/
17. Statistics. Statistics » Critical Care Bed Capacity and Urgent Operations Cancelled 2019-20
Data. [cited 30 Mar 2020]. Available:
https://www.england.nhs.uk/statistics/statistical-work-areas/critical-care-capacity/critical-care-bed-
capacity-and-urgent-operations-cancelled-2019-20-data/
18. Jackson C, Vynnycky E, Hawker J, Olowokure B, Mangtani P. School closures and influenza:
systematic review of epidemiological studies. BMJ Open. 2013;3.
doi:10.1136/bmjopen-2012-002149
19. House T, Baguelin M, van Hoek AJ, Flasche S, White P, Sadique MZ, et al. Can Reactive School
Closures help critical care provision during the current influenza pandemic? PLoS Curr. 1.
doi:10.1371/currents.RRN1119
20. Sports bodies and broadcasters to meet over coronavirus contingency. In: ITV News [Internet].
[cited 1 Apr 2020]. Available:
https://www.itv.com/news/2020-03-07/sports-bodies-and-broadcasters-to-meet-over-coronavirus-
contingency/
21. UK claims world capital of live sport title with record 2019 attendance. In: Two Circles (GB)
[Internet]. 10 Dec 2019 [cited 30 Mar 2020]. Available:
https://twocircles.com/gb-en/articles/uk-named-world-capital-of-live-sport-following-new-attendan
ce-analysis/
1622. Sadique MZ, Edmunds WJ, Smith RD, Meerding WJ, de Zwart O, Brug J, et al. Precautionary
behavior in response to perceived threat of pandemic influenza. Emerg Infect Dis. 2007;13:
1307–1313.
23. Chen Y, Wang A, Yi B, Ding K, Wang H, Wang J, et al. The epidemiological characteristics of
infection in close contacts of COVID-19 in Ningbo city. Chinese Journal of Epidemiology.
2020;41. doi:10.3760/cma.j.cn112338-20200304-00251
24. Lloyd-Smith JO, Schreiber SJ, Kopp PE, Getz WM. Superspreading and the effect of individual
variation on disease emergence. Nature. 2005;438: 355–359.
25. Liu Y, Eggo RM, Kucharski AJ. Secondary attack rate and superspreading events for
SARS-CoV-2. Lancet. 2020;395: e47.
26. Kucharski AJ, Kwok KO, Wei VWI, Cowling BJ, Read JM, Lessler J, et al. The contribution of
social behaviour to the transmission of influenza A in a human population. PLoS Pathog.
2014;10: e1004206.
27. Bi Q, Wu Y, Mei S, Ye C, Zou X, Zhang Z, et al. Epidemiology and Transmission of COVID-19 in
Shenzhen China: Analysis of 391 cases and 1,286 of their close contacts. medRxiv. 2020;
2020.03.03.20028423.
28. Nishiura H, Linton NM, Akhmetzhanov AR. Serial interval of novel coronavirus (2019-nCoV)
infections. medRxiv. 2020; 2020.02.03.20019497.
29. Population estimates for the UK, England and Wales, Scotland and Northern Ireland - Office for
National Statistics. [cited 29 Mar 2020]. Available:
https://www.ons.gov.uk/peoplepopulationandcommunity/populationandmigration/populationestima
tes/bulletins/annualmidyearpopulationestimates/mid2018
30. Funk S. Introduction to socialmixr. 10 Jan 2020 [cited 31 Mar 2020]. Available:
https://cran.r-project.org/web/packages/socialmixr/vignettes/introduction.html
31. Public Health England. Total UK COVID-19 Cases Update. [cited 30 Mar 2020]. Available:
https://www.arcgis.com/apps/opsdashboard/index.html#/f94c3c90da5b4e9f9a0b19484dd4bb14
32. Linton NM, Kobayashi T, Yang Y, Hayashi K, Akhmetzhanov AR, Jung S-M, et al. Incubation
Period and Other Epidemiological Characteristics of 2019 Novel Coronavirus Infections with
Right Truncation: A Statistical Analysis of Publicly Available Case Data. J Clin Med Res. 2020;9.
doi:10.3390/jcm9020538
33. Cao B, Wang Y, Wen D, Liu W, Wang J, Fan G, et al. A Trial of Lopinavir-Ritonavir in Adults
Hospitalized with Severe Covid-19. N Engl J Med. 2020. doi:10.1056/NEJMoa2001282
34. NHS Digital. Hospital Admitted Patient Care Activity 2018-19. In: NHS Digital [Internet]. [cited 29
Mar 2020]. Available:
https://digital.nhs.uk/data-and-information/publications/statistical/hospital-admitted-patient-care-a
ctivity/2018-19
35. Russell TW, Hellewell J, Jarvis CI, van Zandvoort K, Abbott S, Ratnayake R, et al. Estimating the
infection and case fatality ratio for coronavirus disease (COVID-19) using age-adjusted data from
the outbreak on the Diamond Princess cruise ship, February 2020. Eurosurveillance. 2020;25:
2000256.
36. Christina Atchison, Leigh Bowman, Jeffrey W Eaton, Natsuko Imai, Rozlyn Redd, Philippa
Pristera, Charlotte Vrinten, Helen Ward. Report 10: Public Response to UK Government
Recommendations on COVID-19: Population Survey, 17-18 March 2020. Available:
https://www.imperial.ac.uk/media/imperial-college/medicine/sph/ide/gida-fellowships/Imperial-Coll
ege-COVID19-Population-Survey-20-03-2020.pdf
1737. Abbott S, Hellewell J, Munday J, CMMID nCoV working group, Funk S. The transmissibility of
novel Coronavirus in the early stages of the 2019-20 outbreak in Wuhan: Exploring initial
point-source exposure sizes and durations using scenario analysis. Wellcome Open Research.
2020;5: 17.
38. Bedford T, Neher R, Hadfield J, Hodcroft E, Ilcisin M, Müller N. Genomic analysis of nCoV
spread. Situation report 2020-01-23. 2020. Available:
https://nextstrain.org/narratives/ncov/sit-rep/2020-01-23?n=1
39. Imai N, Cori A, Dorigatti I, Baguelin M, Donnelly CA, Riley S, et al. Report 3: Transmissibility of
2019-nCoV. Available:
https://www.imperial.ac.uk/media/imperial-college/medicine/sph/ide/gida-fellowships/Imperial-Coll
ege-COVID19-transmissibility-25-01-2020.pdf
40. Majumder M, Mandl KD. Early Transmissibility Assessment of a Novel Coronavirus in Wuhan,
China. SSRN Journal. 2020. doi:10.2139/ssrn.3524675
41. Read JM, Bridgen JRE, Cummings DAT, Ho A, Jewell CP. Novel coronavirus 2019-nCoV: early
estimation of epidemiological parameters and epidemic predictions. Infectious Diseases (except
HIV/AIDS). medRxiv; 2020.
42. Riou J, Althaus CL. Pattern of early human-to-human transmission of Wuhan 2019-nCoV.
Microbiology. bioRxiv; 2020.
43. Wu JT, Leung K, Leung GM. Nowcasting and forecasting the potential domestic and international
spread of the 2019-nCoV outbreak originating in Wuhan, China: a modelling study. The Lancet.
2020. pp. 689–697. doi:10.1016/s0140-6736(20)30260-9
44. Zhao S, Lin Q, Ran J, Musa SS, Yang G, Wang W, et al. Preliminary estimation of the basic
reproduction number of novel coronavirus (2019-nCoV) in China, from 2019 to 2020: A
data-driven analysis in the early phase of the outbreak. Int J Infect Dis. 2020;92: 214–217.
45. Liu T, Hu J, Xiao J, He G, Kang M, Rong Z, et al. Time-varying transmission dynamics of Novel
Coronavirus Pneumonia in China. Systems Biology. bioRxiv; 2020. p. 79.
18Supplementary Information
Dynamic transmission model
We analyse a stochastic compartmental model (Fig. 1) stratified into 5-year age bands, with
time approximated in discrete 6-hour steps. The model tracks 66.4 million UK residents
aggregated to the 186 county-level administrative units across England, Wales, Scotland,
and Northern Ireland. We run 50 stochastic realizations for each projection.
We assume that the population initially consists of susceptible individuals (S), who become
exposed (E) after effective contact with an infectious person. After an incubation period
lasting 4 days on average, exposed individuals of age i will develop either a clinical infection
with probability y i , or a subclinical infection with probability 1 y i . Clinical cases begin with
a preclinical but infectious (IP) state lasting 1.5 days on average; these individuals then
progress to a clinically infected state (IC), which we assume marks the onset of a clinical
case. We assume that subclinical infections (IS) are half as transmissible as preclinical and
clinical infections. Regardless of whether they are clinically or subclinically infected,
individuals remain infectious for 5 days on average and are then removed (R) from the
infectious state; we assume that removed individuals are immune to reinfection over the 1–2
years over which we simulated the epidemic. Hospitalisations and deaths from COVID-19
are assumed to occur among clinical cases only, and we assume that the clinical outcome of
a case does not impact upon transmission dynamics.
The amount of time a given individual spends in states E, IP, IC, or IS is drawn from
distributions dE , dP , dC , or dS , respectively (Table S1). The force of infection for an
individual in age group i at time t, , where t is defined in 6 hour time steps.
λi,t = u ∑ cij,t (I P j + I C j + f I S j )/N j ,
j
is the rate at which susceptible individuals enter the exposed state. Here, u is an individual’s
susceptibility to infection upon contact with an infectious person, cij,t is the number of age-j
individuals contacted by an age-i individual per day at time t, f is the relative infectiousness
of a subclinical case, and (I P j + I C j + f I S j )/N j is the effective probability that a random age-j
individual is infectious.
To calculate the basic reproductive number, R0, defined as the average number of secondary
infections generated by a typical infectious individual in a fully susceptible population, we
define the next generation matrix as
N GM ij = ucij,t (y j E(dP + dC ) + (1 y j )f E(dS ) .
Then, R0 is the absolute value of the dominant eigenvalue of the next generation matrix.
Key parameters of the transmission model
We used a serial interval of 6.5 days based on published studies [1,27,28], and assumed
that the length of the preclinical period was 30% of the total period of clinical infectiousness
[13]. From this, we fixed the mean of the latent period to 4 days, the mean duration of
19preclinical infectiousness to 1.5 days, and the mean duration of clinical infectiousness to 3.5
days.
The basic reproduction number R0 was estimated by synthesizing the results of a literature
review (Fig. S1). For each reported value of the basic reproduction number, we matched a
flexible PERT distribution (a shifted beta distribution parameterised by minimum, maximum,
and mode) to the median and confidence interval reported in each study. We sampled from
the resulting distributions, weighting each study equally, to obtain estimates of R0 for our
simulations.
The age-specific clinical fraction yi was adopted from an estimate based on case data from 6
countries [11], and the relative infectiousness of subclinical cases, f, was assumed to be
50% relative to clinical cases, as we assumed in a previous study [11].
We used the Office for National Statistics data on the population by age for each of 186
county-level subdivisions of the UK [29], comprising non-metropolitan counties, metropolitan
counties, unitary authorities and London boroughs in England; unitary authorities in Wales;
council areas in Scotland; and local government districts in Northern Ireland (hereafter
referred to as “counties”). We used contact data from the POLYMOD study [12] and the R
package socialmixr [30] to generate age-stratified contact matrices for the UK, generating
separate contact matrices for each county according to the population structure for that
county, assuming that the number of age-j contacts made by an age-i individual scales with
the number of age-j individuals in a county.
We assumed that epidemics in each county are seeded by 2 individuals per day for 28 days;
after this point, further seeding has very little impact owing to extensive community
transmission. Seeding times are staggered so that London boroughs are seeded on a
random day in the first week of the simulation, and other locations are seeded on a random
day in the first four weeks of the simulation. We assume that transmission between counties
is negligible, instead allowing the staggered seeding of infection among counties to simulate
the process of gradual introduction of the epidemic across the UK. The start date of the
model is 29th January 2020, which we chose by visually aligning model-predicted deaths to
the daily number of COVID-19 deaths reported in the UK [31] up to 27th March.
Hospital burden estimation
To calculate ICU and non-ICU beds in use through time, we scaled age-stratified
symptomatic cases by age-specific hospitalisation and critical outcome probability, then
summed to get the total number of hospitalised and critical cases. We then distributed
hospitalised cases over time based on expected time of hospitalisation and duration
admitted. We assumed gamma-distributed delays, with the shape parameter set equal to the
mean, for: delay from symptom onset to hospitalisation of mean 7 days (standard deviation
2.65) [32,33]; delay from hospitalisation to discharge / death for non-ICU patients of mean 8
days (s.d. 2.83) [34]; delay from hospitalisation to discharge / death for ICU patients of mean
10 days (s.d. 3.16) [33]; and delay from onset to death of mean 22 days (s.d. 4.69) [32,33].
20We calculated the age-specific case fatality ratio based on data from the COVID-19 outbreak
in China and on the Diamond Princess cruise ship. We first calculated the naive case fatality
ratio, nCFR, (i.e. deaths/cases) for each age group, then scaled down the naive CFR based
on a correction factor estimated from data from the Diamond Princess [35] to give an
adjusted CFR. We then calculated risk of hospitalisation based on the ratio of severe and
critical cases to cases (18.5%) and deaths to cases (2.3%) in the early China data, which we
took to imply 8.04 times more hospitalisations than deaths in each age group. We assumed
all age groups had a 30% risk of requiring critical care if hospitalised [33].
Derivation of contact rates for the “Intensive Interventions” scenario
For the “Intensive Interventions” scenario, we assumed that 30% of workers would be able to
work from home [36], reducing work and transport contacts (11% of “other” contacts) among
the low-risk general population (assumed to be 90% of adults under 70) by 30%. We also
assumed leisure contacts (45% of “other” contacts) would decrease by 75% in this
population. We assumed that work and “other” contacts would be reduced by 75% among
the high-risk general population (10% of under-70s) through shielding. Among those aged 70
and above, we assumed that 75% of work and other contacts would be reduced through
shielding; we then further reduced transport contacts by 30% and leisure contacts by 75%.
R0 meta-analysis
We sampled R0 from a consensus distribution (Fig. S1) derived from published sources
available at the time projections were made. We sampled across all studies, with each study
weighted equally. The distribution overall has a mean R0 of 2.68, with a standard deviation of
0.57. We used a normal distribution with these parameters for our simulations.
21Supplementary Figures
Fig. S1. R0 distribution used. Sources used can be found among refs. [1,6,37–45].
22Supplementary Tables
Table S1. Model parameters.
Parameter Description Value Reference
dE Latent period (E to IP and E to IS; days) ~ g amma(μ = 4.0, k = 4) [1,27,28]
dP Duration of preclinical infectiousness (IP to IC; ~ g amma(μ = 1.5, k = 4) [13]
days)
dC Duration of clinical infectiousness (IC to R; days) ~ g amma(μ = 3.5, k = 4) [1,27,28]
dS Duration of subclinical infectiousness (IS to R; ~ g amma(μ = 5.0, k = 4) Assumed to be the same
days) duration as total infectious
period for clinical cases,
including preclinical
transmission
Incubation period (E to IC; days) dE + dP ; mean 5.5 days Derived
Serial interval (days) dE + (y i (dP + dC ) + (1 y )d )/2 ;
i S Derived
mean 6.5 days
u Susceptibility to infection on contact Calculated from R0 Derived
yi Probability of clinical symptoms on infection for Estimated from case [11]
age group i distributions across 6 countries
f Relative infectiousness of subclinical cases 50% Assumed
cij Number of age-j individuals contacted by an UK-specific contact matrix [12]
age-i individual per day
Ni Number of age-i individuals Demographic data [29]
Δt Time step for discrete-time simulation 0.25 days
Delay from onset to hospitalisation (days) ~ g amma(μ = 7, k = 7) [32,33]
Duration of hospitalisation in non-ICU bed ~ g amma(μ = 8, k = 8) Duration based on NHS data
(days) for J12: viral pneumonia, not
elsewhere classified [34].
Duration of hospitalisation in ICU bed (days) ~ g amma(μ = 10, k = 10) [33]
Proportion of hospitalised cases that require 30% [33]
critical care
Delay from onset to death (days) ~ g amma(μ = 22, k = 22) [32,33]
23Table S2. Age-specific hospitalisation and fatality risk. Based on estimates from the early
COVID-19 outbreak in China [4].
Age Cases Deaths Pop. (%; Naïve Adjusted Hospitalised
group (China) (China) China) CFR CFR
0–9 416 0 12.0% 0.0% 0.00% 0.0%
1–10 549 1 11.6% 0.2% 0.09% 0.8%
20-29 3619 7 13.5% 0.2% 0.10% 0.8%
30-39 7600 18 15.6% 0.2% 0.12% 1.0%
40-49 8571 38 15.6% 0.4% 0.23% 1.9%
50-59 10008 130 15.0% 1.3% 0.68% 5.4%
60-69 8583 309 10.4% 3.6% 1.87% 15.1%
70-79 3918 312 4.7% 8.0% 4.14% 33.3%
80-89 1408 208 1.8% 14.8% 7.68% 61.8%
Table S3. Projected impact of control measures in the United Kingdom depending upon local
versus national triggering and according to shift from centring on predicted peak. Median and
95% prediction interval reported. Totals are calculated up to December 31, 2021.
Base Local National Local National Local National Local National
trigger trigger trigger, +2 trigger, +2 trigger, +4 trigger, +4 trigger, +8 trigger, +8
weeks weeks weeks weeks weeks weeks
Total cases 24 M 18 M (11 18 M (11 17 M (10 17 M (11 15 M (9.4 15 M (9.3 16 M (8.2 16 M (8.6
(16 M–24 M) M–24 M) M–22 M) M–22 M) M–20 M) M–20 M) M–24 M) M–24 M)
M–30
M)
Total deaths 370 k 280 k 280 k (150 250 k (150 260 k (150 210 k (130 210 k (130 230 k (110 220 k (120
(250 (160 k–390 k) k–330 k) k–330 k) k–290 k) k–280 k) k–390 k) k–380 k)
k–470 k–370 k)
k)
Cases in 4.2 M 3.1 M 3.5 M (1.2 1.9 M (1 2.4 M (1.2 1.1 M (630 1.2 M (670 2.8 M (760 3.2 M (970
peak week (2.5 (1.1 M–5.3 M) M–2.7 M) M–3.6 M) k–3.1 M) k–2.7 M) k–7.1 M) k–7.1 M)
M–6.4 M–4.5 M)
M)
Deaths in 62 k (35 45 k (16 51 k (17 28 k (15 35 k (17 15 k (9 17 k (10 40 k (9.5 43 k (12
peak week k–98 k) k–66 k) k–82 k) k–40 k) k–50 k) k–41 k) k–36 k) k–99 k) k–100 k)
Peak ICU 220 k 170 k (57 190 k (61 100 k (53 130 k (59 54 k (32 59 k (37 140 k (34 160 k (44
beds (120 k–240 k) k–300 k) k–140 k) k–180 k) k–150 k) k–130 k) k–380 k) k–380 k)
required k–360
k)
Peak 420 k 310 k 350 k (120 190 k (100 240 k (110 100 k (61 110 k (70 270 k (64 300 k (84
non-ICU (230 (110 k–570 k) k–270 k) k–350 k) k–280 k) k–240 k) k–720 k) k–730 k)
beds k–670 k–450 k)
required k)
Time to 11 22 22 (16–36) 23 (12–37) 23 (12–37) 13 24 (10–38) 13 13 (9.2–18)
peak cases (8.2–16) (15–36) (9.2–38) (9.2–18)
(weeks)
24Table S4. Projected impact of control measures relating to leisure activities in the United
Kingdom. Median and 95% prediction interval reported. Totals are calculated up to September 1st,
2020.
Background Spectator sports banned Leisure reduced by 75%
Total cases 15 M (2.9 M–22 M) 15 M (2.8 M–22 M) 12 M (470 k–21 M)
Total deaths 170 k (18 k–310 k) 170 k (18 k–310 k) 140 k (3.3 k–300 k)
Cases in peak week 1.8 M (310 k–4.7 M) 1.8 M (310 k–4.7 M) 1.2 M (47 k–3.9 M)
Deaths in peak week 21 k (2.7 k–61 k) 21 k (2.6 k–60 k) 14 k (360–49 k)
Peak ICU beds required 76 k (11 k–220 k) 76 k (10 k–220 k) 51 k (1.5 k–180 k)
Peak non-ICU beds required 140 k (20 k–410 k) 140 k (19 k–410 k) 96 k (2.8 k–340 k)
Time to peak cases (weeks) 15 (9.2–30) 15 (9.2–30) 17 (10–30)
Table S5. Projected impact of school closures, depending upon additional contact between
children and the elderly, in the United Kingdom. Median and 95% prediction interval given. Totals
are calculated up to July 20th, 2020. “Care by elders” denotes the percentage of children under 15 for
which one additional daily contact with an individual 55 years older or more is added to simulations
during school closures.
statistic Background School closure School closure, School closure, School closure,
20% care by elders 50% care by elders 100% care by
elders
Total cases 11 M (400 k–21 M) 8.5 M (64 k–20 M) 8.7 M (66 k–21 M) 8.9 M (63 k–21 M) 9.3 M (75 k–21 M)
Total deaths 130 k (2 k–280 k) 71 k (550–270 k) 73 k (590–280 k) 78 k (530–290 k) 86 k (650–300 k)
Cases in peak 1.4 M (63 k–3.8 M) 780 k (3.5 k–3.1 M) 790 k (3.6 k–3.1 M) 820 k (3.4 k–3.2 M) 860 k (4.5 k–3.3 M)
week
Deaths in peak 16 k (320–48 k) 8.8 k (40–39 k) 9.1 k (49–40 k) 9.6 k (42–42 k) 11 k (54–44 k)
week
Peak ICU beds 56 k (1.7 k–170 k) 31 k (140–140 k) 32 k (140–140 k) 34 k (150–150 k) 38 k (180–160 k)
required
Peak non-ICU 110 k (3.4 k–320 k) 59 k (260–260 k) 61 k (250–270 k) 64 k (260–280 k) 71 k (330–300 k)
beds required
Time to peak 16 (9.2–24) 18 (8.5–23) 20 (8.5–23) 18 (8.5–23) 18 (8.5–23)
cases (weeks)
25You can also read