The AAGE Employer Survey 2019 - October 2018 - Australian Association of Graduate ...
←
→
Page content transcription
If your browser does not render page correctly, please read the page content below

The AAGE Employer
Survey 2019
          October 2018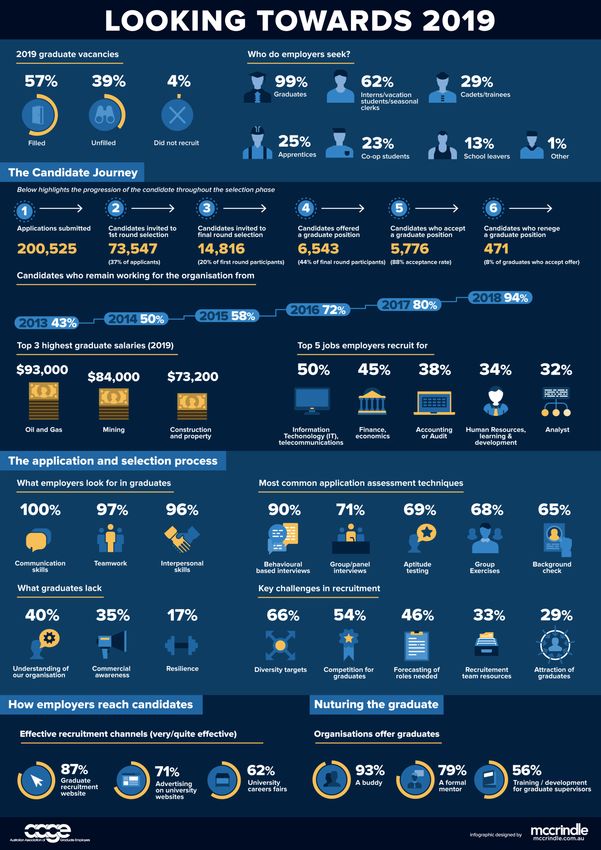
The AAGE Employer Survey 2019

Contents
Introduction                               6

Research objectives                        7

Research methodology                       7

Participating employers                    8

Employer industries                       10

Executive summary                         12

Recruitment strategy                      14

Employer snapshot                         16

Intern recruitment by industry            22

Graduate recruitment                      25

Graduate salaries and benefits            29

Marketing channels                        33

Marketing and selection spend             40

Assessment processes                      43

Employer expectations and challenges      49

Engaging graduates before they commence   51

Graduate Development Programs             52

Graduate retention                        58

2
The AAGE Employer Survey 2019

The 2019 AAGE Employer Survey is produced by:

Australian Association of Graduate Employers Ltd.

Camberwell PS, PO Box 1217, Camberwell, VIC 3124, Australia

T: +61 3 9352 5062

E: info@aage.com.au

W: www.aage.com.au

All information contained in this report is believed to be correct and unbiased, but the publisher does
not accept responsibility for any loss arising from decisions made upon this information.

© The Australian Association of Graduate Employers 2018. All rights reserved. No part of this
publication may be reproduced, stored in a retrieval system, or transmitted in any form or by any
means, electronic, mechanical, photocopying or otherwise, without the prior permission of the
publisher.

                                                                                                          3
The AAGE Employer Survey 2019 The AAGE Surveys The Australian Association of Graduate Employers (AAGE) conducts research into the behaviours and activities of the employers, candidates and employees involved in the annual graduate recruitment process. This research leads to four key surveys: The AAGE Employer Survey This is the definitive study of employers and their graduate recruitment activities. Launched in 2002, with data gathered through an online questionnaire, the survey is produced to provide readers with the very latest statistics and market information on a range of issues including: • Vacancy and salary levels for graduates starting the following year • Selection processes used by recruiters • Marketing activities and expenditure • Retention and development programs The AAGE Candidate Survey Launched in 2007, the survey is completed by undergraduates and graduates who have participated in the recruitment process and have received an offer to join an employer the following year. The resulting analysis provides valuable insight into a range of issues including: • Demographic profile of successful candidates • Sources of information used to research careers and employers • Key factors influencing candidates when choosing employers • Candidates’ opinions on the best employers in each industry The AAGE Graduate Survey Launched in 2009, with data collected via an anonymous online questionnaire, the survey is completed by full-time employees who are currently part of an employer’s graduate program. The information gathered provides invaluable feedback on graduates’ experiences including: • Induction and development programs • Expectations versus reality • Mentors, buddies and managers • Expected tenure and future plans The AAGE Intern Survey Launched in 2012 to survey students who have completed a paid or unpaid internship within an AAGE Member organisation. In this case, ‘interns’ are students who have taken part in a formal work experience program including vacation work, clerkship, internship, practicum, industry placement and work integrated learning. The survey provides feedback on: • Attitudes and opinions about experiences in the intern program • Intern salaries and job seeking habits • Views on employers 4
The AAGE Employer Survey 2019

How to Use the AAGE Surveys
The AAGE Surveys provide a wealth of information which can provide you with considerable insight
into the Australian graduate recruitment market. To assist in best utilising this data, we have provided a
number of suggestions about how you can use the survey reports.
Understand your market
The graduate recruitment landscape is constantly evolving. These reports provide you with the most
up-to-date market data and can assist you in better understanding your competitors and target
audience. The reports are important reading for all those involved in graduate recruitment and can be
particularly useful in introducing new team members to the market.
Setting Key Performance Indicators
The various statistics in the reports may give you some ideas for setting key performance indicators
(KPIs) for your own graduate recruitment program.
Some examples of commonly used KPIs include: cost per hire; applications per vacancy; marketing cost
per hire; acceptance rates; selection timelines; retention rates; employer of choice rating; graduate
engagement levels.
Benchmarking
Every report provides analysis that you can use to benchmark your organisation’s recruitment activities
against others in the market. By comparing your own organisation’s data or KPIs to those in the reports,
you can develop a more accurate picture of where your organisation stands in the graduate
recruitment market, within your industry or in the minds of your target audience.
Planning and Best Practice
Information provided in the survey reports can assist you with planning your activities in a range of
areas, including marketing campaigns, selection processes, induction and development programs. The
insights contained in the analysis may also help you to identify best practice across the graduate
recruitment market. The reports also incorporate feedback from employers, graduates and candidates
that can assist you in understanding key issues affecting the industry.
Engagement
A critical measure for any graduate program is the engagement of the candidates who participate. At
the recruitment stage you may want to measure the factors that influence candidates’ decisions to
apply to different employers. You may also want to understand the effectiveness of your own
promotional campaign. Once graduates have joined your organisation, you may want to measure their
commitment to a long-term career.
Internal Communication
A key component of a successful graduate recruitment campaign and development program is the
commitment of people at all levels in your organisation.
Support can be via finances, staffing or other resources and having robust data analysis is an important
step in garnering this support. These surveys can generate discussion with key stakeholders about
your graduate recruitment program – whether you feel the recruitment activities are positively or
negatively assessed by the survey analysis, this information could be used to drive continued support
for a successful program or to generate support for a changed or improved approach.

                                                                                                         5
The AAGE Employer Survey 2019 Introduction Welcome to the AAGE Employer Survey 2019, the definitive study of graduate employers and their graduate recruitment activities. The survey is the leading source of information about graduate salaries and vacancy levels in Australia and New Zealand. It provides up-to-the-minute insights into the latest graduate market conditions, along with benchmarking of recruitment practices. This report examines the vacancies and salaries on offer, as well as the marketing channels used by recruiters. It also explores the selection and assessment processes utilised by employers and the number of graduates retained by each organisation. History of the survey In 2002, the AAGE’s then Vice President, Katrina Harrington (née Moriarty), was conducting a research project for her Masters of Business, whilst working in a graduate recruitment role. Focusing her research on graduate recruitment and selection, Katrina conducted a survey of Australian graduate recruitment practices using the AAGE’s member network. The results provided valuable information to survey participants about trends and perceptions in graduate recruitment and selection. Katrina subsequently became the AAGE President 2003-2004 and the AAGE partnered with Pinpoint HRM (then Catch 22) to coordinate a broader survey based on her initial questionnaire. Will Spensley of Catch 22 was both delighted to be involved in the project and instrumental in bringing it to reality. The result was the inaugural AAGE Graduate Recruitment Survey 2003. The report proved to be so popular that the AAGE have continued to conduct an annual survey ever since, and for the 2019 edition, it has been run in partnership with McCrindle. 6
The AAGE Employer Survey 2019

Research objectives
The Australian Association of Graduate Employers (AAGE) commissioned McCrindle in July 2018 to
prepare the Employer Survey report. This research aims to understand employers’ selection processes,
marketing activities and expenditure on development programs.

Research methodology
McCrindle adapted the AAGE’s previous iteration of the Employer Survey and gathered responses
through an online survey between 5th September 2018 and 8th October 2018. The survey is distributed
by the AAGE to employers who complete the survey themselves. The results consist of 164 attempted
responses and 121 completed responses from 111 participating organisations. This report displays and
analyses completed responses only.

Terminology

Respondents are referred to as “employers”, “businesses” or “organisations” throughout the report.

Graphs and rounding

Data labels on the graphs in this report have been rounded and may, therefore, sum to 99% or 101%.
Any calculations where two data points have been added are based on raw data (not the rounded data
labels on the graph) which have then been rounded once combined.

Some graphs are displayed with one decimal place to highlight additional nuances in the data.

Excluded data

Industry breakdown tables do not include data from these industries: Education; Logistics and Supply
Chain Management; Utilities and Water. Each of these industries only has one participating employer
and therefore publication of these responses would reveal these employers' individual data. However,
the data provided by these organisations is included in the calculation of the overall averages.

Segmentation

Insights into organisation type, recruitment, business size, candidate type and employers are displayed
in breakout boxes such as these.

                                                                                                       7
The AAGE Employer Survey 2019
Participating employers
A total of 111 employers participated in this survey
Accenture Australia Carlton & United Breweries Department of Mines,
Industry Regulation and
The Adecco Group Caterpillar Safety (WA)
AECOM Australia Clean Energy Regulator Department of the Prime
Minister and Cabinet
Allens Coles
Department of Treasury
Allianz Australia Commonwealth Bank of
(WA)
Australia
AMP Services
Department of Transport
Commonwealth
and Main Roads (Qld)
ANZ Banking Group (Aust) Superannuation Corporation
(CSC) Department of Veterans'
APA Group
Affairs (DVA)
Deloitte
Ashurst
Dimension Data Australia
Department for Industry and
Attorney-General's
Skills (SA) eNett International
Department
Department of EY
Aurecon Australasia
Communications and the
Arts FDM Group
Australia Post
Department of Communities Fujitsu
Australian Bureau of
(Housing) (WA)
Statistics
Gallagher Bassett Services
Department of Finance
Australian Nuclear Science
GHD
and Technology
Department of Finance (WA)
Organisation (ANSTO) HKA
Department of Home Affairs
Australian Securities & Holcim Australia
Investments Commission Department of Industry,
Innovation and Science Honeywell
Australian Taxation Office
Department of Jobs and IAG
BAE Systems Australia
Small Business
icare NSW
Bankwest
Department of Justice and
Imperial Tobacco Australia
Regulation (VIC)
BDO
Incitec Pivot
Caltex
IRESS
8The AAGE Employer Survey 2019
Ixom Origin Energy Stockland
Johnson & Johnson Pitcher Partners Advisors Suncorp
KBR Public Transport Authority Swagelok Eastern Australia
and New Zealand
King & Wood Mallesons PwC
Tasmanian Networks
KordaMentha QBE Australia & New
Zealand Teach For Australia
Laing O'Rourke
Queensland Audit Office Technology One
Landgate
Queensland Government TEG
Leidos Chief Information Office
Toll
Lendlease Queensland Treasury
Transdev
Lockheed Martin Australia REA Group
Transport for NSW
L'Oreal Reece Group
VicRoads
Mars Australia Reserve Bank of Australia
Victorian Public Service
McConnell Dowell ResMed Graduate Recruitment and
Development Scheme (VPS
McGrathNicol Rio Tinto GRADS)
MinterEllison Lawyers RSM Australia Water Corporation
Monadelphous Group SA Power Networks Westpac Group
National Australia Bank Saab Australia White & Case
NEC Australia Santos Woodside Energy
NSW Public Service ShineWing Australia WorkSafe Victoria
Commission
South32
9The AAGE Employer Survey 2019
Employer industries
The graph below shows the industries of the participating employers.
Employer Industries
Australian Government 16%
State Government 13%
Banking, financial services or insurance 13%
IT hardware or software 11%
Accounting and professional services 9%
Fast Moving Consumer Goods 4.8%
Law 4.8%
Manufacturing and Industry 3.9%
Construction and Industry 2.9%
Consulting 2.9%
Engineering Consulting 2.9%
Roads and Transport 2.9%
Engineering 1.9%
Engineering Contractors 1.9%
Mining 1.9%
Oil and gas 1.9%
Retail 1.9%
Education 1.0%
Logistics / Supply Chain Management 1.0%
Utilities 1.0%
Water 1.0%
0% 2% 4% 6% 8% 10% 12% 14% 16% 18% 20%
All values in this graph are rounded to the nearest whole number percentage.
10The AAGE Employer Survey 2019
11The AAGE Employer Survey 2019
Executive summary
Employers in the 2019 Employer Survey are Communication, teamwork and
likely to be private sector organisations (63%) interpersonal skills are essential
with 1,000 employees or more in Australia
(75%). Businesses primarily seek graduates The top three most important (very/quite) skills
(99%) and interns (62%) who are citizens or to employers are amongst the skills which are
permanent residents of Australia or New least lacking in graduates.
Zealand. Assessment processes are likely to
conclude within four months from application to - Communication skills (100% important
offer (85%). At the time of this study, more than cf. 11% lacking in graduates)
half (57%) of employers have filled all their
- Teamwork (97% important cf. 5%
graduate vacancies for 2019 with more than
lacking in graduates)
three in four (76%) offering permanent/ongoing
employment. - Interpersonal skills (96% important cf.
5% lacking in graduates).
Employers are looking for future
leaders Conversely, the skills most lacking in graduates
also correspond to the skills most likely to be
Employers are likely to hire graduates for a considered unimportant or not assessed by
leadership development program, with almost employers in the recruitment phase. Two in five
half (46%) of employers stating this is their main employers (40%) think that candidates do not
reason for recruitment. A further one in four have an understanding of the organisation but
(27%) hire graduates for entry level work with 24% of employers do not see it as important or
the possibility of becoming future leaders and do not assess it altogether. This trend is also
managers. Employers feel the main challenges evident for graduates’ commercial awareness
arising from recruitment are diversity targets skills (35% cf. 52%).
(66%), competition for graduates (54%) and
accurate forecasting of graduate roles needed Employers’ most effective
(46%). promotional channels are online
The recruitment process is Employers are likely to visit up to nine
comprehensive and holistic universities (70%) during their recruitment
phase. Of the different channel types, graduate
Employers use a variety of activities to assess recruitment websites (87%) are the most
the candidate in both individual and group effective (very/quite) promotional channels for
settings, including behavioural based their 2019 recruitment.
interviews (90%), group interviews (71%),
aptitude testing (69%) and group exercises Candidates will experience holistic
(68%). Further to this, standardised background provision and care
checks (65%) and reference checks (60%) are
common recruitment activities. Recruitment The top benefits an employer’s organisation
elements that are likely to be outsourced offers its 2019 graduates include employee
include psychometric assessments (63%) and assistance programs (93%), flexible work
video interviews (46%). arrangements (87%) and laptop/iPad/netbook
(68%). Furthermore, graduates are allocated
“buddies” (93%) and a formal mentor (79%) to
assist in their roles’ social aspect. Nine in ten
(90%) employers also have a formal graduate
12The AAGE Employer Survey 2019
development program to aid them in compensation, while one in five employers
professional growth. (19%) spend $500 or less on this kind of
support.
Graduates’ technical and professional
training is succinct Employers are likely to keep in
contact following the graduate’s
Graduates are likely to receive up to ten days acceptance and commencement
worth of technical training (59%) and
professional training (57%) during their first year The most common way employers maintain
of employment. During this time, more than contact between a graduate accepting the job
half of participating organisations (54%) will offer to when they begin include invitations to
spend between $1,001 to $7,500 in total on social events (66%),
training for each graduate. Employers are less newsletters/communications from managers
likely to spend monetary resources on (56%) and introductions to buddies (48%). A
professional qualifications for graduates, with very small number of employers do not
three in ten (30%) not offering this kind of maintain contact in this time (4%).
13The AAGE Employer Survey 2019
Recruitment strategy
The most common reason employers hire graduates is to
recruit future managers and leaders.
When employers were asked to state their roles, leadership in future roles and to build a
main reason for recruiting graduates, the most modern and diverse workforce.
popular response was to hire future leaders
and managers (46%). This is followed by one in
Organisation type insights
four organisations (27%) which hire graduates
to do entry level work with the possibility of Public sector employers (34%) are more likely
becoming future managers and leaders. than private sector employers (23%) to recruit
Employers are least likely to hire graduates to graduates to do entry level work with the
fill in-demand roles (17%). possibility of becoming future managers and
leaders.
One in ten organisations (11%) specified “Other”
for their motivation for hiring graduates, with
responses primarily stating a mix of the
aforementioned leadership and in-demand
Which of the following describes the main reason for
recruiting graduates into your organisation?
Our graduates are hired to be part of a leadership
development program. The expectation is that all of
46%
these graduates will become future managers and
leaders.
Our graduates are hired to do entry-level work.
Some of these graduates may become future 27%
managers and leaders.
Our graduates are hired to fill roles that require in-
17%
demand or technical skills.
Our graduates are hired to fill ad hoc vacancies that
0%
occur from time to time within our organisation.
Other (please specify) 11%
0% 5% 10% 15% 20% 25% 30% 35% 40% 45% 50%
14The AAGE Employer Survey 2019
Half of employers recruit for IT/Telecommunications jobs.
Employers were asked to nominate the types of roles available for graduates in the 2019 intake. They
most commonly recruit roles for IT/Telecommunications (50%), Finance/Economics (45%) and
Accounting/Audit (38%) in 2019.
Which of the following job types are you recruiting for
your organisation for 2019?
Please select all that apply.
IT, telecommunications 50%
Finance, economics 45%
Accounting or audit 38%
Human resources,learning & development, psychology 34%
Analyst 32%
Engineering - Mechanical 31%
Engineering - Electrical/electronic 30%
Marketing 26%
Legal work 25%
Engineering - Software 21%
Engineering - Civil 21%
Policy development and/or implementation 19%
Engineering - Chemical 19%
Communications, PR, public affairs 19%
Consulting, advisory, risk management 17%
Government - State 14%
Environmental science 14%
Government - Australian 12%
General management 12%
Sales 11%
Research & development 11%
Actuarial work 11%
Service delivery for government 9%
Taxation 8%
Geology 8%
Purchasing / procurement 6%
Logistics / Transport 6%
Investment banking 6%
Insurance 6%
Engineering - Mining 6%
Property 5%
Health 5%
Banking (retail) 5%
Retail management 4%
Engineering - Manufacturing 4%
Education 3%
Agricultural work 3%
Social work 2%
Food tech / Food science 2%
Government - Local 0%
0% 20% 40% 60%
15The AAGE Employer Survey 2019
Employer snapshot
Most participating employers are likely to be private
sector businesses.
Three in five employers (63%) describe their Just 11% of participating organisations employ
business type as private whilst more than a more than 15,000 employees in Australia. The
third of employers are in the public sector AAGE Employer Survey 2019 was not
(37%). Contributing organisations are most completed by any organisations with 20
likely to employ 1001 to 2000 people (27%). employees or less.
Which of the following best describes your organisation
type?
Private Sector 63%
Public Sector 37%
Not for Profit 1%
0% 10% 20% 30% 40% 50% 60% 70%
In total, how many people are currently employed by
your organisation in Australia?
No staff in this country 0%
1 - 20 0%
21 - 100 3%
101 - 250 4%
251 - 500 11%
501 - 1,000 8%
1,001 - 2,000 27%
2,001 - 3,000 10%
3,001 - 5,000 12%
5,001 - 7,500 7%
7,501 - 10,000 5%
10,001 - 15,000 3%
15,001+ 11%
0% 5% 10% 15% 20% 25% 30%
16The AAGE Employer Survey 2019
Employers have a similar average number of recruitment
and development staff.
Employers were asked to estimate the number The average number of full time equivalent
of staff that were specifically focused on the (FTE) staff employed to conduct the recruitment
recruitment of entry level recruits and also the and development of entry level recruits are
number of staff that were focused on the similar. Employers indicate an overall average
development of entry level recruits. Employers of 2.40 FTE recruitment staff and 2.39 FTE
were asked to report these staffing numbers as development staff.
Full Time Equivalents (FTE) where a staff
member who works full time all year round Almost three in ten employers (29%) have
counts as 1.0, a full time staff member who experienced an increase in the number of
works for half the year counts as 0.5, a part these staff over the last year. More than half of
time staff member who works 2 days a week participating employers (56%), however, have
for the whole year counts as 0.4 etc. not experienced growth in the number of
graduate recruitment and development staff in
the last 12 months.
Number of FTE Staff Average (#)
Staff for the recruitment of entry level recruits in 2018 2.40
Staff for the development of entry level recruits in 2018 2.39
Has the number of FTE staff increased or decreased this
year (2018) compared to 2017?
An increase in graduate recruitment and
29%
development staff compared to 2017
The same number of graduate recruitment and
56%
development staff compared to 2017
A decrease in graduate recruitment and
12%
development staff compared to 2017
Unable to answer 4%
0% 10% 20% 30% 40% 50% 60%
17The AAGE Employer Survey 2019
Salary information for graduate recruitment and
development staff
Employers were asked to disclose salary One in three (33%) provide salary information
information for their graduate recruitment and for staff who focus solely on recruitment and
development staff. The tables highlight the the remaining 9% gave information for staff that
average salary based on the amounts only focus on development.
provided by employers. The figures below are
the base salary excluding superannuation. The salaries for managers who are recruitment
staff are generally higher than development
Nearly three in five participating employers staff. On the other hand, salaries for
(57%) provided salary information for staff who consultants/coordinators and administrators
are responsible for both recruitment and who are development staff are higher than
development. recruitment staff.
I am able to provide salary information for...
Roles in my team who are responsible for both
57%
recruitment and development of entry level recruits
Roles in my team who are only responsible for
33%
recruitment of entry level recruits
Roles in my team who are only responsible for
9%
development of entry level recruits
0% 10% 20% 30% 40% 50% 60% 70%
Average staff salaries (excluding superannuation)
$140,000
$120,986 $117,413
$120,000 $108,203 $106,826
$100,000 $87,061 $89,058
$80,665
$80,000 $67,141
$60,000
$40,000
$20,000
$-
Manager with Direct Manager without Direct Consultant / Co- Administrator
Reports Reports ordinator
Recruitment Staff Development staff
18The AAGE Employer Survey 2019
Employers are most likely to consider candidates who
are Australian or NZ citizens/permanent residents.
Employers are most likely to consider citizens and permanent residents and one in
candidates who are either Australian or New six only accept Australian citizens (16%). Only
Zealand citizens / permanent residents (46%). one in seven employers (13%) accept all
One in four (24%) accept only Australian graduates including international students.
With regards to the residency status of candidates, which
of the following best describes the approach used by
your organisation?
We consider candidates who have Australian or NZ
46%
citizenship or permanent residency
We consider candidates who have Australian
24%
citizenship or Australian permanent residency
We only consider candidates who have Australian
16%
citizenship
We consider all candidates, including international
13%
students
0% 5% 10% 15% 20% 25% 30% 35% 40% 45% 50%
19The AAGE Employer Survey 2019
Almost all employers seek graduates.
Almost every participating employer recruits for Comparatively, employers are less likely to
a graduate program (99%). This is followed by recruit candidates who are cadets/trainees
three in five (62%) who seek to recruit (29%), apprentices (25%), co-op students (23%)
interns/vacation students/seasonal clerks. and school leavers (13%).
Which of the following types of candidate does your
organisation hire?
Please select all that apply.
Graduates 99%
Interns/Vacation students/Seasonal Clerks (students
62%
who work for you during their university vacations)
Cadets/Trainees (i.e. school leavers who work for
29%
your organisation whilst they study at university)
Apprentices 25%
Co-op students (students who spend 6 to 12 months
23%
working for you as part of their university course)
School Leavers 13%
Other (please specify) 1%
Don't know 0%
0% 10% 20% 30% 40% 50% 60% 70% 80% 90% 100%
20The AAGE Employer Survey 2019
More than half of employers have filled their 2019
graduate positions.
At the time the survey was conducted, nearly Employers are likely to offer
three in five employers (57%) have filled their permanent/ongoing employment for graduates.
graduate vacancies for 2019, whilst two in five Three in four employers (76%) provide this type
(39%) have not. Just 4% of employers are not of employment while nearly one in five give
recruiting graduates for 2019. offers for fixed term employment (18%).
Has your organisation filled all its graduate vacancies for
2019?
Yes 57%
No 39%
We did not recruit graduates for 2019 4%
0% 10% 20% 30% 40% 50% 60%
What type of employment is offered to graduates joining
your organisation's graduate program?
Fixed term employment (e.g. 2 year fixed term
18%
contract) for all graduates
Permanent/Ongoing employment for all graduates 76%
Fixed term contract or permanent employment
3%
dependent on individual business unit's needs
Don't know 0%
Other (please specify) 4%
0% 10% 20% 30% 40% 50% 60% 70% 80%
21The AAGE Employer Survey 2019
Intern recruitment by industry
Graduate roles offered to interns.
The table below provides insights into the graduate positions offered by employers in a
number of graduate positions that were offered particular industry as well as the average
to interns at the end of their 2017/2018 number of interns that accept these graduate
internship. It highlights the average number of positions.
Average graduate Average graduate
positions offered to positions accepted by Offer acceptance rate
Industry
interns by each interns for each (%)
employer (#) employer (#)
Accounting &
145 121 83%
Professional Services
Australian
1 1 77%
Government
Banking, financial
15 14 93%
services or insurance
Construction and
13 12 98%
Property
Consulting 5 5 100%
Engineering 5 5 100%
Engineering
32 31 97%
Consulting
Engineering
20 15 74%
Contractors
Fast Moving
2 2 100%
Consumer Goods
IT hardware or
4 3 74%
software
Law 75 73 96%
Manufacturing and
2 2 100%
Industry
Mining 11 10 91%
Oil and Gas 35 33 94%
Retail 3 3 100%
Roads and Transport 15 10 65%
State Government 1 1 100%
Overall Average 22 19 87%
All values in this table are rounded to the nearest whole number. Please note that the “Offer acceptance rate” column is
calculated with the unrounded values, up to 2 decimal places.
22The AAGE Employer Survey 2019
Recruitment statistics for 2017/2018 intern/vacation
programs.
The table shows the average recruitment The Consulting and Fast Moving Consumer
statistics for each employer in a particular Goods industries are not included in this table
industry for intern/vacation programs that took due to having incomplete/no responses.
place between December 2017 and June 2018.
Average Average
Average
Vacation Vacation
Vacation Offer acceptance
Industry Scheme Scheme offers
Scheme offers rate (%)
applications per accepted per
per employer (#)
employer (#) employer (#)
Accounting &
Professional 4,268 224 197 88%
Services
Australian
128 2 2 100%
Government
Banking,
financial services 883 23 21 91%
or insurance
Engineering 10 1 1 100%
Engineering
2,618 62 58 93%
Consulting
Engineering
884 23 19 84%
Contractors
IT hardware or
169 5 4 77%
software
Law 1,429 164 120 73%
Manufacturing
267 10 10 100%
and Industry
Mining 1,500 67 67 100%
Oil and Gas 1,924 83 79 95%
Retail 3 3 3 100%
Roads and
342 26 24 92%
Transport
State
13 1 1 100%
Government
Overall Average 816 40 34 86%
All values in this table are rounded to the nearest whole number. Please note that the “Offer acceptance rate” column is
calculated with the unrounded values, up to 2 decimal places.
23The AAGE Employer Survey 2019
Recruitment statistics for 2018/2019 intern/vacation
programs.
The table shows the average recruitment The Consulting, Fast Moving Consumer Goods
statistics for each employer in a particular and Roads and Transport industries are not
industry for intern/vacation programs taking included in this table due to incomplete/no
place between December 2018 and June 2019. responses.
Average Average
Average
Vacation Vacation
Vacation Offer acceptance
Industry Scheme Scheme offers
Scheme offers rate (%)
applications per accepted per
per employer (#)
employer (#) employer (#)
Accounting &
Professional 4,201 248 215 87%
Services
Australian
70 2 2 97%
Government
Banking,
financial services 1,115 26 24 93%
or insurance
Engineering 25 2 2 100%
Engineering
3,000 73 63 86%
Consulting
Engineering
1,134 26 24 92%
Contractors
IT hardware or
20 1 1 80%
software
Law 1,674 178 100 56%
Manufacturing
260 8 8 100%
and Industry
Mining 1,990 74 74 100%
Oil and Gas 1,227 46 44 96%
State
25 0 0 -
Government
Overall Average 792 39 32 84%
All values in this table are rounded to the nearest whole number. Please note that the “Offer acceptance rate” column is
calculated with the unrounded values, up to 2 decimal places.
24The AAGE Employer Survey 2019
Graduate recruitment
Overall recruitment results for the 2019 graduate intake.
The table below shows the aggregated The percentages shown in the "Proportion of
recruitment statistics for all the employers that Candidates" column below provide an industry-
participated in the survey. For example, wide benchmark for the proportion of
employers collectively received a total of candidates that progress through each stage of
200,525 applications for their 2019 graduate the selection process.
program. Approximately 3% of the total
applications result in candidates being offered
a graduate position.
Proportion of
2019 Graduate Positions Total (#)
candidates
Applications submitted 200,525 -
Candidates invited to 1st round selection 73,547 37% of applicants
20% of first round
Candidates invited to final round selection 14,816
participants
44% of final round
Candidates offered a graduate position 6,543
participants
Candidates who accept a graduate position 5,776 88% acceptance rate
8% of graduates who
Candidates who renege a graduate position 471
accept offer
25The AAGE Employer Survey 2019
2019 graduate intake by industry.
The table below provides insight into the number of candidates that apply for each
average number of applications received per graduate position. For example, each employer
employer and positions filled per employer in the Accounting & Professional Services
sorted by their respective industry. industry has, on average, 26 applications for
each graduate job.
The final column (Average applications per
graduate position filled) highlights the average
Average graduates
Average applications Average applications
recruited for 2019
Industry received per employer per graduate position
intake per employer
(#) (#)
(#)
Accounting &
5,949 225 26
Professional Services
Australian
1,502 39 39
Government
Banking, financial
2,442 57 43
services or insurance
Construction and
1,566 41 38
Property
Consulting 2,300 137 17
Engineering 460 13 37
Engineering
4,387 139 32
Consulting
Engineering
805 31 26
Contractors
Fast Moving
1,972 11 173
Consumer Goods
IT hardware or
999 22 46
software
Law 251 54 5
Manufacturing and
903 24 38
Industry
Mining 2,673 44 61
Oil and Gas 1,955 61 32
Retail 2,590 74 35
Roads and Transport 835 16 54
State Government 1,198 32 38
Overall Average 1,940 59 33
All values in this table are rounded to the nearest whole number. Please note that the “Average applications per graduate
position” column is calculated with the unrounded values, up to 2 decimal places.
26The AAGE Employer Survey 2019
Median number of graduate positions.
The graph below depicts the median number of graduates hired by each employer from 2008 to 2019.
Median number of vacancies per employer (2008 to 2019)
30
25 24
23
22
21
21
20
20
18 18 18 18
16
15
13
10
5
0
2008 2009 2010 2011 2012 2013 2014 2015 2016 2017 2018 2019
27The AAGE Employer Survey 2019
Graduate position offers.
The table below shows the average number of graduate job offers per employer and accepted offers
per employer by their respective industry for the 2019 graduate intake.
Average candidates Average candidates
offered a graduate who accept a Average acceptance
Industry
position per employer graduate position per rate (%)
(#) employer (#)
Accounting &
273 214 78%
Professional Services
Australian
45 40 89%
Government
Banking, financial
57 50 88%
services or insurance
Construction and
57 49 86%
Property
Consulting 134 131 98%
Engineering 7 6 92%
Engineering
165 138 84%
Consulting
Engineering
31 19 61%
Contractors
Fast Moving
13 11 86%
Consumer Goods
IT hardware or
26 21 84%
software
Law 102 72 71%
Manufacturing and
3 3 100%
Industry
Mining 59 44 74%
Oil and Gas 65 60 92%
Retail 66 64 96%
Roads and Transport 17 16 91%
State Government 32 29 91%
Overall Average 67 56 84%
All values in this table are rounded to the nearest whole number. Please note that the “Average acceptance rate” column is
calculated with the unrounded values, up to 2 decimal places.
28The AAGE Employer Survey 2019
Graduate salaries and benefits
Employers are likely to review graduates’ salaries by the
conclusion of their first year.
Half of employers (50%) will review graduates’
salaries at the conclusion of their first year, Recruitment insights
whilst one in eleven (9%) will review their
graduate salaries halfway through the year. Graduates hired to do entry level work are
Employers are least likely to initiate a salary most likely to have their salaries reviewed at
review at the conclusion of the graduates’ the conclusion of their first year (73%).
second year (2%) or at the conclusion of each Graduates hired to be part of a leadership
rotation (7%), and none are reviewed quarterly program (64%) and graduates hired for in-
(0%). Almost one third (32%) of employers demand roles (53%) are comparatively lower.
indicated “Other”, where responses consist
primarily of “annually”, “yearly” and “18
months”.
How often are graduate salaries reviewed during the
graduate program?
Quarterly 0%
Half yearly 9%
At the conclusion of their first year 50%
At the conclusion of their second year 2%
At the conclusion of each rotation 7%
Other (please specify) 32%
0% 10% 20% 30% 40% 50% 60%
29The AAGE Employer Survey 2019
Graduates’ starting salaries and graduate numbers.
The table shows the average graduate starting The starting salaries shown in the table are
salaries and the average number of graduates base salaries and exclude superannuation and
for each employer in a particular industry for benefits. Responses which do not provide
the 2018 and 2019 graduate intakes. information for both 2018 and 2019 are not
included in the calculations.
Average Average starting Average Average starting
Industry graduates for salary for 2018 graduates for salary for 2019
2018 intake (#) graduate ($) 2019 intake (#) graduate ($)
Accounting &
Professional 212 $54,659 225 $55,551
Services
Australian
35 $62,069 41 $63,160
Government
Banking, financial
services or 55 $65,173 57 $66,265
insurance
Construction and
44 $71,600 41 $73,200
Property
Consulting 126 $58,333 137 $60,000
Engineering 5 $68,000 4 $68,000
Engineering
161 $62,333 161 $63,333
Consulting
Engineering
29 $67,000 31 $69,000
Contractors
Fast Moving
14 $60,500 8 $60,500
Consumer Goods
IT hardware or
23 $62,273 22 $64,091
software
Law 56 $73,500 73 $75,252
Manufacturing
18 $65,367 30 $65,367
and Industry
Mining 47 $84,000 44 $84,000
Oil and Gas 59 $91,000 61 $93,000
Retail 71 $66,000 74 $66,000
Roads and
21 $65,000 16 $66,000
Transport
State
34 $62,539 40 $63,548
Government
Overall Average 61 $64,455 66 $65,691
30The AAGE Employer Survey 2019
Average graduate salary has risen steadily since 2003.
The table below shows the progression of average graduate starting salaries over time, from 2003 to
2019. These figures are base salaries which exclude superannuation and benefits.
Average graduate starting salary (2003 to 2019)
$70,000
$65,691
$65,000 $64,455
$63,022
$60,714
$60,000
$58,000
$56,000 $56,150
$57,100
$55,000
$54,000
$51,750
$50,000 $51,350
$48,000
$45,700
$45,000
$43,000
$42,600
$41,600
$40,000
$39,800
$35,000
2003 2004 2005 2006 2007 2008 2009 2010 2011 2012 2013 2014 2015 2016 2017 2018 2019
31The AAGE Employer Survey 2019
Benefits revolve around assistance and flexibility.
Employers are likely to offer assistance overall wellbeing of the graduate. Two in three
programs such as counselling (93%) and (68%) will provide a laptop, iPad or netbook for
flexible work arrangements (87%) to aid the their graduates.
Which other benefits will your organisation provide for
new graduates starting in 2019?
Please select all that apply.
Employee assistance program 93%
Flexible work arrangements 87%
Laptop, iPad or netbook 68%
Specialised graduate program 57%
Payment of course fees for further education, etc 50%
Staff discounts 47%
Paid study leave 46%
Training for professional qualification 45%
Free or subsidised sports & leisure facilities 39%
Relocation package 33%
Private health care - subsidised / discounted 30%
Superannuation above SGC 26%
Salary packaging (e.g. 'pick and mix') 23%
Free or subsidised mobile phone 21%
Unpaid study leave 21%
Corporate credit card 18%
Share options/schemes 18%
Car parking 16%
Paid overtime 16%
Regional living allowance or bonus 13%
Non-monetary relocation package 9%
Free or subsidised public transport 8%
Company car scheme 6%
Shift allowance 4%
Global induction/overseas training 3%
Sign on bonus 3%
Private healthcare - fully paid 2%
Other (please specify) 7%
0% 10% 20% 30% 40% 50% 60% 70% 80% 90% 100%
32The AAGE Employer Survey 2019
Marketing channels
Most employers visit up to four universities in person as
part of their recruitment campaign.
Almost half of employers (46%) visit one to four Just one in ten participating employers (10%)
universities, while another 24% visit five to nine. will not visit any universities as part of their
One in five employers (20%) will visit ten or recruitment campaign.
more universities as part of their recruitment
campaign.
How many different universities does your organisation
physically visit as part of your recruitment campaign?
1 to 4 46%
5 to 9 24%
10 to 14 9%
15 to 19 4%
20 to 24 5%
25 or more 2%
None 10%
0% 5% 10% 15% 20% 25% 30% 35% 40% 45% 50%
33The AAGE Employer Survey 2019
Meeting potential graduates at careers fairs and
presentations is an effective approach for some
employers.
Employers were asked to identify specific
marketing channels that they utilised to recruit Recruitments insights
graduates.
More than two in three employers who recruit
University careers fairs and presentations on graduates to be part of a leadership program
campus score similarly (62% cf. 60% - very / (69%) or to fill in-demand roles (68%) feel
quite effective). university careers fairs are effective
However, employers are twice as likely to rate (very/quite).
presentations on campus as very effective (27%
cf. 13% university careers fairs). University careers fairs are less effective for
employers seeking graduates to do entry level
work, with only half of employers (50%)
indicating that it was effective (very/quite).
Has your organisation utilised any of the careers fairs and
presentation channels below to recruit graduates in 2018?
If so, what was the effectiveness of each channel?
University careers fairs 13% 49% 13% 24%
Presentations on campus 27% 32% 9% 31%
The Big Meet Careers Fairs 13% 35% 10% 42%
Industry specific fair (CPA, Engineers Australia,
9% 19% 7% 63%
Chartered Accountants, Law)
0% 10% 20% 30% 40% 50% 60% 70% 80% 90% 100%
Very effective Quite effective Quite ineffective Very ineffective Did not use
34The AAGE Employer Survey 2019
Graduate recruitment websites are very effective.
Employers were asked to identify specific more effective than emails/promotions (15%) or
marketing channels that they utilised to recruit advertising on commercial websites (15%).
graduates.
Almost nine in ten employers (87%) find their Organisation type insights
own graduate recruitment websites to be the
most effective (very / quite effective) channel Both public (88%) and private (86%)
for recruitment purposes. organisation employers feel graduate
recruitment websites are effective (very/quite
Employers rate their own websites as the most
effective). Public sector employers however,
effective marketing channel out of all of the
are more likely to indicate this channel is very
options included in the survey. Almost half of
effective (51% cf. 43% respectively)
employers (46%) see graduate recruitment
websites as very effective, which is three times
Has your organisation utilised any of the advertising
channels below to recruit graduates in 2018?
If so, what was the effectiveness of each channel?
Graduate recruitment website 46% 41% 11%
Advertising, banners or profiles on university
14% 57% 9% 19%
websites
Email mail outs & promotions from websites or
15% 55% 8% 21%
University Careers Services
Advertising, banners or profiles on commercial
15% 43% 10% 29%
websites (e.g: Seek, CareerOne, Indeed)
Graduate recruitment literature 6% 46% 10% 4% 34%
0% 10% 20% 30% 40% 50% 60% 70% 80% 90% 100%
Very effective Quite effective Quite ineffective Very ineffective Did not use
35The AAGE Employer Survey 2019
Job boards are an effective marketing channel for some
employers.
Employers were asked to identify specific
marketing channels that they utilised to recruit Business type insights
graduates.
Public sector companies are most likely to feel
Employers indicate GradConnection is the most GradConnection is very effective for graduate
effectively (very / quite) utilised job board. recruitment. Over half of public companies
Almost four in five employers (79%) who used (51%) state it is very effective whilst two in five
GradConnection felt it was effective in private companies (40%) feel the same way.
recruiting graduates. Just under half of
employers (48%) felt the GradAustralia job
board was effective (very/quite) for recruitment.
Has your organisation utilised any of the graduate specific
job boards below to recruit graduates in 2018?
If so, what was the effectiveness of each channel?
GradConnection 44% 35% 21%
GradAustralia 18% 30% 4% 46%
Graduate Opportunities 4% 4%4% 89%
Lode 96%
0% 10% 20% 30% 40% 50% 60% 70% 80% 90% 100%
Very effective Quite effective Quite ineffective Very ineffective Did not use
36The AAGE Employer Survey 2019
Employers only use specific social media channels for
recruitment.
Employers were asked to identify specific
marketing channels that they utilised to recruit Candidate type insights
graduates.
Different social media platforms reach different
Two in three employers (69%) find LinkedIn
types of graduates more effectively.
effective (very / quite) followed by Facebook
(46%). These two channels are at least twice as
Employers find LinkedIn is most effective
effective compared to other social media.
(very/quite) in reaching interns/vacation
Employers feel YouTube (21%) and Whirlpool workers (75%) and graduates (68.4%). It is less
(21%) are similar in terms of effectiveness. effective in recruiting apprentices (67.8%)
Channels such as Snapchat are rarely used
(96% - did not use) and Pinterest is not used at On the other hand, Facebook is the most
all. effective in apprentices (61%) compared to
interns/vacation workers (50%), graduates
(46%) and cadets (42%).
Has your organisation utilised any of the social media
channels below to recruit graduates in 2018?
If so, what was the effectiveness of each channel?
LinkedIn 12% 57% 13% 17%
Facebook 11% 35% 13% 41%
YouTube 5% 16% 3% 76%
Whirlpool 5% 16% 5% 74%
Instagram 13% 8% 78%
Twitter 11% 8% 4% 76%
Pinterest 100%
Snapchat 96%
0% 10% 20% 30% 40% 50% 60% 70% 80% 90% 100%
Very effective Quite effective Quite ineffective Very ineffective Did not use
37The AAGE Employer Survey 2019
Employers only use specific print media channels for
their graduate recruitment.
Employers were asked to identify specific Trade journals/professional magazines (93%)
marketing channels that they utilised to recruit and Graduate Opportunities (83%) are the least
graduates. used directory resources utilised for
recruitment.
Print media is a less widely utilised marketing
channel. At least half of employers indicate
they did not use any of the resources Recruitment insights
mentioned below for recruiting graduates.
Employers seeking to hire candidates to be
Two in five employers (42%) indicate the part of a leadership program think the
“GradAustralia Top 100 Graduate Employers” is GradAustralia Top 100 directory is the most
the most effective (very/quite) print media effective (very/quite). Over half (51%) of
channel, followed by “GradConnection/AFR employers state it was effective in recruiting
Top 100 Graduate Employers” where 39% of graduates compared to those hiring graduates
employers describe it as effective. for entry level work (33%) and filling in-demand
roles (37%).
Has your organisation utilised any of the careers
directories / magazines below to recruit graduates in
2018?
If so, what was the effectiveness of each channel?
GradAustralia Top 100 Graduate Employers 9% 33% 52%
GradConnection/AFR Top 100 Graduate Employers 12% 27% 5% 55%
Uni careers service guides, newsletters 21% 5% 69%
Graduate Opportunities 12% 83%
Trade journals or professional magazines 4% 93%
0% 10% 20% 30% 40% 50% 60% 70% 80% 90% 100%
Very effective Quite effective Quite ineffective Very ineffective Did not use
38The AAGE Employer Survey 2019
Sponsorship and promotion activities are used by some
employers.
Employers were asked to identify specific Over four in five employers do not utilise skills
marketing channels that they utilised to recruit training events/business games (86%) and
graduates. sponsorship of subject prizes (80%).
One in three employers (33%) find the
sponsorship of student societies effective Candidate recruitment insights
(very/quite effective), although two thirds (65%)
did not utilise this channel. Promotional Employers report that promotional
gifts/giveaways are effective for three in ten gifts/giveaways/freebies are most effective
employers (29%), although this strategy is also (very/quite) in recruiting apprentices (61%)
most likely to be ineffective (very / quite) for compared to cadets (42%) and interns (38%). It
employers (23%). is least effective for recruiting graduates (30%).
Has your organisation utilised any of the sponsorship and
other activities below to recruit graduates in 2018?
If so, what was the effectiveness of each channel?
Sponsorship of student societies 8% 25% 65%
Promotional gifts/giveaways/freebies 4% 25% 19% 4% 47%
Sponsorship of scholarships 5% 18% 4% 71%
Skills training events/business games 9% 3% 86%
Sponsorship of subject prizes 9% 8% 80%
0% 10% 20% 30% 40% 50% 60% 70% 80% 90% 100%
Very effective Quite effective Quite ineffective Very ineffective Did not use
39The AAGE Employer Survey 2019
Marketing and selection spend
Employers generally spend lower amounts on marketing
and higher amounts on selection.
Over half of employers (56%) spend between process (22%) is twice as high as the number of
$0 to $50,000 on marketing and attraction employers who spend this amount on
whilst almost two in five (38%) spend the same marketing and attraction (10%).
amount for their selection process.
For their 2019 graduate intake, employers
On the other hand, the number of employers spent in total, $8,166,908 on selection
who spend $300,000 or more on the selection processes and $4,770,373 on marketing.
What was your organisation's TOTAL spend on your 2019
intake of graduates?
$0 to $50,000 38%
56%
$50,001 to $100,000 10%
19%
$100,001 to $150,000 8%
8%
6%
$150,001 to $200,000
3%
3%
$200,001 to $250,000
0%
13%
$250,001 to $300,000
4%
$300,001 or more 22%
10%
0% 10% 20% 30% 40% 50% 60%
Selection Process Marketing & Attraction
Total spend on marketing and selection processes
$10,000,000
$8,166,908
$8,000,000
$6,000,000 $4,770,373
$4,000,000
$2,000,000
$0
Total spend on Selection Processes Total spend on Marketing & Attraction
40The AAGE Employer Survey 2019
Average marketing spend by industry.
The table below provides an in-depth look at marketing spend in each industry. The spend per
graduate is based on the average number of graduates recruited for 2019. The average cost per hire is
$3,066 ($1,035 in marketing spend and $2,031 in selection spend).
Average candidates
Average total Average marketing
recruited for 2019
Industry marketing spend per spend per graduate
intake per employer
employer ($) position ($)
(#)
Accounting &
$133,717 225 $595
Professional Services
Australian
$35,184 39 $910
Government
Banking, financial
$80,269 57 $1,408
services or insurance
Construction and
$29,600 41 $715
Property
Consulting $38,000 137 $277
Engineering $11,000 13 $880
Engineering
$80,000 139 $576
Consulting
Engineering
$31,147 31 $1,005
Contractors
Fast Moving
$25,900 11 $2,272
Consumer Goods
IT hardware or
$31,609 22 $1,443
software
Law $110,000 54 $2,037
Manufacturing and
$16,667 24 $709
Industry
Mining $20,000 44 $455
Oil and Gas $72,500 61 $1,198
Retail $57,750 74 $784
Roads and Transport $25,667 16 $1,656
State Government $21,561 32 $678
Overall Average $47,231 59 $1,035
All values in this table are rounded to the nearest whole number. Please note that the “Average marketing spend per graduate
position” column is calculated with the unrounded values, up to 2 decimal places.
41The AAGE Employer Survey 2019
Average selection spend by industry.
The table below provides an in-depth look at selection spend in each industry. The spend per graduate
is based on the average number of graduates recruited for 2019. The average cost per hire is $3,066
($1,035 in marketing spend and $2,031 in selection spend).
Average candidates
Average total Average selection
recruited for 2019
Industry selection spend per spend per graduate
intake per employer
employer ($) position ($)
(#)
Accounting &
$170,275 225 $758
Professional Services
Australian
$95,013 39 $2,458
Government
Banking, financial
$123,077 57 $2,159
services or insurance
Construction and
$38,700 41 $935
Property
Consulting $6,333 137 $46
Engineering $13,750 13 $1,100
Engineering
$27,500 139 $198
Consulting
Engineering
$20,405 31 $658
Contractors
Fast Moving
$85,000 11 $7,456
Consumer Goods
IT hardware or
$45,250 22 $2,065
software
Law $122,500 54 $2,269
Manufacturing and
$17,000 24 $723
Industry
Mining $8,000 44 $182
Oil and Gas $132,500 61 $2,190
Retail $5,000 74 $68
Roads and Transport $129,000 16 $8,323
State Government $93,599 32 $2,945
Overall Average $80,068 59 $2,031
All values in this table are rounded to the nearest whole number. Please note that the “Average selection spend per graduate
position” column is calculated with the unrounded values, up to 2 decimal places.
42The AAGE Employer Survey 2019
Assessment processes
The assessment process usually takes up to four months.
Employers are likely to have an application
process that takes between two and four
Recruitment insights
months (76%). The application process,
however, is more likely to be four months or Graduates who are recruited to fill a specific
longer (54%) than two months or less (46%). A role that require in demand or technical skills
small number of employers have assessment are three times as likely to complete their
processes longer than six months (5%). application process in up to a month (21%)
compared to those who are hired to be part of
After the final assessment phase, almost half of a leadership program (6%) or perform graduate
employers (46%) make offers within 24 hours to tasks (7%).
a week. The remaining half of graduates (54%),
take between two weeks to over a month to
make their offer.
How long is your assessment process from application to
offer?
Up to 2 weeks 1%
Up to a month 8%
Up to 2 months 37%
Up to 4 months 39%
Up to 6 months 10%
Longer than 6 months 5%
0% 5% 10% 15% 20% 25% 30% 35% 40% 45%
How long do recruits have to wait between the final stage
of their assessment process and receiving an offer?
Up to 24 hours 8%
Up to 3 days 24%
Up to a week 14%
Up to 2 weeks 25%
Up to a month 22%
More than a month 7%
0% 5% 10% 15% 20% 25% 30%
43The AAGE Employer Survey 2019
Employers formally measure some parts of their selection
process.
The top three measures employers track
include the number of applications received Organisation type insights
(96%), number of candidates that progress
Private sector employers are more likely than
through each stage of selection (81%) and
public sector employers to explore why their
acceptance rate (79%). A handful of employers
graduates decline their offer. They are
(3%) do not use any measurement.
comparatively more concerned with the
motivations behind the declined offer (61% cf.
40% public sector employers) and the
destination of the candidate who declined (39%
cf. 20 public sector employers).
Which of the following do you formally measure?
Number of applications received 96%
Number of candidates that progress through each
81%
stage of the selection process
Acceptance rate 79%
Applications received from each university 68%
Applications received from each marketing channel 59%
Reasons why your candidates decline 54%
Destination of candidates who decline your offer 32%
Cost per hire 31%
Return on Investment of each marketing channel
21%
used
Cost per application 15%
We don't do any measurement 3%
Other (please specify) 2%
0% 10% 20% 30% 40% 50% 60% 70% 80% 90% 100%
44You can also read