SANS Institute Information Security Reading Room
←
→
Page content transcription
If your browser does not render page correctly, please read the page content below

SANS Institute
Information Security Reading Room

The Show Must Go On! The 2017
SANS Incident Response Survey
______________________________
Matt Bromiley

Copyright SANS Institute 2020. Author Retains Full Rights.

This paper is from the SANS Institute Reading Room site. Reposting is not permitted without express
written permission.
The Show Must Go On!
The 2017 SANS Incident Response Survey

                  A SANS Survey
                Written by Matt Bromiley
                       June 2017

                       Sponsored by
         AlienVault, Anomali, Guidance Software,
          IBM Security, LogRhythm, and McAfee
                                                   ©2017 SANS™ Institute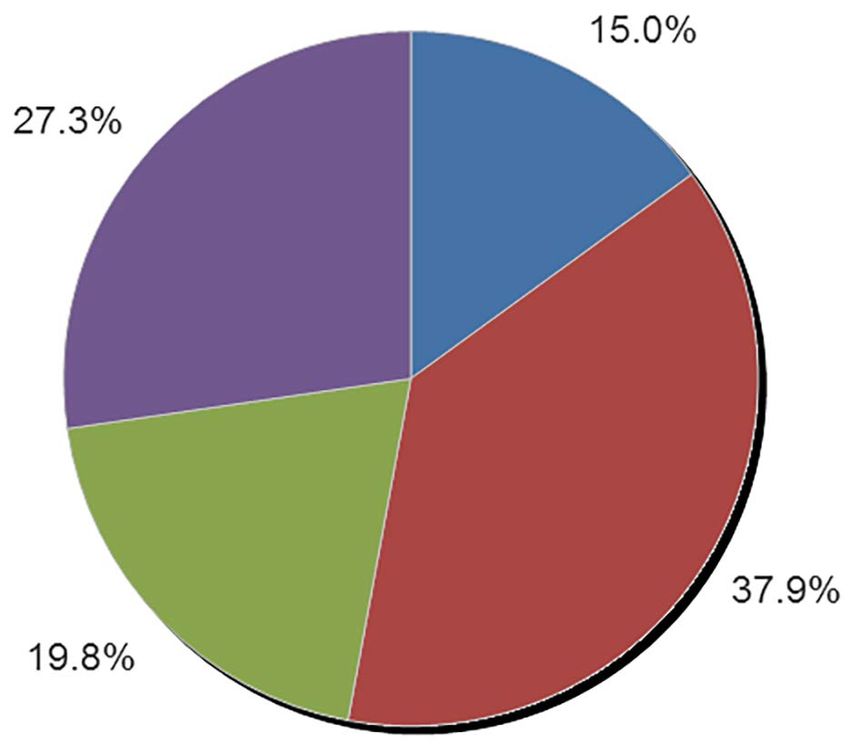
Executive Summary
                                        The year 2016 brought unprecedented events that impacted the cyber security industry,
                                        including a myriad of events that raised issues with multiple nation-state attackers, a
                                        tumultuous election and numerous government investigations. Additionally, seemingly
                                        continuous leaks and data dumps brought new concerns about malware, privacy and
                                        government overreach to the surface.
                                        Despite the onslaught of troubling news, our incident response (IR) teams had to
                                        continue defending their organizations—even as the attackers’ skill level increased with
                                        each new tool dump. The year 2016 could’ve easily been the year that IR teams threw up
                                        their hands in frustration, but instead they persevered. That’s why SANS has settled on
                                        the theme “The Show Must Go On” for our 2017 Incident Response Survey. Survey results
                                        show that not only did our teams continue to defend, but they also improved.
                                                            This year’s survey shows that IR teams are:
                  Key Results
                                                               • Detecting the attackers faster than before, with a drastic
                                                                  improvement in dwell time
  87%
            responded to at least one incident in the
            past year                                          • Containing incidents more rapidly
                                                               • Relying more on in-house detection and remediation mechanisms
                                                               • Receiving budget increases to help support their operations
  50%       reported a dwell time of less than 24 hours
                                                            Any one of these improvements is enough of a reason to celebrate;
                                                            together, they show a different story. Combined with continuous
                                                            consumption of threat intelligence and an appreciation for endpoint
  68%       reported malware as the root cause of the
            incidents they investigated
                                                            detection, IR may finally be seeing a pivotal industry shift. Our survey
                                                            results show that, overall, organizations are building IR teams that
                                                            suit their environments and their unique set of issues. Moreover, they
                                                            provide effective response times to help protect the organization.
  84%       of organizations now have at least one
            dedicated IR team member                        Teams are growing in size, and budget finally seems to be slipping as
                                                            the No. 1 hurdle to success. Again, the show must go on!
            of organizations are reporting their security    However, this year’s survey also shows that despite noticeable
  53   % operations centers (SOCs) as mature or
            maturing in their ability to respond
                                                             improvements, we still have room to improve. Malware still looms as
                                                             the root cause of a large majority of incidents. IR teams are still suffering
                                                             from a shortage of skilled staff, and respondents still face lack of
                                          ownership and business silo issues that can delay effective containment and remediation.
                                          As much as IR teams are improving, there is still plenty of leeway for better business
                                          integration. Finally, organizations need to assess their IR teams more often and with more
                                          vigor to help the teams improve from within.
                                        Overall, the results of 2017 Incident Response survey were very promising and show
                                        that things are getting better in the right places. In the following pages, we examine the
                                        results of the survey in detail and offer guidelines and feedback on how our industry can
                                        continue to improve. The show must go on—but it is far from over.

SANS ANALYST PROGRAM
                                                                      1                       The Show Must Go On! The 2017 SANS Incident Response Survey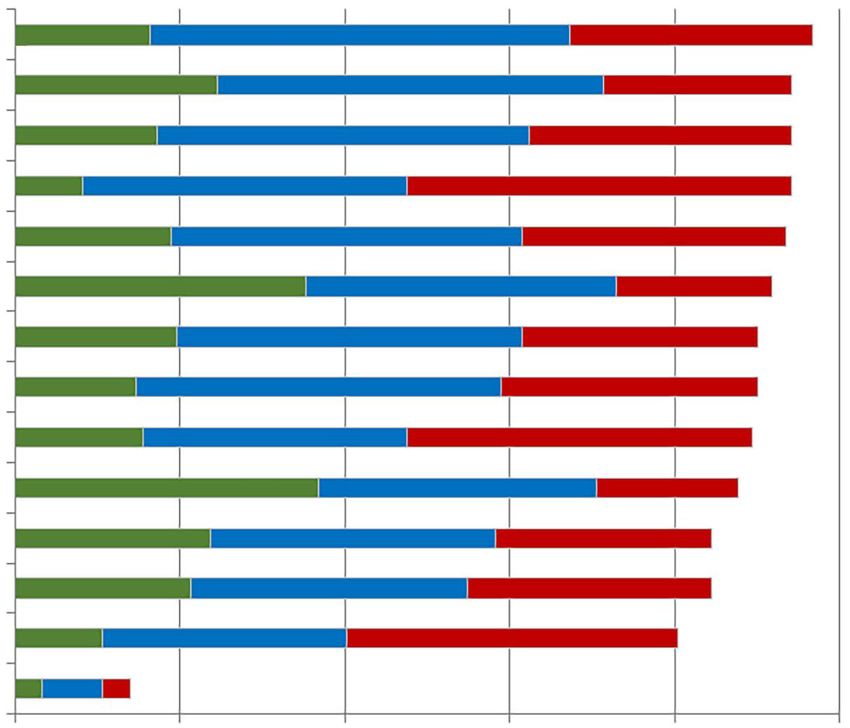
This Year’s Landscape
                       Respondents to the 2017 SANS Incident Response Survey included organizations from
                       diverse and global industries. Results showed healthy global growth, with double-digit
                       representation in each continent, which is important to help teams build global IR
                       support. Additionally, this year’s respondent base held a wide variety of roles, ranging
                       from C-suite positions to analyst roles.

                       Incident Response Around the World
                       This year’s survey respondent base showed a diverse range of organizations. Over 35% of
                       our respondents originated from a technology-based organization, specializing in either
                       cyber security, telecom or other technology services. Consistent with previous years, the
                       banking and finance industry had a strong representation in the top three industries.
                       Table 1 provides the top 10 industries represented in the survey results.

                                                 Table 1. Top 10 Industries Represented
                                                 Industry                     Percentage

                                                 Cyber security                17.3%
                                                 Banking and finance           13.7%
                                                 Technology                    12.3%
                                                 Government                     9.6%
                                                 Manufacturing                  6.3%
                                                 Telecommunications/ISP         5.8%
                                                 Education                      5.5%
                                                 Healthcare                     5.2%
                                                 Retail                         3.8%
                                                 Utilities                      3.0%

SANS ANALYST PROGRAM
                                                   2                      The Show Must Go On! The 2017 SANS Incident Response Survey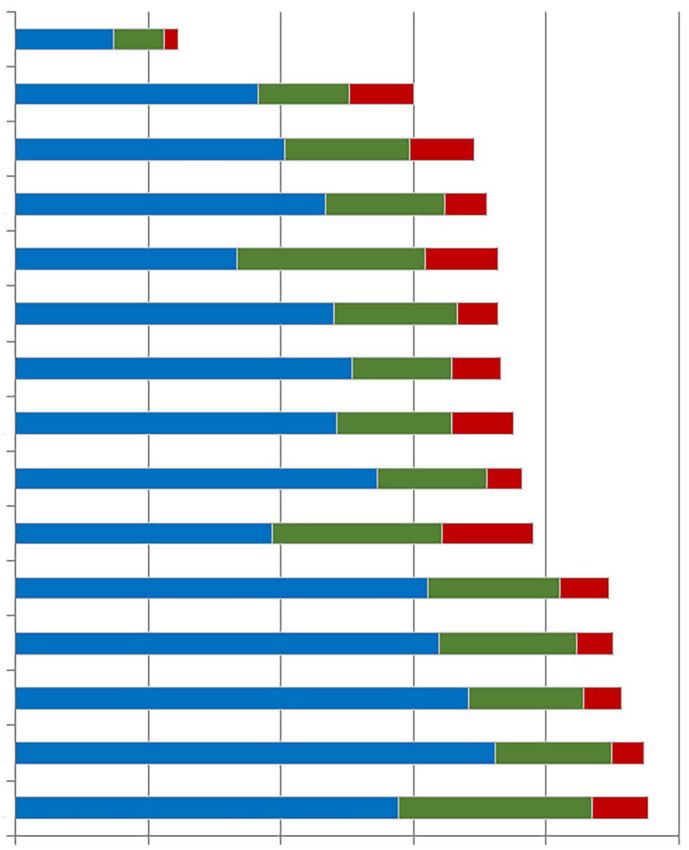
This Year’s Landscape                             (CONTINUED)

                                 The survey results also highlighted a shift in global presence from our respondents.
                                 Approximately 67% of our respondents indicated they had operations in the United
                                 States, down 3% from 2016.1 Organizations also showed an increase in operations in
                                 Europe and Asia, with single-digit reductions in South Pacific, Central/South America
                                 and the Middle East areas. While the survey does not inquire about the reason for the
                                 change in global operations, it is possible that organizations are aligning to favorable
                                 political conditions. Increased global presence may also be the result of recent
                                 mergers, acquisitions and consolidations. Figure 1 provides a snapshot of international
                                 operations in 2017.

TAKEAWAY                                   In what countries or regions does your organization perform incident response
                                                                     activities? Select all that apply.
The 2017 survey shows that
even with U.S.-based corporate
headquarters, incident                                       23%
                                                                                                                         30%
responders are continuing to                                                                       38%
grow in global operations and                                    67%
                                                                                                            15%
experience. This will lead to
                                                                                                  14%
diverse, skilled teams capable
of providing comprehensive IR                                                18%
                                                                                                                                        17%
services.

                                                                        Figure 1. International Operations in 2017

                                 The shift in international operations is also supported by a new question introduced
                                 in this year’s survey, asking respondents for their primary headquarters location. The
                                 addition of this question allows us to measure how much international exposure our
                                 respondents maintain, given the corporate office location. Most of our respondents
                                 (59%) are primarily headquartered in the United States, with Europe and Asia rounding
                                 out the top three, at 20% and 8%, respectively.

                                 1
                                     “ Incident Response Capabilities in 2016: The SANS 2016 Incident Response Survey,” June 2016,
                                      www.sans.org/reading-room/whitepapers/analyst/incident-response-capabilities-2016-2016-incident-response-survey-37047
SANS ANALYST PROGRAM
                                                                        3                               The Show Must Go On! The 2017 SANS Incident Response Survey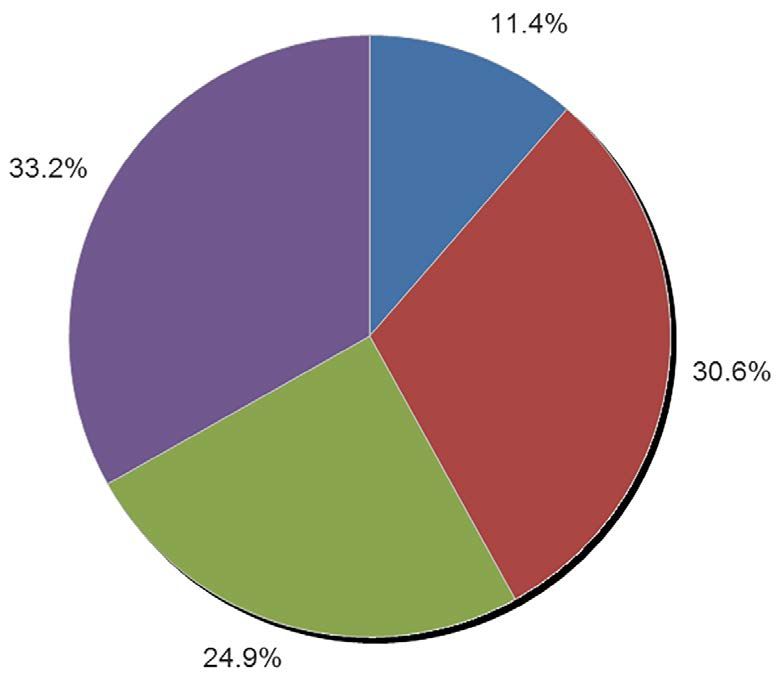
This Year’s Landscape                                            (CONTINUED)

                           Incident Response: Size Doesn’t Matter
                           This year’s survey also saw the modification of a question that allows us to better
                           represent the size of our respondent’s organizations. With the extra breakout of
                           organizational size, we can better discern whether IR is largely a problem for small,
                           medium or large organizations. Approximately 17% of our survey respondents had
                           more than 50,000 employees, with about half of that number having more than 100,000
                           employees. Conversely, 39% of our respondents represent organizations with fewer than
                           1,000 employees. Figure 2 provides a breakdown of responding organization sizes.

                                                                   How large is your organization’s workforce,
                                                                 including both employee and contractor staff?

                           25%

                           20%

Attackers are not picky,   15%

   and everyone is a       10%

        target.             5%

                            0%
                                    Fewer than 100

                                                     101–1,000

                                                                      1,001–2,000

                                                                                    2,001–5,000

                                                                                                       5,001–10,000

                                                                                                                            10,001–15,000

                                                                                                                                            15,001–50,000

                                                                                                                                                            50,001–100,000

                                                                                                                                                                             More than 100,000
                                                                     Figure 2. Respondents’ Organization Sizes

                           The strong representation of both small and midsize organizations solidifies the
                           message that all IR teams are hearing and feeling: Attackers are not picky, and everyone
                           is a target. Modern threats are no longer limited to massive organizations with
                           significant intellectual property or financial transactions. As commodity threats such
                           as ransomware continue to rise, organizations of all sizes are finding that IR teams, no
                           matter how small or large, are a critical part of the business.

SANS ANALYST PROGRAM
                                                                      4                                               The Show Must Go On! The 2017 SANS Incident Response Survey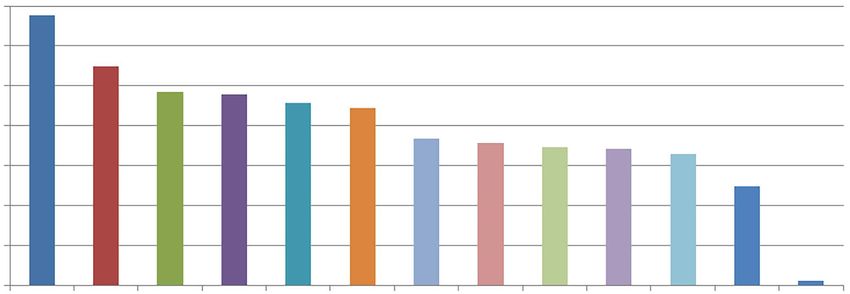
This Year’s Landscape                    (CONTINUED)

                                 Incident History
                                 For some organizations, increased international exposure is not always a benefit. For
                                 some IR teams, it may mean improved capabilities and an addition of skilled members
                                 to the team. In other cases, organizations are expanding, both horizontally and
                                 vertically, faster than the information security department can keep up. An increased
                                 operational burden can mean a decrease in incident reporting and response, without a
                                 complementary decrease in incident occurrence.
                                 In both 2016 and 2017, 87% of our respondents reported responding to at least one
                                 incident within the past 12 months. Of these groups, 21% in 2016 and 20% in 2017
                                 reported responding to at least 100 incidents. So, organizations are improving slightly.
TAKEAWAY                         However, it is concerning that approximately 9% of respondents were unsure whether
Organizations are reporting      any incidents had occurred. Figure 3 provides the breakdown of the number of incidents
an increase in the number of     survey respondents faced.
incidents detected, however
                                       Over the past 12 months, how many incidents has your organization responded to?
a decrease in the number of
incidents resulting in actual
                                 30%
data, system or device breach.
This is fantastic! This shows    20%
that not only are IR teams
reporting more incidents, but    10%

they are also able to detect
them early enough to prevent      0%
                                        Unknown      None    1           2–10       11–25       26–50         51–100       101–500      More than
a significant breach from              whether any                                                                                        500
                                        incidents
occurring.                              occurred

                                                                 Figure 3. Incidents Requiring Response

                                 Teams are still responding to many incidents. But that may demonstrate IR maturity, as
                                 teams are able to implement effective detection mechanisms and/or have the resources
                                 to respond to more incidents. These responses may also indicate better incident
                                 classification by the information security team. To effectively determine whether an
                                 organization is experiencing both an increase in incidents AND an increase in breaches,
                                 organizations need to have the metrics available to determine how many incidents
                                 subsequently led to breaches.

SANS ANALYST PROGRAM
                                                             5                              The Show Must Go On! The 2017 SANS Incident Response Survey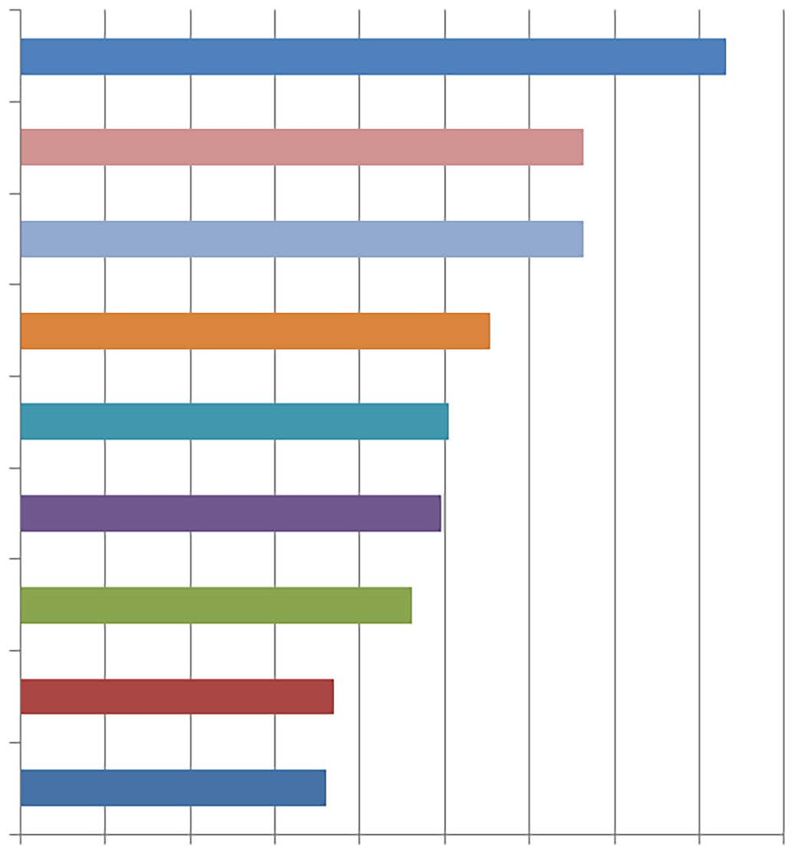
This Year’s Landscape                               (CONTINUED)

                       When compared against organization size, our survey results indicate that, as expected,
                       larger organizations respond to more incidents than smaller organizations. This can likely
                       be attributed to a larger exposure surface via more employees and business support
                       needs. However, our respondent distribution continues to show that organizations of
                       all sizes can suffer a varying number of incidents. Figure 4 provides a comparison of
                       organization size and the number of incidents they respond to.

                                               Number of Incidents Responded to by Organization Size

                               More than 100,000     50,001–100,000     15,001–50,000      10,001–15,000        5,001–10,000       2,001–5,000
                                                              1,001–2,000      101–1,000      Fewer than 100
                        10%

                         8%

                         6%

                         4%

                         2%

                         0%
                               Unknown        None          1          2–10        11–25        26–50          51–100     101–500      More than
                              whether any                                                                                                500
                               incidents
                               occurred

                                              Figure 4. Organization Size and Number of Incidents Responded to

                       Our 2017 survey respondents reported that 29% of incidents did not result in an actual
                       breach of information, systems or devices. Only 10% of respondents said that more
                       than 25 incidents resulted in an actual breach, down from 39% in last year’s survey!
                       Interestingly, organization size did not appear to have any significant impact. Figure 5
                       provides a breakdown of incident-to-breach conversions from our 2017 respondent base.

SANS ANALYST PROGRAM
                                                            6                              The Show Must Go On! The 2017 SANS Incident Response Survey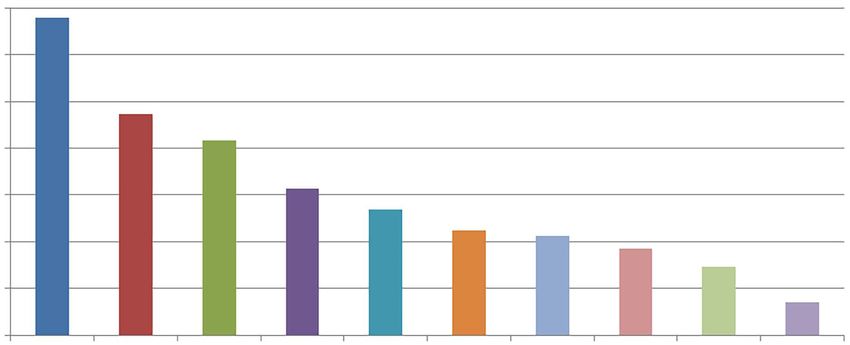
This Year’s Landscape                   (CONTINUED)

                                 How many of these incidents resulted in actual breaches of information,
                                                         systems or devices?

                                                                                 Unknown whether any incidents occurred
                                                                                 None
                                                                                 1
                                                                                 2–10
                                                                                 11–25
                                                                                 26–50
                                                                                 51–100
                                                                                 101–500
                                                                                 101–500

                                                       Figure 5. Incidents Versus Breaches

                       The information presented in Figures 3 and 5 is promising for multiple reasons. It
                       illustrates that IR teams are maturing, accepting the simple fact that attacks are a part of
                       life. They recognize that it is how well we detect and contain those attacks that’s most
                       important. With that new recognition, organizations are comfortable reporting a higher
                       number of incidents. This comfort level likely stems from the confidence that the IR team
                       can handle the higher number of incidents and prevent actual data breaches. However,
                       improved response statistics do not mean that teams can rest on their laurels.
                       Attackers often only need one incident to convert to a breach, and they can do so very
                       quickly. IR teams should interpret these results as confirming that their investments in
                       detecting incidents are paying off by preventing breaches and that their organizations
                       may be experiencing increased security. Additionally, such results can also help the
                       information security department evaluate whether investments in certain areas
                       are yielding a greater return on investment than others and assist in future budget
                       prioritization.

SANS ANALYST PROGRAM
                                                   7                           The Show Must Go On! The 2017 SANS Incident Response Survey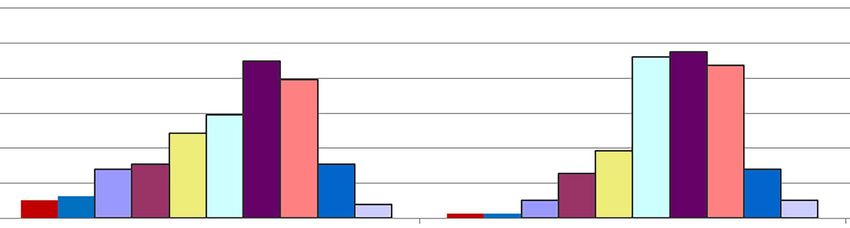
Are Things Getting Better?
                                   One question we are always trying to answer at SANS, especially given our extensive
                                   offering of classes and community events, is whether things are improving. Previous
                                   surveys have tackled this question by looking at how quickly organizations have responded
                                   to and remediated incidents. This question, while seemingly straightforward, mistakenly
                                   assumes that each time frame is singular. This year, the survey took a different route.

                                   Containing the Attacker
                                   In previous years, the IR survey has looked at two key time frames: time from
                                   compromise to detection (the “dwell time”) and the time from detection to remediation.
                                   These two questions did not consider the crucial middle step of containment, where an
                                   organization halts attacker activity.
                                   Containment is a crucial step in the IR process and is the goal that IR teams work
                                   toward before achieving remediation. In some cases, remediation and containment are
                                   performed in unison, but often they are separate goals. Our survey respondents liked
TAKEAWAY                           the new classification, and our results show that things are getting better.
Dwell times are shrinking,         This year, 50% of respondents reported a dwell time of fewer than 24 hours, a sizable
indicating that IR teams are       increase from last year’s results, in which 40% attained that measure! Additionally,
improving and responding           53% reported a detection to containment time of less than 24 hours in 2017. More
and/or classifying events faster   than ever, these are obvious signs that our IR teams and times are improving. Figure 6
than before.                       provides a breakdown of both dwell times (compromise to detection) and detection to
                                   containment times.

                                          On average, how much time elapsed between the initial compromise and detection
                                                   (i.e., the dwell time)? How long from detection to remediation?
                                                                      Please check both columns as they apply.

                                                    >1 year    7–12 months      4–6 months    1–3 months      8–30 days        2–7 days
                                                                   6–24 hours     1–5 hours
Are Things Getting Better? (CONTINUED)
Containing an attack as quickly as possible is important to prevent an attacker from
performing additional activities or re-entering the environment. In some cases,
organizations may catch an active attacker moving throughout the network and either
actively stealing data or looking for data to steal. In breaches where an attacker has
already compromised an environment, there may be little evidence of recent activity.
Inactivity does not diminish the importance of containment. Instead, it amplifies it.
Attackers may be waiting for an opportunity to re-enter the environment and may not
be exposing all their capabilities.
The critical step following containment is remediation. Whereas containment may utilize
known indicators and tactics, techniques, and procedures (TTPs) to block attacker activities,
remediation involves short-, medium- and long-term implementations. The goal of
remediation is to close known holes, upgrade vulnerable systems, permanently close entry
vectors, and/or wrap new security measures around business processes, to name a few.
Approximately 82% of this year’s survey base reported that remediation activities take
place within one month of containment, with 33% performing these activities within 24
hours. Figure 7 provides insight into this year’s remediation times.
On average, how much time elapsed between containment and remediation?
>1 year 7–12 months 4–6 months 1–3 months 8–30 days
2–7 days 6–24 hours 1–5 hoursEyes on the Prize
It is not surprising to any incident responder that attackers will utilize a multitude of
methods to compromise a network, if necessary. Each year we strive to see whether
attackers are changing their methods or discovering new ways to compromise
organizations. As our IR teams continue to mature, we expect to see attackers shift and
expose new tactics that will keep our teams on their toes.
Root Cause for Concern
This year’s survey indicated that although IR teams are seeing improvements, root causes
of incidents remain consistent. Malware infections were the root cause of incidents or
confirmed breaches for 68% of respondents. Similar to findings from last year’s survey,
this is likely due to the ever-growing popularity of attacks utilizing ransomware and
other commodity malware. While the survey did not call out ransomware directly, 7 of
the 11 respondents who selected “Other” listed ransomware as the root cause. Figure 8
provides a breakdown of the underlying nature of breaches, as experienced by our
respondent base.
What was the underlying nature of these breaches?
Select all that apply.
70%
60%
50%
40%
30%
20%
10%
0%
Malware infections
Unauthorized access
Data breach
Advanced persistent threat or
multistage attack
Insider breach
Unauthorized privilege
escalation
Destructive attack
(aimed at damaging systems)
Distributed denial of service
(DDoS) attack as the main attack
DDoS attack as a diversion
Other
Figure 8. Root Causes
SANS ANALYST PROGRAM
10 The Show Must Go On! The 2017 SANS Incident Response SurveyEyes on the Prize (CONTINUED)
Nearly 55% of the survey respondents indicated that damaging attacks, such as
destructive or Distributed Denial of Service (DDoS) attacks, were the root cause for
confirmed breaches. The leading presence of malware-based and destructive attacks
aligns with what incident responders are seeing in the current landscape, which
continues to see a proliferation of attackers looking for quick financial gain. Naturally, as
attackers find successful ways to make money, they will continue to repeat the methods
until the well has run dry.
However, not all attacks are seeking immediate financial gain. To dismiss attacks with
other goals would be inappropriate. In fact, our survey results illustrate that financial
data may not be the top goal of data breaches. Approximately 50% of this year’s
respondents reported that employee information was the data exfiltrated from or
otherwise compromised within the organization’s environment, reflecting the long-
term value of personal information, such as Social Security numbers, as opposed to
PCI or other financial data. Individual customer information and intellectual property
completed the top three types of data that attackers sought to steal, respectively.
Figure 9 provides a breakdown of data types compromised by attackers in 2017,
according to our respondent base.
What type of data was exfiltrated from the environment or otherwise compromised
in the breach? Select all that apply.
50%
40%
30%
20%
10%
0%
Employee information
Individual customer information
Intellectual property
(source code, manufacturing
plans, etc.)
Proprietary customer information
Other regulated data
(SOX, non-PHI personally
identifiable information, etc.)
PCI data
(payment card numbers,
CVV2 codes, track data)
PHI data
(health information)
Other
Legal data
Figure 9. Data Targeted
SANS ANALYST PROGRAM
11 The Show Must Go On! The 2017 SANS Incident Response SurveyEyes on the Prize (CONTINUED)
The importance of understanding the types of data attackers may be seeking helps
organizations determine where to prioritize their defensive spending. It should also
serve as a guide for incident responders to adjust alert severity. Teams may want to
consider adjusting the monitoring of systems that contain highly sought-after data
and/or critical business functions. Protecting sensitive data should not be prioritized
based on attacker preferences. Instead, organizations should consider the business
impact of data theft and scale accordingly.
SANS ANALYST PROGRAM
12 The Show Must Go On! The 2017 SANS Incident Response SurveyIR: It’s What’s Inside that Counts
In previous sections of this survey overview, we’ve analyzed key statistics that
organizations can use to measure whether they were effective at preventing incidents
from turning into breaches or responding to breaches as quickly as possible. While
these metrics are useful to gauge whether investments in IR are yielding fruit, those in
management positions must also analyze the maturity of their teams.
Growing Up or Growing In?
While previous sections have shown promising statistics that IR teams are improving, in
certain areas our respondents felt their organizations still had plenty of room to grow.
Approximately 53% of our respondents indicated that their SOC’s ability to respond
to events was mature or is maturing, compared with 52% in 2016. This assessment is a
somewhat surprisingly flat result, considering previous results had shown that teams
are improving compared to years past. Even more concerning, 39% of our respondents
indicated that their SOC was still immature.
However, measurement of a SOC’s response abilities is difficult to gauge within a single
year. When we compared the survey results against our 2015 and 2016 data, effectively
mapping three years’ worth of survey results, considerable improvement is obvious.
Respondents during this time frame clearly show noticeable uptrends in mature (2%)
and maturing (12%) SOCs, with a welcome 5% decrease in immaturity.
Figure 10 provides a breakdown of SOC maturity results from 2015 to 2017.
What is the maturity of your security operations center’s (SOC’s)
ability to respond to events?
2015 2016 2017
50%
40%
30%
20%
10%
0%
Unknown Immature Maturing Mature Other
Figure 10. SOC Maturity
SANS ANALYST PROGRAM
13 The Show Must Go On! The 2017 SANS Incident Response SurveyIR: It’s What’s Inside that Counts (CONTINUED)
Note that while this survey may show little change in SOC maturity, it is not necessarily
negative for IR. It may be a sign of additional responsibilities given to the SOC, and
survey respondents are aware that the organization is in an improvement process. As
we’ll see shortly, some statistics do lean toward increased in-house security reliance,
which may explain the increased level of responsibility.
An immature SOC assessment may also stem from newly formed or growing teams.
This year’s survey reported that approximately 84% of organizations had at least one
core dedicated IR team member, and 55% had one or more dedicated IR team members
during a surge response, compared to 76% and 55%, respectively, in last year’s results.
Once again, this is healthy growth that shows IR teams are expanding. Our respondents
reported the greatest upticks in teams with one to six total core members, indicating
that smaller organizations are adding IR members as the business allows, or smaller
TAKEAWAY
teams are finally receiving the support that they need. Table 2 provides a breakdown of
Confidence in SOC and IR
this year’s core IR team size.
teams may result in additional
capabilities. While a vote Table 2. Core IR Team Size
More
of confidence may increase Unknown None 1–2 3–5 6–10 11–20 than 20
morale and help justify Dedicated internal IR team 3.6% 11.7% 36.4% 25.9% 14.2% 4.5% 2.8%
spending for IR improvement, Drawn from other internal staff
(security group, operational/ 5.3% 14.6% 27.9% 21.9% 13.8% 5.7% 7.3%
be careful not to saddle administrative IT resources)
incident responders with duties Outsourced services (e.g., MSSP-
managed services security 13.4% 42.9% 18.6% 8.5% 4.9% 2.4% 4.0%
that are outside their scope of provider) with dedicated IR
services (alerts, response)
capabilities.
Other 5.3% 17.4% 2.0% 0.8% 0.0% 0.8% 0.0%
SANS ANALYST PROGRAM
14 The Show Must Go On! The 2017 SANS Incident Response SurveyIR: It’s What’s Inside that Counts (CONTINUED)
This year’s survey results show that not only are teams expanding, but so are the
mechanisms organizations are using to detect and remediate against alerts. Survey
results indicate that organizations are involving multiple types of systems in their
investigations and that these systems are moving mostly in-house. Corporate-owned
devices, such as laptops and smartphones, internal network devices and on-premises
corporate data services constitute the top three types of in-house systems utilized
during investigations. Top outsourced devices include typical contenders such as
corporate systems hosted in the cloud. Figure 11 provides insight into use of in-house
and outsourced systems by our respondent base.
What systems are involved in your investigations?
Check only those that apply. Please indicate whether your capabilities for these investigations exist in-house, are outsourced or both.
In-house Both Outsourced
Business applications (e.g., Web application, line of business systems) and
services (e.g., email, file sharing) in the cloud
Corporate-owned laptops, smartphones, tablets and other mobile devices
Internal network (on-premises) devices and systems
Corporate data center servers hosted locally (on-premises)
Business-related databases hosted locally
Business-related databases in the cloud
Corporate-owned social media accounts
Embedded, or non-PC devices, such as media and entertainment boxes,
printers, smart cars, connected control systems, etc.
Employee-owned computers, laptops, tablets and smartphones (BYOD)
Business-related social media accounts or platforms
Corporate data center servers hosted in the public cloud
(e.g., Azure or Amazon EC2)
Unapproved systems (shadow IT), applications or services hosted locally
Unapproved systems (shadow IT), applications or services hosted in the cloud
Employee social media accounts
Other
0% 20% 40% 60% 80% 100%
Figure 11. Systems Used in Investigations
SANS ANALYST PROGRAM
15 The Show Must Go On! The 2017 SANS Incident Response SurveyIR: It’s What’s Inside that Counts (CONTINUED)
While the numbers and types of systems involved in investigations are good signs of
organizations bringing capabilities in-house, our survey results indicate that there is still
plenty of room for detection capability integration. Integrated detection capabilities
lead to improved containment times that, in turn, improve the organization. This year’s
survey showed little change in detection integration, which may be stifling teams’ ability
to shorten response times even further. Respondents indicated that IDS/IPS/Firewalls,
secure web gateways, and security information and event management systems
(SIEMs) are highly integrated, while screen capture tools, sandboxing and perimeter SSL
decryption remain the largest unintegrated mechanisms. Table 3 provides a snapshot
into our respondent’s detection integration results.
Table 3. Integration of Detection Systems
Highly Partially Not
Capabilities Used to Identify Impacted Systems Integrated Integrated Integrated
IPS/IDS/Firewall/UTM alerts 51.2% 39.0% 6.3%
Log analysis 37.6% 46.3% 10.2%
Security information and event management (SIEM) correlation and analysis 41.0% 34.6% 12.7%
Secure web gateway (on-premises and/or cloud proxy) 42.4% 30.7% 14.6%
Network flow and anomaly detection tools 27.8% 44.9% 14.6%
Network packet capture or sniffer tools 25.4% 40.5% 21.5%
Network-based scanning agents for signatures and detected behavior 38.5% 33.7% 14.6%
Sandboxing 19.0% 34.1% 33.7%
User notification or complaints 29.3% 40.0% 17.6%
Host-based intrusion detection (HIDS) agent alerts 32.7% 37.1% 16.1%
Endpoint detection and response (EDR) capabilities 36.1% 34.1% 15.1%
Services availability monitoring 32.7% 33.2% 18.0%
Third-party notifications and intelligence 22.9% 40.0% 20.5%
SSL decryption at the network boundary 23.4% 28.3% 31.2%
User activity monitoring tools 24.9% 35.1% 22.9%
Endpoint controls (e.g., NAC or MDM) 27.8% 38.5% 16.1%
Network traffic archival and analysis tools 28.8% 35.1% 18.0%
Intelligence and analytics tools or services 24.4% 41.5% 15.6%
Homegrown tools for our specific environment 17.1% 36.6% 27.3%
Case-management systems 22.9% 32.2% 25.4%
Third-party tools specific for legal digital forensics 18.0% 30.2% 31.7%
File integrity monitoring (FIM) 16.6% 27.8% 34.1%
Behavioral monitoring (profiling) 13.2% 30.2% 34.1%
Visibility infrastructure to optimize connected security systems 19.0% 34.1% 24.4%
Browser and screen capture tools 15.6% 24.4% 37.1%
SANS ANALYST PROGRAM
16 The Show Must Go On! The 2017 SANS Incident Response SurveyIR: It’s What’s Inside that Counts (CONTINUED)
It is worth noting that while many organizations have dreams of unlimited security
capabilities, the selection of devices that get integrated may be determined by
regulatory factors. In this year’s survey, we sought to understand what regulatory forces
may underlie IR improvements. Approximately 64% of this year’s respondent base
reported that Payment Card Industry (PCI) regulations are driving their IR improvements,
followed by SOX at 43% and HIPAA at 34%, respectively. Figure 12 provides a breakdown
of industry regulations driving IR capabilities.
Specify the industry regulations driving your IR capabilities. Select all that apply.
60%
50%
40%
30%
20%
10%
0%
PCI
SOX
HIPAA/HITECH
FISMA
FDIC/GLBA
Other
NERC/CIP
Figure 12. Regulations Driving Incident Response
SANS ANALYST PROGRAM
17 The Show Must Go On! The 2017 SANS Incident Response SurveyIR: It’s What’s Inside that Counts (CONTINUED)
Incident Response + Threat Intelligence
Our survey respondents indicated that threat intelligence continues to be an important
element of IR. Approximately 73% of our respondents are using threat intelligence;
however, more than half of those respondents are using threat intelligence that
is included with previously purchased tools. Unfortunately, this leaves 27% of the
TAKEAWAY
respondent base not utilizing threat intelligence, which is consistent with last year’s
Confidence in SOC and IR
survey. Figure 13 provides a breakdown of threat intelligence consumption.
teams may result in additional
capabilities. While a vote Are you using threat intelligence (TI) feeds to speed detection and response?
Select the most appropriate.
of confidence may increase
morale and help justify
spending for IR improvement,
Yes, via a standalone commercial TI feed.
be careful not to saddle
incident responders with duties Y es, TI is included in one or more tools
that we purchased.
that are outside their scope of
Yes, we use an open source TI feed.
capabilities.
No, we’re not using TI.
Figure 13. Use of Threat Intelligence
SANS ANALYST PROGRAM
18 The Show Must Go On! The 2017 SANS Incident Response SurveyIR: It’s What’s Inside that Counts (CONTINUED)
The lack of threat intelligence in over a quarter of our survey respondent base is
a troubling trend that has remained consistent year-over-year. The use of threat
intelligence can be crucial to early detection and/or mitigation of attacker threats, and
it may assist in preventing incidents from converting into data breaches. For those
respondents that do utilize threat intelligence, 51% reported using both third-party and
internal discovery intelligence to help detect communications between systems and
malicious IP addresses. Rounding out the top three, respondents are also using threat
intelligence to detect malicious IP addresses and find host and network indicators of
compromise. Figure 14 provides a breakdown of threat intelligence utilization within our
respondent base.
What kind of threat intelligence are you using?
Please indicate what is being delivered through third parties, what is developed internally, or both. Select only those that apply.
Internal Discovery Both Provided by Third Party
Communications between systems and malicious IP addresses
IP addresses or nodes
Host and network indicators of compromise (IOCs)
Adversary or attacker attribution
Suspicious files, hostflow and executables
Endpoint data and logs
Heuristics and signatures from previous events
Domain data
Reputation data
Network history data
Unexecuted or undetonated malicious files
Updates to correlation rules that link events
Tor node IP addresses
Other
0% 20% 40% 60% 80% 100%
Figure 14. Types of Threat Intelligence in Use
SANS ANALYST PROGRAM
19 The Show Must Go On! The 2017 SANS Incident Response SurveyIR: It’s What’s Inside that Counts (CONTINUED)
Admittedly, stagnation in the use of threat intelligence is not beneficial for incident
responders. To look for useful information, our teams may look internally for data
available. Luckily, we are seeing improvements in this area. Approximately 83% of
respondents reported that active endpoint data is a crucial part of their investigations,
with 66% also utilizing alerts from security devices such as antivirus and IPS/IDS. Figure
15 provides a breakdown of data utilized by our respondents during their investigations.
TAKEAWAY What data do you prefer as evidence when investigating alarms?
When IR teams don’t have Select your top three preferences. Order is not important.
access to the external threat
Active endpoint data (workstation name, OS version, Active
data they want, they look User, installed software packages, registry settings)
internally to enrich the data Related alarms from IPS, antivirus, network detection
and SIEM
available to them. Although
Network activity data (net flow, URL)
this internal focus can help
the IR team understand IOC threat intelligence data
the environment better, it Short-term historical event data and logs (up to 7 days
old) from SIEM
increases operational demands.
Host, domain and URL reputation data
Effective use of relevant threat
Long-term historical event data and logs (older than 7
intelligence can only help days) from SIEM
make IR teams more powerful Vulnerability data
and efficient, and organizations
Threat campaign data
of all sizes should include it in
0% 20% 40% 60% 80%
their programs.
Figure 15. Overall Data Type Preferences
The data presented in Figure 15 is yet another sign of improvement across IR teams. The
teams should continue to look internally to mine, enrich and act upon the data they
do have available. Collecting data from internal systems and paying attention to alerts
generated by security applications in place will harden the IR team and increase its
operational knowledge of the organization’s environment.
SANS ANALYST PROGRAM
20 The Show Must Go On! The 2017 SANS Incident Response SurveyWhere We’re Going
In previous sections of this survey, we highlighted areas where IR teams are clearly
improving. Dwell times are dropping and IR teams are growing with more in-house
capabilities. Teams are learning to mine their own internal data, which when combined
with external threat intelligence, will help reduce detection, containment and
remediation times. This next section examines what our survey respondents have in
store for the future.
Experience, the Best Teacher
Undoubtedly, one of the best learning methods is experience. A key part of the IR
process is to examine lessons learned from incidents to pinpoint how the team can
increase its maturity. Unfortunately, only 58% of our survey respondents indicated
that they review and update IR processes at least periodically. A remaining 31% of
TAKEAWAY
respondents do not assess their program, and 11% do not have any plans to do so.
Assessing your organization’s IR
Figure 16 provides a breakdown of IR effectiveness and maturity assessments.
program is crucial to its future
success. Not only are teams Do you assess the effectiveness and maturity of your IR processes?
unable to mature if they don’t
know where their weaknesses e do not assess our IR processes and
W
are, but security assessments, have no plans to do so.
in general, help the e do not assess our IR processes, but we
W
are making plans to do so.
organization determine where
to focus next year’s spending e review and update our IR processes
W
formally after each major incident.
and IR process improvements.
e review and update our IR processes
W
periodically.
Figure 16. Assessment of IR Processes
For those organizations that do assess their IR processes, we saw a healthy mix between
the following assessment activities:
• Well-defined metrics
• Internal IR exercises
• Measuring improvements in accuracy, response time and reduction of attack surface
SANS ANALYST PROGRAM
21 The Show Must Go On! The 2017 SANS Incident Response SurveyWhere We’re Going (CONTINUED)
Most survey respondents indicated that they perform at least one of the above, but
multiple respondents indicated that they perform more than one! Multiple assessment
methods help the IR teams mature and are crucial to future development. Figure 17
provides a breakdown of assessment activities performed by incident response teams.
How do you assess the effectiveness and maturity of your IR processes?
We measure improvements in accuracy, response time
and reduction of attack surface.
We conduct incident response exercises
on a routine basis.
We use well-defined metrics to help us track,
evaluate and update our plan.
Other
0% 10% 20% 30% 40% 50%
Figure 17. Assessment Methods
Sprinting Harder with Hurdles
It’s safe to say that no organization wants to suffer a security incident and, if time and
money were of no concern, would happily staff elite IR teams. Alas, organizations must
make do with the resources they have available. That being said, each year we look
to examine hurdles currently facing IR teams to understand how shifts in spending or
priorities may be shaping team capabilities.
Lack of resources—including time, staff or budget, plus a staffing/skills shortage—
ranked as the most commonly cited impediments to effective IR. Vaguely-defined
processes and owners round out the top three impediments facing current IR teams.
Table 4 provides a listing of the top 10 impediments as reported by our respondent base.
SANS ANALYST PROGRAM
22 The Show Must Go On! The 2017 SANS Incident Response SurveyWhere We’re Going (CONTINUED)
Table 4. Top 10 Impediments Facing IR Teams
Rank Impediment % Response
1 Lack of resources (time, staff, budget) to effectively execute improvements 48.7%
2 Staffing and skills shortage 47.1%
3 Vaguely defined processes and owners 32.1%
4 Budgetary shortages for tools and technology 31.0%
5 Not enough visibility into events happening across different systems or domains 30.5%
6 Organizational silos between IR and other groups or between data sources or tasks 26.7%
7 Lack of procedural reviews and practice 23.0%
8 Too much time needed to detect and remediate 19.8%
9T Difficulties in detecting sophisticated attackers and removing their traces 18.2%
9T Integration issues with our other security and monitoring tools 18.2%
9T Lack of ability and resources to support deployment of multiple security systems 18.2%
Lack of comprehensive automated tools available to investigate new technologies,
9T 18.2%
such as BYOD, Internet of Things and use of cloud-based IT
10 Lack of controls over devices that leave the network perimeter 17.6%
While the data in Table 4 show teams still facing hurdles, there is good news! Between
2016 and 2017, budgetary shortages fell from 40% in 2016 to 31% in this year’s
survey, which may indicate that money is finally being freed up for our teams to use.
Having extra money available may mean that teams can finally hire additional staff or
purchase technologies to help shorten IR times, increase environment visibility and
enhance staff expertise.
SANS ANALYST PROGRAM
23 The Show Must Go On! The 2017 SANS Incident Response SurveyWhere We’re Going (CONTINUED)
Additional survey results indicate that teams should be focusing available money
on additional training and staff certifications, reported by a whopping 68% of our
respondent base as improvements that the organization will be making over the next 12
months. Other improvements planned by our survey respondents, as shown in Figure
18, include better definition of processes and owners, more automated reporting and
analysis, and security analytics.
What improvements in IR is your organization planning to make in the next 12 months?
Select all that apply.
Additional training and certification of staff
Better definition of processes and owners
More automated reporting and analysis through security information and event
management (SIEM) integration
Better security analytics and correlation across event types and impacted systems
Proactive threat hunting
Improved utilization of current enterprise security tools already in place
More integrated threat intelligence feeds to aid in early detection
Better response time
Improvements to incident response plan and procedures for handling insider incidents
Dedicated visibility and monitoring infrastructure to support security systems
Improved visibility into threats and associated vulnerabilities
as they apply to the environment
Full automation of detection, remediation and follow-up workflows
Other
0% 20% 40% 60%
Figure 18. Improvements Coming in the Next 12 Months
SANS ANALYST PROGRAM
24 The Show Must Go On! The 2017 SANS Incident Response SurveyWhere We’re Going (CONTINUED)
Without a doubt, organizational focus on increased staff training and better definition
of business process and owners strikes directly at the impediments reported previously
in Table 4. Coupled with an increase in security spending, teams may finally have the
means available to reach additional levels of improvement and maturation. Over a
third of respondents were unable to provide budgetary information. But 11% of our
TAKEAWAY
respondent base reported that IR budgets will likely see a 4–5% increase over the next
Survey respondents show 12 months, with approximately 10% reporting an increase of more than 10%! Figure 19
promising increases in IR provides a breakdown of planned IR budget increases over the next 12 months, but does
budgets over the next 12 not illustrate the unknown responses.
months. Organizations should
What percentage of your security budget is currently assigned to incident response,
ask their teams directly where
and what percentage is planned for the next 12 months?
the additional funding can best
More than 10% 5–10% 4–5% 2–3% 1–2% None
be applied. Our survey results
indicate that teams want more 12%
resources, additional training
8%
and better-defined processes.
4%
0%
Current Next 12 Months
Figure 19. Incident Response Budgets for the Current and Next Year
SANS ANALYST PROGRAM
25 The Show Must Go On! The 2017 SANS Incident Response SurveyConclusion
If the events of 2016 fostered such growth in IR, one might be tempted to wish for
equally or more dire events in 2017. However, that model is not sustainable! Instead,
a better outlook would be to hope that global security incidents of the past continue
to spur growth and maturity for our IR teams. This year’s survey clearly outlined where
teams are improving. For many, however, the improvements were too long in coming.
Surveys from years past show that many issues and impediments have remained in the
top 10 for too long.
This year’s survey theme was: “The Show Must Go On.” It’s a reflection of the fact that
regardless of what events take place in the world, how advanced our attackers become,
or what the next advances in data breaches may be, our IR teams will be ready. IR
teams will continue to expand globally, developing a wealth of expertise in the process.
Budgets will continue to improve, providing opportunities to hire additional staff and/or
train existing team members. But IR sits at a bittersweet juxtaposition: The more
success IR teams have, the less we will hear about them. So, while the show must go
on, let’s hope that the next acts are relatively uneventful, devoid of surprises and full of
opportunities for our teams to grow and mature.
SANS ANALYST PROGRAM
26 The Show Must Go On! The 2017 SANS Incident Response SurveyAbout the Author
Matt Bromiley is a SANS Digital Forensics and Incident Response instructor and a GIAC Advisory
Board member. He is also a senior managing consultant at a major incident response and forensic
analysis company, bringing together experience in digital forensics, incident response/triage and
log analytics. His skills include disk, database, memory and network forensics, as well as network
security monitoring. Matt has worked with clients of all types and sizes, from multinational
conglomerates to small, regional shops. He is passionate about learning, teaching and working on
open source tools.
Sponsors
SANS would like to thank this survey’s sponsors:
SANS ANALYST PROGRAM
27 The Show Must Go On! The 2017 SANS Incident Response SurveyLast Updated: October 23rd, 2020
Upcoming SANS Training
Click here to view a list of all SANS Courses
SANS Sydney 2020 Sydney, AU Nov 02, 2020 - Nov 14, 2020 Live Event
SANS Secure Thailand Bangkok, TH Nov 09, 2020 - Nov 14, 2020 Live Event
APAC ICS Summit & Training 2020 Singapore, SG Nov 13, 2020 - Nov 28, 2020 Live Event
SANS Community CTF , Nov 19, 2020 - Nov 20, 2020 Self Paced
SANS Local: Oslo November 2020 Oslo, NO Nov 23, 2020 - Nov 28, 2020 Live Event
SANS OnDemand OnlineUS Anytime Self Paced
SANS SelfStudy Books & MP3s OnlyUS Anytime Self PacedYou can also read